Post-exercise skeletal muscle glycogen related to plasma cytokines and muscle IL-6 protein content, but not muscle cytokine mRNA expression
 David C. Nieman1*
 Kevin A. Zwetsloot1
 Mary Pat Meaney1
 Dominic D. Lomiwes2
 Suzanne M. Hurst2
  Roger D. Hurst2
- 1Appalachian State University, Kannapolis, NC, USA
- 2The New Zealand Institute for Plant and Food Research Ltd., Palmerston North, New Zealand
Objectives: The purpose of this study was to correlate post-exercise muscle glycogen levels with changes in plasma cytokine, and muscle mRNA cytokine expression and protein content.
Methods: Twenty-four male runners (age 36.5 ± 1.8 years, VO2max 60.0 ± 1.5 mL⋅kg−1 ⋅ min−1) ran twice (separated by 4 weeks) on treadmills to exhaustion at 70% VO2max (average time and distance of 2.24 ± 0.09 h and 24.9 ± 1.1 km). Muscle biopsies from the vastus lateralis and blood samples were collected before and after each run, with IL-6, IL-8, and MCP-1 measured in muscle (mRNA and protein) and plasma. Data from the two runs were averaged.
Results: Participants experienced a 35.3 ± 4.2% decrease (P < 0.001) in skeletal muscle glycogen content (67.5 ± 2.8 to 44.3 ± 3.7 mmol⋅kg−1 wet weight). Muscle mRNA expression for IL-6, IL-8, and MCP-1 increased 7.34 ± 0.90-, 13.9 ± 2.3-, and 4.10 ± 0.60-fold, respectively (all, P < 0.001). Skeletal muscle IL-6, IL-8, and MCP-1 protein content increased 35.8 ± 10.6, 80.6 ± 12.1, and 105 ± 17.9%, respectively (all, P ≤ 0.005). Plasma IL-6, IL-8, and MCP-1 increased 47.1 ± 10.0-, 2.6 ± 0.3-, and 1.6 ± 0.1-fold, respectively (all, P < 0.001). Post-exercise muscle glycogen concentrations were negatively correlated with run time to exhaustion (r = −0.70, P < 0.001), and changes in muscle IL-6 protein content (r = −0.44, P = 0.049), plasma IL-6 (r = −0.72, P < 0.001), IL-8 (r = −0.60, P = 0.002), and MCP-1 (r = −0.589, P = 0.002), but not with changes in muscle IL-8 and MCP-1 protein content, or muscle mRNA expression for IL-6, IL-8, and MCP-1.
Conclusion: Prolonged and intensive running increased muscle mRNA expression, muscle protein content, and plasma levels for IL-6, IL-8, and MCP-1, and post-run muscle glycogen levels were most strongly related to plasma cytokine levels.
Introduction
Cytokines are a broad category of small proteins that are important in cell signaling, act through receptors, and affect the behavior of other cells. Cytokines are released by a range of immune cells, endothelial cells, adipocytes, muscle cells, and other cells, and include chemokines, interferons, interleukins, lymphokines, and tumor necrosis factor (1–3). Considerable attention has focused on the potential for regular exercise to counteract a range of disease states by stimulating cytokine production and release (2, 3).
The six cytokines with the greatest fold increase in plasma during prolonged and intensive exercise include IL-6, IL-10, granulocyte colony stimulating factor (G-CSF), IL-8, interleukin-1 receptor antagonist (IL-1ra), and monocyte chemoattract protein-1 (MCP-1) (4–6). These cytokines exert anti-inflammatory and chemotactic influences, and are produced by multiple cell types both within and outside the immune system and skeletal muscle tissue (1, 3, 7). Post-exercise muscle biopsy samples contain muscle cells that can produce and release IL-6 and MCP-1, resident macrophages (IL-6, IL-10, IL-8, MCP-1, and G-CSF), and endothelial/epithelial cells (IL-8, MCP-1, IL-1ra, and G-CSF) (1, 4, 8–12). Blood monocytes and lymphocytes can contribute to elevated plasma cytokine levels following exercise by producing IL-10, IL-1ra, and IL-8 (4). The acute, large exercise-induced increases in IL-6 and other cytokines orchestrate anti-inflammatory influences, augment lipolysis, stimulate chemotaxis, improve insulin sensitivity, serve as signaling agents for training adaptations and tissue repair, and function in many other roles related to health (1–3, 8).
The primary signaling mechanisms for inducing cytokine gene expression and production during intensive exercise are still being investigated, with a focus on muscle damage and metabolic demands, including glycogen depletion and total exercise workload (1, 8, 9, 11, 13–20). Post-exercise cytokine gene expression and secretion can be modified by other forms of physiological stress (e.g., heat, mode of exercise, age) (19, 21–23) medications (e.g., ibuprofen) (5), and nutritional factors (carbohydrate availability, high vitamin E intake, free fatty acid availability, and polyphenol supplementation) (11, 16, 24, 25). Carbohydrate ingestion before and during intensive and prolonged exercise, especially in overnight fasted endurance athletes, decreases skeletal muscle mRNA expression for IL-6 and IL-8, and lowers post-exercise plasma levels for IL-6, IL-8, IL-1ra, and IL-10 (11).
In response to published reports that carbohydrate ingestion during prolonged exercise attenuated the plasma IL-6 response, Steensberg et al. (26) hypothesized that a link may exist between low muscle glycogen content and IL-6 production during exercise. Using a two-legged knee-extensor exercise design, IL-6 mRNA levels and IL-6 release were shown to be augmented in the ~40% glycogen-depleted leg compared with the control leg in seven men who exercised for 5 h. Keller et al. (27) showed that muscle IL-6 mRNA and transcriptional activity were enhanced when six male participants engaged in 3 h of two-legged knee-extensor exercise with low muscle glycogen levels. Chan et al. (13) reported that exercising (60 min cycling, ~70% VO2max) in a glycogen-depleted state increased muscle IL-6 and IL-8 mRNA expression, with slightly higher plasma IL-6 but not IL-8 levels. Other studies have not been able to show that variance in muscle glycogen depletion with exercise is related to muscle IL-6 or IL-8 mRNA expression (11, 14, 15). Helge et al. (15) showed that IL-6 release is markedly higher from the exercising arms than the legs during whole-body exercise, and is not related to muscle glycogen utilization. Thus, the role of glycogen availability in the contracting muscle as a primary signaling mechanism for cytokine mRNA expression and release into the circulation is unclear, and interpretation has been made more difficult through research designs utilizing small subject numbers and modest exercise workloads (14–17).
The purpose of this study was to relate post-exercise muscle glycogen levels with muscle mRNA IL-6, IL-8, and MCP-1 expression and protein content, and change in plasma cytokine levels in 24 male runners who ran twice on treadmills to exhaustion at ~70% VO2max. Muscle biopsies from the vastus lateralis and blood samples were collected before and after each run, and data from the two runs were averaged to strengthen data quality, reduce random measurement error, and provide better estimates of the “true” value for individual participants (28).
Materials and Methods
Participants
Subject recruitment was conducted via direct messaging to runners and running clubs in the Charlotte, NC, USA, metropolitan area. Participants included 24 male runners (ages 27–49 years) who regularly competed in long-distance road races and were capable of running at ~70% on treadmills to exhaustion. During the study, participants consented to train normally, maintain weight, and avoid the use of large-dose vitamin and mineral supplements (above 100% Daily Value), and all herbal supplements and medications (in particular, non-steroidal anti-inflammatory drugs) for the 4-week period separating the two lab sessions. Participants signed informed consent forms and study procedures were approved by the Institutional Review Board at Appalachian State University (ASU).
Baseline Testing
Two weeks prior to the first running trial in the ASU Human Performance Laboratory, participants were tested for VO2max during a graded, treadmill test with the Cosmed Fitmate metabolic system (Cosmed, Rome, Italy) (29). Body composition was measured with the Bod Pod body composition analyzer (Life Measurement, Concord, CA, USA). Demographic and training histories were acquired with questionnaires.
Running Trials
During the 3-day period prior to each running trial (separated by 4 weeks), participants followed a moderate-carbohydrate dietary regimen (~55% kcal as carbohydrates) by choosing foods from a list provided by the investigative team. A standardized meal consisting of Boost Plus (Néstle Nutrition, Slorham Park, NJ, USA) was ingested at 12:00 p.m., with energy intake adjusted to 5 kcal⋅kg−1 body weight. Boost Plus is a nutritionally complete, high-energy oral supplement with an energy density of 6.4 kJ⋅mL−1 (1.52 kcal⋅mL−1) and 15% of energy as protein, 35% as fat, and 50% as carbohydrate, and 24 vitamins and minerals. Participants reported to the lab at 2:15 p.m. and provided blood and muscle biopsy samples. At 3:00 p.m., participants ran on laboratory treadmills with the speed set at 70% of VO2max, and drank water ad libitum, without ingestion of any other beverages or food. Participants ran as long as possible until exhaustion, defined as the inability of the subject to continue running at 70% VO2max despite verbal urging from the laboratory staff. Metabolic measures from the Cosmed Fitmate metabolic system and the rating of perceived exertion (RPE) were taken at 15 min, and then every 60 min during the running bout to verify that the appropriate intensity was maintained. Blood and muscle samples were taken again immediately following exercise. These procedures were repeated 4 weeks later, with runners following the exact same schedule (including same time and day of the week), and running at the same treadmill speed to exhaustion.
Cytokine Analysis
Total plasma concentrations of three cytokines [monocyte chemoattractant protein-1 (MCP-1), IL-6, and IL-8] were determined using an electrochemiluminescence-based solid-phase sandwich immunoassay (Meso Scale Discovery, Gaithersburg, MD, USA). All samples and provided standards were analyzed in duplicate, and the intra-assay CV ranged from 1.7 to 7.5% and the inter-assay CV 2.4–9.6% for all cytokines measured. Pre- and post-exercise samples for the cytokines were analyzed on the same assay plate to decrease inter-kit assay variability.
Stress Hormone Analysis
Serum cortisol was measured with an electrochemiluminescence immunoassay (ECLIA), and plasma epinephrine with high-pressure liquid chromatography (HPLC) and electrochemical (EC) detection through a commercial lab (LabCorp, Burlington, NC, USA).
Muscle Biopsy Procedures and Glycogen Analysis
Pre- and post-exercise muscle biopsy samples were acquired from the vastus lateralis on the same leg ~2 cm apart using procedures previously described (30). During the second running trial, the same procedures were followed, but on the opposite leg. Local anesthesia (1% xylocaine, Hospira, Inc., Lake Forest, IL, USA) was injected subcutaneously. After a small incision, a muscle biopsy sample was obtained using the suction-modified percutaneous needle biopsy procedure (30). Muscle was trimmed of connective tissue and fat and immediately frozen in liquid nitrogen. Samples were stored at −80°C until subsequent analysis. A glycogen assay kit (Catalog #MAK016, Sigma-Aldrich, St. Louis, MO, USA) was used to determine the concentration of glycogen in vastus lateralis muscle homogenates. In this coupled enzyme assay, glucoamylase hydrolyzed glycogen to glucose, and then the glucose was oxidized to yield a product that reacted with a probe to generate a color detectable with a microplate reader (Synergy H1 Hybrid Reader, BioTek Instruments, Inc., Winooski, VT, USA) at 570 nm.
Muscle mRNA Measurements
Total RNA extraction of vastus lateralis biopsies was conducted using an RNeasy® Fibrous Tissue Mini Kit (Qiagen, Limburg, Netherlands) according to the manufacturer’s instructions. Frozen muscle biopsies were homogenized in RTL-β-mercaptoethanol Buffer with a Precellys homogenizer (Bertin Technologies, Montigny-le-Bretonneux, France). An aliquot of RNA from all samples were run on 1.5 denaturing agarose gels stained with ethidium bromide to confirm RNA integrity. Additionally, RNA quality was further verified spectrophotometrically using the A260/A280 ratio which was determined using a nanodrop. Reverse transcription of RNA into cDNA was conducted using a High Capacity cDNA Reverse Transcription Kit (Applied Biosystems, Foster City, CA, USA) as per manufacturer’s instructions. Reverse transcription was performed using a GeneAmp® PCR System 9700 (Applied Biosystems). cDNA was quantified using a nanodrop and aliquots were stored at −20°C until Real Time-Polymerase Chain Reaction (RT-PCR) analysis.
Quantitative RT-PCR analysis of messenger RNA (mRNA) was conducted under pre-optimized TaqMan Gene Expression Assays (Applied Biosystems) using gene specific FAM dye-labeled primers for IL-6 (Cat. No. 4453320), IL-8 (Cat. No. 4369514), MCP-1 (Cat. No. 4331182), and beta-2-microglobulin (B2M) (Cat. No. 4351370). Samples and reagents were loaded in a MicroAmP Fast-Optical 96 Well Reaction Plate and run in quadruplicate. Plates were analyzed on a 7500 Fast RT-PCR System (Applied Biosystems). Relative mRNA levels were determined using the ΔΔCt calculations with B2M serving as the housekeeping gene (31). Changes in cytokine expression post-exercise were normalized to pre-exercise levels.
Analysis of Skeletal Muscle Inflammatory Cytokine Protein Concentrations
Skeletal muscle biopsy samples were analyzed for the inflammatory cytokines IL-6, IL-8, and MCP-1 with a magnetic bead-based multiplex assay using the MAGPIX instrument and xPONENT® analysis software (Luminex, Austin, TX, USA). Briefly, ~30 mg of each skeletal muscle tissue biopsy sample was homogenized in lysis buffer (Millipore, Billerica, MA, USA; #43-040) with AEBSF protease inhibitor added (Millipore; #101500). Homogenates were cleared by centrifugation at 14,000 × g and the protein concentration of the supernatant was determined using a BCA protein assay kit (Pierce ThermoFisher, Rockford, IL, USA). Next, 30 μg of muscle protein was added to each well (in duplicate) and the concentration of each cytokine was measured using the MILLIPLEX® MAP assay kit (Millipore, #HCYTOMAG-60K) according to manufacturer’s specifications. The lower limit of detection and inter-assay% coefficient of variability (% CV) for this panel of analytes was: IL-6 = 0.17 pg⋅mL−1 (4.2% CV); IL-8 = 0.18 pg⋅mL−1 (5.9% CV); and MCP-1 = 0.30 pg⋅mL−1 (3.0% CV). The intra-assay% CVs were IL-6 = 13.6%, IL-8 = 8.9%, and MCP-1 = 3.7%.
Statistical Analysis
Data are expressed as mean ± SE. Dependent t-tests were used to test change (pre- to post-exercise), with the level of significance set at P < 0.01. The Pearson product-moment correlation coefficient was used as a measure of the linear correlation between two variables.
Results
Participants included 24 trained male runners (ages 22–55 years) who successfully adhered to all aspects of the study design (see subject characteristics in Table 1). Run distances to exhaustion and post-exercise muscle glycogen content for the two run trials were significantly correlated (r = 0.74, P < 0.001; r = 0.67, P < 0.001, respectively), as were between trial post-run plasma cytokines levels (r = 0.475, 0.545, and 0.584 for plasma IL-6, IL-8, and MCP-1, respectively, all, P < 0.05). Between trial correlations for muscle cytokine mRNA and protein levels were non-significant. Metabolic and performance data from the average of the two run-to-exhaustion trials are summarized in Table 2. The runners were able to maintain an average intensity of 69.2 ± 1.3% VO2max for 2.24 ± 0.09 h and 24.8 ± 1.1 km. The RPE was 17.8 ± 0.2 at the end of the running trials.
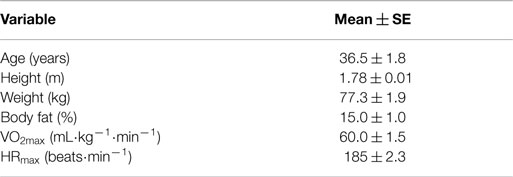
Table 1. Subject characteristics (N = 24).
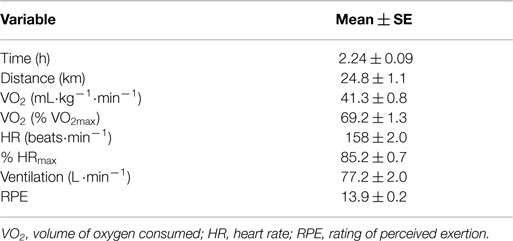
Table 2. Average metabolic and performance data for the two runs to exhaustion by trained runners.
Skeletal muscle glycogen sampled from the vastus lateralis decreased 35.3 ± 4.2% (23.3 ± 2.4 mmol⋅kg−1) (P < 0.001), with post-run values averaging 44.3 ± 3.7 mmol⋅kg−1 (range of 7.9–76.7 mmol⋅kg−1) (Figure 1).
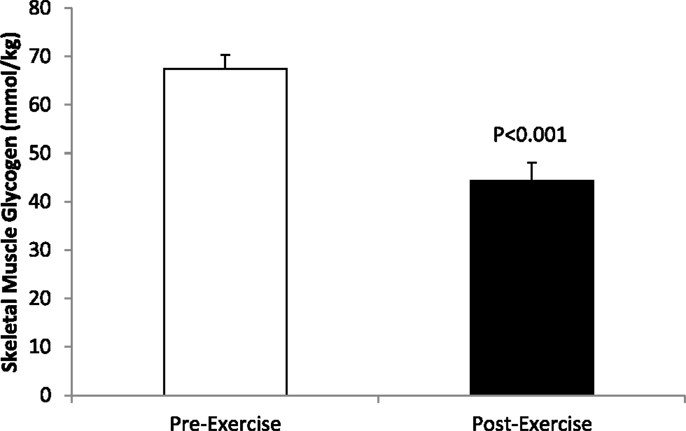
Figure 1. Pre-and post-exercise skeletal muscle glycogen levels in N = 24 runners.
Muscle mRNA expression for IL-6, IL-8, and MCP-1 increased 7.34 ± 0.90-, 13.9 ± 2.3-, and 4.10 ± 0.60-fold, respectively (all, P < 0.001) (Figure 2). Skeletal muscle cytokine protein content increased 35.8 ± 10.6% (P = 0.005) and 80.6 ± 12.1% (P < 0.001) for IL-6 and IL-8, respectively (Figure 3A), and 105 ± 17.9% (P < 0.001) for MCP-1 (Figure 3B).
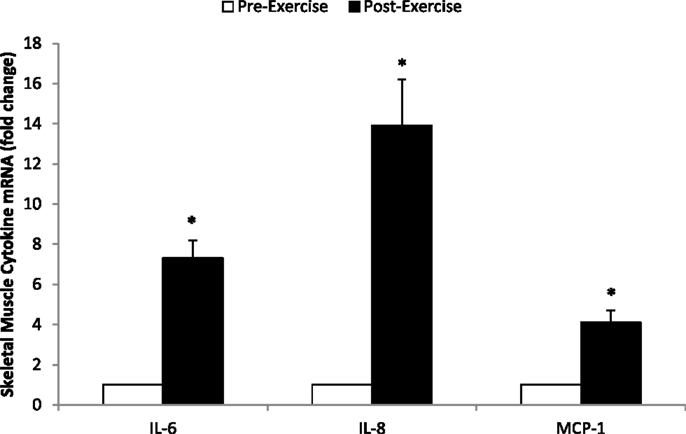
Figure 2. Fold change in skeletal muscle mRNA expression for IL-6, IL-8, and MCP-1 in N = 24 runners. *P < 0.001, change pre- to post-exercise.
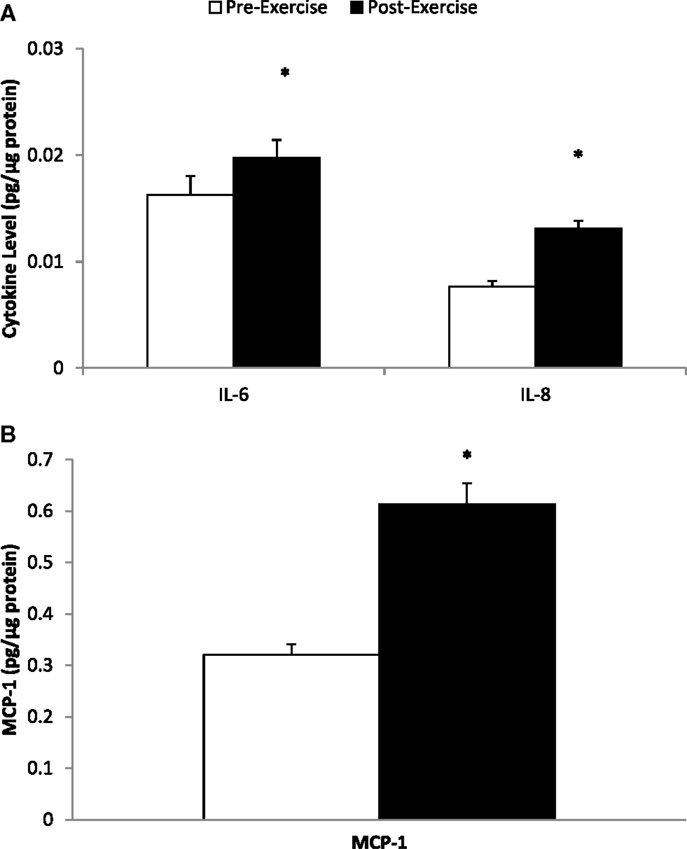
Figure 3. Skeletal muscle cytokine protein content for (A) IL-6 and IL-8, and (B) MCP-1. *P ≤ 0.005, change pre- to post-exercise.
Plasma cytokine and stress hormone data are summarized in Table 3. Plasma IL-6, IL-8, and MCP-1 increased 47.1 ± 10.0-, 2.6 ± 0.3-, and 1.6 ± 0.1-fold, respectively (all, P < 0.001). Serum cortisol and plasma epinephrine were elevated post-exercise 99.1 ± 14.42 and 147 ± 18.3%, respectively. No significant correlations were found between pre-to-post changes for each of the cytokines with changes in serum cortisol and plasma epinephrine (all, P > 0.05). Running distance to exhaustion was significantly correlated with change in plasma IL-6 (r = 0.503, P = 0.012), IL-8 (r = 0.665, P < 0.001), and MCP-1 (r = 0.735, P < 0.001).
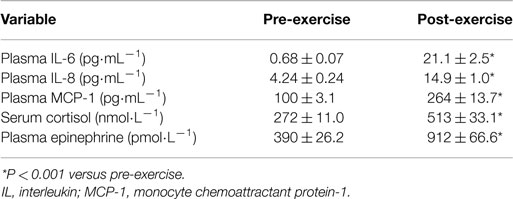
Table 3. Exercise effects on plasma cytokines and stress hormones.
Correlation statistics were calculated for pre-run, post-run, and absolute change in muscle glycogen with the outcome measures included in this study, and the strongest correlations (when significant) were found when using post-run glycogen values. Significant inverse correlations were measured between post-run glycogen levels and running time (r = −0.70, P < 0.001) and distance (r = −0.609, P = 0.002), but not with muscle mRNA expression for MCP-1 (r = −0.032, P = 0.882), IL-8 (r = −0.349, P = 0.095), or IL-6 (r = −0.211, P = 0.321). Post-run glycogen levels were negatively related to muscle IL-6 protein content (r = −0.55, P = 0.049), but not significantly to muscle IL-8 (r = −0.36, P = 0.120) or MCP-1 (r = −0.33, P = 0.160) protein content. Post-run glycogen levels were negatively related to change in plasma IL-6 (r = −0.718, P < 0.001), IL-8 (r = −0.604, P = 0.002), and MCP-1 (r = −0.589, P = 0.002) (Figure 4), but not to change in serum cortisol (r = 0.011, P = 0.959) or plasma epinephrine (r = 0.15, P = 0.478) (correlation figures not shown). Changes in muscle and plasma IL-6 levels were significantly related (r = 0.73, P < 0.001) (Figure 5), but not as strongly for muscle and plasma IL-8 (r = 0.40, P = 0.080) or MCP-1 (r = 0.413, P = 0.071) (correlation figures not shown). Changes in serum cortisol and plasma epinephrine were not significantly related to changes in muscle IL-6, IL-8, or MCP-1 mRNA or protein levels (all, P > 0.05) (correlation figures not shown).
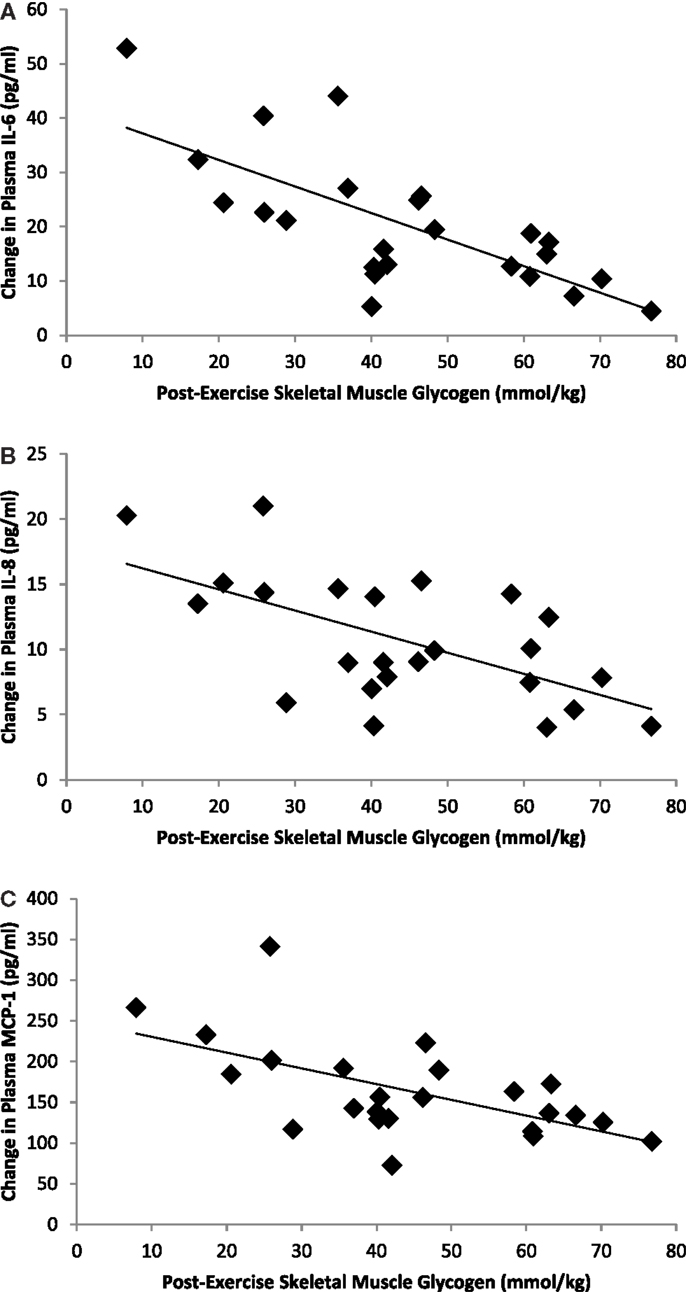
Figure 4. Correlations between post-exercise skeletal muscle glycogen content and change in plasma (A) IL-6 (r = −0.718, P < 0.001), (B) IL-8 (r = −0.604, P = 0.002), and (C) MCP-1 (r = −0.589, P = 0.002).
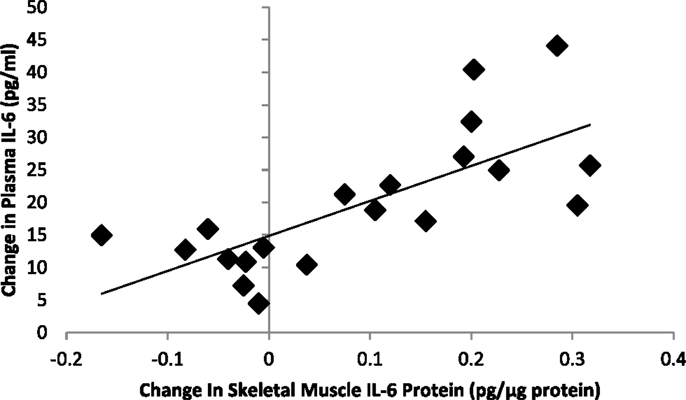
Figure 5. Correlation between exercise-induced changes in skeletal muscle and plasma IL-6 levels (r = 0.73, P < 0.001).
Discussion
As expected, these data from 24 male endurance athletes who ran twice on treadmills to exhaustion at ~70% VO2max showed increases in muscle IL-6, IL-8, and MCP-1 mRNA and protein content, and corresponding increases in plasma levels for these three cytokines. This study focused on the linkage between muscle glycogen availability and cytokine mRNA expression and production, and showed that post-run muscle glycogen content was negatively related to plasma but not muscle mRNA levels for IL-6, IL-8, and MCP-1. No significant correlations were found between exercise-induced changes in stress hormones and plasma or muscle cytokines (both mRNA and protein levels), similar to results previously reported by our research group (10, 11).
The correlation between low muscle glycogen content and enhanced muscle cytokine mRNA expression is not a consistent finding, and depends on the study design, with the strongest support demonstrated when participants initiate exercise with low muscle glycogen levels (13, 26, 27). When participants engage in prolonged, intensive exercise with normal pre-exercise glycogen levels, depletion in muscle glycogen stores varies widely between participants and typically cannot be linked to muscle IL-6 or IL-8 mRNA expression (10, 11, 14–16). Moreover, data from our laboratory indicate that even though cycling induces greater vastus lateralis muscle glycogen depletion in comparison to running, muscle cytokine mRNA expression is multiple times greater with running (10, 11). IL-6 release is markedly higher from the arm compared with the leg during whole-body exercise, and is not linked to muscle glycogen content (15). Additionally, carbohydrate compared to placebo ingestion during prolonged and intensive exercise increases blood glucose levels and decreases muscle mRNA expression and plasma levels for IL-6 and IL-8 despite similar muscle glycogen depletion rates (10, 11). In the current study, subjects drank water ad libitum during the mid-afternoon running trials (3-h post-prandial state), without ingestion of any other beverages or food. Thus carbohydrate ingestion would have been expected to attenuate post-exercise increases in plasma IL-6 and IL-8, perhaps weakening the linkage to decreases in muscle glycogen content. Although the data are not entirely consistent, regular exercise bouts in the fasted state without oral carbohydrate intake may enhance training adaptations (32, 33).
This is the first study to simultaneously measure muscle mRNA expression, muscle protein content, and plasma levels for three cytokines (IL-6, IL-8, and MCP-1) after exhaustive exercise. Interpretation of the data from this study was strengthened by combining results from two intense, long duration exercise sessions for 24 male runners (28), in contrast to other studies utilizing small subject numbers and modest exercise workloads (14–17). While others have shown increases in skeletal muscle MCP-1 mRNA following exercise (8), this study demonstrated that post-exercise increases in both muscle MCP-1 mRNA expression and protein content are unrelated to post-exercise muscle glycogen levels. Della Gatta et al. (8) showed that muscle mRNA expression and protein content for IL-6, IL-8, and MCP-1 were increased in biopsy samples obtained from eight untrained men 2 h following intensive leg resistance exercise. Plasma cytokine levels were not reported in this study, but data suggested that MCP-1 and IL-8 were expressed by cells in the interstitial space between muscle fibers, including macrophages, satellite cells, and other stromal cells (8). A limitation in the current study is that repeated muscle and blood samples were not collected during the first several hours post-exercise that may have revealed additional insights.
Taken together, under the normal context within which athletes train and compete, muscle glycogen depletion at best represents just one potential signal for cytokine mRNA expression within muscle tissue. Other signaling mechanisms may include free fatty acid availability, blood glucose levels, nitric oxide, and exercise-induced muscle damage and adaptation (8, 11, 16, 20). Nonetheless, our data support a significant, modest, negative relationship of post-exercise muscle glycogen and plasma cytokine levels (13), and this could be due in part to the release of IL-6, IL-8, and MCP-1 from extra-muscular sources, including adipose tissue (3, 16) and the brain (7). Additionally, our data support a significant, negative relationship between post-exercise muscle glycogen content and both muscle and plasma IL-6 protein levels, but not muscle IL-6 mRNA expression, suggesting that unmeasured factors within the secretome of the working skeletal muscle may differentially influence cytokine mRNA stability, transcription, production, degradation, modification, and release into the circulation (12, 13).
Conflict of Interest Statement
The authors declare that the research was conducted in the absence of any commercial or financial relationships that could be construed as a potential conflict of interest.
Funding
Reoxcyn Discoveries Group, Salt Lake City, UT, USA.
References
1. Peake J, Gatta PD, Nieman DC. Cytokine expression and secretion by skeletal muscle cells: regulatory mechanisms, biological significance and exercise effects. Exerc Immunol Rev (2015) 21:8–25.
2. Pedersen BK. Muscle as a secretory organ. Compr Physiol (2013) 3:1337–62. doi: 10.1002/cphy.c120033
3. Raschke S, Eckel J. Adipo-myokines: two sides of the same coin – mediators of inflammation and mediators of exercise. Mediators Inflamm (2013) 2013:320724. doi:10.1155/2013/320724
4. Nieman DC, Henson DA, Davis JM, Dumke CL, Gross SJ, Jenkins DP, et al. Quercetin ingestion does not alter cytokine changes in athletes competing in the western states endurance run. J Interferon Cytokine Res (2007) 27:1003–11. doi:10.1089/jir.2007.0050
5. Nieman DC, Henson DA, Dumke CL, Oley K, McAnulty SR, Davis JM, et al. Ibuprofen use, endotoxemia, inflammation, and plasma cytokines during ultramarathon competition. Brain Behav Immun (2006) 20:578–84. doi:10.1016/j.bbi.2006.02.001
6. Nieman DC, Shanely RA, Luo B, Meaney MP, Dew DA, Pappan KL. Metabolomics approach to assessing plasma 13- and 9-hydroxy-octadecadienoic acid and linoleic acid metabolite responses to 75-km cycling. Am J Physiol Regul Integr Comp Physiol (2014) 307:R68–74. doi:10.1152/ajpregu.00092.2014
7. Rasmussen P, Vedel JC, Olesen J, Adser H, Pedersen MV, Hart E, et al. In humans IL-6 is released from the brain during and after exercise and paralleled by enhanced IL-6 mRNA expression in the hippocampus of mice. Acta Physiol (Oxf) (2011) 201:475–82. doi:10.1111/j.1748-1716.2010.02223
8. Della Gatta PA, Cameron-Smith D, Peake JM. Acute resistance exercise increases the expression of chemotactic factors within skeletal muscle. Eur J Appl Physiol (2014) 114:2157–67. doi:10.1007/s00421-014-2936-4
9. Hiscock N, Chan MH, Bisucci T, Darby IA, Febbraio MA. Skeletal myocytes are a source of interleukin-6 mRNA expression and protein release during contraction: evidence of fiber type specificity. FASEB J (2004) 18: 992–4. doi:10.1096/fj.03-1259fje
10. Nieman DC, Davis JM, Henson DA, Gross SJ, Dumke CL, Utter AC, et al. Muscle cytokine mRNA changes after 2.5 h of cycling: influence of carbohydrate. Med Sci Sports Exerc (2005) 37:1283–90. doi:10.1249/01.mss.0000175054.99588.b1
11. Nieman DC, Davis JM, Henson DA, Walberg-Rankin J, Shute M, Dumke CL, et al. Carbohydrate ingestion influences skeletal muscle cytokine mRNA and plasma cytokine levels after a 3-h run. J Appl Physiol (1985) (2003) 94:1917–25. doi:10.1152/japplphysiol.01130.2002
12. Weigert C, Lehmann R, Hartwig S, Lehr S. The secretome of the working human skeletal muscle – a promising opportunity to combat the metabolic disaster? Proteomics Clin Appl (2014) 8:5–18. doi:10.1002/prca.201300094
13. Chan MH, Carey AL, Watt MJ, Febbraio MA. Cytokine gene expression in human skeletal muscle during concentric contraction: evidence that IL-8, like IL-6, is influenced by glycogen availability. Am J Physiol Regul Integr Comp Physiol (2004) 287:R322–7. doi:10.1152/ajpregu.00030.2004
14. Gusba JE, Wilson RJ, Robinson DL, Graham TE. Interleukin-6 and its mRNA responses in exercise and recovery: relationship to muscle glycogen. Scand J Med Sci Sports (2008) 18:77–85. doi:10.1111/j.1600-0838.2006.00635.x
15. Helge JW, Klein DK, Andersen TM, van Hall G, Calbet J, Boushel R, et al. Interleukin-6 release is higher across arm than leg muscles during whole-body exercise. Exp Physiol (2011) 96:590–8. doi:10.1113/expphysiol.2010.056424
16. Holmes AG, Watt MJ, Febbraio MA. Suppressing lipolysis increases interleukin-6 at rest and during prolonged moderate-intensity exercise in humans. J Appl Physiol (1985) (2004) 97:689–96. doi:10.1152/japplphysiol.00195.2004
17. Keller C, Steensberg A, Hansen AK, Fischer CP, Plomgaard P, Pedersen BK. Effect of exercise, training, and glycogen availability on IL-6 receptor expression in human skeletal muscle. J Appl Physiol (1985) (2005) 99:2075–9. doi:10.1152/japplphysiol.00590.2005
18. Nieman DC, Konrad M, Henson DA, Kennerly K, Shanely RA, Wallner-Liebmann SJ. Variance in the acute inflammatory response to prolonged cycling is linked to exercise intensity. J Interferon Cytokine Res (2012) 32:12–7. doi:10.1089/jir.2011.0038
19. Nieman DC, Luo B, Dréau D, Henson DA, Shanely RA, Dew D, et al. Immune and inflammation responses to a 3-day period of intensified running versus cycling. Brain Behav Immun (2014) 39:180–5. doi:10.1016/j.bbi.2013.09.004
20. Steensberg A, Keller C, Hillig T, Frøsig C, Wojtaszewski JF, Pedersen BK, et al. Nitric oxide production is a proximal signaling event controlling exercise-induced mRNA expression in human skeletal muscle. FASEB J (2007) 21:2683–94. doi:10.1096/fj.06-7477com
21. Reihmane D, Jurka A, Tretjakovs P, Dela F. Increase in IL-6, TNF-α, and MMP-9, but not sICAM-1, concentrations depends on exercise duration. Eur J Appl Physiol (2013) 113:851–8. doi:10.1007/s00421-012-2491-9
22. Welc SS, Clanton TL, Dineen SM, Leon LR. Heat stroke activates a stress-induced cytokine response in skeletal muscle. J Appl Physiol (1985) (2013) 115:1126–37. doi:10.1152/japplphysiol.00636.2013
23. Wright HE, McLellan TM, Larose J, Hardcastle SG, Boulay P, Kenny GP. Are circulating cytokine responses to exercise in the heat augmented in older men? Appl Physiol Nutr Metab (2014) 39:117–23. doi:10.1139/apnm-2013-0223
24. Nieman DC, Henson DA, Maxwell KR, Williams AS, McAnulty SR, Jin F, et al. Effects of quercetin and EGCG on mitochondrial biogenesis and immunity. Med Sci Sports Exerc (2009) 41:1467–75. doi:10.1249/MSS.0b013e318199491f
25. Nieman DC, Henson DA, McAnulty SR, McAnulty LS, Morrow JD, Ahmed A, et al. Vitamin E and immunity after the Kona Triathlon World Championship. Med Sci Sports Exerc (2004) 36:1328–35. doi:10.1249/01.MSS.0000135778.57355.CA
26. Steensberg A, Febbraio MA, Osada T, Schjerling P, van Hall G, Saltin B, et al. Interleukin-6 production in contracting human skeletal muscle is influenced by pre-exercise muscle glycogen content. J Physiol (2001) 537(Pt 2):633–9. doi:10.1111/j.1469-7793.2001.00633.x
27. Keller C, Steensberg A, Pilegaard H, Osada T, Saltin T, Saltin B, et al. Transcriptional activation of the IL-6 gene in human contracting skeletal muscle: influence of muscle glycogen content. FASEB J (2001) 15:2748–50. doi:10.1096/fj.01-0507fje
28. Hecksteden A, Kraushaar J, Scharhag-Rosenberger F, Theisen D, Senn S, Meyer T. Individual response to exercise training – a statistical perspective. J Appl Physiol (2015) 118:1450–9. doi:10.1152/japplphysiol.00714.2014
29. Nieman DC, Lasasso H, Austin MD, Pearce S, McInnis T, Unick J. Validation of Cosmed’s FitMate in measuring exercise metabolism. Res Sports Med (2007) 15:67–75. doi:10.1080/15438620601184380
30. Shanely RA, Zwetsloot KA, Triplett NT, Meaney MP, Farris GE, Nieman DC. Human skeletal muscle biopsy procedures using the modified Bergström technique. J Vis Exp (2014) 10:51812. doi:10.3791/51812
31. Livak KJ, Schmittgen TD. Analysis of relative gene expression data using real-time quantitative PCR and the 2−ΔΔCT method. Methods (2001) 25:402–8. doi:10.1006/meth.2001.1262
32. Van Proeyen K, Szlufcik K, Nielens H, Ramaekers M, Hespel P. Beneficial metabolic adaptations due to endurance exercise training in the fasted state. J Appl Physiol (2011) 110:236–45. doi:10.1152/japplphysiol.00907.2010
Keywords: running, interleukin-6, interleukin-8, monocyte chemoattractant protein-1, chemokines
Citation: Nieman DC, Zwetsloot KA, Meaney MP, Lomiwes DD, Hurst SM and Hurst RD (2015) Post-exercise skeletal muscle glycogen related to plasma cytokines and muscle IL-6 protein content, but not muscle cytokine mRNA expression. Front. Nutr. 2:27. doi: 10.3389/fnut.2015.00027
Received: 31 May 2015; Accepted: 26 August 2015;
Published: 09 September 2015
Edited by:
Stavros A. Kavouras, University of Arkansas, USAReviewed by:
Craig Sale, Nottingham Trent University, UKMichalis G. Nikolaidis, Aristotle University of Thessaloniki, Greece
Copyright: © 2015 Nieman, Zwetsloot, Meaney, Lomiwes, Hurst and Hurst. This is an open-access article distributed under the terms of the Creative Commons Attribution License (CC BY). The use, distribution or reproduction in other forums is permitted, provided the original author(s) or licensor are credited and that the original publication in this journal is cited, in accordance with accepted academic practice. No use, distribution or reproduction is permitted which does not comply with these terms.
*Correspondence: David C. Nieman, Appalachian State University, North Carolina Research Campus, 600 Laureate Way, Kannapolis, NC 28081, USA, niemandc@appstate.edu