Greater Food Reward Sensitivity Is Associated with More Frequent Intake of Discretionary Foods in a Nationally Representative Sample of Young Adults
 Tonja R. Nansel1*
 Leah M. Lipsky1
 Miriam H. Eisenberg1
 Denise L. Haynie1
 Danping Liu2
  Bruce Simons-Morton1
- 1Health Behavior Branch, Division of Intramural Population Health Research, Eunice Kennedy Shriver National Institute of Child Health and Human Development, Bethesda, MD, USA
- 2Biostatistics and Bioinformatics Branch, Division of Intramural Population Health Research, Eunice Kennedy Shriver National Institute of Child Health and Human Development, Bethesda, MD, USA
Food reward sensitivity may influence individual susceptibility to an environment replete with highly palatable foods of minimal nutritional value. These foods contain combinations of added sugar, fat, and/or salt that may enhance their motivational salience. This study examined associations of food reward sensitivity with eating behaviors in the NEXT Generation Health Study, a nationally representative sample of U.S. young adults. Participants (n = 2202) completed self-report measures including the Power of Food Scale, assessing food reward sensitivity, and intake frequency of 14 food groups. Multiple linear regressions estimated associations of food reward sensitivity with each of the eating behaviors adjusting for covariates. Higher food reward sensitivity was associated with more frequent intake of fast food (b ± linearized SE = 0.24 ± 0.05, p < 0.001), sweet and salty snacks (0.21 ± 0.05, p < 0.001), foods made with cheese (0.14 ± 0.06, p = 0.03), soda (0.12 ± 0.04, p = 0.009), processed meats (0.12 ± 0.05, p = 0.045), and fish (0.08 ± 0.03, p = 0.03) but was not associated with intake frequency of fruit or juice, green or orange vegetables, beans, whole grains, nuts/seeds, or dairy products. Food reward sensitivity was associated with greater intake of discretionary foods but was not associated with intake of most health-promoting foods, suggesting food reward sensitivity may lead to preferential intake of unhealthful foods.
Introduction
Poor diet is the largest contributor to early death globally (1) and is linked to numerous adverse health outcomes independent of body mass index (BMI) (2–6). In the U.S., population dietary intake is characterized by inadequate intake of fruit, vegetables, whole grains, and excess intake of discretionary foods (those of minimal nutritional value) such as cakes, cookies, pastries, ice cream, chips/crisps, and fried foods (7). Across developed countries, diets are characterized by excessive intake of unhealthful foods (8), sugar (9), and salt (10) – the latter two of which are primary ingredients in many discretionary foods. These foods are ubiquitous (11) and highly marketed, especially to youth (12, 13), and many people experience difficulty moderating their intake (14, 15).
Emerging evidence suggests that food reward sensitivity, the neurologic reward response to food stimuli, may explain variations in susceptibility to highly palatable foods in the environment (14, 16–19). Such foods are characteristically energy dense and nutrient-poor, typically containing added sugar, fat, and/or salt in combinations that maximize palatability (20–23). An emerging hypothesis is that the highly processed nature of these foods enhances their motivational salience due to high caloric density, elevated potency, quicker absorption, and addition of flavor enhancers (14). Additionally, these high calorie foods stimulate greater activation of brain reward circuitry relative to low calorie foods (24), potentially contributing to their consumption for hedonic reasons, rather than homeostatic needs.
The Power of Food Scale (PFS) was developed as a measure of individual differences in appetitive responsiveness to the rewarding properties of food in the environment (17, 25, 26) and has been used as a measure of food reward sensitivity [e.g., Ref. (27–29)]. Higher scores on the PFS were associated with greater intensity of magnetoencephalography response to food stimuli (30, 31), greater connectivity in the visual cortex during imaging of food cues (32), and greater shifts in brain networks paralleling those observed with addictive behaviors in response to food cues (33). Higher food reward sensitivity as measured by the PFS was associated with greater reported food cravings (25, 32, 34, 35) and greater attentional bias toward high calorie food pictures (35). Additionally, persons scoring higher on the PFS reported greater food cravings in response to food stimuli than those scoring lower on the PFS (32, 33). PFS scores were associated with BMI in clinical weight loss and bariatric surgery patients (26, 28, 29, 36); however, findings in non-clinical samples are inconsistent (25, 26, 37, 38).
Few studies have examined the association of food reward sensitivity with dietary intake and eating behaviors. In experimental paradigms, greater food reward sensitivity as assessed with the PFS was associated with greater likelihood of consuming chocolate against experimenter instructions (34), greater likelihood of choosing an unhealthy snack versus healthy snack or non-snack item (35), and greater food intake (27, 39). In the latter two studies, findings were conflicting as to whether food reward sensitivity was associated only with intake of highly palatable food (39) versus total intake of both highly palatable and bland food (27). Whether the association of dietary intake with food reward sensitivity differs according to food group is a critical knowledge gap. If higher food reward sensitivity increases intake due to hedonic eating (eating for pleasure in the absence of energetic need), this suggests that such non-homeostatic eating behavior would most likely target foods with the greatest hedonic value. Additional research elucidating influences on individual susceptibility to the effect of exposure to food cues on eating behaviors may inform the development of interventions targeting improved diet quality. To our knowledge, previous research has not examined the association of the PFS with eating behaviors in a free-living sample or examined how PFS is related to intake of different food groups.
The purpose of this study was to examine the association of food reward sensitivity, as measured by the PFS, with reported frequency of intake of a range of healthful and unhealthful food groups in a nationally representative sample of young adults. We hypothesized that greater food reward sensitivity would be associated with greater intake of discretionary food groups but would not be associated with intake of more healthful food groups.
Materials and Methods
Design and Participants
Data come from wave 5 (2 years after high school) of the NEXT Generation Health Study, a longitudinal, prospective study of a nationally representative cohort of U.S. adolescents enrolled in 10th grade during the 2009–2010 school year and assessed in annual waves. Primary sampling units were school districts or groups of school districts stratified across the nine U.S. Census divisions; out of the 137 schools randomly selected, 81 (59%) agreed to participate. Classrooms of 10th graders within each of these schools were randomly selected to participate. Schools with large percentages of African-American students were oversampled to provide reliable estimates for this subgroup; a sufficient number of Hispanic students were obtained to provide reliable subgroup estimates without oversampling. Participants completed self-administered surveys online. The study protocol was approved by the Institutional Review Board of the Eunice Kennedy Shriver National Institute of Child Health and Human Development; participants provided written informed consent. Out of the 3,796 students originally invited to participate, 2,785 consented and participated and 2,202 were assessed in wave 5.
Measures
Outcome
Intake frequency of food groups was assessed using items modified from the Youth Risk Behavior Surveillance System (40) and the multinational Health Behavior in School-aged Children study (41). Each item queried, “During the past 7 days, how many times did you eat or drink…?” Food groups assessed included 100% fruit juice, fruit, green vegetables, orange vegetables, beans, whole grain foods, soda/pop (not including diet), sweet or salty snacks, nuts or seeds, processed meats, fish, dairy products, and foods made with cheese (e.g., quesadillas, lasagna). Responses ranged from never to four or more times per day. Additionally, intake frequency of fast food was assessed with an item querying “How often did you eat food from a fast food restaurant (for example, McDonalds, KFC, Pizza Hut, and Taco Bell)?” Responses ranged from never to five or more days per week.
Variable of Interest
Food reward sensitivity was assessed in wave 5 using the 15-item PFS. Each item is rated on a 5-point Likert Scale. Items query responses to food being available in the environment (Food Available subscale, e.g., “When I know a delicious food is available, I can’t help myself from thinking about having some”), response to food being directly present (Food Present subscale, e.g., “If I see or smell a food I like, I get a powerful urge to have some”), and response to the taste of food (Food Tasted subscale, e.g., “I love the taste of certain foods so much that I can’t avoid eating them even if they’re bad for me”). Cronbach’s alpha of the aggregate score in the current sample was 0.94. In previous studies, the measure has demonstrated strong internal consistency (Cronbach’s alpha = 0.91), test–retest reliability (r = 0.77, p < 0.001) (25, 26), and has shown associations with brain activity in response to viewing images of food versus control images (30, 32).
Covariates
Baseline self-reported sex, age, ethnicity (Hispanic or Latino; not Hispanic or Latino), race, parent education, family affluence, year five self-reported height, BMI, physical activity, and smoking were all selected as covariates a priori. Participants reported race using predefined categories (Black or African-American, White, Asian, American Indian or Alaska Native, Native Hawaiian or other Pacific Islander). Responses were categorized as White, African-American, Hispanic, and Other. Participant responses regarding household car and computer ownership, family vacations, and bedroom sharing were used to calculate the previously validated Family Affluence Scale (42); scores range from 0 (low affluence) to 7 (high affluence). Highest parent education, ascertained during the consent process, was categorized as less than high school graduate/high school graduate/some college/bachelor’s degree/graduate degree. Participants self-reported their height, weight, number of hours of past-week vigorous physical activity (“enough to get out of breath or sweat”), and number of cigarettes smoked per day.
Analyses
Multiple imputation by chained equations, assuming missing-at-random (43) was used to deal with item non-response. The algorithm iteratively imputes missing variables by estimating its distribution conditional on other variables. Fifty imputed datasets were generated using IVEware (44). Each dataset was analyzed separately, and the results were combined using Rubin’s rule in StataSE version 14 (College Station, TX, USA). Participant characteristics were summarized with means and SE for continuous variables and percentages for categorical variables. Multiple linear regression estimated associations of the PFS aggregate score with intake frequency of each of the eating behaviors adjusting for sex, age, race/ethnicity, family affluence, parent education, height, BMI, and physical activity. Post hoc, we also examined the association of each of the three PFS subscales (Food Available, Food Present, and Food Tasted) with intake frequency of each of the eating behaviors, including the same covariates. Survey estimation methods were used to account for the complex sampling design. The regression coefficient of PFS is interpreted as the mean increase in the frequency of eating behavior (times per day or days per week) per unit increase in PFS.
Results
Sample characteristics are shown in Table 1. The mean age of the sample was 20 years; 59% were females. Food groups showing the highest intake frequency were dairy products, foods made with cheese, fruit, and whole grain foods. Foods consumed least frequently were fish, beans, and orange vegetables.
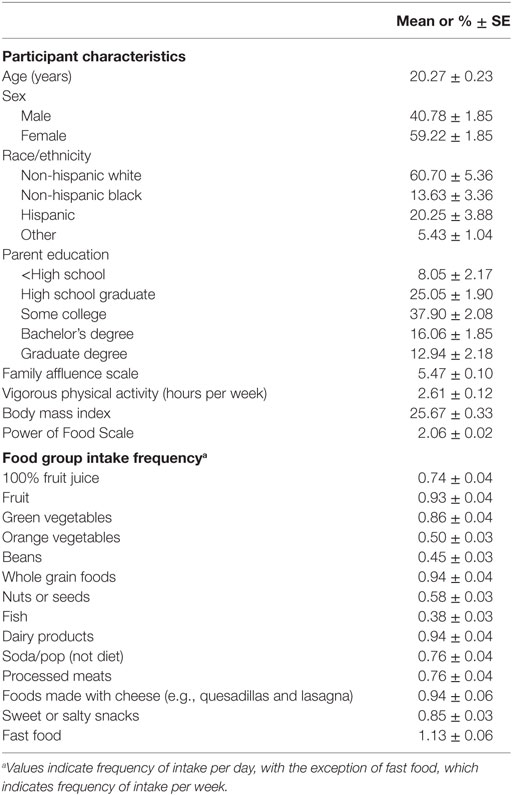
Table 1. Weighted sample characteristics of the NEXT Generation Health Study at wave 5.
Higher food reward sensitivity, as measured by the PFS aggregate score, was associated with more frequent intake of fast food (b ± linearized SE = 0.24 ± 0.05, p < 0.001), sweet/salty snacks (0.21 ± 0.05, p < 0.001), foods made with cheese (0.14 ± 0.06, p = 0.03), soda (0.12 ± 0.04, p = 0.009), processed meats (0.12 ± 0.05, p = 0.045), and fish (0.08 ± 0.03, p = 0.03) (Table 2). The PFS aggregate score was not associated with intake frequency of fruit or fruit juice, green or orange vegetables, beans, whole grains, nuts/seeds, or dairy products.
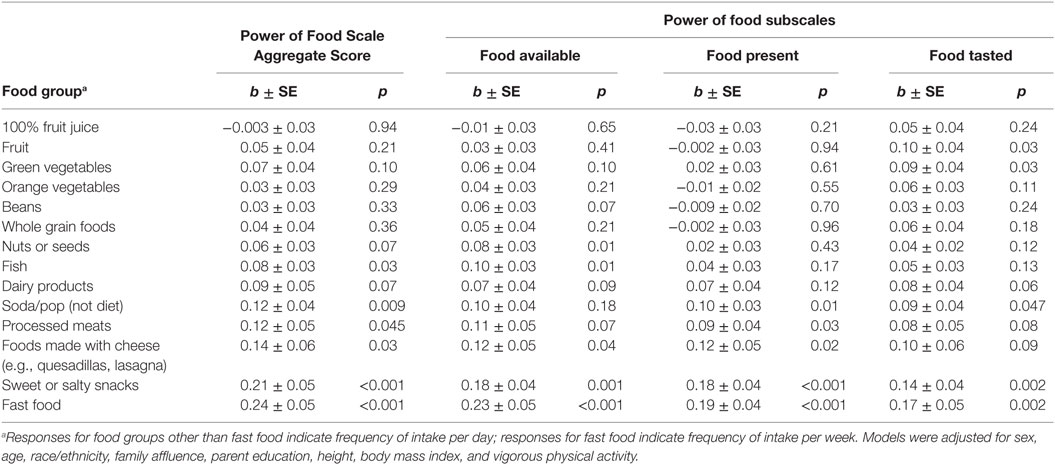
Table 2. Linear regression models estimating associations of food reward responsivity with intake frequency.
The association of PFS subscales with intake frequency was consistent across subscales for sweet/salty snacks and fast food (Table 2). While associations of the PFS subscales with soda, processed meats, and foods made with cheese were similar in magnitude, they were not statistically significant across all subscales. The Food Present subscale yielded associations most consistent with those of the aggregate score; the Food Tasted subscale yielded the least consistent associations.
Discussion
In this nationally representative sample of young adults, higher food reward sensitivity as measured by the PFS aggregate score was associated with more frequent intake of discretionary food categories including sweet and salty snacks, processed meat, cheesy foods, and fast food. However, except for fish, food reward sensitivity was not associated with intake frequency of more healthful foods including fruit, vegetables, beans, whole grains, nuts/seeds, and dairy products. This pattern implies an association of food reward sensitivity with intake primarily of the foods with the least nutritional value. This selective association is consistent with a body of literature indicating that the foods most likely to induce hedonic overeating are highly processed and energy dense, containing added sugar, fat, and salt (14, 15, 23, 45). These foods are difficult to resist for many (15), are often consumed despite a desire or intention to reduce their intake (14, 15), and are overconsumed throughout the population (46, 47). In two previous studies, scores on the PFS were associated with other dietary variables representing aspects or degrees of uncontrolled eating, including emotional eating, external eating, disinhibition, and binge eating (25, 48); further investigation is needed to understand how food reward sensitivity as measured by the PFS relates to other determinants of eating behavior. Understanding contributors to increased intake of nutrient-poor foods is of public health concern not only because their intake promotes excess weight but also because it is associated with poorer health independent of weight status (1, 2, 4).
The Food Tasted subscale of the PFS showed the least consistent associations with eating behaviors of the three subscales, echoing previous research showing lesser utility of the Food Tasted subscale versus the Food Present and Food Available subscales (36, 38, 48). Research examining the hedonic value of food indicates a distinction between taste perception and reward value. The taste appeal of a food (liking) and the desire to consume a food (wanting) are believed to have independent neural pathways (49), with the latter being a stronger driver of excess intake (50). While further investigation is indicated, this body of research suggests that the association of PFS with increased intake of highly palatable foods might not be attributable simply to the pleasant taste of these foods. The taste of a highly palatable food is likely to be rated highly but variation in food reward sensitivity may further impact the degree of one’s desire to consume it. This supposition is further supported by an animal model study in which the reinforcing value of food was dependent not on sweet taste but only on the actual presence of sugar in the food (51), which strongly activates brain reward regions (52).
Findings, herein, suggest that food reward sensitivity may be a relevant mechanism by which individual susceptibility interacts with the food environment to adversely impact dietary behavior. The lack of a consistent association of food reward sensitivity with more nutrient-rich food groups suggests that individual differences in food reward sensitivity may have minimal effect on intake in an environment characterized primarily by these food groups. However, as highly processed, highly palatable foods have become ubiquitous and normative, food reward sensitivity may play an important role in influencing dietary intake through a number of potential mechanisms. For example, high food reward sensitivity could impact eating via increased attention to environmental food cues (53), increased mental elaboration in response to food cues (e.g., thoughts about the hedonic properties of the food) (53), and subsequent inhibition of goals regarding healthful eating (54). When attempting to regulate dietary intake of highly palatable foods, effortful resistance results in a depletion of cognitive and emotional energy (55); consequently, efforts to restrict intake often fail. If indeed food reward sensitivity reflects an increased vulnerability to an obesogenic environment, efforts to modify the environment may be more successful than efforts to increase self-control.
A notable strength of this study is the use of a large, contemporary, nationally representative sample. However, several limitations should be considered when interpreting these findings. The self-report dietary screener is more susceptible to measurement error than more comprehensive methods (56) but is considered adequate for population-level surveillance of eating behaviors (57). Because the measure indicates intake frequency rather than amount, it is not possible to determine whether the increased intake frequency of discretionary foods observed among those with higher food reward sensitivity resulted in greater overall energy intake. Additionally, the study is unable to examine cross-cultural or cross-national differences in regards to the association of food reward sensitivity with dietary intake. It is important to note that the body of research using the PFS is relatively small, and the construct it measures is not yet fully understood, limiting the ability to compare these findings to other epidemiological studies.
A substantial proportion of the diets of both youth and adults in the U.S. is from discretionary foods high in energy and low in other nutrients (46, 47), adversely impacting public health (1). Difficulty regulating intake of these foods is common (14, 15). Findings from this study suggest that food reward responsivity, understood as the neurologic reward response to food stimuli, may influence individual susceptibility to these foods. However, research on these constructs is in its early stages, and findings must be treated as preliminary. Further research examining the association of food reward sensitivity with dietary intake using more precise measures is needed, as is research examining the interplay of food reward sensitivity with other relevant demographic, behavioral, and environmental variables. Additional work will be needed to determine how to most effectively use resulting advances toward the development of approaches to more effectively improve dietary behavior; however, findings lend support to the importance of environmental and policy approaches to decrease the widespread availability of highly palatable, nutrient-poor foods.
Author Contributions
TN conceptualized the research question, interpreted findings, and drafted and edited the manuscript. LL and DL analyzed data and contributed to interpretation of findings. ME contributed to drafting of the manuscript. LL, ME, DL, DH, and BS-M contributed to editing of the manuscript. BS-M and DH directed the design and implementation of the study from which these data were drawn. All authors read and approved the final manuscript.
Conflict of Interest Statement
The authors declare that the research was conducted in the absence of any commercial or financial relationships that could be construed as a potential conflict of interest.
Funding
This research (contract number HHSN275201200001I) was supported in part by the intramural research program of the Eunice Kennedy Shriver National Institute of Child Health and Human Development (NICHD), and the National Heart, Lung and Blood Institute (NHLBI), the National Institute on Alcohol Abuse and Alcoholism (NIAAA), and Maternal and Child Health Bureau (MCHB) of the Health Resources and Services Administration (HRSA), with supplemental support from the National Institute on Drug Abuse (NIDA).
References
1. GBD 2013 Risk Factors Collaborators; Forouzanfar MH, Alexander L, Anderson HR, Bachman VF, Biryukov S, et al. Global, regional, and national comparative risk assessment of 79 behavioural, environmental and occupational, and metabolic risks or clusters of risks in 188 countries, 1990-2013: a systematic analysis for the Global Burden of Disease Study 2013. Lancet (2015) 386(10010):2287–323. doi:10.1016/S0140-6736(15)00128-2
2. Chiuve SE, Fung TT, Rimm EB, Hu FB, McCullough ML, Wang M, et al. Alternative dietary indices both strongly predict risk of chronic disease. J Nutr (2012) 142(6):1009–18. doi:10.3945/jn.111.157222
3. Kant AK, Schatzkin A, Graubard BI, Schairer C. A prospective study of diet quality and mortality in women. JAMA (2000) 283(16):2109–15. doi:10.1001/jama.283.16.2109
4. Phillips CM, Dillon C, Harrington JM, McCarthy VJ, Kearney PM, Fitzgerald AP, et al. Defining metabolically healthy obesity: role of dietary and lifestyle factors. PLoS One (2013) 8(10):e76188. doi:10.1371/journal.pone.0076188
5. Reedy J, Krebs-Smith SM, Miller PE, Liese AD, Kahle LL, Park Y, et al. Higher diet quality is associated with decreased risk of all-cause, cardiovascular disease, and cancer mortality among older adults. J Nutr (2014) 144(6):881–9. doi:10.3945/jn.113.189407
6. Zahedi H, Kelishadi R, Heshmat R, Motlagh ME, Ranjbar SH, Ardalan G, et al. Association between junk food consumption and mental health in a national sample of Iranian children and adolescents: the CASPIAN-IV study. Nutrition (2014) 30(11–12):1391–7. doi:10.1016/j.nut.2014.04.014
7. US Department of Agriculture, Agricultural Research Service. What We Eat in America, NHANES 2001-2002: Usual Nutrient Intakes from Food Compared to Dietary Reference Intakes. Washington, DC: USDA (2005).
8. Imamura F, Micha R, Khatibzadeh S, Fahimi S, Shi P, Powles J, et al. Dietary quality among men and women in 187 countries in 1990 and 2010: a systematic assessment. Lancet Glob Health (2015) 3(3):e132–42. doi:10.1016/S2214-109X(14)70381-X
9. Svensson A, Larsson C, Eiben G, Lanfer A, Pala V, Hebestreit A, et al. European children’s sugar intake on weekdays versus weekends: the IDEFICS study. Eur J Clin Nutr (2014) 68(7):822–8. doi:10.1038/ejcn.2014.87
10. Powles J, Fahimi S, Micha R, Khatibzadeh S, Shi P, Ezzati M, et al. Global, regional and national sodium intakes in 1990 and 2010: a systematic analysis of 24 h urinary sodium excretion and dietary surveys worldwide. BMJ Open (2013) 3(12):e003733. doi:10.1136/bmjopen-2013-003733
11. Fleischhacker SE, Evenson KR, Rodriguez DA, Ammerman AS. A systematic review of fast food access studies. Obes Rev (2011) 12(5):e460–71. doi:10.1111/j.1467-789X.2010.00715.x
12. Committee on Food Marketing and the Diets of Children and Youth; McGinnis JM, Gootman JA, Kraak VI. Food Marketing to Children and Youth – Threat or Opportunity? Washington DC: Institute of Medicine, The National Academies Press (2006).
13. Federal Trade Commission. A Review of Food Marketing to Children and Adolescents: Follow-Up Report. Washington, DC: Federal Trade Commission (2012).
14. Gearhardt AN, Davis C, Kuschner R, Brownell KD. The addiction potential of hyperpalatable foods. [Review]. Curr Drug Abuse Rev (2011) 4(3):140–5. doi:10.2174/1874473711104030140
15. Schulte EM, Avena NM, Gearhardt AN. Which foods may be addictive? The roles of processing, fat content, and glycemic load. PLoS One (2015) 10(2):e0117959. doi:10.1371/journal.pone.0117959
16. Alsio J, Olszewski PK, Levine AS, Schioth HB. Feed-forward mechanisms: addiction-like behavioral and molecular adaptations in overeating. Front Neuroendocrinol (2012) 33(2):127–39. doi:10.1016/j.yfrne.2012.01.002
17. Lowe MR, Butryn ML. Hedonic hunger: a new dimension of appetite? Physiol Behav (2007) 91(4):432–9. doi:10.1016/j.physbeh.2007.04.006
18. Lutter M, Nestler EJ. Homeostatic and hedonic signals interact in the regulation of food intake. J Nutr (2009) 139(3):629–32. doi:10.3945/jn.108.097618
19. Burger KS, Stice E. Variability in reward responsivity and obesity: evidence from brain imaging studies. Curr Drug Abuse Rev (2011) 4(3):182–9. doi:10.2174/1874473711104030182
20. Bobroff EM, Kissileff HR. Effects of changes in palatability on food intake and the cumulative food intake curve in man. Appetite (1986) 7(1):85–96. doi:10.1016/S0195-6663(86)80044-7
21. Drewnowski A, Krahn DD, Demitrack MA, Nairn K, Gosnell BA. Taste responses and preferences for sweet high-fat foods: evidence for opioid involvement. Physiol Behav (1992) 51(2):371–9. doi:10.1016/0031-9384(92)90155-U
22. Green SM, Blundell JE. Effect of fat- and sucrose-containing foods on the size of eating episodes and energy intake in lean dietary restrained and unrestrained females: potential for causing overconsumption. Eur J Clin Nutr (1996) 50(9):625–35.
24. Stoeckel LE, Weller RE, Cook EW III, Twieg DB, Knowlton RC, Cox JE. Widespread reward-system activation in obese women in response to pictures of high-calorie foods. Neuroimage (2008) 41(2):636–47. doi:10.1016/j.neuroimage.2008.02.031
25. Lowe MR, Butryn ML, Didie ER, Annunziato RA, Thomas JG, Crerand CE, et al. The Power of Food Scale. A new measure of the psychological influence of the food environment. Appetite (2009) 53(1):114–8. doi:10.1016/j.appet.2009.05.016
26. Cappelleri JC, Bushmakin AG, Gerber RA, Leidy NK, Sexton CC, Karlsson J, et al. Evaluating the Power of Food Scale in obese subjects and a general sample of individuals: development and measurement properties. Int J Obes (Lond) (2009) 33(8):913–22. doi:10.1038/ijo.2009.107
27. Ely AV, Howard J, Lowe MR. Delayed discounting and hedonic hunger in the prediction of lab-based eating behavior. Eat Behav (2015) 19:72–5. doi:10.1016/j.eatbeh.2015.06.015
28. Carpenter CL, Wong AM, Li Z, Noble EP, Heber D. Association of dopamine D2 receptor and leptin receptor genes with clinically severe obesity. Obesity (Silver Spring) (2013) 21(9):E467–73. doi:10.1002/oby.20202
29. Schultes B, Ernst B, Wilms B, Thurnheer M, Hallschmid M. Hedonic hunger is increased in severely obese patients and is reduced after gastric bypass surgery. Am J Clin Nutr (2010) 92(2):277–83. doi:10.3945/ajcn.2009.29007
30. Yoshikawa T, Tanaka M, Ishii A, Watanabe Y. Immediate neural responses of appetitive motives and its relationship with hedonic appetite and body weight as revealed by magnetoencephalography. Med Sci Monit (2013) 19:631–40. doi:10.12659/MSM.889234
31. Yoshikawa T, Tanaka M, Ishii A, Watanabe Y. Suppressive responses by visual food cues in postprandial activities of insular cortex as revealed by magnetoencephalography. Brain Res (2014) 1568:31–41. doi:10.1016/j.brainres.2014.04.021
32. Bullins J, Laurienti PJ, Morgan AR, Norris J, Paolini BM, Rejeski WJ. Drive for consumption, craving, and connectivity in the visual cortex during the imagery of desired food. Front Aging Neurosci (2013) 5:77. doi:10.3389/fnagi.2013.00077
33. Rejeski WJ, Burdette J, Burns M, Morgan AR, Hayasaka S, Norris J, et al. Power of food moderates food craving, perceived control, and brain networks following a short-term post-absorptive state in older adults. Appetite (2012) 58(3):806–13. doi:10.1016/j.appet.2012.01.025
34. Forman EM, Hoffman KL, McGrath KB, Herbert JD, Brandsma LL, Lowe MR. A comparison of acceptance- and control-based strategies for coping with food cravings: an analog study. Behav Res Ther (2007) 45(10):2372–86. doi:10.1016/j.brat.2007.04.004
35. van Dillen LF, Andrade J. Derailing the streetcar named desire. Cognitive distractions reduce individual differences in cravings and unhealthy snacking in response to palatable food. Appetite (2016) 96:102–10. doi:10.1016/j.appet.2015.09.013
36. Ullrich J, Ernst B, Wilms B, Thurnheer M, Hallschmid M, Schultes B. The hedonic drive to consume palatable foods appears to be lower in gastric band carriers than in severely obese patients who have not undergone a bariatric surgery. Obes Surg (2013) 23(4):474–9. doi:10.1007/s11695-012-0818-6
37. Yoshikawa T, Orita K, Watanabe Y, Tanaka M. Validation of the Japanese version of the power of food scale in a young adult population. Psychol Rep (2012) 111(1):253–65. doi:10.2466/08.02.06.15.PR0.111.4.253-265
38. Lipsky LM, Nansel TR, Haynie DL, Liu D, Eisenberg MH, Simons-Morton B. Power of Food Scale in association with weight outcomes and dieting in a nationally representative cohort of U.S. young adults. Appetite (2016) 105:385–91. doi:10.1016/j.appet.2016.06.012
39. Appelhans BM, Woolf K, Pagoto SL, Schneider KL, Whited MC, Liebman R. Inhibiting food reward: delay discounting, food reward sensitivity, and palatable food intake in overweight and obese women. Obesity (Silver Spring) (2011) 19(11):2175–82. doi:10.1038/oby.2011.57
40. Youth Risk Behavior Surveillance System (YRBSS). YRBS Questionnaire Content – 1991–2015. Atlanta, GA: CDC National Center for HIV/AIDS, Viral Hepatitis, STD and TB Prevention (2014). p. 1–78.
41. Vereecken CA, De Henauw S, Maes L. Adolescents’ food habits: results of the health behaviour in school-aged children survey. Br J Nutr (2005) 94(3):423–31. doi:10.1079/BJN20051513
42. Currie C, Molcho M, Boyce W, Holstein B, Torsheim T, Richter M. Researching health inequalities in adolescents: the development of the health behaviour in school-aged children (HBSC) family affluence scale. Soc Sci Med (2008) 66(6):1429–36. doi:10.1016/j.socscimed.2007.11.024
43. Little RJ, Rubin DB. Statistical Analysis with Missing Data. New York, NY: John Wiley & Sons (2014).
44. Raghunathan T, Solenberger P, Van Hoewyk J. IVEware: Imputation and Variance Estimation Software. Ann Arbor, MI: Survey Methodology Program, Survey Research Center, Institute for Social Research, University of Michigan (2007).
45. Ifland JR, Preuss HG, Marcus MT, Rourke KM, Taylor WC, Burau K, et al. Refined food addiction: a classic substance use disorder. Med Hypotheses (2009) 72(5):518–26. doi:10.1016/j.mehy.2008.11.035
46. Cohen DA, Sturm R, Scott M, Farley TA, Bluthenthal R. Not enough fruit and vegetables or too many cookies, candies, salty snacks, and soft drinks? Public Health Rep (2010) 125(1):88–95. doi:10.2307/41434752
47. Reedy J, Krebs-Smith SM. Dietary sources of energy, solid fats, and added sugars among children and adolescents in the United States. J Am Diet Assoc (2010) 110(10):1477–84. doi:10.1016/j.jada.2010.07.010
48. Vainik U, Neseliler S, Konstabel K, Fellows LK, Dagher A. Eating traits questionnaires as a continuum of a single concept. Uncontrolled eating. Appetite (2015) 90:229–39. doi:10.1016/j.appet.2015.03.004
49. Berridge KC. Food reward: brain substrates of wanting and liking. Neurosci Biobehav Rev (1996) 20(1):1–25. doi:10.1016/0149-7634(95)00033-B
50. Finlayson G, King N, Blundell JE. Liking vs. wanting food: importance for human appetite control and weight regulation. Neurosci Biobehav Rev (2007) 31(7):987–1002. doi:10.1016/j.neubiorev.2007.03.004
51. Beeler JA, McCutcheon JE, Cao ZF, Murakami M, Alexander E, Roitman MF, et al. Taste uncoupled from nutrition fails to sustain the reinforcing properties of food. Eur J Neurosci (2012) 36(4):2533–46. doi:10.1111/j.1460-9568.2012.08167.x
52. Stice E, Burger KS, Yokum S. Relative ability of fat and sugar tastes to activate reward, gustatory, and somatosensory regions. Am J Clin Nutr (2013) 98(6):1377–84. doi:10.3945/ajcn.113.069443
53. Higgs S. Cognitive processing of food rewards. Appetite (2016) 104:10–7. doi:10.1016/j.appet.2015.10.003
54. Papies EK, Stroebe W, Aarts H. Understanding dieting: a social cognitive analysis of hedonic processes in self-regulation. Eur Rev Soc Psychol (2009) 19(1):339–83. doi:10.1080/10463280802563723
55. Heatherton TF, Wagner DD. Cognitive neuroscience of self-regulation failure. Trends Cogn Sci (2011) 15(3):132–9. doi:10.1016/j.tics.2010.12.005
56. Thompson FE, Subar AF. Dietary assessment methodology. 2nd ed. In: Coulston AM, Boushey CJ, editors. Nutrition in the Prevention and Treatment of Disease. Burlington, MA: Elsevier Academic Press (2008). p. 3–39.
Keywords: food reward sensitivity, food reward responsivity, dietary intake, eating behaviors, young adults
Citation: Nansel TR, Lipsky LM, Eisenberg MH, Haynie DL, Liu D and Simons-Morton B (2016) Greater Food Reward Sensitivity Is Associated with More Frequent Intake of Discretionary Foods in a Nationally Representative Sample of Young Adults. Front. Nutr. 3:33. doi: 10.3389/fnut.2016.00033
Received: 12 May 2016; Accepted: 02 August 2016;
Published: 18 August 2016
Edited by:
Caroline Davis, York University, CanadaReviewed by:
Boris C. Rodríguez-Martín, University “Marta Abreu” of Las Villas, CubaKyle S. Burger, University of North Carolina at Chapel Hill, USA
Copyright: © 2016 Nansel, Lipsky, Eisenberg, Haynie, Liu and Simons-Morton. This is an open-access article distributed under the terms of the Creative Commons Attribution License (CC BY). The use, distribution or reproduction in other forums is permitted, provided the original author(s) or licensor are credited and that the original publication in this journal is cited, in accordance with accepted academic practice. No use, distribution or reproduction is permitted which does not comply with these terms.
*Correspondence: Tonja R. Nansel, nanselt@mail.nih.gov