Consumption of Alcopops During Brain Maturation Period: Higher Impact of Fructose Than Ethanol on Brain Metabolism
 Dounia El Hamrani1
  Henri Gin1,2
  Jean-Louis Gallis1
  Anne-Karine Bouzier-Sore1*†
  Marie-Christine Beauvieux1†
- 1UMR5536 Centre de Resonance Magnetique des Systemes Biologiques (CRMSB), Centre National de la Recherche Scientifique (CNRS), Université de Bordeaux, LabEx TRAIL, Bordeaux, France
- 2Service de Nutrition et Diabétologie, Hôpital Haut-Lévêque, Pessac, France
Alcopops are flavored alcoholic beverages sweetened by sodas, known to contain fructose. These drinks have the goal of democratizing alcohol among young consumers (12–17 years old) and in the past few years have been considered as fashionable amongst teenagers. Adolescence, however, is a key period for brain maturation, occurring in the prefrontal cortex and limbic system until 21 years old. Therefore, this drinking behavior has become a public health concern. Despite the extensive literature concerning the respective impacts of either fructose or ethanol on brain, the effects following joint consumption of these substrates remains unknown. Our objective was to study the early brain modifications induced by a combined diet of high fructose (20%) and moderate amount of alcohol in young rats by 13C Nuclear Magnetic Resonance (NMR) spectroscopy. Wistar rats had isocaloric pair-fed diets containing fructose (HF, 20%), ethanol (Et, 0.5 g/day/kg) or both substrates at the same time (HFEt). After 6 weeks of diet, the rats were infused with 13C-glucose and brain perchloric acid extracts were analyzed by NMR spectroscopy (1H and 13C). Surprisingly, the most important modifications of brain metabolism were observed under fructose diet. Alterations, observed after only 6 weeks of diet, show that the brain is vulnerable at the metabolic level to fructose consumption during late-adolescence throughout adulthood in rats. The main result was an increase in oxidative metabolism compared to glycolysis, which may impact lactate levels in the brain and may, at least partially, explain memory impairment in teenagers consuming alcopops.
Introduction
Regular consumption of “alcopops,” also called “designer drinks” or “ready to drink” has increased among young people in Western societies (1), even if it varies within different countries and if no reliable survey can be found on teenagers (2). These flavored alcoholic beverages are sweetened by soft drinks containing fructose, which insidiously facilitates alcohol consumption among young consumers (3). Flavor, alcohol-strength, portability and low cost also influence young consumers (12–17 years old) toward this category of beverages (4), which can lead to episodic heavy drinking and related injuries (3). Considering that brain maturation in the prefrontal cortex and limbic system continues until 21 years of age, this drinking behavior is becoming a prevalent public health concern (5).
In Western diets, fructose is one of the most widely added sugars and its dietary intake is mostly through sucrose (50:50 molar mixture of fructose and glucose) and high fructose corn syrup (HFCS; 42, 55, or 90% of fructose). Compared to a natural consumption of 16–24 g daily with fruits and honey, “industrial” fructose consumption can reach 80 g/day which equates to 17–20% of the daily caloric intake (6). The NHANES (National Health and Nutrition Examination Survey) has reported that soft drinks account for 40% of the total daily intake of added sugar (7). An increasing literature has linked a high fructose (HF) diet with deleterious metabolic effects such as obesity, insulin resistance, hyperlipidemia and non-alcoholic hepatic steatosis [for review see (8–10)].
In addition, mounting evidence suggests that high fructose consumption can induce cerebral abnormalities. Indeed, HF diet alters spatial memory of rats exposed either during adulthood (60% fructose for 19 weeks) or a period considered as adolescence (11% sucrose or HFCS55 during 30 days) (11, 12). Moreover, 55% of rats fed on a HF diet during adolescence showed anxiety-like and depression-like behaviors with an elevated basal corticosterone concentration (13). In addition to the behavioral features, a HF diet induces alterations in the hippocampus (structure implicated in spatial memory), reduces neurogenesis associated with increased apoptosis (14), raises neuroinflammatory markers (interleukins 1β and 6) (12) and cerebral insulin resistance (15–17). Moreover, it has been hypothesized that regular dietary intake of fructose can play a role in the pathophysiology of chronic neurodegenerative diseases such as dementia (18, 19).
Alcohol drinking behaviors can be broadly divided in three categories: acute ethanol consumption (“binge drinking”; > 100 g ethanol or five “standard drinks” within 2 h), heavily chronic consumption of ethanol (alcoholism; > 80 g daily), and light to moderate consumption (<40 g from daily to weekly frequency) (20). There is very extensive literature concerning moderate alcohol consumption and its cerebral effects have been largely studied. It has been documented that ethanol interacts with neurotransmitter systems (dopamine, serotonin, GABA, glutamate) as well as second messenger systems (21).
Early moderate ethanol exposure in rats during the critical developmental period of adolescence has been reported to reduce hippocampal neurogenesis (22) and to lead to disturbances in the nucleus accumbens (structure of mesolimbic reward system) by increasing dopamine levels (23) and neuronal activation markers (24). Similarly, chronic moderate consumption in adult rodents induced alterations in dopaminergic neurotransmission in the nucleus accumbens (25), GABAergic disinhibition in the dorsolateral striatum (26), altered hippocampal glutamate basal levels (27), and reduced neurogenesis in the hippocampus contributing to changes in structural plasticity (28).
Recently, it has been proposed that fructose consumption has similar toxic effects to ethanol consumption, particularly in terms of hepatic metabolism (29). Indeed, fructose and ethanol are nonessential, insulin-independent, energetic substrates leading to hepatic steatosis. According to this hypothesis, it has been demonstrated that a mixed diet of high fructose and ethanol exacerbates hepatic steatosis accompanied by glucose metabolism impairment and dyslipidemia (30). It has also been shown that high fructose diet (60%) may potentiate the effects of chronic alcohol consumption by enhancing the hepatic inflammatory response (31).
Despite the extensive literature concerning the respective impacts of either fructose or ethanol on the brain, the effects following combined consumption of these substrates remains unknown. To our knowledge, it is the first time that the joint consumption of fructose and ethanol at dietary relevant concentrations has been studied for its impact on young rat brain metabolism. Our objective was to study the early brain modifications induced by a diet of high fructose (20%) combined or not with a moderate amount of alcohol in young rats by 13C-Nuclear Magnetic Resonance (NMR) spectroscopy, which is a powerful tool to follow the fate of enriched glucose (the main brain substrate) through cerebral metabolic pathways.
Materials and Methods
Animals and Diets
Male Wistar rats aged 7 weeks and weighing 230 g upon arrival were purchased from Janvier Labs (Le Genest Saint Isle, France). Rats were housed in cages inside a room with controlled parameters; temperature 21–23°C, hygrometry 30% and a 12 h light/dark system. The diets were started 4 days after their arrival and maintained for 6 weeks.
The protocol included four experimental groups (n = 8 for each group): (i) control diet (CT) with a standard chow (A04 SAFE, Augy, France); (ii) high fructose diet (HF) with 20% fructose (Sigma) added to the drinking water; (iii) ethanol group (Et) with a moderate dose of 0.5 g/kg of body weight (BW) per day (anhydrous absolute ethanol; Carlo Erba Reagents) added to the drinking water; (iv) a diet combining fructose and ethanol (HFEt) concentrations of groups (ii) and (iii) in drinking water.
The solid chow composition was similar in all groups and contained 60% carbohydrates, 16% proteins, 4% cellulose, 3% lipids, and 12% water. Diets were calculated to be isocaloric and pair fed among the groups based on Table 1. Diets were 10 g standard chow/100 g BW/day and 10 mL drinks/100 g BW/day. Rat weight and food consumption were measured every 48 h. This study was performed only on males to avoid the confounding factors linked to sex differences in puberty and hormone cycles. All procedures have been approved by the Institutional Animal Research Ethics Review Board of Bordeaux University (n° 5012029A) and followed the guidelines of the French governmental agency.
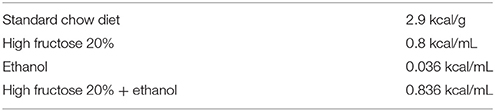
Table 1. Caloric value for each substrate.
Infusion of [1-13C]glucose
At the end of the feeding period, the rats were anesthetized with an intraperitoneal injection of chloral hydrate (8%, 1 mL/200 g BW; Sigma-Aldrich, USA) and placed on a heated pad (37°C). [1-13C]D-glucose (750 mM, Cambridge Isotope Laboratories, Inc.) was infused into the tail vein over a total period of 60 min, following a previous 20 steps, time-decreasing exponential rate protocol going from 15–1.23 ml/h during the first 25 min after which the rate was kept unchanged for the last 35 min. This infusion protocol was designed to reach constant [1-13C]D-glucose concentrations in the blood and the total amount of glucose administered was 2.19 mmol/h per 200 g BW.
Blood and Brain Samples
Prior to the infusion, 500 μL of blood was collected from the tail vein with heparinized syringes, centrifuged (1,500 g, 10 min) and plasma stored at −80°C. At the end of the infusion period and while the rats were still anesthetized, the abdomen was opened sufficiently to collect 2 mL of blood from the inferior vena cava into heparinized syringes. Blood samples were immediately centrifuged (1,500 g, 10 min) and plasma was kept at −80°C until it was analyzed. After blood sampling, rats were rapidly euthanized by focused brain scientific microwaves (5 kW, 1 s; Sacron8000, Sairem, Neyron, France), which completely prevents post-mortem metabolic modifications in the brain. The skull was cut opened with a micro-circular saw, the brain rapidly removed and dipped into liquid nitrogen. Brains were kept at −80°C until the metabolites were extracted.
Perchloric Acid Extraction
Before extraction, each brain was weighed to normalize the data. Water soluble metabolites of the whole brain were extracted into perchloric acid (0.9 M) as previously described (32) with the following modifications. After homogenization, the suspension was centrifuged at 3,000 g for 10 min (4°C). The supernatant was neutralized at pH 7.20 with a 9 M KOH solution and centrifuged to eliminate perchlorate salts. Samples were then lyophilized. Prior to NMR spectroscopy, lyophilysates were dissolved in 400 μL of D2O and 10 μL of ethylene glycol (1 mmol/L in D2O) was added as an external reference.
High Resolution at the Magic Angle Spinning (HRMAS) NMR Spectroscopy
HRMAS NMR spectroscopy was performed on an 11.7T spectrometer (DPX 500MHz, Bruker Biospin, Wissembourg, France). For each brain perchloric acid extract, 50 μL was placed in a 4 mm-diameter rotor and analyzed at room temperature.
1H-NMR spectra were acquired with a 90° pulse angle (adjusted for each sample), relaxation time of 8 s, relaxation delay of 8 s, and spectrum width of 10 parts per million (ppm), acquisition time of 3.28 s, 128 scans and 32 K memory size. Homonuclear presaturation was used to suppress the water signal.
The specific enrichment (% 13C) of glucose carbon 1 (Glc C1 SEnr) was determined from the ratio of the integral of Glc satellite peaks resulting from heteronuclear spin-coupling to the sum of the integrals of satellite and central peaks.
1H-decoupled 13C-NMR spectra were acquired with a 90° pulse angle, relaxation time of 20 s, 200 ppm spectrum width, 1.31 s acquisition time, ~5,500 scans, and 64 K memory size. From these 13C spectra, relative enrichment of glutamate (Glu) C2/C3 and glutamine (Gln) C2/C3 were calculated.
1H-observed/13C-edited (POCE) NMR spectra were acquired under 13C decoupling as previously described (32). The method included a first scan consisting of a standard spin-echo acquisition in which 1H linked to all carbons (12C and 13C) were detected, and a second scan corresponding to a 13C inversion pulse, in which only 1H coupled to 13C were visible. Brain metabolite 13C enrichments were determined from the ratio of the integral of a resonance on the edited 13C-1H spectrum to its integral in the standard spin-echo spectrum.
Plasma Metabolites
Plasma samples were collected at the end of the 13C-glucose infusion and analyzed using a clinical chemistry analyzer (Olympus AU2700, BCO, Villepinte, France) with kits for glucose (Glc), proteins, albumin, total cholesterol, HDL-cholesterol, triglycerides (TG) and free fatty acids (FFA). These assays were performed in the medical laboratories of Bordeaux Hospital (Haut-Levêque, France). Insulin levels were assessed by ELISA (Diasorin, Antony, France) at the Institut de Chimie et Biologie des Membranes et des Nano-objets (Pessac, France).
Data Analysis
Values are mean ± SEM. Statistical analyses were performed using Prism 5 (GraphPad, La Jolla, CA, USA). Two way-ANOVA analyses followed by a post-hoc Bonferroni test were used to compare body weight as a function of diet and time. Statistical comparisons between diets for plasma and brain metabolites were performed using non-parametric one-way ANOVA (Kruskal–Wallis analysis followed by a post-hoc test of Dunn). A p < 0.05 was considered statistically significant.
Results
Body Mass and Food Intake
Control rats had a constant weight gain of 30 g per week during the first 3 weeks linked to normal growth, followed by a gain of 15 g per week until the end of the protocol. HF and Et rats showed similar weight gain curves (Figure 1A) but had a lower weight gain than the CT group. The difference became statistically significant at day 10 and remained until the end of the protocol, corresponding to a final difference of 19% for HF group and 16% for the Et group. HFEt rats exhibited the lowest weight gain relative to rats on other diets, leading to a final reduction of 28% compared to CT rats and a mean difference of 18% compared to HF and Et rats. The difference became statistically significant at day 17 compared to both HF and Et groups. It is important to notice that such significant differences in weight gain were observable while all diets were isocaloric and caloric intake tends to be equivalent between groups (Figure 1B).
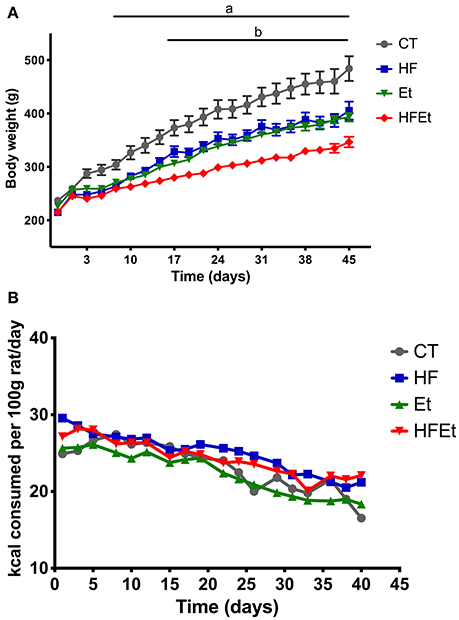
Figure 1. Body weight (A) and food intake (B) of rats fed with control diet (CT), high fructose diet (HF), ethanol (Et), or a mix (HFEt) during 6 weeks. Values are mean ± SEM (n = 8/diet for each time point). a: Statistical difference between CT vs. HF, Et, and HFEt from the 10th day until the end of the protocol. b: Statistical difference between HFEt vs. HF and Et from the 17th day until the end of the protocol.
Plasma Measurements
Prior to the infusion of [1-13C]glucose, systemic glucose metabolism impairment was assessed in each group by determining the glycemia/insulinemia blood ratio. For the HF and Et groups, the ratio tended to be higher than in the CT group, while this difference was significant only for the HFEt rats (Figure 2).

Figure 2. Ratio glycemia/insulinemia in rats after 6-week diet with either control (CT), high fructose (HF), ethanol (Et), or a mix diet (HFEt) and prior infusion of [1-13C]D-glucose. Glucose and insulin content were measured in a blood sample collected just before [1-13C]glucose infusion and after 6 weeks of diet to detect any disturbance in insulin and therefore glucose metabolism homeostasis at this time point. Values are mean ± SEM. *Statistical difference between CT and HFEt.
Biochemical assays were also performed on plasma collected after the [1-13C]glucose infusion and are summarized in Table 2. No significant difference was observed between groups regarding proteins and albumin, which are nutritional markers indicating adequate dietary intakes. Total cholesterol, HDL-cholesterol and FFA were unchanged among groups. In contrast, plasmatic triglycerides (TG) tended to increase in the HF group and were significantly raised by 69% in the HFEt group.
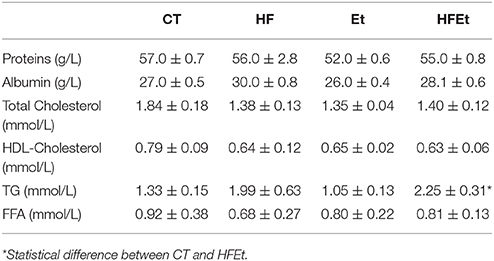
Table 2. Biochemical assays on plasma in rats fed during 6 weeks with Control (CT), High Fructose (HF), Ethanol (Et), or a mix (HFEt) diet.
Brain Metabolism by HRMAS NMR Spectroscopy
The Specific Enrichment of Glucose (% 13C) in Brain
The specific enrichment of glucose C1 (% 13C; Glc C1 SEnr) was determined on 1H spectra to evaluate the 13C-enrichment obtained in the brain following 1h of [1-13C]glucose infusion. Glc C1 SEnr in Et and HFEt groups were 21.6 and 18.7%, respectively, slightly higher than the one measured in CT (17.4%) and HF (15.5%) groups (Figure 3).
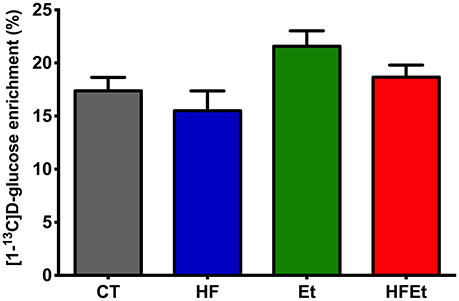
Figure 3. Specific enrichment of glucose 13C (% 13C) obtained in the brain following 1 h of [1-13C]D-glucose infusion in rats fed with control (CT), high fructose (HF), ethanol (Et), or a mix diet (HFEt). Specific enrichments were normalized to the Glucose C1 specific enrichment in each group.
Relative Enrichment of Glu C2/C3 and Gln C2/C3
From 13C spectra, the relative enrichments (comparison of 13C incorporation between different carbons in the same molecule) for glutamate and glutamine were determined. Classically, glutamate, present in greater quantity in neurons, represents the neuronal compartment whereas glutamine, synthetized only in astrocytes, represents the astrocytic compartment. Therefore, these measurements are used to determine if [1-13C]glucose is preferentially metabolized in astrocytes (C2/C3 Gln>1; due to the activity of pyruvate carboxylase (PC) present only in astrocytes) or in the neuronal compartment (C2/C3 Glu around 1; no pyruvate carboxylase activity) (For a schematic representation of the fate of 13C see Figure 4 in which labeling linked to PC is marked as an open circle whereas the one linked to pyruvate dehydrogenase is represented by a filled circle). No variation in the Glu C2/C3 ratio was observed between groups (Table 3). Compared to the CT group, the Gln C2/C3 ratio was significantly increased by 30.6% in HF, 36.1% in Et and 28.7% in HFEt groups, which indicates an increase in the astrocytic PC activity.
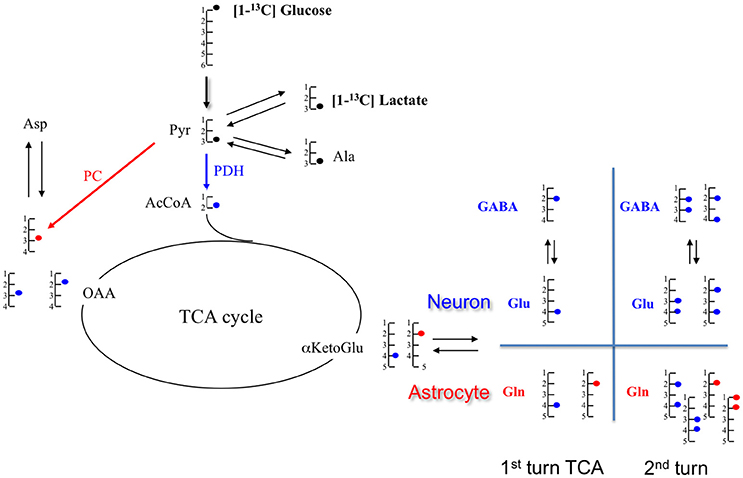
Figure 4. Schematic representation of metabolite labeling from [1-13C]glucose during the first tricarboxylic acid (TCA) cycle turn. In astrocytes, [1-13C]glucose follows either the pyruvate dehydrogenase (PDH;  ) or the pyruvate carboxylase (PC;
  ), but only the PDH pathway occurs in neurons. At the end of the glycolysis, [1-13C]glucose provides [3-13C]pyruvate which can take two paths: either pyruvate dehydrogenase (PDH; ) or pyruvate carboxylase (PC; ). In the PDH pathway, [3-13C]pyruvate gives [2-13C]AcCoA which enters in the TCA cycle and leads to [4-13C]citrate, then to [4-13C] αKG. This intermediate αKG forms [4-13C]glutamate, which is metabolized in [4-13C]glutamine. Through TCA cycle, by the symmetry of some intermediates, [4-13C]αKG gives two isotopomers of OAA: [2-13C]OAA (50%) and [3-13C]OAA (50%). Then, it provides Asparate labeled in [2-13C] (50%) and [3-13C](50%). In the PC pathway (only in astrocyte compartment), [3-13C]pyruvate is converted in [3-13C]OAA which enters TCA cycle to form [2-13C]αKetoGlu which leads to [2-13C]glutamate and then to [2-13C]glutamine. α-KG, α-ketoglutarate; Ala, alanine; AcCoA, acetyl-CoA; Glu, glutamate; Gln, glutamine; GABA, γ-aminobutyric acid; Lac, lactate; OAA, oxaloacetate.
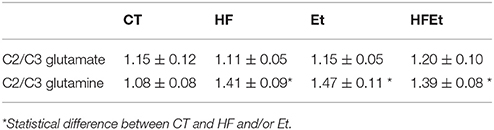
Table 3. Ratios C2/C3 glutamate and C2/C3 glutamine measured by 13C NMR HRMAS in brain perchloric extract of rat who followed Control (CT), High Fructose 20% (HF), Ethanol (Et), or a mix diet (HFEt).
13C Enrichment of Brain Metabolites
From POCE spectra, brain metabolite 13C enrichments (percentage of 13C incorporated in a metabolite at a specific carbon position) were measured (Figure 5). In each diet group, Glc C1 SEnr previously measured was used to normalize 13C enrichments of brain metabolites and thus compare groups between them. Most of the cerebral metabolites 13C enrichments increased significantly in the HF group compared to the CT group; alanine C3 +19% (p = 0.03), aspartate C3 +37% (p = 0.002), glutamate C3 +75% (p = 0.005), glutamate C4 +24% (p = 0.05), glutamine C3 +26% (p = 0.03), glutamine C4 +24% (p = 0.05), GABA C2 +31% (p = 0.04), GABA C3 +34% (p = 0.02). In comparison to the CT group, brain metabolites 13C enrichments in the Et group tended to increase, except for lactate and GABA. Concerning the mix diet HFEt, it caused an increase of a magnitude, which is intermediate between the effect observed for the HF and Et groups for all measured amino acid carbons, except for glutamine C4.
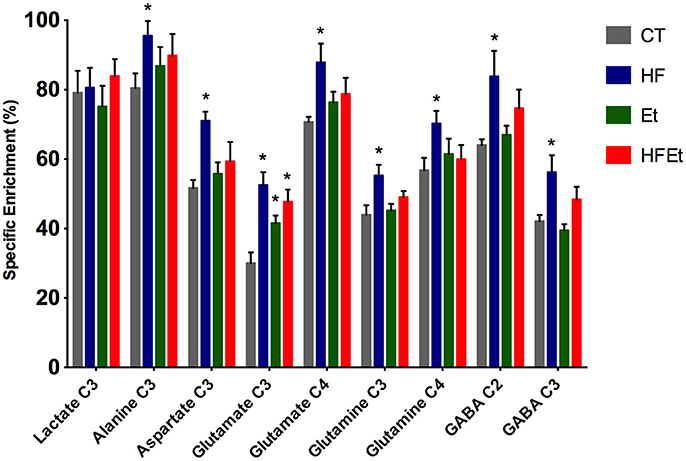
Figure 5. 13C-specific enrichments (%) of some carbon positions of some brain metabolites after 1 h infusion of [1-13C]glucose in rats fed with control (CT), high fructose (HF), ethanol (Et) or mixed (HFEt) diet. *Statistical difference between CT and HF.
Discussion
In the present study, we have evaluated the effects of an intake of fructose (similar as in the Western diet) and/or of a moderate amount of ethanol on cerebral glucose metabolism in young adult rats. Indeed, the brain represents only 2% of the body mass but it consumes up to 25% of the circulating glucose at rest as its main energy source (33). Rodents are a good model to study the effects of alcopop consumption in young people, as they exhibit a very similar fructose metabolism than humans (34, 35). Moreover, the time window for “adolescence” (from 30 to 46 postnatal day) (36) and “late-adolescence” (from 46 to 59 postnatal day) are very convenient and can be related to their human counterparts (23). With our experimental design, we studied the effects on metabolic pathways of fructose and ethanol substrates per se in the case of a normal and isocaloric diet in rats from late-adolescence (postnatal day 53) to adulthood (13 weeks). The caloric intake from beverages in the HFEt group was equivalent to human alcopop consumption of 300 ml per week containing on average 4% of alcohol (185 kcal/week/rat).
Effect of the Diets on Body Weight
Compared to the control group, we measured a lesser weight gain in all treated groups (HF, Et, and HFEt). Since rats were both isocaloric and pair-fed (same amount of caloric intake for all rats independently of their body weight), our results strongly suggest that fructose has a lower energetic efficiency than control chow diet. This weaker weight gain observed in HF fed rats seems at variance with reports of either similar body weight (37–39) or even increased body weight reported in the literature [review in (40)]. However, these differences with others can be explained by our experimental design, which differed from previous studies that used up to 60% fructose in the diet (20% fructose here) and/or the diet was available ad libitum. Nonetheless, in one study performed by Alwahsh et al. (30), conducted in adult Sprague-Dawley rats, a decrease in body weight was measured after 4 and 8 weeks of high fat and 70%-fructose diet. More interestingly, in this study, liver weights did not change between control and rats that underwent the diet, whereas the ratio liver weight/body weight was increased, indicating a change in body composition. Two other studies have shown that fructose diet didn't lead to increased weight when directly administered during 4 months to adult mice [15% fructose in the diet; (41)] or in rat pups after maternal supplementation (42).
In our study, as a consequence of its design and the choice to highlight the substrate effect, no effect linked to an excessive caloric intake can be evidenced. However, after a 6-week period on a 20%-fructose diet, we observed an increase in visceral adipose tissue (data not shown). Taking all together (lesser body weight gain and increase in visceral adipose tissue), our data suggest either a decrease in rat growth and/or a modification of the body composition, a consequence of a decrease in energy efficiency linked to fructose and/or ethanol intake. Since it has been shown that excessive consumption of fructose increases reactive oxygen species (ROS) production and mitochondria impairment in skeletal muscle [for review, see (43)], which could therefore lead to tissue damage, we may hypothesize that change in body composition could be a consequence of such ROS production and either less muscle weight gain or a decrease in global energy efficiency. Moreover, aged rats having a 30% fructose supply during 5 months evidenced an accelerated loss of muscle mass vs. control group by altering the stimulation of postprandial protein synthesis (44); this effect perhaps due to a decrease in insulin sensitivity could participate to a lesser growth in young rats needing a positive energetic balance. A short period of 1 week of high fructose is sufficient in humans to alter the expression of genes involved in the energetic metabolism in skeletal muscle (45).
Concerning the Et diet, we observed a lower body weight gain, a result already found in a previous study in which a lower weight was measured at postnatal day 114 in rats exposed chronically to ethanol vapor since adolescence (22). Such a variation in body weight was also measured after a 20-days exposure to 10%-ethanol gelatin (46).
In the HFEt group, the decreased body weight gain was even more extensive, indicating a synergistic effect of both diets, which is consistent with a previous study showing a combined fructose-ethanol diet resulted in a more apparent decreased body weight gain during the 2nd and 3rd weeks of feeding compared to ethanol group (30).
Effect of the Diets on Plasma Lipid Contents, Glycemia, and Insulinemia
We did not observe any statistical difference in plasmatic markers of lipid metabolism (total cholesterol, HDL-cholesterol, and FFA) between CT, HF and Et groups. Nevertheless, we measured an increase in triglyceridemia in the HFEt group (and a tendency to increase in the HF group), which is in accordance with the fact that high fructose diet can induce dyslipidemia (11, 14, 16) and early liver fatty acid deposit with lipid microvacuoles, a phenomenon that we observed after 6 weeks of diet (Supplementary Figure 1).
A higher dose of fructose and ethanol (30% of each substrates in the diet for 4 weeks) has been shown to significantly elevate blood insulin (31). In our study, plasmatic ratio glucose/insulin was increased after all diets, compared to control, but this increase was only significant in the HFEt group. This increase indicates that insulin homeostasis has been disturbed at the examined time point. It's now well-known that fructose and ethanol diets alter hepatic metabolism (47, 48). By contrast to glucose, fructose and ethanol do not require insulin for their metabolism (29) and it has been shown that both molecules can impair insulin sensitivity (49–53), a result observed in our study.
Effect of Fructose on Brain Oxidative Metabolism
Fructose enters the brain through Glucose Transporter 5 (GLUT5), which is found in the blood-brain barrier endothelial cells (54). In the brain, GLUT5 is expressed in microglial cells (55–57). However, some studies have found that GLUT5 can also be expressed in Purkinje cells in mouse cerebellum, together with the specialized enzymes ketohexokinase (fructokinase), aldolase, and triokinase, three enzymes important for the fructose-specific metabolic pathway (58). In a more recent study conducted in rats, in addition to microglia and Purkinje cells, GLUT5 was localized in hypothalamic neurons as well as in tanycyte processes (57). However, even if fructose was shown to be metabolized by the brain (59), its metabolism is low compared to the one of glucose.
13C-NMR spectroscopy is a powerful tool to study metabolism but with a low sensitivity. Only molecules above the mM range can be detected and it also requires the infusion of 13C-labeled precursor. In this study, [1-13C]glucose infusion allowed the following of brain glucose metabolism [for an overview of the fate of 13C in brain metabolism, see (60, 61)], the main brain substrate, and was chosen to reflect the impact of the diet. Indeed, if any metabolic adaptation was established during fructose and/or ethanol intake, we will be able to observed it through the [1-13C]glucose pathway and 13C distribution. For the first time, a significant raise in 13C-specific enrichment in intermediate metabolites (alanine, aspartate, glutamate, glutamine, and GABA) has been measured in HF rats, as well a small raise in Et group and an intermediate increased enrichment for HFEt animals. However, this increase was only statistically significant in the HF group. This means that even if ethanol and ethanol+fructose may modify metabolism, the major impact was linked to the fructose diet.
13C-labeling of glutamate and aspartate reflects neuronal glucose oxidative metabolism through the TCA cycle with formation of 13C-labeled α-ketoglutarate and oxaloacetate, from which these two amino acids are formed, respectively. Since glutamine synthetase is present only in astrocytes (62), labeling of glutamine reflects astrocytic oxidative metabolism. An increase in the specific enrichments of these amino acids indicates that oxidative metabolism was increased in the brain after fructose dietary supplementation. Interestingly, lactate C3 specific enrichment was unchanged whereas alanine C3 specific enrichment was increased. Alanine enrichment reflects the one of pyruvate. This indicates that pyruvate, formed at the end of the glycolysis, is mainly directed toward oxidative metabolism rather than lactate production, a pathway that is predominant in astrocytes (63). Finally, glutamate and glutamine C3 specific enrichments also increased. Since these carbons are labeled during the second TCA cycle turn, an increase of 13C incorporation into these carbon positions indicates that the TCA cycle is turning faster (C3/C4 ratios increased). Taken altogether, our data show a relative increase in oxidative metabolism compared to glycolytic lactate production after the fructose diet.
Such an increase in mitochondrial metabolism was already observed when insulin-resistance is present (64–66). Another study, in which fructose was administered during gestation and lactation, (42) demonstrated that maternal exposure to fructose led to a significant increase in state 3 respiration in rat pup brains, as well as a decrease in the Phosphate/Oxygen (P/O2) ratio, indicating a lower efficiency of the respiratory chain and an increase in mitochondrial metabolism to compensate for this lower ATP production (mitochondrial decoupling).
Effect of Fructose on Astrocytic Metabolism
In the brain, it has been proposed that a metabolic compartmentation occurs, the astrocytes being more glycolytic and the neurons more oxidative. This leads to a lactate shuttle between astrocytes and neurons, a metabolic cooperation still debated nowadays but more and more admitted [for a review see (67). In our study, we found that lactate C3 specific enrichment was unchanged whereas specific enrichments of amino acids linked to the TCA cycle were increased. This relative increase in oxidative metabolism compared to glycolytic lactate production after the fructose diet may have an impact on cognitive functions. Indeed, it has been shown that fructose diet may impact memory (41), and, in parallel, that lactate shuttling between astrocytes and neurons through the monocarboxylate transporters (MCT) is necessary for long-term memory formation (68). In a more recent study, the down regulation of the neuronal lactate transporter, MCT2, in the barrel cortex of rat suppressed the blood-oxygen-level dependent (BOLD) effect observed in functional magnetic resonance imaging (MRI) when the whisker were activated, suggesting impairment of the synaptic activity when this lactate shuttle is suppressed (69).
The metabolic modification after the HF diet can also be observed through the relative enrichments of the different glutamine carbons. Indeed, glutamine C2/C3 ratio increased in the HF group. An increase in this ratio reflects an increase in the pyruvate carboxylase (PC) pathway (70). PC is the predominant anaplerotic enzyme in the brain and is exclusively located in astrocytes (71). This enzyme allows the conversion of pyruvate directly into oxaloacetate and is activated by AcCoA. Therefore, an increase in the glutamine C2/C3 ratio indicates that a greater amount of pyruvate is directed toward the TCA cycle rather than being converted into lactate. These data strengthened the conclusion that fructose diet alters metabolism in astrocytes. The relative decrease in lactate production compared to oxidative metabolism after fructose diet suggests a remodeling of astrocytic metabolism, a decrease of glycolysis in these cells, which may have a role in this memory impairment. This hypothesis is supported by preliminary results obtained by in vivo diffusion MRI on HF rat brains after 5 weeks of diet: a 18, 13, and 20%-decrease in fractional anisotropy were measured (Supplementary Figure 2) compared to control in the cortex, hippocampus and striatum, respectively, indicating a decrease in fiber organization and/or myelination (72) in a period of critical brain maturation.
Conclusion
In this study, we followed the effects induced by a high fructose diet (20%) combined or not to a moderate amount of alcohol in young rats. We provide here evidence that in the case of a combined fructose and moderate dose of ethanol consumption, under isocaloric conditions, fructose has the biggest impact on brain metabolism and increases oxidative metabolism. These early alterations show that the brain is vulnerable at the metabolic level to fructose consumption during late-adolescence throughout adulthood in rats. Brain metabolic remodeling appears to occur precociously without a concurrent increase in overall energy intake and seems consequently to be linked to fructose itself. These disturbances should be more explored to elucidate deleterious long-term outcomes, such as memory impairments, as recently proposed (73).
Author Contributions
DE and A-KB-S: Performed experiments; DE, J-LG, HG, M-CB and A-KB-S: Performed interpretation and wrote article.
Conflict of Interest Statement
The authors declare that the research was conducted in the absence of any commercial or financial relationships that could be construed as a potential conflict of interest.
Acknowledgments
This work was supported by grants from the Institut de Recherche Scientifique sur les Boissons (IREB becoming FRA). The authors thank Julien Gaitan and Dr. Jochen Lang (ICMN-UMR5248 Université Bordeaux, Pessac, France) for their technical support in insulin assay, Prof de Mascarel Anatomopathology lab, CHU hospital (Haut-Lévêque) for histology and Jérôme Naulin and Gérard Raffard for diffusion MRI. A-KB-S has received financial support from the French State in the context of the Investments for the future Programme IdEx and the LabEx TRAIL, reference ANR-10-IDEX and ANR-10-LABX-57, and a French-Swiss ANR-FNS grant reference ANR-15-CE37-0012.
Supplementary Material
The Supplementary Material for this article can be found online at: https://www.frontiersin.org/articles/10.3389/fnut.2018.00033/full#supplementary-material
Supplementary Figure 1. Histology of liver from control (A) and HF rats (B) fed with control diet or 20%-high fructose diet during 6 weeks. Representative hematoxylin–eosin–saffron (HES) and Periodic Acid Schiff (PAS) stainings. Inclusion of lipid droplets are detected in (C).
Supplementary Figure 2. Fractional anisotropy values measured from diffusion weighted MRI in the cortex, striatum and hippocampus of control rats (CTL) and rats fed with a high fructose diet during 5 weeks (HF). *Statistical difference between CTL and HF.
References
1. Metzner C, Kraus L. The impact of alcopops on adolescent drinking: a literature review. Alcohol Alcohol. (2008) 43:230–9. doi: 10.1093/alcalc/agm148
2. Federal Trade Commission (2003). Alcohol Marketing and Advertising. A Report to Congress. Available online at: https://www.ftc.gov/sites/default/files/documents/reports/alcohol-marketing-and-advertising-federal-trade-commission-report-congress-september-2003/alcohol08report.pdf (media resource library).
3. Albers AB, Siegel M, Ramirez RL, Ross C, DeJong W, Jernigan DH. Flavored alcoholic beverage use, risky drinking behaviors, and adverse outcomes among underage drinkers: results from the ABRAND Study. Am J Public Health (2015) 105:810–5. doi: 10.2105/AJPH.2014.302349
4. Jones SC, Reis S. Not just the taste: why adolescents drink alcopops. Health Educ. (2011) 112:61–74. doi: 10.1108/09654281211190263
5. Bava S, Tapert SF. Adolescent brain development and the risk for alcohol and other drug problems. Neuropsychol Rev. (2010) 20:398–413. doi: 10.1007/s11065-010-9146-6
6. Elliott SS, Keim NL, Stern JS, Teff K, Havel PJ. Fructose, weight gain, and the insulin resistance syndrome. Am J Clin Nutr. (2002) 76:911–22. doi: 10.1093/ajcn/76.5.911
7. Marriott BP, Olsho L, Hadden L, Connor P. Intake of added sugars and selected nutrients in the United States, National Health and Nutrition Examination Survey (NHANES) 2003-2006. Crit Rev Food Sci Nutr. (2010) 50:228–58. doi: 10.1080/10408391003626223
8. Havel PJ. Dietary fructose: implications for dysregulation of energy homeostasis and lipid/carbohydrate metabolism. Nutr Rev. (2005) 63:133–157. doi: 10.1111/j.1753-4887.2005.tb00132.x
9. Dekker MJ, Su Q, Baker C, Rutledge AC, Adeli K. Fructose: a highly lipogenic nutrient implicated in insulin resistance, hepatic steatosis, and the metabolic syndrome. Am J Physiol Endocrinol Metab. (2010) 299:E685–94. doi: 10.1152/ajpendo.00283.2010
10. Feinman RD, Fine EJ. Fructose in perspective. Nutr Metab. (2013) 10:45. doi: 10.1186/1743-7075-10-45
11. Ross AP, Bartness TJ, Mielke JG, Parent MB. A high fructose diet impairs spatial memory in male rats. Neurobiol Learn Mem. (2009) 92:410–6. doi: 10.1016/j.nlm.2009.05.007
12. Hsu TM, Konanur VR, Taing L, Usui R, Kayser BD, Goran MI, et al. Effects of sucrose and high fructose corn syrup consumption on spatial memory function and hippocampal neuroinflammation in adolescent rats. Hippocampus (2015) 25:227–39. doi: 10.1002/hipo.22368
13. Harrell CS, Burgado J, Kelly SD, Johnson ZP, Neigh GN. High-fructose diet during periadolescent development increases depressive-like behavior and remodels the hypothalamic transcriptome in male rats. Psychoneuroendocrinology (2015) 62:252–64. doi: 10.1016/j.psyneuen.2015.08.025
14. van der Borght K, Kohnke R, Goransson N, Deierborg T, Brundin P, Erlanson-Albertsson C, et al. Reduced neurogenesis in the rat hippocampus following high fructose consumption. Regul Pept. (2011) 167:26–30. doi: 10.1016/j.regpep.2010.11.002
15. Mielke JG, Taghibiglou C, Liu L, Zhang Y, Jia Z, Adeli K, et al. A biochemical and functional characterization of diet-induced brain insulin resistance. J Neurochem. (2005) 93:1568–78. doi: 10.1111/j.1471-4159.2005.03155.x
16. Stranahan AM, Norman ED, Lee K, Cutler RG, Telljohann RS, Egan JM, et al. Diet-induced insulin resistance impairs hippocampal synaptic plasticity and cognition in middle-aged rats. Hippocampus (2008) 18:1085–8. doi: 10.1002/hipo.20470
17. Wu HW, Ren LF, Zhou X, Han DW. A high-fructose diet induces hippocampal insulin resistance and exacerbates memory deficits in male Sprague-Dawley rats. Nutr Neurosci. (2015) 18:323–8. doi: 10.1179/1476830514Y.0000000133
18. Stephan BC, Wells JC, Brayne C, Albanese E, Siervo M. Increased fructose intake as a risk factor for dementia. J Gerontol Ser A Biol Sci Med Sci. (2015) 65:809–14. doi: 10.1093/gerona/glq079
19. Mastrocola R, Nigro D, Cento AS, Chiazza F, Collino M, Aragno M. High-fructose intake as risk factor for neurodegeneration: key role for carboxy methyllysine accumulation in mice hippocampal neurons. Neurobiol Dis. (2016) 89:65–75. doi: 10.1016/j.nbd.2016.02.005
20. Elamin EE, Masclee AA, Dekker J, Jonkers DM. Ethanol metabolism and its effects on the intestinal epithelial barrier. Nutr Rev. (2013) 71:483–99. doi: 10.1111/nure.12027
21. Eckardt MJ, File SE, Gessa GL, Grant KA, Guerri C, Hoffman PL, et al. Effects of moderate alcohol consumption on the central nervous system. Alcohol Clin Exp Res. (1998) 22:998–1040. doi: 10.1111/j.1530-0277.1998.tb03695.x
22. Ehlers CL, Liu W, Wills DN, Crews FT. Periadolescent ethanol vapor exposure persistently reduces measures of hippocampal neurogenesis that are associated with behavioral outcomes in adulthood. Neuroscience (2013) 244:1–15. doi: 10.1016/j.neuroscience.2013.03.058
23. Maldonado-Devincci AM, Badanich KA, Kirstein CL. Alcohol during adolescence selectively alters immediate and long-term behavior and neurochemistry. Alcohol (2010) 44:57–66. doi: 10.1016/j.alcohol.2009.09.035
24. Liu W, Crews FT. Adolescent intermittent ethanol exposure enhances ethanol activation of the nucleus accumbens while blunting the prefrontal cortex responses in adult rat. Neuroscience (2015) 293:92–108. doi: 10.1016/j.neuroscience.2015.02.014
25. Franklin KM, Engleman EA, Ingraham CM, McClaren JA, Keith CM, McBride WJ, et al. A single, moderate ethanol exposure alters extracellular dopamine levels and dopamine d receptor function in the nucleus accumbens of wistar rats. Alcohol Clin Exp Res. (2009) 33:1721–30. doi: 10.1111/j.1530-0277.2009.01009.x
26. Adermark L, Jonsson S, Soderpalm B, Ericson M. Region-specific depression of striatal activity in Wistar rat by modest ethanol consumption over a ten-month period. Alcohol (2013) 47:289–298. doi: 10.1016/j.alcohol.2013.03.003
27. Chefer V, Meis J, Wang G, Kuzmin A, Bakalkin G, Shippenberg T. Repeated exposure to moderate doses of ethanol augments hippocampal glutamate neurotransmission by increasing release. Addict Biol. (2011) 16:229–237. doi: 10.1111/j.1369-1600.2010.00272.x
28. Anderson ML, Nokia MS, Govindaraju KP, Shors TJ. Moderate drinking? Alcohol consumption significantly decreases neurogenesis in the adult hippocampus. Neuroscience (2012) 224:202–9. doi: 10.1016/j.neuroscience.2012.08.018
29. Lustig RH. Fructose: metabolic, hedonic, societal parallels with ethanol. J Am Diet Assoc. (2010) 110:1307–21. doi: 10.1016/j.jada.2010.06.008
30. Alwahsh SM, Xu M, Schultze FC, Wilting J, Mihm S, Raddatz D, et al. Combination of alcohol and fructose exacerbates metabolic imbalance in terms of hepatic damage, dyslipidemia, insulin resistance in rats. PLoS ONE (2014) 9:e104220. doi: 10.1371/journal.pone.0104220
31. Song M, Chen T, Prough RA, Cave MC, McClain CJ. Chronic alcohol consumption causes liver injury in high-fructose-fed male mice through enhanced hepatic inflammatory response. Alcohol Clin Exp Res. (2016) 40:518–28. doi: 10.1111/acer.12994
32. Bouzier AK, Thiaudiere E, Biran M, Rouland R, Canioni P, Merle M. The metabolism of [3-(13)C]lactate in the rat brain is specific of a pyruvate carboxylase-deprived compartment. J Neurochem. (2000) 75:480–6. doi: 10.1046/j.1471-4159.2000.0750480.x
33. Shu HJ, Isenberg K, Cormier RJ, Benz A, Zorumski CF. Expression of fructose sensitive glucose transporter in the brains of fructose-fed rats. Neuroscience (2006) 140:889–95. doi: 10.1016/j.neuroscience.2006.02.071
34. Bar-On H, Stein Y. Effect of glucose and fructose administration on lipid metabolism in the rat. J Nutr. (1968) 94:95–105. doi: 10.1093/jn/94.1.95
35. Mayes PA. Intermediary metabolism of fructose. Am J Clin Nutr. (1993) 58:754S−65S. doi: 10.1093/ajcn/58.5.754S
36. Naneix F, Darlot F, Coutureau E, Cador M. Long-lasting deficits in hedonic and nucleus accumbens reactivity to sweet rewards by sugar overconsumption during adolescence. Eur J Neurosci. (2016) 43:671–80. doi: 10.1111/ejn.13149
37. Huang BW, Chiang MT, Yao HT, Chiang W. The effect of high-fat and high-fructose diets on glucose tolerance and plasma lipid and leptin levels in rats. Diabetes Obes Metab. (2004) 6:120–6. doi: 10.1111/j.1462-8902.2004.00323.x
38. Vasiljevic A, Bursac B, Djordjevic A, Milutinovic DV, Nikolic M, Matic G, et al. Hepatic inflammation induced by high-fructose diet is associated with altered 11βHSD1 expression in the liver of Wistar rats. Eur J Nutr. (2014) 53:1393–402. doi: 10.1007/s00394-013-0641-4
39. Baena M, Sanguesa G, Hutter N, Beltran JM, Sanchez RM, Roglans N, et al. Liquid fructose in Western-diet-fed mice impairs liver insulin signaling and causes cholesterol and triglyceride loading without changing calorie intake and body weight. J Nutr Biochem. (2017) 40:105–15. doi: 10.1016/j.jnutbio.2016.10.015
40. Toop CR, Gentili S. Fructose beverage consumption induces a metabolic syndrome phenotype in the rat: a systematic review and meta-analysis. Nutrients (2016) 8:577. doi: 10.3390/nu8090577
41. Messier C, Whately K, Liang J, Du L, Puissant D. The effects of a high-fat, high-fructose, combination diet on learning, weight, glucose regulation in C57BL/6 mice. Behav Brain Res. (2007) 178:139–45. doi: 10.1016/j.bbr.2006.12.011
42. Mortensen OH, Larsen LH, Orstrup LK, Hansen LH, Grunnet N, Quistorff B. Developmental programming by high fructose decreases phosphorylation efficiency in aging offspring brain mitochondria, correlating with enhanced UCP5 expression. J Cereb Blood Flow Metab. (2014) 34:1205–11. doi: 10.1038/jcbfm.2014.72
43. Madlala HP, Maarman GJ, Ojuka E. Uric acid and transforming growth factor in fructose-induced production of reactive oxygen species in skeletal muscle. Nutr Rev. (2016) 74:259–66. doi: 10.1093/nutrit/nuv111
44. Gatineau E, Savary-Auzeloux I, Migné C, Polakof S, Dardevet D, Mosoni L. Chronic intake of sucrose accelerates sarcopenia in older male rats through alterations in insulin sensitivity and muscle protein synthesis. J Nutr. (2015) 145:923–30. doi: 10.3945/jn.114.205583
45. Seyssel K, Segrestin B, Meugnier E, Lê K., Disse E, Blond E, et al. CO-40: La régulation du métabolisme énergétique et de la fonction mitochondriale dans le muscle squelettique à la suite d'une surnutrition en fructose chez des sujets apparentés diabétiques de type 2. Diabetes Metab. (2016) 42:A12–3. doi: 10.1016/S1262-3636(16)30058-1
46. Spoelder M, Tsutsui KT, Lesscher HM, Vanderschuren LJ, Clark JJ. Adolescent alcohol exposure amplifies the incentive value of reward-predictive cues through potentiation of phasic dopamine signaling. Neuropsychopharmacology (2015) 40:2873–85. doi: 10.1038/npp.2015.139
47. Zakhari S. Overview: how is alcohol metabolized by the body? Alcohol Res Health (2006) 29:245–54.
48. Cederbaum AI. Alcohol metabolism. Clin Liver Dis. (2012) 16:667–85. doi: 10.1016/j.cld.2012.08.002
49. Beck-Nielsen H, Pedersen O, Lindskov HO. Impaired cellular insulin binding and insulin sensitivity induced by high-fructose feeding in normal subjects. Am J Clin Nutr. (1980) 33:273–8. doi: 10.1093/ajcn/33.2.273
50. Avogaro A, Fontana P, Valerio A, Trevisan R, Riccio A, Del Prato S, et al. Alcohol impairs insulin sensitivity in normal subjects. Diabetes Res. (1987) 5:23–7.
51. Shah JH. Alcohol decreases insulin sensitivity in healthy subjects. Alcohol Alcohol. (1988) 23:103–9.
52. Shelmet JJ, Reichard GA, Skutches CL, Hoeldtke RD, Owen OE, Boden G. Ethanol causes acute inhibition of carbohydrate, fat, and protein oxidation and insulin resistance. J Clin Invest. (1988) 81:1137–45. doi: 10.1172/JCI113428
53. Khitan Z, Kim DH. Fructose: a key factor in the development of metabolic syndrome and hypertension. J Nutr Metab. (2013) 2013:682673. doi: 10.1155/2013/682673
54. Mantych GJ, Hageman GS, Devaskar SU. Characterization of glucose transporter isoforms in the adult and developing human eye. Endocrinology (1993) 133:600–7. doi: 10.1210/endo.133.2.8344201
55. Payne J, Maher F, Simpson I, Mattice L, Davies P. Glucose transporter Glut 5 expression in microglial cells. Glia (1997) 21:327–31.
56. Vannucci SJ, Maher F, Simpson IA. Glucose transporter proteins in brain: delivery of glucose to neurons and glia. Glia (1997) 21:2–21.
57. Kojo A, Yamada K, Yamamoto T. Glucose transporter 5 (GLUT5)-like immunoreactivity is localized in subsets of neurons and glia in the rat brain. J Chem Neuroanat. (2016) 74:55–70. doi: 10.1016/j.jchemneu.2016.03.004
58. Funari VA, Herrera VL, Freeman D, Tolan DR. Genes required for fructose metabolism are expressed in Purkinje cells in the cerebellum. Brain Res Mol Brain Res. (2005) 142:115–22. doi: 10.1016/j.molbrainres.2005.09.019
59. Hassel B, Elsais A, Froland AS, Tauboll E, Gjerstad L, Quan Y, et al. Uptake and metabolism of fructose by rat neocortical cells in vivo and by isolated nerve terminals in vitro. J Neurochem. (2015) 133:572–81. doi: 10.1111/jnc.13079
60. Bouzier-Sore AK, Merle M, Magistretti PJ, Pellerin L. Feeding active neurons: (re)emergence of a nursing role for astrocytes. J Physiol. (2002) 96:273–82. doi: 10.1016/S0928-4257(02)00016-5
61. Rodrigues TB, Valette J, Bouzier-Sore AK. C NMR spectroscopy applications to brain energy metabolism. Front Neuroenerget. (2013) 5:9. doi: 10.3389/fnene.2013.00009
62. Martinez-Hernandez A, Bell KP, Norenberg MD. Glutamine synthetase: glial localization in brain. Science (1977) 195:1356–8. doi: 10.1126/science.14400
63. Bouzier-Sore AK, Pellerin L. Unraveling the complex metabolic nature of astrocytes. Front Cell Neurosci. (2013) 7:179. doi: 10.3389/fncel.2013.00179
64. Turner N, Bruce CR, Beale SM, Hoehn KL, So T, Rolph MS, et al. Excess lipid availability increases mitochondrial fatty acid oxidative capacity in muscle: evidence against a role for reduced fatty acid oxidation in lipid-induced insulin resistance in rodents. Diabetes (2007) 56:2085–92. doi: 10.2337/db07-0093
65. Hoeks J, Briede JJ, de Vogel J, Schaart G, Nabben M, Moonen-Kornips E, et al. Mitochondrial function, content and ROS production in rat skeletal muscle: effect of high-fat feeding. FEBS Lett. (2008) 582:510–6. doi: 10.1016/j.febslet.2008.01.013
66. Ara I, Larsen S, Stallknecht B, Guerra B, Morales-Alamo D, ersen JL, et al. Normal mitochondrial function and increased fat oxidation capacity in leg and arm muscles in obese humans. Int J Obes. (2011) 35:99–108. doi: 10.1038/ijo.2010.123
67. Pellerin L, Bouzier-Sore AK, Aubert A, Serres S, Merle M, Costalat R, et al. Activity-dependent regulation of energy metabolism by astrocytes: an update. Glia (2007) 55:1251–62. doi: 10.1002/glia.20528
68. Suzuki A, Stern SA, Bozdagi O, Huntley GW, Walker RH, Magistretti PJ, et al. Astrocyte-neuron lactate transport is required for long-term memory formation. Cell (2011) 144:810–23. doi: 10.1016/j.cell.2011.02.018
69. Mazuel L, Blanc J, Repond C, Bouchaud V, Raffard G, Deglon N, et al. A neuronal MCT2 knockdown in the rat somatosensory cortex reduces both the NMR lactate signal and the BOLD response during whisker stimulation. PLoS ONE (2017) 12:e0174990. doi: 10.1371/journal.pone.0174990
70. Merle M, Bouzier-Sore AK, Canioni P. Time-dependence of the contribution of pyruvate carboxylase versus pyruvate dehydrogenase to rat brain glutamine labelling from [1-(13) C]glucose metabolism. J Neurochem. (2002) 82:47–57. doi: 10.1046/j.1471-4159.2002.00924.x
71. Shank RP, Bennett GS, Freytag SO, Campbell GL. Pyruvate carboxylase: an astrocyte-specific enzyme implicated in the replenishment of amino acid neurotransmitter pools. Brain Res. (1985) 329:364–7. doi: 10.1016/0006-8993(85)90552-9
72. Qiu A, Mori S, Miller MI. Diffusion tensor imaging for understanding brain development in early life. Annu Rev Psychol. (2015) 66:853–76. doi: 10.1146/annurev-psych-010814-015340
Keywords: high fructose, moderate ethanol, alcopops, designer drinks, 13C NMR, brain metabolism, astrocytes, rat
Citation: El Hamrani D, Gin H, Gallis J-L, Bouzier-Sore A-K and Beauvieux M-C (2018) Consumption of Alcopops During Brain Maturation Period: Higher Impact of Fructose Than Ethanol on Brain Metabolism. Front. Nutr. 5:33. doi: 10.3389/fnut.2018.00033
Received: 06 February 2018; Accepted: 18 April 2018;
Published: 08 May 2018.
Edited by:
Juan P. Bolanos, Universidad de Salamanca, SpainReviewed by:
Preeti Hasmukh Jethwa, University of Nottingham, United KingdomGiuseppe Paglia, EURAC Research, Italy
Angus M. Brown, University of Nottingham, United Kingdom
Copyright © 2018 El Hamrani, Gin, Gallis, Bouzier-Sore and Beauvieux. This is an open-access article distributed under the terms of the Creative Commons Attribution License (CC BY). The use, distribution or reproduction in other forums is permitted, provided the original author(s) and the copyright owner are credited and that the original publication in this journal is cited, in accordance with accepted academic practice. No use, distribution or reproduction is permitted which does not comply with these terms.
*Correspondence: Anne-Karine Bouzier-Sore, anne-karine.bouzier-sore@u-bordeaux.fr
†These authors have contributed equally to this work.