 Wybe J. M. van der Kemp1*
 Bertine L. Stehouwer1Jurgen H. Runge2Jannie P. Wijnen1Aart J. Nederveen2Peter R. Luijten1Dennis W. J. Klomp1
- 1Radiology, University Medical Center Utrecht, Utrecht, Netherlands
- 2Radiology, Academic Medical Center, Amsterdam, Netherlands
Purpose: The identification of the phosphodiester (PDE) 31P MR signals in the healthy human breast at ultra-high field.
Methods: In vivo 31P MRS measurements at 7 T of the PDE signals in the breast were performed investigating the chemical shifts, the transverse- and the longitudinal relaxation times. Chemical shifts and transverse relaxation times were compared with non-ambiguous PDE signals from the liver.
Results: The chemical shifts of the PDE signals are shifted −0.5 ppm with respect to glycerophosphocholine (GPC) and glycerophosphoethanolamine (GPE), and the transverse and longitudinal relaxation times for these signals are a factor 3 to 4 shorter than expected for aqueous GPC and GPE.
Conclusion: The available experimental evidence suggests that GPC and GPE are not the main source of the PDE signals measured in fibroglandular breast tissue at 7 T. These signals may predominantly originate from mobile phospholipids.
Introduction
The phosphomonoesters (PME), phosphocholine (PC) and phosphoethanolamine (PE), and the phosphodiesters (PDEs), glycerophosphocholine (GPC) and glycerophosphoethanolamine (GPE), are involved in cell membrane metabolism. From ex vivo studies, it is known that the PC/GPC ratio goes up on malignant transformation of cells (1, 2), while the decrease of the PC/GPC ratio was shown to be a marker in predicting cancer treatment response in ex vivo NMR studies (2–4). In vivo, the total choline signal, which can be obtained by localized 1H MRS, has been shown to be a biomarker for malignancy and treatment response (5). In contrast to in vivo 1H MRS, where only a total choline signal can be observed, one can easily distinguish PME from PDEs with in vivo 31P MRS and even PE from PC and GPE from GPC, with ultra-high field 31P MRS (6). Besides higher spectral resolution, ultra-high field MRS comes with a higher signal-to-noise ratio that can be traded off for improving spatial resolution or to shorten scan time. High in vivo PME/PDE ratios, as measured with 31P MRS, have been shown to be indicative of cancer, while treatment response is often accompanied by a reduction in PME/PDE (7–12). However, in contrast to some ex vivo methods, where extraction techniques are used to separate aqueous pools of metabolites from lipid pools, in vivo methods will also obtain signals from membrane phospholipids (MPL) (13, 14). Moreover, as these MPL have chemical shifts similar to GPC, e.g., glycerophosphatidylethanolamine (GPtE) has almost identical chemical shift as GPC (15, 16) (the molecular structures and chemical shifts are shown in Figure 1) – in vivo distinction of these compounds is hampered.
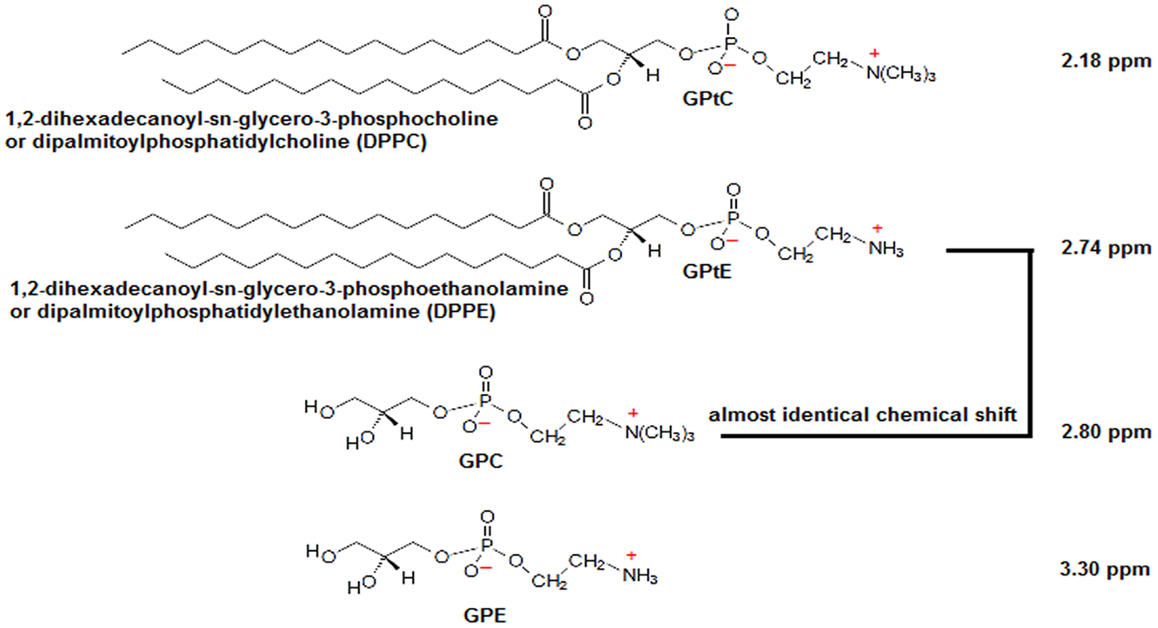
Figure 1. Molecular structures of GPC, GPE, and their membrane phospholipids GPtC and GPtE. Chemical shift of GPC is taken as a reference at 2.80 ppm. Chemical shift differences Δδ(GPtE−GPtC) = 0.56 ppm and (GPC−GPtC) = 0.62 ppm were calculated from high-resolution spectra (spectral resolution <0.02 ppm) by Schiller and Arnold (15), and Δδ(GPE−GPC) = 0.50 ppm from Payne et al. (16).
At lower field strength (<2.5 T), in vivo 31P spectra of various tissues, e.g., breast (17, 18), brain (19–24), liver (25–28), and kidney (29, 30), show a large signal in the PDE chemical shift range, with its top between 2 and 3 ppm with respect to phosphocreatine (PCr) at 0 ppm. The full width at half max of this signal is dependent on the field strength, and the delay between excitation and acquisition, as, for instance, caused by phase encoding. It has been suggested (21, 25) that this membrane peak disappears almost completely at high-field strength due to enhanced relaxation by chemical shift anisotropy, leaving only the signals of the aqueous-soluble metabolites GPC and GPE. Nowadays, with high magnetic field human MRI systems becoming available, the origin of the PDE 31P MRS signal – whether GPC and GPE, and/or GPtC and GPtE – is of renewed interest.
Here, we show that the PDE signals measured in vivo in fibroglandular tissue of the human breast (31P signal from breast fatty tissue is below the detection limit) at 7 T are possibly signals from MPL, although their line widths suggest aqueous small molecules, such as GPC and GPE. Measurements are performed at 7 T to distinguish GPE from GPC and GPtE from GPtC. Adiabatic multi-echo spectroscopic imaging (AMESING) (31) and progressive saturation are used to identify the mobility of the molecules as reflected in the T2- and T1-values, respectively, to enable a distinction between the aqueous GPE and GPC from the more restricted MPL (GPtE and GPtC). Data are obtained in breast glandular tissue and compared to GPC and GPE metabolite signals as measured in liver tissue, all in healthy human volunteers in vivo.
Materials and Methods
31P MRS measurements of glandular breast tissue were obtained from healthy volunteers using a dedicated breast coil (MR Coils BV, Drunen, The Netherlands) interfaced to a 7-T MRI system (Philips, Cleveland, OH, USA). Pulse-acquire and multi-echo acquisitions [AMESING (31)] were obtained with adiabatic RF pulses. Excitation was done with an adiabatic half passage (AHP) of 2 ms. For refocusing 4 ms B1 insensitive rotation pulses (BIR-4 180°) were used. The AHP excitation pulse had a frequency sweep of 10.0 kHz and the BIR-4 refocusing pulses a frequency sweep of 20.0 kHz. Both pulses had tangent frequency modulation and hyperbolic tangent amplitude modulation as described in Garwood and Ke (32). Pulses were driven with γB1max = 1700 Hz. Transmitter offset on the 31P channel was set to 600 Hz with respect to the resonance of PCr. All chemical shifts reported here are referenced to PCr as standard at a chemical shift of 0.0 ppm, which is −2.48 ppm compared to 85% phosphoric acid. Frequency calibration of the scanner is done based on the water signal (the MR system uses a fixed ratio between 31P and 1H carrier frequency such that the proton signal for water corresponds to the 31P PCr signal). Measurements with the AMESING sequence were performed with a TR of 6 s, 8 × 8 × 8 spherical acquired MRSI, 2 cm × 4 cm × 4 cm voxel sizes for the breast on five volunteers.
Both FID and symmetric echoes were acquired with 256 data points, and the spectral bandwidth for the acquisition of the FID was 17.0 kHz and for the echoes 8.5 kHz (echo spacing 45 ms) to maintain equal acquisition durations for FID and each half echo. Acquired data were spatially Hamming filtered and zero filled in the time domain to 8192 data points. To obtain high SNR spectra of the breast, the datasets of five volunteers (age range 24–30 years) were pooled and Pi-weighted based on the FID signal. Phosphorus metabolite T1-values in the breast were measured for five volunteers by means of progressive saturation with an adiabatic AHP pulse-acquire 1D MRSI sequence with TR values in the range of 0.5–8 s, where the scan time was kept identical for each TR. The FID data were acquired with 512 data points and a spectral bandwidth of 8.2 kHz. A 1D MRSI encoded in the anterior–posterior direction was chosen to effectively suppress signals from the underlying pectoral muscles. Data were spatially Hamming filtered and subsequently zero filled in the time domain to 8192 data points. To obtain high SNR datasets for T1-fitting, the volunteers were measured two or three times and the data per volunteer were averaged. Before averaging, all spectra were aligned for Pi. Averaged spectra were spectrally fitted in JMRUI (33) using the AMARES algorithm (34), chemical shifts for the GPtE + GPC and GPtC resonances were fixed with a soft constraint to 2.77 ± 0.1 ppm and 2.18 ± 0.1 ppm and free but equal line width.
31P MRS liver measurements were also done with the AMESING sequence with 32 × 10 2D MRSI (feet–head direction unlocalized) voxel sizes 1 cm × 1 cm (echo spacing 40 ms) on five volunteers for the liver [data included from earlier study (35)], using a half volume coil (MR Coils BV, Drunen, The Netherlands). Other parameters and data post-processing and analysis were equal to those used in the breast measurements. Here, a 2D scheme with small AP and LR dimensions of the voxels was chosen to be able to exclude signal from muscle tissue, whereas the FH dimension is unlocalized but constrained by the coil sensitivity to encompass the liver but not beyond.
The study was approved by the local medical ethics review board (METC UMC Utrecht) and written informed consent was obtained from all volunteers.
Results
In Figure 2, the spectra of a voxel of the breast (average spectrum of five volunteers) and the liver (five volunteers) are shown. Due to limited bandwidth of the adiabatic pulses only the spectral range from +10 to −10 ppm is shown. The chemical shifts of the GPC and GPE signals in the liver (Figure 2C) do not correspond to the signals observed in the breast spectra (Figures 2A,B), which are usually labeled GPC and GPE, while the chemical shifts of the other metabolites (PE, PC, Pi, γ-ATP, α-ATP) in liver and breast do match. Figures 2A,B show, for a voxel of breast glandular tissue, the average FID and the average T2-weighted echo-sum spectra using a fixed T2 weighting of 154 ± 5 ms (36), scaled to the same noise. Note that the signal intensities of the peaks labeled PE, PC, Pi, and (GPtE + GPC) increase, or at least do not decrease, in the echo-sum spectrum as compared to the FID spectrum of the breast, while the signals of GPtC and ATP, with known short T2-values, do decrease in the echo-sum spectrum. Unlike ATP, the short apparent T2 for GPtC (and GPtE) is not the result of homonuclear coupling. In Figure 3, a comparison is made between T2 fits obtained for the PDE signal at 2.2 ppm (labeled GPtC) from the breast (a) and the 2.8 ppm signal from the liver (labeled GPC), showing almost a factor 3 lower T2 for the GPtC signal from the breast. Figure 4 shows the T1-fits for the average signals of (GPtE + GPC) and GPtC from fibroglandular breast tissue as measured in the five volunteers. The (GPtE + GPC) signal is fitted bi-exponentially with a short T1 component for GPtE (taken equal to GPtC, T1 = 1.2 s) The T1-value that is fitted for the long T1 component GPC is 3.2 s.
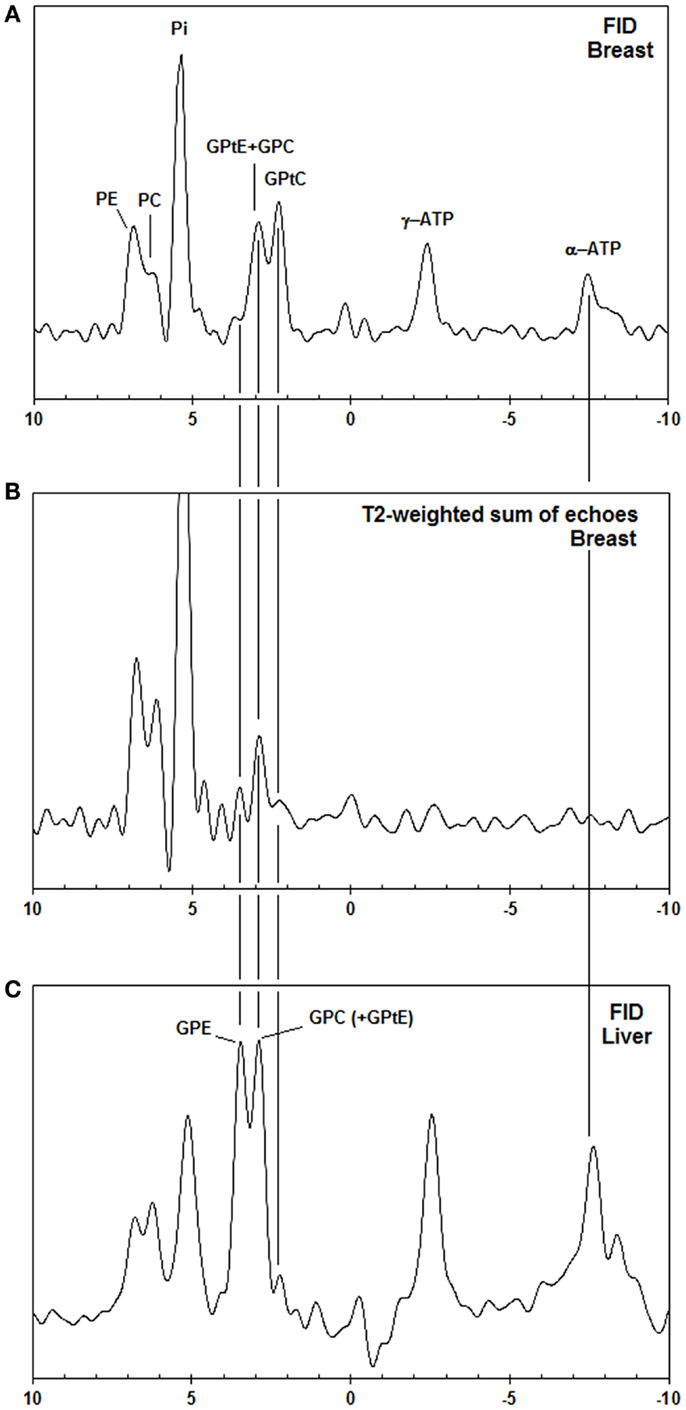
Figure 2. (A) Pulse acquire, (B) T2-weighted echo sum (T2 = 154 ms) 31P MR spectra [AMESING sequence (31)] from a voxel (2 cm × 4 cm × 4 cm) of the breast (average of five volunteers) scaled to the same noise, and (C) pulse-acquire 31P MR spectrum from the liver (average of five volunteers). Note that only the aqueous metabolites with long T2-values, such as PE, PC, Pi, and GPC get enhanced in the T2-weighted echo sum and that the chemical shifts of liver GPE and GPC do not match the PDE signals from the breast, but are shifted +0.5 ppm.
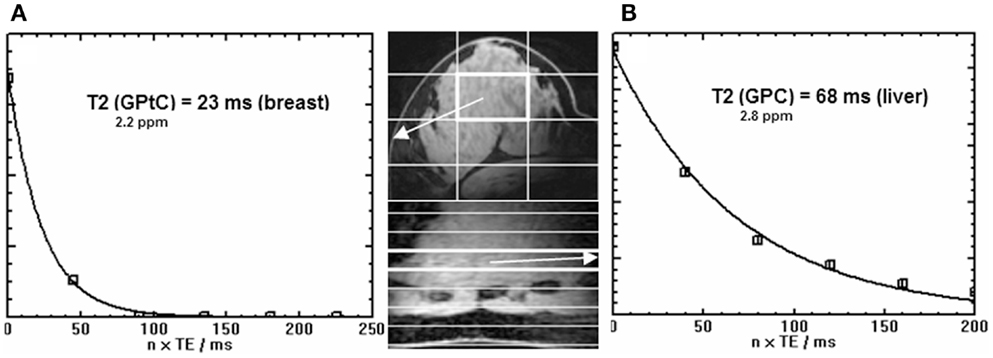
Figure 3. Signal decay [as quantified by spectral fitting of FID and echoes with JMRUI (33)] as a function of time of the GPtC peak at 2.2 ppm obtained from (A) the breast (36) (echo spacing 45 ms) and (B) the true GPC peak from the liver (35) at 2.8 ppm (echo spacing 40 ms). Data were obtained by the AMESING sequence (31) and are averaged values for the group of volunteers. Note the threefold reduced T2 of the 31P spins of GPtC in the breast as compared to GPC in the liver. Images shown are (fast field echo) examples of breast and liver for one volunteer.
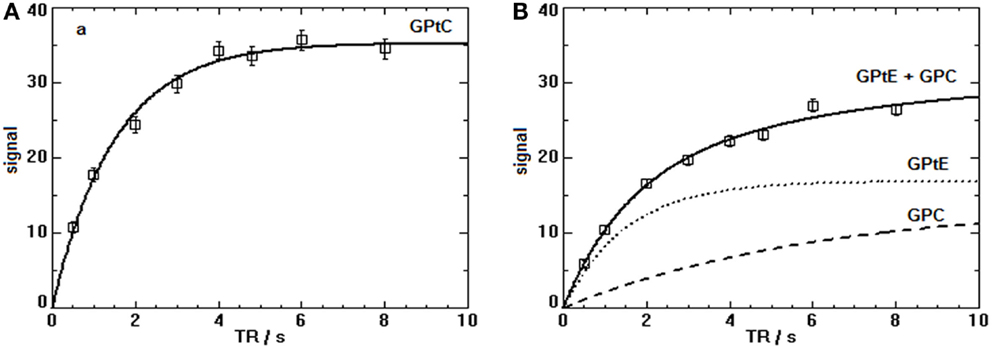
Figure 4. T1-fits of the progressive saturation measurements for the PDE signals (sum of five volunteers) in the breast at 7 T. (A) The T1-value of the GPtC signal (mono-exponential decay) is 1.2 ± 0.3 s. (B) The (GPtE + GPC) signal for the five volunteers was fitted bi-exponentially with a fixed short T1 component for GPtE taken equal to GPtC leading to a T1 for GPC of 3.2 ± 0.6 s.
Discussion
Phosphorous spectra from the breast and liver as shown in Figure 2 do not match to the chemical shift of the PDE signals. As the chemical shift of GPC and GPE are hardly pH sensitive, but Pi and to a lesser extent also PE, PC, and γ-ATP are (37), pH differences between liver and breast may influence chemical shift. If we would shift the breast spectrum by +0.5 ppm to match the PDE signals between breast and liver, this would correspond to a shift in pH of +0.4 units based on Pi chemical shift. This pH difference is unreasonably large, moreover expressing the change in chemical shift of +0.5 ppm for PE, PC, and γ-ATP in pH units is either not possible, or goes beyond any physiologic condition. Therefore, it seems likely that the metabolite signals in the breast that do not match those in the liver are (GPtE + GPC) and GPtC. Healthy liver is known to show high signals of GPC and GPE in 31P MRS in vivo and also in ex vivo perchloric acid extracts (38, 39). The peak labeled GPtC in the liver spectrum of Figure 2C is sometimes referenced to as (potentially) phosphoenolpyruvate (28, 40). However, it does not show up in 31P MRS perchloric acid liver extract studies (38, 39), even though phosphoenolpyruvate is sufficiently soluble in an aqueous phase.
The most likely reason for the nearly constant (GPtE + GPC) signal over FID and echo sum (Figures 2A,B) is that aqueous GPC, with a relatively long T2, increases in the echo sum, while GPtC, just like GPtE, decreases in intensity due to short T2.
A recent lipidomic profiling study on healthy mammary epithelial and breast cancer cells (41) has shown that in the membranes of healthy mammary epithelial cells the concentration of GPtC is approximately twice the concentration of GPtE. If we assume that the T2-weighted echo-sum signal at the chemical shift of GPtE + GPC in Figure 2B is indeed all GPC and we assume a similar T2 for GPC and PE and PC, then we can calculate the GPtC to GPtE ratio by subtraction of the GPC contribution in Figure 2A. This leads to a GPtC to GPtE ratio of 2, in close agreement with the lipidomic profiling study. Minor contributions from sphingomyelin and glycerophosphatidylserines, seen in the lipidomic profiling study will probably add to the in vivo 31P MR signal of GPtE and glycerophosphatidylinositol to the in vivo 31P MR signal of GPtC, not altering the ratio substantially. Chemical shift differences for these different phospholipids are reported by Schiller and Arnold (15).
The 31P T2 values in liver can be low due to the presence of iron, for instance, in the form of ferritin, which is known to increase the relaxivity of water (42). In vivo values for T2 of 31P metabolites (PE, PC, Pi, GPE, GPC) in the liver ranging between 37 and 71 ms have recently been measured at 7 T in our hospital in a group of five healthy volunteers (35). For the breast, however, we measured that the T2 of the 31P spins at the chemical shift of GPtC (36) is even a factor 3 shorter than the T2 of the 31P spins of GPC in the liver (35), as shown in Figure 3. In fact, compared to the reported T2 values – measured at 7 T – of PDEs in calf muscle [T2 = 314 ms (43), 375 ms (31)] or of PC and PE in the breast, the T2 value of GPtC we measured is almost an order of magnitude lower. Spectral fitting of the FID spectrum of Figure 2A, simplified by equal line widths for PE, PC, Pi, and equal linewidths for the PDE signals shows an additional linewidth for the PDE signals of 9 Hz, which is close to the calculated value of 12 Hz when considering the measured T2 of 23 ± 1 ms (35) and a T2 for the PMEs and Pi of ~ 160 ms.
The low signals for GPE and GPC in the echo-sum spectra of the breast are corroborated by an in vitro extract study on breast tumors by Smith et al. (14), where it was shown that GPE and GPC concentrations are low in non-necrotic breast tumors and that, at low field, PDE signals observed in vivo are mainly from phospholipids. A recent LC MS study by Mimmi et al. (44) showed a very low average concentration of only 0.04 mmol/kg GPC in three healthy fibroglandular breast tissue samples.
Another reason to suspect that the dominant PDE signal we observe in the breast at 7 T originates from mobile lipid structures is based on the results of the T1-measurements of the PDE signal in the breast, as depicted in Figure 4. Here, the T1 of GPtC was fitted mono-exponentially leading to 1.5 ± 0.1 s and the signal of GPtE + GPC was fitted bi-exponentially with the T1 of the GPtE component fixed equal to the T1 of GPtC. For the signal of the aqueous GPC, this leads to 6 ± 2 s. The fitted T1 of mobile GPtC is three- to fivefold lower than that reported for GPC and GPE in calf muscle and brain at 7 and 3 T (43, 45, 46). A value of 1.4 s for the T1 of the 31P MRS signal of dipalmitoylphosphatidylcholine (DPPC) vesicles with an average diameter of 100 nm has been measured by Klauda et al. (47) above the phase transition temperature. For multi-lamellar dispersions of dimyristoylphosphatidylcholine (DMPC), a value around 1 s has been measured just above the phase transition temperature by Dufourc et al. (48). The T1-value of 6 s fitted for the GPC component, Figure 4B, agrees well with the T1-values for GPC reported at 3 T and 7 T for calf muscle and brain ranging from 4 to 7.8 s (43, 45, 46).
All presented data throughout this paper is based on average spectra of the group of volunteers. This has the advantage that it maximizes signal to noise and enables the most reliable relaxation time fitting. A short coming is that individual physiological differences between volunteers are averaged out.
The fitted linewidth of the two overlapping PDE signals of the breast spectrum depicted in Figure 2A is 58 Hz (i.e., 0.5 ppm). Bulk phospholipid bilayers show broad asymmetrical lineshapes (several tens of ppm) caused by large chemical shift anisotropy (49). Therefore, if the very sharp PDE resonances that we observe are from MPL, then these MPL must be highly mobile phospholipids, for which chemical shift anisotropy and dipolar couplings are sufficiently averaged out. Especially at ultra-high field, relaxation by chemical shift anisotropy that goes with the square of the field causes additional line broadening as compared to spectra recorded at lower field strength. Highly mobile phospholipids can be found in small-sized vesicles (<50 nm) (50), and in large arrays of lipidic particles (51), inter-lamellar attachments (52), and inverted cubic structures (52–54) within the lipid bilayer.
A rough estimate of the percentage of in vivo visible mobile phospholipids at 7 T can be made as follows. The ratio of PE to PC is ~2 and the PME to PDE ratio is ~1 (Figure 2A). A weighted average of PC concentrations measured in healthy breast tissue by Mimmi et al. (44) is 0.08 mmol/kg, with PE/PC = 2 (Figure 2A), this leads to a PME concentration of ~ 0.2 mmol/kg. Most of the PDE signal is from mobile phospholipids (Figures 2A,B). The total concentration of phospholipids in human tissues is in the range of 17–83 mmol/kg (55). With a signal ratio of PDEs to PMEs in breast glandular tissue of 1.4 at TR = 6 s (35) and a T1 of PMEs of 5 s (56) and a T1 of mobile phospholipids of 1.5 s, the total concentration of in vivo visible mobile phospholipids in the human breast at 7 T is also of the order of ~0.2 mmol/kg. This leads to a crude estimate of the visible mobile phospholipid fraction at 7 T of 0.2–1.2%.
Conclusion
The PDE signals from the breast, as measured with MRSI techniques at 7 T in vivo, show aberrant behavior from aqueous GPE and GPC. The T1 and T2 relaxation values for these PDE signals are too short to represent true aqueous GPC and GPE. In addition, the chemical shifts of these PDE signals do not correspond to GPE and GPC, but are shifted −0.5 ppm with regard to these, and correspond to chemical shift values of GPtE and GPtC. These PDE signals could originate from mobile lipid structures such as small vesicles with diameters ≤50 nm, large arrays of ILAs or large domains of inverted cubic phases within the lipid bilayer. As the PC over GPC ratio is used as a biomarker in breast cancer research, the in vivo obtained value will be contaminated with signal from GPtE – having a similar chemical shift as GPC – or the GPtC peak may be erroneously assigned as GPC.
Author Contributions
WK: study design, MR measurements, data analyses, first draft of typescript; BS: MR measurements, critical revision of typescript; JR: MR measurements, data analysis, critical revision of typescript; JW: study design, critical revision of typescript; AN: study, design, critical revision of typescript; PL: study design, critical revision of typescript; DK: study design, critical revision of typescript. All authors approved the final version of the manuscript.
Conflict of Interest Statement
The authors declare that the research was conducted in the absence of any commercial or financial relationships that could be construed as a potential conflict of interest.
Abbreviations
AMESING, Adiabatic Multi-Echo Spectroscopic ImagING; CSA, chemical shift anisotropy; DPPC, dipalmitoylphospatidylcholine (1,2-dipalmitoyl-sn-glycero-3-phosphocholine); DMPC, dimyristoylphospatidylcholine (1,2-dimyristoyl-sn-glycero-3-phosphocholine); GPC, glycerophosphocholine; GPE, glycerophosphoethanolamine; GPtC, (diacyl-)glycerophosphatidylcholine; GPtE, (diacyl-)glycerophosphatidylethanolamine; ILA, inter-lamellar attachment; MPL, membrane phospholipids; PC, phosphocholine; PE, phosphoethanolamine; Pi, inorganic phosphate; PCr, phosphocreatine.
References
1. Aboagye EO, Bhujwalla ZM. Malignant transformation alters membrane choline phospholipid metabolism of human mammary epithelial cells. Cancer Res (1999) 59(1):80–4.
2. Glunde K, Ackerstaff E, Mori N, Jacobs MA, Bhujwalla ZM. Choline phospholipid metabolism in cancer: consequences for molecular pharmaceutical interventions. Mol Pharm (2006) 3:496–506. doi: 10.1021/mp060067e
3. Podo F. Tumour phospholipid metabolism. NMR Biomed (1999) 12:413–39. doi:10.1002/(SICI)1099-1492(199911)12:7<413::AID-NBM587>3.0.CO;2-U
4. Podo F, Canevari S, Canese R, Pisanu ME, Ricci A, Iorio E. MR evaluation of response to targeted treatment in cancer cells. NMR Biomed (2011) 24:648–72. doi:10.1002/nbm.1658
5. Glunde K, Jiang L, Moestue SA, Gribbestad IS. MRS and MRSI guidance in molecular medicine: targeting and monitoring of choline and glucose metabolism in cancer. NMR Biomed (2011) 24:673–90. doi:10.1002/nbm.1751
6. Khlebnikov V, Wijnen JP, van der Kemp WJM, Klomp DWJ. 31P MRSI Studies in Patients with Cancer. Ann R NMR S (2016) 87:320–68. doi:10.1016/bs.arnmr.2015.08.004
7. Koutcher JA, Ballon D, Graham M, Healey JH, Casper ES, Heelan R, et al. 31P NMR spectra of extremity sarcomas: diversity of metabolic profiles and changes in response to chemotherapy. Magn Reson Med (1990) 16(1):19–34. doi:10.1002/mrm.1910160104
8. Cox IJ, Bell JD, Peden CJ, Iles RA, Foster CS, Watanapa P, et al. In vivo and in vitro 31P magnetic resonance spectroscopy of focal hepatic malignancies. NMR Biomed (1992) 5(3):114–20. doi:10.1002/nbm.1940050303
9. Redmond OM, Stack JP, O’Connor NG, Carney DN, Dervan PA, Hurson BJ, et al. 31P MRS as an early prognostic indicator of patient response to chemotherapy. Magn Reson Med (1992) 25(1):30–44. doi:10.1002/mrm.1910250104
10. Dewhirst MW, Poulson JM, Yu D, Sanders L, Lora-Michiels M, Vujaskovic Z, et al. Relation between pO2, 31P magnetic resonance spectroscopy parameters and treatment outcome in patients with high-grade soft tissue sarcomas treated with thermoradiotherapy. Int J Radiat Oncol Biol Phys (2005) 61(2):480–91. doi:10.1016/j.ijrobp.2004.06.211
11. Ha DH, Choi S, Oh JY, Yoon SK, Kang MJ, Kim KU. Application of 31P MRspectroscopy to the brain tumors. Korean J Radiol (2013) 14(3):477–86. doi:10.3348/kjr.2013.14.3.477
12. van der Kemp WJ, Stehouwer BL, Luijten PR, van den Bosch MA, Klomp DW. Detection of alterations in membrane metabolism during neoadjuvant chemotherapy in patients with breast cancer using phosphorus magnetic resonance spectroscopy at 7 Tesla. Springerplus. (2014) 3:634. doi:10.1186/2193-1801-3-634
13. Cerdan S, Subramanian VH, Hilberman M, Cone J, Egan J, Chance B, et al. 31P NMR detection of mobile dog brain phospholipids. Magn Reson Med (1986) 3:432–9. doi:10.1002/mrm.1910030308
14. Smith TA, Glaholm J, Leach MO, Machin L, Collins DJ, Payne GS, et al. A comparison of in vivo and in vitro 31P NMR spectra from human breast tumours: variations in phospholipid metabolism. Br J Cancer (1991) 63:514–6. doi:10.1038/bjc.1991.122
15. Schiller S, Arnold K. Application of high resolution 31P NMR spectroscopy to the characterization of the phospholipid composition of tissues and body fluids – a methodological review. Med Sci Monit (2002) 8:MT205–22.
16. Payne GS, Troy H, Vaidya SJ, Griffiths JR, Leach MO, Chung Y-L. Evaluation of 31P high-resolution magic angle spinning of intact tissue samples. NMR Biomed (2006) 19:593–8. doi:10.1002/nbm.1040
17. Twelves CJ, Lowry M, Porter DA, Dobbs NA, Graves PE, Smith MA, et al. 31-phosphorus metabolism of human breast – an in vivo MRS study at 1.5 Tesla. Br J Radiol (1993) 67:36–45. doi:10.1259/0007-1285-67-793-36
18. Payne GS, Dowsett M, Leach MO. Hormone-dependent metabolic changes in the normal breast monitored noninvasively by 31P magnetic resonance (MR) spectroscopy. The Breast (1994) 3:20–3. doi:10.1016/0960-9776(94)90031-0
19. Sauter A, Rudin M. Effects of calcium antagonists on high-energy phosphates in ischemic rat brain measured by 31P NMR spectroscopy. Magn Reson Med (1987) 4:1–8. doi:10.1002/mrm.1910040102
20. Kilby PM, Allis JL, Radda GK. Spin-spin relaxation of the phosphodiester resonance in the 31P NMR spectrum of human brain. The determination of the concentrations of phosphodiester components. FEBS Lett (1990) 272:163–5. doi:10.1016/0014-5793(90)80474-W
21. Kilby PM, Bolas NM, Radda GK. 31P-NMR study of brain phospholipid structures in vivo. Biochim Biophys Acta (1991) 1085:257–64. doi:10.1016/0005-2760(91)90102-N
22. McNamara R, Arias-Mendoza F, Brown TR. Investigation of broad resonances in 31P NMR spectra of the human brain in vivo. NMR Biomed (1994) 7:237–42. doi:10.1002/nbm.1940070507
23. Potwarka JJ, Drost DJ, Williamson PC. Quantifying 1H decoupled in vivo 31P brain spectra. NMR Biomed (1999) 12:8–14. doi:10.1002/(SICI)1099-1492(199902)12:1<8::AID-NBM540>3.0.CO;2-#
24. Jensen JE, Drost DJ, Menon RS, Williamson PC. In vivo brain 31P-MRS: measuring the phospholipid resonances at 4 Tesla from small voxels. NMR Biomed (2002) 15:338–47. doi:10.1002/nbm.776
25. Bates TE, Williams SR, Gadian DG. Phosphodiesters in the liver: the effect of field strength on the 31P signal. Magn Reson Med (1989) 12:145–50. doi:10.1002/mrm.1910120116
26. Murphy EJ, Rajagopalan B, Brindle KM, Radda GK. Phospholipid bilayer contribution to 31P NMR spectra in vivo. Magn Reson Med (1989) 12:282–9. doi:10.1002/mrm.1910120218
27. Murphy EJ, Bates TE, Williams SR, Watson T, Brindle KM, Rajagopalan B, et al. Endoplasmic reticulum: the major contributor to the PDE peak in hepatic 31P-NMR spectra at low magnetic field strengths. Biochim Biophys Acta (1992) 1111:51–8. doi:10.1016/0005-2736(92)90273-O
28. Wylezinska M, Cobbold JF, Fitzpatrick J, McPhail MJ, Crossey MM, Thomas HC, et al. A comparison of single-voxel clinical in vivo hepatic 31P MR spectra acquired at 1.5 and 3.0 Tesla in health and diseased states. NMR Biomed (2010) 24:231–7. doi:10.1002/nbm.1578
29. Ratcliffe PJ, Moonen CT, Ledingham JG, Radda GK. Timing of the onset of changes in renal energetics in relation to blood pressure and glomerular filtration in haemorrhagic hypotension in the rat. Nephron (1989) 51:225–32. doi:10.1159/000185290
30. Heindel W, Kugel H, Wenzel F, Stippel D, Schmidt R, Lackner K. Localized 31P MR spectroscopy of the transplanted human kidney in situ shows altered metabolism in rejection and acute tubular necrosis. J Magn Reson Imaging (1997) 7:858–64. doi:10.1002/jmri.1880070514
31. van der Kemp WJM, Boer VO, Luijten PR, Stehouwer BL, Veldhuis WB, Klomp DWJ. Adiabatic multi-echo 31P spectroscopic imagiNG (AMESING) at 7 tesla for measuring transverse relaxation times and regaining sensitivity in tissues with short T2* values. NMR Biomed (2013) 26:1299–307. doi:10.1002/nbm.2952
32. Garwood M, Ke Y. Symmetric pulses to induce arbitrary flip angles with compensation for RF inhomogeneity and resonance offsets. J Magn Reson (1991) 94:511–25.
33. Naressi A, Couturier C, Devos JM, Janssen M, Mangeat C, de Beer R, et al. Java-based graphical user interface for the MRUI quantitation package. MAGMA (2001) 12:141–52. doi:10.1016/S1352-8661(01)00111-9
34. Vanhamme L, van den Boogaart A, Van Huffel S. Improved method for accurate and efficient quantification of MRS data with use of prior knowledge. J Magn Reson (1997) 129:35–43. doi:10.1006/jmre.1997.1244
35. Runge JH, van der Kemp WJM, Klomp DWJ, Nederveen AJ, Stoker J. 31P MRSI of the healthy liver at 3T and 7T with AMESING-boosted SNR,”. In Proceedings of the 22nd Annual Meeting of ISMRM, Milan (2014). 2265 p.
36. Stehouwer BL, van der Kemp WJM, Luijten PR, van den Bosch MA, Veldhuis WB, Wijnen JP, et al. (31)P magnetic resonance spectroscopy of the breast and the influence of the menstrual cycle. Breast Cancer Res Treat (2014) 144:583–9. doi:10.1007/s10549-014-2889-7
37. Robitaille P-ML, Robitaille PA, Brown GG Jr, Brown GG. An analysis of the pH-dependent chemical-shift behavior of phosphorus-containing metabolites. J Magn Reson (1991) 92:73–84.
38. Taylor-Robinson SD, Sargentoni J, Bell JD, Thomas EL, Marcus CD, Changani KK, et al. In vivo and in vitro hepatic phosphorus-31 magnetic resonance spectroscopy and electron microscopy in chronic ductopenic rejection of human liver allografts. Gut (1998) 42:735–43. doi:10.1136/gut.42.5.735
39. Taylor-Robinson SD, Thomas EL, Sargentoni J, Marcus CD, Davidson BR, Bell JD. Cirrhosis of the human liver: an in vitro 31P nuclear magnetic resonance study. Biochim Biophys Acta (1995) 1272:113–8. doi:10.1016/0925-4439(95)00074-E
40. Sevastianova K, Hakkarainen A, Kotronen A, Cornér A, Arkkila P, Arola J, et al. Nonalcoholic fatty liver disease: detection of elevated nicotinamide adenine dinucleotide phosphate with in vivo 3.0-T 31P MR spectroscopy with proton decoupling. Radiology (2010) 256:466–73. doi:10.1148/radiol.10091351
41. Dória ML, Cotrim Z, Macedo B, Simões C, Domingues P, Helguero L, et al. Lipidomic approach to identify patterns in phospholipid profiles and define class differences in mammary epithelial and breast cancer cells. Breast Cancer Res Treat (2012) 133:635–48. doi:10.1007/s10549-011-1823-5
42. Gossuin Y, Muller RN, Gillis P, Bartel L. Relaxivities of human liver and spleen ferritin. Magn Reson Imaging (2005) 23:1001–4. doi:10.1016/j.mri.2005.10.009
43. Bogner W, Chmelik M, Schmid AI, Moser E, Trattnig S, Gruber S. Assessment of 31P relaxation times in the human calf muscle: a comparison between 3 T and 7 T in vivo. Magn Reson Med (2009) 62:574–82. doi:10.1002/mrm.22057
44. Mimmi MC, Finato N, Pizzolato G, Beltrami CA, Fogolari F, Corazza A, et al. Absolute quantification of choline-related biomarkers in breast cancer biopsies by liquid chromatography electrospray ionization mass spectrometry. Anal Cell Pathol (Amst) (2013) 36:71–83. doi:10.3233/ACP-130082
45. Klomp DWJ, Wijnen JP, Scheenen TW, Heerschap A. Efficient 1H to 31P polarization transfer on a clinical 3T MR system. Magn Reson Med (2008) 60:1298–305. doi:10.1002/mrm.21733
46. Lei H, Zhu XH, Zhang XL, Ugurbil K, Chen W. In vivo 31P magnetic resonance spectroscopy of human brain at 7 T: an initial experience. Magn Reson Med (2003) 49:199–205. doi:10.1002/mrm.10379
47. Klauda JB, Roberts MF, Redfield AG, Brooks BR, Pastor RW. Rotation of lipids in membranes: molecular dynamics simulation, 31P spin-lattice relaxation, and rigid-body dynamics. Biophys J (2008) 94:3074–83. doi:10.1529/biophysj.107.121806
48. Dufourc EJ, Mayer C, Stohrer J, Althoff G, Kothe G. Dynamics of phosphate head groups in biomembranes. Comprehensive analysis using phosphorus-31 nuclear magnetic resonance lineshape and relaxation time measurements. Biophys J (1992) 61:42–57. doi:10.1016/S0006-3495(92)81814-3
49. Seelig J. 31P nuclear magnetic resonance and the head group structure of phospholipids in membranes. Biochim Biophys Acta (1978) 515:105–40. doi:10.1016/0304-4157(78)90001-1
50. McLaughlin AC, Cullis PR, Berden JA, Richards RE. 31P NMR of phospholipid membranes: effects of chemical shift anisotropy at high magnetic field strengths. J Mag Resonance (1975) 20:146–65.
51. de Kruijff B, Verkley AJ, van Echteld CJ, Gerritsen WJ, Mombers C, Noordam PC, et al. The occurrence of lipidic particles in lipid bilayers as seen by 31P NMR and freeze fracture electron-microscopy. Biochim Biophys Acta (1979) 555:200–9. doi:10.1016/0005-2736(79)90160-3
52. Siegel DP. Inverted micellar intermediates and the transitions between lamellar, cubic, and inverted hexagonal amphiphile phases. III. Isotropic and inverted cubic state formation via intermediates in transitions between L alpha and HII phases. Chem Phys Lipids (1986) 42:279–301. doi:10.1016/0009-3084(86)90087-3
53. Jiménez-Monreal AM, Villalaín J, Aranda FJ, Gómez-Fernández JC. The phase behavior of aqueous dispersions of unsaturated mixtures of diacylglycerols and phospholipids. Biochim Biophys Acta (1998) 1373:209–19. doi:10.1016/S0005-2736(98)00106-0
54. Boni LT, Hui SW. Polymorphic phase behaviour of dilinoleoylphosphatidylethanolamine and palmitoyloleoylphosphatidylcholine mixtures. Structural changes between hexagonal, cubic and bilayer phases. Biochim. Biophys Acta (1983) 731:177–85.
55. Ansell GB, Spanner S. Phosphatidylserine, phosphatidylethanolamine, and phosphatidyl–choline. In: Hawthorne JN, Ansell CB, editors. Phospholipids, New Comprehensive Biochemistry. (Vol. 4), Amsterdam: Elsevier Biomedical Press (1982). p. 1–41.
Keywords: MRSI, 31P, relaxation time, 7 T, phosphodiester, breast, phospholipids
Citation: van der Kemp WJM, Stehouwer BL, Runge JH, Wijnen JP, Nederveen AJ, Luijten PR and Klomp DWJ (2016) Glycerophosphocholine and Glycerophosphoethanolamine Are Not the Main Sources of the In Vivo 31P MRS Phosphodiester Signals from Healthy Fibroglandular Breast Tissue at 7 T. Front. Oncol. 6:29. doi: 10.3389/fonc.2016.00029
Received: 17 September 2015; Accepted: 28 January 2016;
Published: 15 February 2016
Edited by:
Franca Podo, Istituto Superiore di Sanità, ItalyReviewed by:
Hadassa Degani, Weizmann Institute of Science, IsraelSebastian Cerdan, Instituto de Investigaciones Biomedicas Alberto Sols, Spain
Jim Delikatny, University of Pennsylvania, USA
Copyright: © 2016 van der Kemp, Stehouwer, Runge, Wijnen, Nederveen, Luijten and Klomp. This is an open-access article distributed under the terms of the Creative Commons Attribution License (CC BY). The use, distribution or reproduction in other forums is permitted, provided the original author(s) or licensor are credited and that the original publication in this journal is cited, in accordance with accepted academic practice. No use, distribution or reproduction is permitted which does not comply with these terms.
*Correspondence: Wybe J. M. van der Kemp, w.j.m.vanderkemp@umcutrecht.nl