 Hieu T. Nim
 Milena B. Furtado3
 Sarah E. Boyd
- 1Faculty of Information Technology, Monash University, Melbourne, VIC, Australia
- 2Australian Regenerative Medicine Institute, Monash University, Melbourne, VIC, Australia
- 3The Jackson Laboratory, Bar Harbor, ME, USA
- 4EMBL – Australia Collaborating Group, Systems Biology Institute Australia, Monash University, Melbourne, VIC, Australia
Background: Quantitative high-throughput data deposited in consortia such as International Cancer Genome Consortium (ICGC) and The Cancer Genome Atlas (TCGA) present opportunities and challenges for computational analyses.
Methods: We present a computational strategy to systematically rank and investigate a large number (210–220) of clinically testable gene sets, using combinatorial gene subset generation and disease-free survival (DFS) analyses. This approach integrates protein–protein interaction networks, gene expression, DNA methylation, and copy number data, in association with DFS profiles from patient clinical records.
Results: As a case study, we applied this pipeline to systematically analyze the role of ALDH1A2 in prostate cancer (PCa). We have previously found this gene to have multiple roles in disease and homeostasis, and here we investigate the role of the associated ALDH1A2 gene/protein networks in PCa, using our methodology in combination with PCa patient clinical profiles from ICGC and TCGA databases. Relationships between gene signatures and relapse were analyzed using Kaplan–Meier (KM) log-rank analysis and multivariable Cox regression. Relative expression versus pooled mean from diploid population was used for z-statistics calculation. Gene/protein interaction network analyses generated 11 core genes associated with ALDH1A2; combinatorial ranking of the power set of these core genes identified two gene sets (out of 211 − 1 = 2,047 combinations) with significant correlation with disease relapse (KM log rank p < 0.05). For the more significant of these two sets, referred to as the optimal gene set (OGS), patients have median survival 62.7 months with OGS alterations compared to >150 months without OGS alterations (p = 0.0248, hazard ratio = 2.213, 95% confidence interval = 1.1–4.098). Two genes comprising OGS (CYP26A1 and RDH10) are strongly associated with ALDH1A2 in the retinoic acid (RA) pathways, suggesting a major role of RA signaling in early PCa progression. Our pipeline complements human expertise in the search for prognostic biomarkers in large-scale datasets.
Introduction
Large volumes of cancer genomic data are being continuously generated via consortia such as The Cancer Genome Atlas (TCGA) (1) and the International Cancer Genome Consortium (ICGC) (2), and optimal use of this data promises improvement to patient care (3). In particular, better characterization of the smaller subgroup of patients with poor disease outcomes will help to develop risk-adjusted treatments and potential novel therapies (4), which should significantly improve treatment selection and outcomes for patients overall.
Many large-sized gene panels have been generated to classify cancer patients into subgroups, but frequently those gene sets have poor prognostic value (5). The lack of effective biomarkers, and the failure to appropriately stratify patients according to disease severity and prognosis, leads to an increased burden on both the patient and the health-care system, with inappropriate, under- and over-treatment of patients (6). With an ever-increasing number of prognostic gene signature reports (~250 yearly, based on a PubMed search with query [((“gene signature” OR “gene signatures”) AND “cancer”)]), the oncology research community would benefit from a systematic evaluation method to benchmark these diverse studies.
Recent studies of different cancer patient cohorts have incorporated some machine learning techniques such as decision trees (7) and Bayesian belief networks (8, 9). These techniques are computationally intensive, frequently rely on heuristics to explore the gene-set space, and commonly suffer from small-sized patient cohorts (10).
In our experience working with clinical oncologists/pathologists, an important result of the computational method is to conclusively demonstrate the optimality of the discovered gene set based on standard clinical measures in an exhaustive search. As an example of non-exhaustive search, a recent high-impact study by Irshad et al. in newly diagnosed prostate cancer (PCa) examines only 3-gene combinations in a 19-gene set, i.e., 969 out of 524,287 possibilities (7). In our proposed pipeline, we use gene/protein (from here onward referred to simply as gene) interaction network to generate a core gene set, then combinatorially generate and rank gene sets based on the standard Kaplan–Meier (KM) log-rank p-value, and finally examine the clinical relevance of the optimal gene set (OGS) using ANOVA of Cox proportional hazard models. Valuable features of our pipeline are its deterministic, unbiased, and clinician-intuitive nature.
In PCa, the biology is complicated by a high degree of both intra-patient (11) and inter-patient heterogeneity (12), and progress in treatment has been hampered by a lack of predictive biomarkers (13). The current prognostic protocols, which combine Gleason score, prostate-specific antigen (PSA), and clinical stage, have limited value in predicting outcome (14, 15). There is a pressing need for validated biomarkers that provide objective assessment of the prostate tumor biology and prognostic stratification, especially in early PCa (14).
As a case study, we applied our pipeline to a potential biomarker candidate for early PCa, the retinoic acid (RA) ALDH1A2, which we have previously identified and experimentally validated as being worthy of further biological characterization (16). Vitamin A (retinol) is a lipid-soluble organic compound that plays essential roles in embryonic development, cell proliferation, differentiation, and apoptosis (17). It is normally obtained either directly through diet or indirectly through the conversion of β-carotene in the body through oxidation. Within the cell, vitamin A undergoes multistep metabolic processing, to produce RAs such as ALDH1A2. The RA then binds to its nuclear hormone receptors, forming active heterodimers that modulate expression of downstream RA target genes by binding to DNA regions named RA response elements.
The biology of ALDH1A2 is complex, and its roles in cancer are being increasingly explored (18–20). Even without the exact mechanisms being fully understood yet, we are able to use the putative role of ALDH1A2 in cancer to derive a core gene set from ALDH1A2-interacting partners, using available literature and curated databases. With our novel data-mining algorithm, we systematically evaluate combinatorial subsets of this gene signature, in relationship to disease-free survival (DFS) and other relevant clinical parameters including the subjective histological grading called Gleason score. We arrive at an optimal gene signature that, when aberrantly expressed, is strongly associated with PCa relapse.
Methods
Data Used in This Study
This study was exempt from ethical review by Monash University Human Research Ethics Committee (MUHREC) as the research involved only de-identifiable data about human beings. De-identified PCa patient data were retrieved and processed from TCGA database, specifically the “TCGA Prostate Adenocarcinoma” study, accessed using the application programming interface from cBio Cancer Genomics Portal (21). Genomics data were downloaded the data from the European Genome-phenome Archive (EGA) through approved access, with accession number EGAD00001001329 (22). Gene expression data were obtained via the NCBI Gene Expression Omnibus (GEO) database with accession number GSE35988 (23). Table 1 summarizes the data sources gathered and integrated in this study. All patient data were uniformly assessed in subsequent bioinformatics and biostatistical analyses.
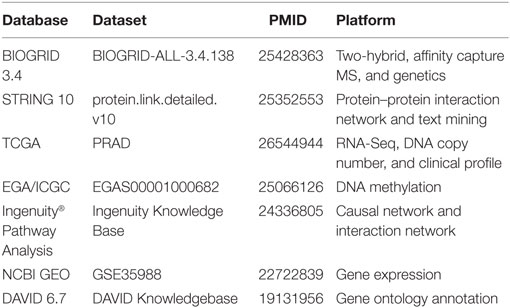
Table 1. Data used in this study.
Bioinformatics Analysis
RNA-sequencing data were normalized as previously described (21), with z-statistics calculated based on relative expression levels versus population mean: |z| > 1.96 (i.e., outside 95% confidence interval) indicates altered expression. Microarray analysis of Agilent platform data was performed as described previously (24). Genome-wide DNA methylation profiling from the Illumina 450K platform data was performed following the RnBeads processing pipeline (25). Subset-quantile normalization was performed using SWAN (26). Probes with missing samples or detection p-value below 0.01 or containing single nucleotide polymorphism were excluded. Beta values were used to represent methylation levels.
Clinical Association with DFS Analyses
Gleason score was used as a categorical variable. Other clinical covariates included counts of examined lymph nodes, most recent PSA score, and patient age. Outcomes were analyzed by KM analysis with log-rank test. Univariate analysis and multivariate analysis for determining prognostic association between gene signatures and clinical parameters were performed using Cox proportional hazards regression. KM and Cox regression analyses were performed using R version 3.2.3 via the “survival” package (27).
Gene Set Generation and Ranking Based on Clinical Profiles
A comprehensive survey of all the available data from established public data repositories and published literature and abstracts was used to produce an unbiased assessment of the genes involved in the seed gene of interest (Figure 1).
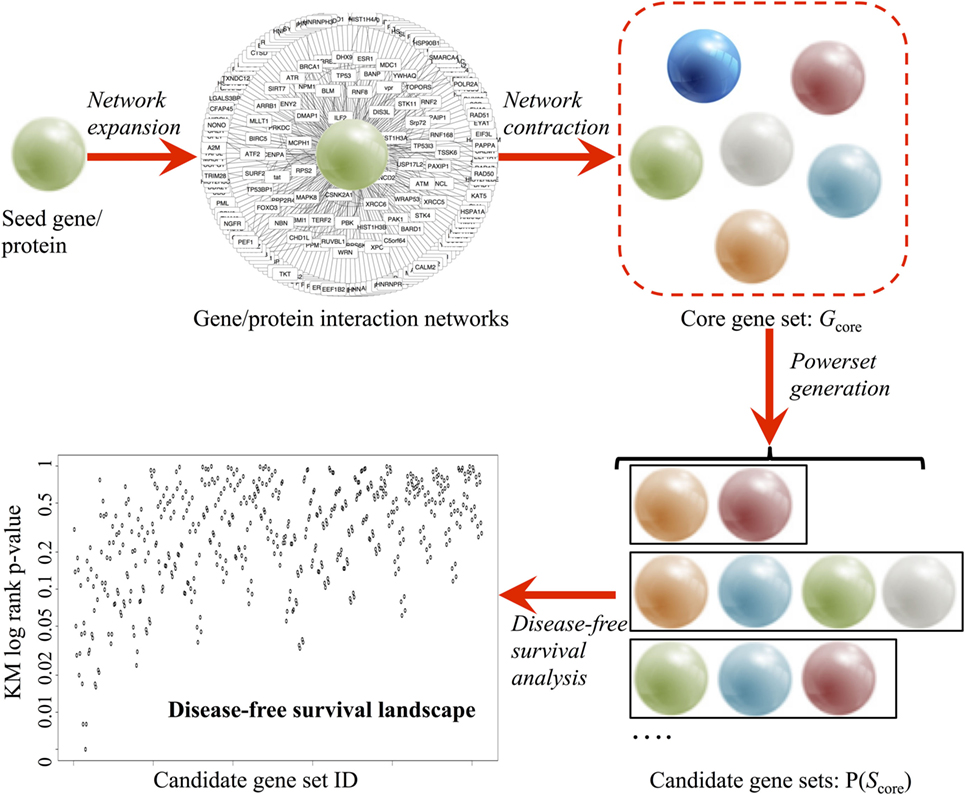
Figure 1. Pipeline of the combinatorial ranking procedures, developed to systematically explore and evaluate gene sets based clinical relevance. A core gene set (Gcore) is derived in a two-phase procedure: (1) network expansion using Ingenuity® Pathway Analysis and (2) network contraction by verifying the individual network links in BIOGRID 3.4 and STRING 10 databases. Power set generation populates all combinatorial gene sets based on Gcore. Finally, disease-free survival analysis ranks all candidate gene sets based on prognostic values.
In the network expansion phase, a preliminary interaction network was generated from the Ingenuity® Pathway Analysis [Ingenuity Pathway Analysis (IPA)—Qiagen] database using the seed gene as query. Using the “Export” option, a text (.TXT) file containing all interacting partners of the seed gene was obtained. Using Microsoft® Excel™ 2013 software, three columns were extracted: the official gene symbol (e.g., Tp53), gene description (e.g., tumor protein p53), and synonyms (e.g., Bbl, Bcc7, Bfy, Bhy, Brp53, and Brp53). The synonyms are then used for removing duplicate results in IPA output via R script.
In the network contraction phase, the preliminary network was first filtered through the BIOGRID 3.4 database (Table 1) (28). BIOGRID database snapshot in tab-separated text format was downloaded from https://thebiogrid.org (version 3.4.138, 348 MB). Using Microsoft® Excel™ 2013 software, three columns were extracted: interactor A (e.g., Tp53), interactor B (e.g., Mdm2), and interaction types (e.g., affinity capture-luminescence, two-hybrid, etc.). Custom R script extracted all data rows containing the seed gene and interacting partner found earlier from IPA. Next, the top interacting partners were extracted from multiple lines of evidence from the literature using the STRING v10 database (Table 1) (29). STRING v10 data access was requested for academic use (http://string-db.org). Upon approval, database snapshot in tab-separated text format was downloaded (protein.links.full.v10.txt.gz, 17.8 GB). A custom R script was used to extract all data rows containing the seed gene and interacting partners found earlier from IPA. Two sets of matching results from BIOGRID and STRING were combined, and the relationship between seed gene and interacting partners was then labeled as co-expression, text mining, database interrogation, and experimental data. The interacting partners of the seed gene with only one evidence were filtered out to generate a stringent list of interacting partners (Gcore). A functional analysis of the genes in Gcore was conducted using DAVID v6.7 (30) based on pathway and gene ontology annotations [KEGG pathway (31), biological process, cellular component, and molecular function] to confirm the biological pathway relevance of Gcore.
Upon obtaining a curated set of genes, power set (i.e., set of all subsets) generation is performed using the R powerset package. For each set of gene, a validation pipeline was executed based on PCa patient data (TCGA, ICGC, and GEO) using the bioinformatics analysis protocol described earlier (R code described in Data S1 in Supplementary Material and available on GitHub). In brief, genomic data from tumor and healthy tissue were downloaded. Patients were grouped according to altered expression (|z| > 1.96) status, as defined earlier. For TCGA data, clinical parameters were also downloaded for DFS analysis. Based on the calculated KM p-values, the algorithm ranks all candidate genes based on prognostic probability in the TCGA early PCa patient cohort.
Results
ALDH1A2 is a key player in the RA pathway and retinoid metabolism, both known to be important in homeostasis and cellular function (32, 33), the disruption of which leads to various health problems including PCa (34, 35). In our case study, we start with ALDH1A2 to generate our core gene set.
Generation of a Core Gene Set via Data Integration
Applying the pipeline using ALDH1A2 as the seed (Figure 1), we obtained a large gene interaction network (Figure 2A), which was then refined to a core gene set (Gcore) of 11 genes (Figure 2B). DAVID gene ontology analysis shows that all 11 genes are involved in both “retinol metabolism” (KEGG pathway) and “oxidation reduction” (GO biological process). We analyzed the expression and methylation levels of Gcore independently in two landmark PCa datasets: Grasso et al. (23) (Table 2) and Brocks et al. (22) (Table 3). The individual genes in Gcore were strongly associated with differential expression (Table 2) but not differential methylation (Table 3) between tumor and normal patients. However, it is possible that combinations of these individual genes may have prognostic value, so these were also further assessed, as described in the following.
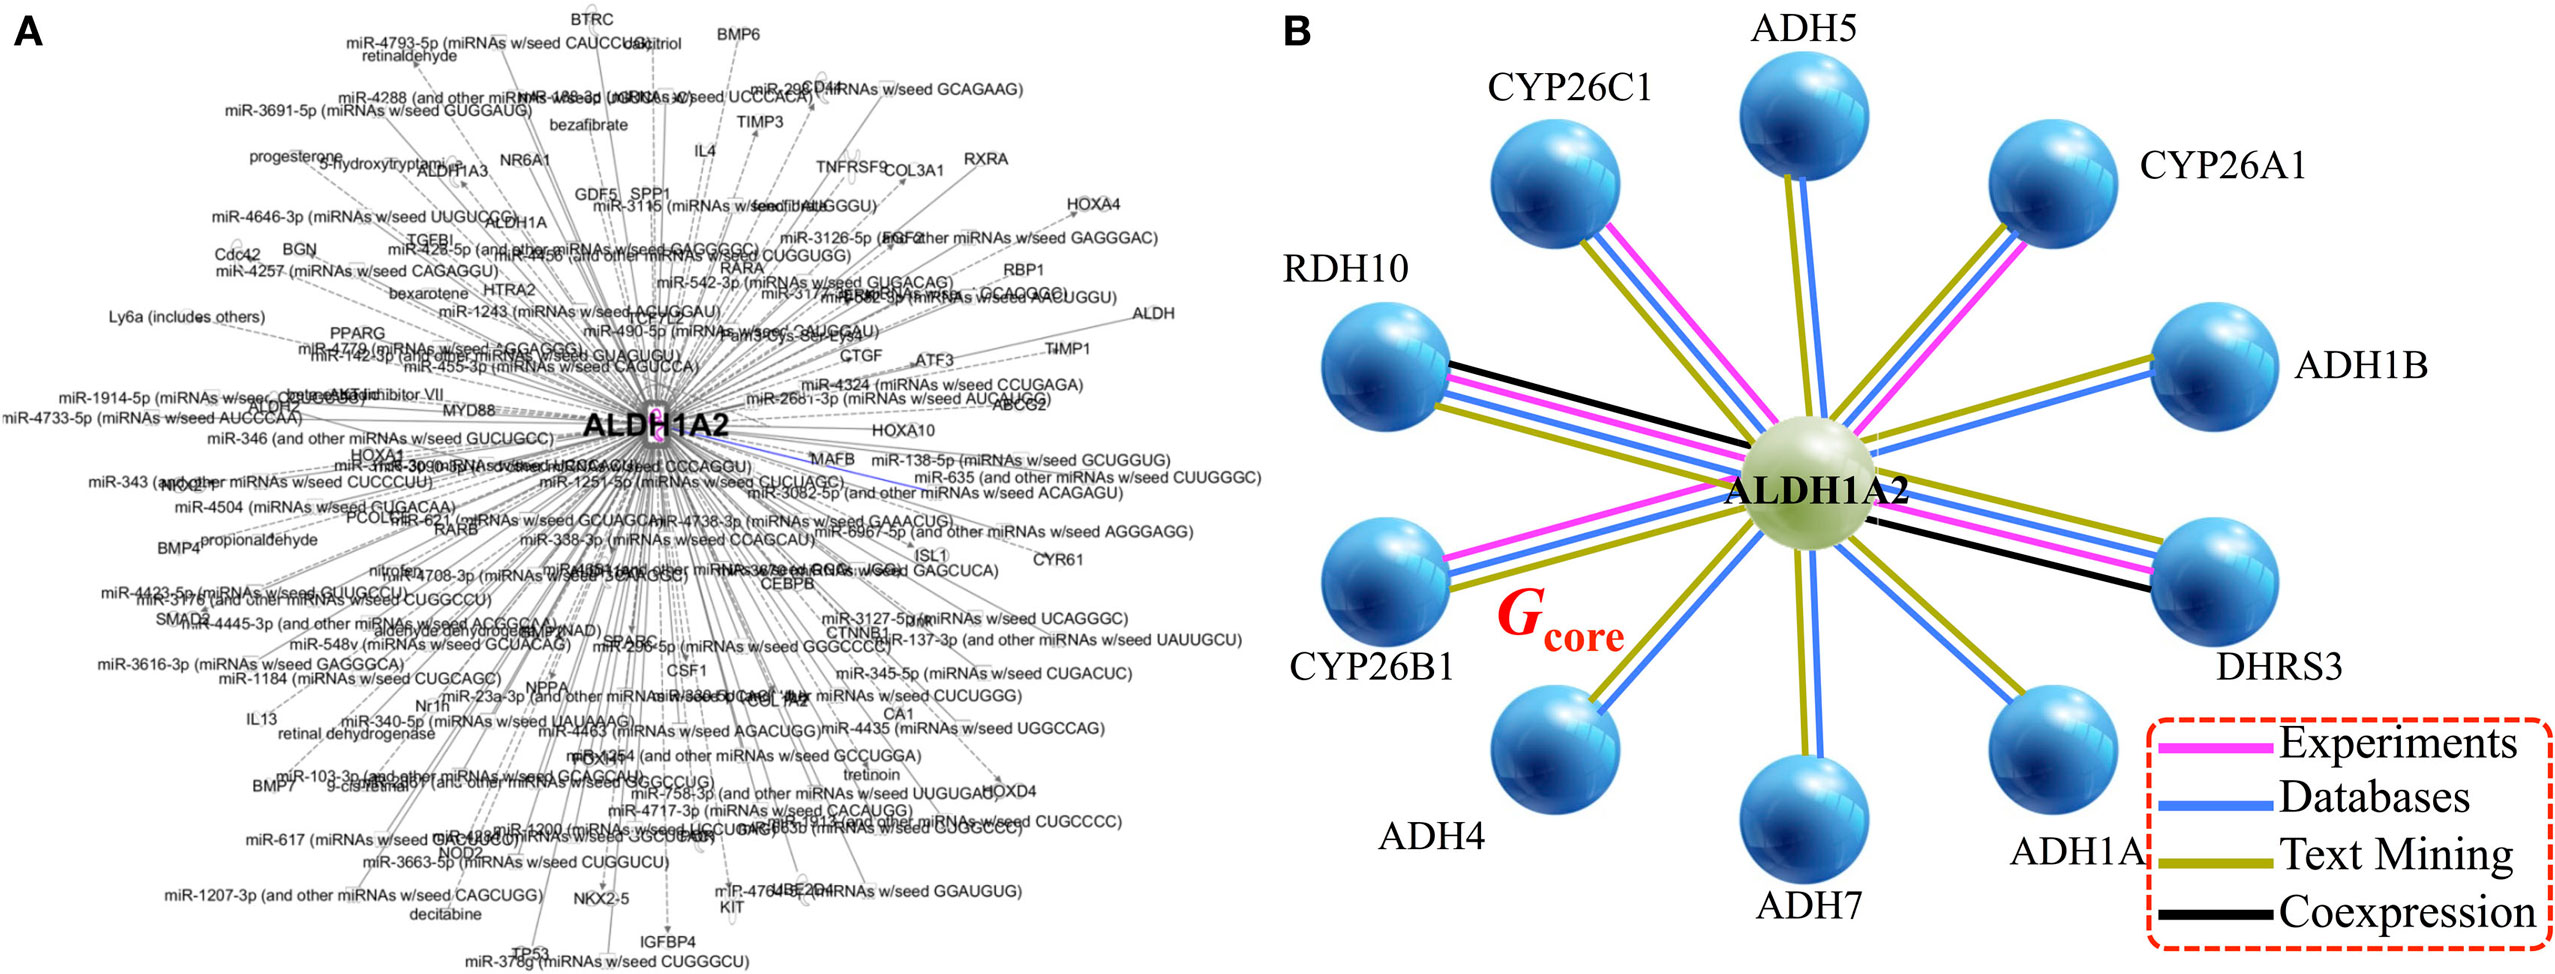
Figure 2. Gene/protein interaction network of ALDH1A2. (A) Network expansion phase: Ingenuity Pathway Analysis tool gives 279 interaction partners of ALDH1A2. (B) Network contraction phase: BIOGRID 3.4 and STRING 10 databases reduce the 279-node ALDH1A2 network down to 11 nodes (genes/proteins), with a minimum of two lines of evidence (indicated with colored lines).
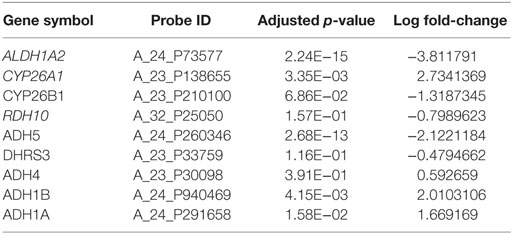
Table 2. Differential gene expression analysis between cancer and normal samples based on Grasso et al. dataset (23).
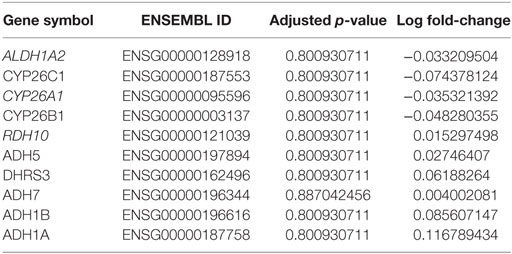
Table 3. Differential methylation analysis between tumor and normal samples based on Brocks et al. dataset (22).
OGS Expression Profiles Based on Predictive Power Using the TCGA Patient Cohort
The TCGA dataset contained 491 PCa cases for which there was clinical information, and of those, 92 patients (18.7%) had relapsed. A comparison between relapsed patients and patients with DFS did not identify any significant differences in the clinical characteristics of age, number of lymph nodes removed, and most recent PSA value (all p-values ≥0.05 using heteroscedastic unpaired t-test; Table 4).
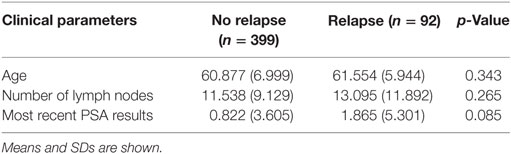
Table 4. Heteroscedastic unpaired t-test of 491 patients in The Cancer Genome Atlas cohort shows no difference between age, number of lymph nodes, and most recent prostate-specific antigen (PSA) results with reference to disease relapse.
We investigated the relationship between DFS and every possible candidate gene set based on the core gene set Gcore, defined as the power set of Gcore. The KM log-rank statistic was used for unbiased exploration of these gene subsets in correlation with DFS, producing a DFS landscape (Figure 3A). Surprisingly, the KM p-values were found to be statistically significant for only two gene sets (Figure 3A, below dashed line), at a probability of 2/2047 = 0.1%. The OGS comprises CYP26C1 and RDH10, both of which coordinate tightly with ALDH1A2 to control RA activities (36, 37).
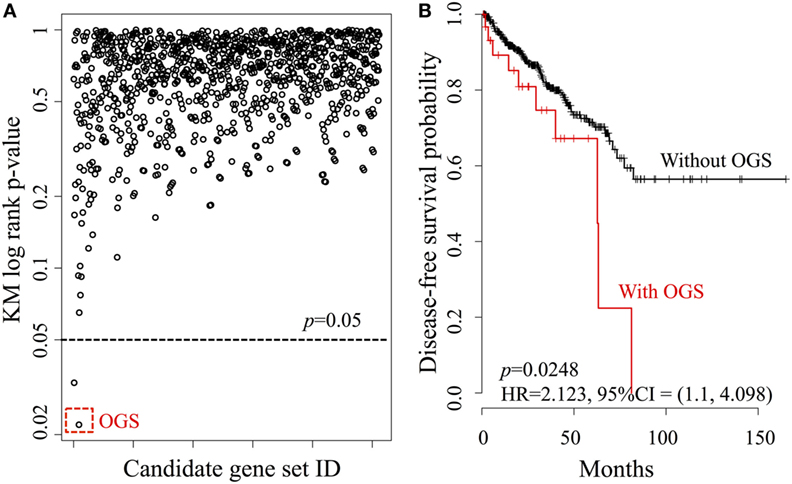
Figure 3. Systematic analysis of all candidate gene sets, generated from the power set of 11 genes in Gcore. (A) The DFS Kaplan–Meier (KM) log-rank p-value landscape from the ALDH1A2-derived candidate gene sets. The optimal gene set (OGS) according to KM log-rank p-values is indicated (red dashed box). (B) KM log-rank survival curves of n = 491 patients in the TCGA cohorts with respect to the presence or absence of aberrant expression (based on z-statistics) of genes in the OGS.
We then compared DFS in the patient cohort (n = 491) with altered expression of the two genes in the OGS (Figure 3B). Being positive for OGS, defined as having significantly altered expression of any or all of the genes in the OGS signature, was associated with statistically significant poor survival (log-rank p-value = 0.0248, HR = 2.213, 95% CI = 1.1–4.098). A strong correlation is seen between OGS and DFS: patients with OGS have median DFS of 62.7 months (Figure 3B, red curve) while >55% patients without OGS are still disease-free after 150 months (Figure 3B, black curve).
Complementarity of Prognostic Value of OGS with Traditional Clinical Measures
We performed univariate Cox regression to investigate the association between OGS and Gleason score (Table 5). Gleason score, devised in the 1960s and 1970s by Donald Floyd Gleason, is one of the most well-established clinical measures of PCa disease status, where the conventional scale of 6–10 (hereby referred to as OldGleason) is routinely practiced (38). Recently, John Hopkins researchers challenged this old scale and proposed a new scale of 1–5 (hereby referred to as Gleason) that was validated to exhibit better prognostic values (15). In agreement with recent studies (7), low grade Gleason scores (OldGleason 6 and 3 + 4) are not predictive of disease relapse (Table 5). In contrast, whether a patient has altered OGS expression (based on gene expression, |z| > 1.96, see Bioinformatics Analysis) can predict DFS based on Cox regression analysis (Table 5, p = 0.0248, HR = 2.123). Further, ANOVA analysis of the multivariable Cox regression model with OGS plus Gleason score (Gleason + OGS, Table 6) shows that adding the OGS variable significantly improve the predictive power of Gleason score alone in a univariable Cox regression model (p = 2.19 × 10⁻¹¹ at 4 degrees of freedom).
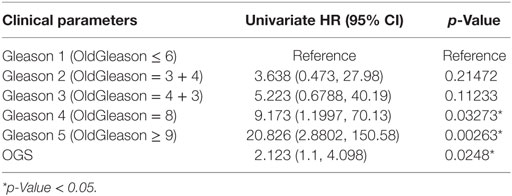
Table 5. Univariate Cox regression analysis of Gleason score and optimal gene set (OGS), with respect to disease-free survival.
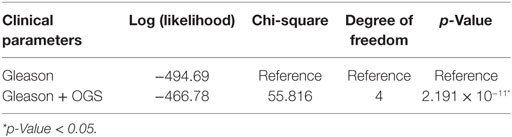
Table 6. ANOVA analysis for multivariable Cox regression models of Gleason score and/or optimal gene set (OGS).
Discussion
As the number of large-scale genomics datasets exponentially increases due to decreasing experimental costs, current limitations reside in our capacity to extract relevant information. Our study illustrates a novel pipeline applicable to any range of disease cohorts that can assist in mining these datasets in a robust and unbiased way to generate clinically relevant knowledge. Combinatorial enumeration of all possible subsets of n genes with DFS helps isolate k gene sets based on statistical significance (i.e., KM log-rank p-value < 0.05). From there, we are able to identify an OGS signature, whose dysregulation can be associated with DFS in early stage PCa patients (Figure 3). We illustrate this process with ALDH1A2, where by using this RA as a seed for the data-mining pipeline, we identify an initial set of n = 11 genes, which is reduced by statistical significance, first to k = 2 gene sets, and then refined to an OGS containing just two genes. This optimal gene signature has significant predictive power of relapse, both alone and in combination with the traditional histological Gleason score.
The decision to use ALDH1A2 as a seed for our case study comes from the increasing evidence for the role of RAs in mammalian homeostasis and disease, especially the intimate association of the RA signaling pathway with a variety of cancers, including leukemia, neuroblastomas, and carcinomas, as well as gastric, ovarian, lung, breast, colon, rectal, pancreatic, and PCas (18–20). In PCa, a previous study has found hypermethylation of ALDH1A2 in cancer cell lines subjected to treatment with the chemotherapeutic agent 5-aza-2′-deoxycytidine (18). Hypermethylation of ALDH1A2 led to reduced gene expression in PCa cell lines. Moreover, ALDH1A2 levels were also reduced in human primary prostate tumors when compared with normal prostate tissue. Reduced expression of ALDH1A2 also correlated with shorter recurrence-free survival of patients, suggesting that ALDH1A2 may in fact be a tumor suppressor gene for PCa. A second study using an adenocarcinoma prostate model confirmed reduction of ALDH1A2 in prostate tumors in mice (33). This study was further supported by measuring ALDH1A2 protein levels in prostate tissue from PCa patients, where PCa tissue samples showed reduced ALDH1A2 expression compared with healthy tissue. Finally, the ALDH1A2 case study has been chosen because of its potential significance other disease models, as we have previously demonstrated that the ALDH1A2 pathway is involved in a completely different disease context, i.e., cardiac fibrosis (39, 40).
Our case study results are not only consistent with the evidence for the role of ALDH1A2 in PCa but also show that the ALDH1A2 pathway could potentially be used as biomarker for treatment selection: aberrant expression of genes involved in the regulation of ALDH1A2 defines a patient group associated with a significantly high risk of relapse, thereby facilitating stratification of patients to ensure the appropriate individualized selection of therapy. Combining the OGS with clinical parameters, especially Gleason score, further increases discrimination between relapsing and non-relapsing patients.
The combinatorial ranking procedure can be applied to other cancers, with appropriate adjustment based on the available datasets. We performed combinatorial ranking on the TCGA Breast Cancer dataset with 10 genes of Gcore (ADH1B was excluded due to missing data in this cohort). The metrics used was KM log-rank p-values for overall survival, rather than DFS. The procedure returned three significant gene sets with p < 0.05 (Figure S1 in Supplementary Material), where the OGS* contains ADH5, ADH7, and CYP26A1. Being positive for OGS* was associated with statistically significant poor overall survival (log-rank p-value = 0.0201, HR = 1.245, 95% CI = 1.035–1.497).
The major limitations of this study relate to the data. In this cohort, patients were seen at multiple different institutions, which could lead to some biases in sample collection and data collection and processing. Added to this, overall survival information is not available, which therefore limits the analysis to DFS. This is a significant issue in diseases such as PCa, where there may be a long period of time prior to relapse. Our analysis also does not take in to account the type of treatment that was administered, which could affect patient outcomes. Finally, our automated data-mining approach has a benefit of being unbiased, but at the same time we may lose some of the expertise-driven analyses that are emerging from studies of individual genes.
Despite these limitations, our ALDH1A2-derived OGS is nevertheless highly predictive of PCa relapse, and of particular note it is predictive in the context of early PCa, where decisions around treatment can be most difficult in terms of being appropriate and proportional to the disease severity and prognosis. The pipeline is automated, which allows a large-scale and unbiased assessment of the available data, such that just a single seed gene can be used to generate then rank very large numbers of gene panels, and is designed to be intuitive for clinicians. The case study illustrates the power of the pipeline with PCa but can the technology be applied to any cancer, or indeed any other disease, especially where clinical data are available to assess the prognostic value of the gene panel, ahead of clinical assessment, and validation of the derived optimal gene signature.
Author Contributions
HTN designed the study, acquired, analyzed, and interpreted the data. MF, MR, and SEB designed the study and interpreted the data with expertise in genetics, bioinformatics, and systems biology, respectively. All authors contribute to writing the manuscript. HTN, MF, MR, and SEB all met the four criteria for authorship as listed below: substantial contributions to the conception or design of the work; or the acquisition, analysis, or interpretation of data for the work; and drafting the work or revising it critically for important intellectual content; and final approval of the version to be published; and agreement to be accountable for all aspects of the work in ensuring that questions related to the accuracy or integrity of any part of the work are appropriately investigated and resolved.
Conflict of Interest Statement
The authors declare that the research was conducted in the absence of any commercial or financial relationships that could be construed as a potential conflict of interest.
Acknowledgments
The authors would like to thank Dr. Mahesh Iddawela and Prof. Falk Schreiber for helpful discussion. The Australian Regenerative Medicine Institute is supported by grants from the State Government of Victoria and the Australian Government.
Funding
Work partially supported by the Victoria Cancer Agency and the Richard Pratt Fellowships in Prostate Cancer to HTN, National Health and Medical Research Council/Heart Foundation Career Development Fellowship to MR, and Australian Research Council Discovery Project Grant DP130104792 to SEB.
Supplementary Material
The Supplementary Material for this article can be found online at http://journal.frontiersin.org/article/10.3389/fonc.2017.00030/full#supplementary-material.
Figure S1. Systematic analysis of all candidate gene sets in The Cancer Genome Atlas (TCGA) breast cancer cohort (n = 2,509), generated from the power set of Gcore. Out of 11 genes in Gcore, the ADH1B gene was excluded due to missing data from this cohort, leaving 10 remaining genes for power set generation. (A) The overall survival KM log-rank p-value landscape from the ALDH1A2-derived candidate gene sets. The optimal gene set (OGS*) according to KM log-rank p-values is indicated (red dashed box), which contains three genes: ADH5, ADH7, and CYP26A1. (B) KM log rank overall survival curves of patients in the TCGA breast cancer cohorts with respect to the presence or absence of aberrant expression (based on z-statistics) of 10 genes in OGS*.
Data S1. R script for executing the combinatorial ranking pipeline is maintained via GitHub at https://github.com/nimt0001/CombinatorialRank. The code performs combinatorial ranking based on a specific patient cohort from TCGA. As the TCGA database is updated regularly, results from the provided R script can change from run to run and should be used only as a reference.
References
1. Cancer Genome Atlas Research Network. The molecular taxonomy of primary prostate cancer. Cell (2015) 163(4):1011–25. doi: 10.1016/j.cell.2015.10.025
2. Zhang J, Baran J, Cros A, Guberman JM, Haider S, Hsu J, et al. International Cancer Genome Consortium Data Portal – a one-stop shop for cancer genomics data. Database (Oxford) (2011) 2011:bar026. doi:10.1093/database/bar026
3. Ma’ayan A, Rouillard AD, Clark NR, Wang Z, Duan Q, Kou Y. Lean Big Data integration in systems biology and systems pharmacology. Trends Pharmacol Sci (2014) 35(9):450–60. doi:10.1016/j.tips.2014.07.001
4. Du W, Elemento O. Cancer systems biology: embracing complexity to develop better anticancer therapeutic strategies. Oncogene (2015) 34(25):3215–25. doi:10.1038/onc.2014.291
5. Chibon F. Cancer gene expression signatures – the rise and fall? Eur J Cancer (2013) 49(8):2000–9. doi:10.1016/j.ejca.2013.02.021
6. Guy GP Jr, Ekwueme DU, Yabroff KR, Dowling EC, Li C, Rodriguez JL, et al. Economic burden of cancer survivorship among adults in the United States. J Clin Oncol (2013) 31(30):3749–57. doi:10.1200/JCO.2013.49.1241
7. Irshad S, Bansal M, Castillo-Martin M, Zheng T, Aytes A, Wenske S, et al. A molecular signature predictive of indolent prostate cancer. Sci Transl Med (2013) 5(202):202ra122. doi:10.1126/scitranslmed.3006408
8. Gevaert O, De Smet F, Timmerman D, Moreau Y, De Moor B. Predicting the prognosis of breast cancer by integrating clinical and microarray data with Bayesian networks. Bioinformatics (2006) 22(14):e184–90. doi:10.1093/bioinformatics/btl230
9. Stojadinovic A, Nissan A, Eberhardt J, Chua TC, Pelz JO, Esquivel J. Development of a Bayesian Belief Network Model for personalized prognostic risk assessment in colon carcinomatosis. Am Surg (2011) 77(2):221–30.
10. Kourou K, Exarchos TP, Exarchos KP, Karamouzis MV, Fotiadis DI. Machine learning applications in cancer prognosis and prediction. Comput Struct Biotechnol J (2015) 13:8–17. doi:10.1016/j.csbj.2014.11.005
11. Beltran H, Demichelis F. Prostate cancer: intrapatient heterogeneity in prostate cancer. Nat Rev Urol (2015) 12(8):430–1. doi:10.1038/nrurol.2015.182
12. Boyd LK, Mao X, Lu Y-J. The complexity of prostate cancer: genomic alterations and heterogeneity. Nat Rev Urol (2012) 9(11):652–64. doi:10.1038/nrurol.2012.185
13. Cary KC, Cooperberg MR. Biomarkers in prostate cancer surveillance and screening: past, present, and future. Ther Adv Urol (2013) 5(6):318–29. doi:10.1177/1756287213495915
14. Prensner JR, Rubin MA, Wei JT, Chinnaiyan AM. Beyond PSA: the next generation of prostate cancer biomarkers. Sci Transl Med (2012) 4(127):127rv3. doi:10.1126/scitranslmed.3003180
15. Epstein JI, Zelefsky MJ, Sjoberg DD, Nelson JB, Egevad L, Magi-Galluzzi C, et al. A contemporary prostate cancer grading system: a validated alternative to the Gleason score. Eur Urol (2015) 69(3):428–35. doi:10.1016/j.eururo.2015.06.046
16. Nim HT, Furtado MB, Costa MW, Rosenthal NA, Kitano H, Boyd SE. VISIONET: intuitive visualisation of overlapping transcription factor networks, with applications in cardiogenic gene discovery. BMC Bioinformatics (2015) 16:141. doi:10.1186/s12859-015-0578-0
17. Gutierrez-Mazariegos J, Theodosiou M, Campo-Paysaa F, Schubert M. Vitamin A: a multifunctional tool for development. Semin Cell Dev Biol (2011) 22(6):603–10. doi:10.1016/j.semcdb.2011.06.001
18. Kim H, Lapointe J, Kaygusuz G, Ong DE, Li C, van de Rijn M, et al. The retinoic acid synthesis gene ALDH1a2 is a candidate tumor suppressor in prostate cancer. Cancer Res (2005) 65(18):8118–24. doi:10.1158/0008-5472.CAN-04-4562
19. Li K, Guo X, Wang Z, Li X, Bu Y, Bai X, et al. The prognostic roles of ALDH1 isoenzymes in gastric cancer. Onco Targets Ther (2016) 9:3405–14. doi:10.2147/OTT.S102314
20. Ma YM, Zhao S. Prognostic values of aldehyde dehydrogenase 1 isoenzymes in ovarian cancer. Onco Targets Ther (2016) 9:1981–8. doi:10.2147/OTT.S101063
21. Cerami E, Gao J, Dogrusoz U, Gross BE, Sumer SO, Aksoy BA, et al. The cBio cancer genomics portal: an open platform for exploring multidimensional cancer genomics data. Cancer Discov (2012) 2(5):401–4. doi:10.1158/2159-8290.CD-12-0095
22. Brocks D, Assenov Y, Minner S, Bogatyrova O, Simon R, Koop C, et al. Intratumor DNA methylation heterogeneity reflects clonal evolution in aggressive prostate cancer. Cell Rep (2014) 8(3):798–806. doi:10.1016/j.celrep.2014.06.053
23. Grasso CS, Wu YM, Robinson DR, Cao X, Dhanasekaran SM, Khan AP, et al. The mutational landscape of lethal castration-resistant prostate cancer. Nature (2012) 487(7406):239–43. doi:10.1038/nature11125
24. Furtado MB, Nim HT, Gould JA, Costa MW, Rosenthal NA, Boyd SE. Microarray profiling to analyse adult cardiac fibroblast identity. Genom Data (2015) 2:345–50. doi:10.1016/j.gdata.2014.10.006
25. Assenov Y, Muller F, Lutsik P, Walter J, Lengauer T, Bock C. Comprehensive analysis of DNA methylation data with RnBeads. Nat Methods (2014) 11(11):1138–40. doi:10.1038/nmeth.3115
26. Maksimovic J, Gordon L, Oshlack A. SWAN: subset-quantile within array normalization for illumina infinium HumanMethylation450 BeadChips. Genome Biol (2012) 13(6):R44. doi:10.1186/gb-2012-13-6-r44
27. Therneau TM, Grambsch PM. Modeling Survival Data: Extending the Cox Model. New York: Springer (2000). doi:10.1007/978-1-4757-3294-8
28. Chatr-Aryamontri A, Breitkreutz BJ, Oughtred R, Boucher L, Heinicke S, Chen D, et al. The BioGRID interaction database: 2015 update. Nucleic Acids Res (2014) 43(Database issue):D470–8. doi:10.1093/nar/gku1204
29. Szklarczyk D, Franceschini A, Wyder S, Forslund K, Heller D, Huerta-Cepas J, et al. STRING v10: protein-protein interaction networks, integrated over the tree of life. Nucleic Acids Res (2014) 43(Database issue):D447–52. doi:10.1093/nar/gku1003
30. Dennis G Jr, Sherman BT, Hosack DA, Yang J, Gao W, Lane HC, et al. DAVID: database for annotation, visualization, and integrated discovery. Genome Biol (2003) 4(5):3. doi:10.1186/gb-2003-4-9-r60
31. Kanehisa M, Goto S. KEGG: Kyoto encyclopedia of genes and genomes. Nucleic Acids Res (2000) 28(1):27–30. doi:10.1093/nar/28.1.27
32. Kikuchi K, Holdway JE, Major RJ, Blum N, Dahn RD, Begemann G, et al. Retinoic acid production by endocardium and epicardium is an injury response essential for zebrafish heart regeneration. Dev Cell (2011) 20(3):397–404. doi:10.1016/j.devcel.2011.01.010
33. Touma SE, Perner S, Rubin MA, Nanus DM, Gudas LJ. Retinoid metabolism and ALDH1A2 (RALDH2) expression are altered in the transgenic adenocarcinoma mouse prostate model. Biochem Pharmacol (2009) 78(9):1127–38. doi:10.1016/j.bcp.2009.06.022
34. Wu S, Xue W, Huang X, Yu X, Luo M, Huang Y, et al. Distinct prognostic values of ALDH1 isoenzymes in breast cancer. Tumour Biol (2015) 36(4):2421–6. doi:10.1007/s13277-014-2852-6
35. You Q, Guo H, Xu D. Distinct prognostic values and potential drug targets of ALDH1 isoenzymes in non-small-cell lung cancer. Drug Des Devel Ther (2015) 9:5087–97. doi:10.2147/DDDT.S87197
36. Wan C, Shi Y, Zhao X, Tang W, Zhang M, Ji B, et al. Positive association between ALDH1A2 and schizophrenia in the Chinese population. Prog Neuropsychopharmacol Biol Psychiatry (2009) 33(8):1491–5. doi:10.1016/j.pnpbp.2009.08.008
37. Sandell LL, Lynn ML, Inman KE, McDowell W, Trainor PA. RDH10 oxidation of vitamin A is a critical control step in synthesis of retinoic acid during mouse embryogenesis. PLoS One (2012) 7(2):e30698. doi:10.1371/journal.pone.0030698
38. Phillips JL, Sinha AA. Patterns, art, and context: Donald Floyd Gleason and the development of the Gleason grading system. Urology (2009) 74(3):497–503. doi:10.1016/j.urology.2009.01.012
39. Nim HT, Boyd SE, Rosenthal NA. Systems approaches in integrative cardiac biology: illustrations from cardiac heterocellular signalling studies. Prog Biophys Mol Biol (2014) 117(1):69–77. doi:10.1016/j.pbiomolbio.2014.11.006
Keywords: prostate cancer, retinoic acid, prognosis, systems biology, The Cancer Genome Atlas, data mining
Citation: Nim HT, Furtado MB, Ramialison M and Boyd SE (2017) Combinatorial Ranking of Gene Sets to Predict Disease Relapse: The Retinoic Acid Pathway in Early Prostate Cancer. Front. Oncol. 7:30. doi: 10.3389/fonc.2017.00030
Received: 09 December 2016; Accepted: 20 February 2017;
Published: 15 March 2017
Edited by:
William Cho, Queen Elizabeth Hospital (QEH), Hong KongReviewed by:
Gaetano Facchini, National Cancer Institute “Fondazione Giovanni Pascale” – IRCCS, ItalyVijay Pandey, Cancer Science Institute of Singapore, Singapore
Simeng Suy, Georgetown University, USA
Copyright: © 2017 Nim, Furtado, Ramialison and Boyd. This is an open-access article distributed under the terms of the Creative Commons Attribution License (CC BY). The use, distribution or reproduction in other forums is permitted, provided the original author(s) or licensor are credited and that the original publication in this journal is cited, in accordance with accepted academic practice. No use, distribution or reproduction is permitted which does not comply with these terms.
*Correspondence: Hieu T. Nim, hieu.nim@monash.edu