 Yasser Khouj1
 Jeremy Dawson
 Linda Vona-Davis
- 1Lane Department of Computer Science and Electrical Engineering, West Virginia University, Morgantown, WV, United States
- 2Department of Pathology, West Virginia University, Morgantown, WV, United States
- 3West Virginia University Cancer Institute, Morgantown, WV, United States
- 4Department of Surgery, West Virginia University, Morgantown, WV, United States
Hyperspectral imaging (HSI) is a non-invasive optical imaging modality that shows the potential to aid pathologists in breast cancer diagnoses cases. In this study, breast cancer tissues from different patients were imaged by a hyperspectral system to detect spectral differences between normal and breast cancer tissues. Tissue samples mounted on slides were identified from 10 different patients. Samples from each patient included both normal and ductal carcinoma tissue, both stained with hematoxylin and eosin stain and unstained. Slides were imaged using a snapshot HSI system, and the spectral reflectance differences were evaluated. Analysis of the spectral reflectance values indicated that wavelengths near 550 nm showed the best differentiation between tissue types. This information was used to train image processing algorithms using supervised and unsupervised data. The K-means method was applied to the hyperspectral data cubes, and successfully detected spectral tissue differences with sensitivity of 85.45%, and specificity of 94.64% with true negative rate of 95.8%, and false positive rate of 4.2%. These results were verified by ground-truth marking of the tissue samples by a pathologist. In the hyperspectral image analysis, the image processing algorithm, K-means, shows the greatest potential for building a semi-automated system that could identify and sort between normal and ductal carcinoma in situ tissues.
Introduction
Breast cancer is one of the highest causes of cancer deaths among American women (1–4). According to the U.S. Breast Cancer Organization, statistics show that about one in eight U.S. women will develop invasive breast cancer over their lifetime (1–3). In 2016, about 246,660 new cases of invasive breast cancer were diagnosed in women. The role of the pathologist is undeniably important for cancer diagnosis (4, 5). However, as the number of breast cancer cases increases, the burden of pathological cases becomes onerous. Thus, any new technology that can expedite breast cancer detection and diagnosis using biopsy slides, making the process easier and more efficient, is warranted.
Hyperspectral imaging (HSI) is a sophisticated non-invasive optical imaging modality that has the potential to accelerate medical imaging research and clinical practice. It is an optical imaging modality that collects and analyzes spectral information from across the electromagnetic spectrum, typically spanning the visible wavelengths between 450 and 700 nm, but also extending to the infrared (>700 nm) and UV (<450 nm). HSI has advantages over conventional imaging in that it provides the spectral reflection or absorption characteristics of the object being imaged in the form of spectral channels contained in an image data hypercube (6–8). Preliminary research performed by the WVU Optical Imaging group at the WVU Cancer Institute has demonstrated that HSI and classification methods could distinguish between tumor and normal tissue in animal experiments with different tumor sizes without the use of contrast agents (9). The same researchers imaged pathological slides using a hyperspectral camera and reported the detection of head and neck metastasis ex vivo with promising sensitivity and specificity.
The purpose of this study was to evaluate the performance of a snapshot hyperspectral imager, the Arrow system from Rebellion Photonics, to determine if measurable differences in spectral properties exist between normal and various stages of cancerous breast tissues fixed on biopsy slides (10, 11). We hypothesized that a hyperspectral imager could spectrally determine the difference between normal and cancerous tissue on both stained and unstained slides. In tissues verified by a pathologist, we further predicted that image processing techniques could successfully differentiate between tissues in a semi-automated fashion (9, 12–14).
Materials and Methods
Instrumentation
The hyperspectral camera was connected to an upright microscope (Nikon Optiphot-2) with at 12V-100W LL halogen lamp illumination source to capture images from biopsy slides. All images were captured using a CF Achromatic P40x objective. The arrow snapshot HSI camera is capable of two imaging configurations with two different sets of spectral bands. The configuration that was used in this study is 443 × 313 pixel resolution in the spatial domain, with 31 bands in spectral domain. The spectral range of this system is within the visible light spectrum between 461 and 641 nm. The field of view of the hyperspectral camera attached to the microscope with a 40× objective in its best resolution is 100 µm × 80 µm, allowing the capture of many images from a single tissue sample, which averaged 8.0 × 10⁻⁵ cm2 for this study.
An illustration showing the hyperspectral cube and graph of pixel spectrum are shown in Figure 1. The hypercube is essentially a three-dimensional dataset, which means even a single pixel contains a feature vector with over 10 dimensions within the entire spectrum of reflectance information (15, 16). The technology of the hyperspectral imager requires using optical sensors, which are adjusted to collect spectral information in several narrow bands or channels. Typically, these channels range between 2 and 10 nm wide. HSI sensors produce image data in dozens or hundreds of narrow spectral bands (17–21). HSI technology, when properly exploited, can be used in optical imaging applications such as optical medical imaging in clinical and research applications such as the work described here focused on breast cancer tissue detection (22, 23).
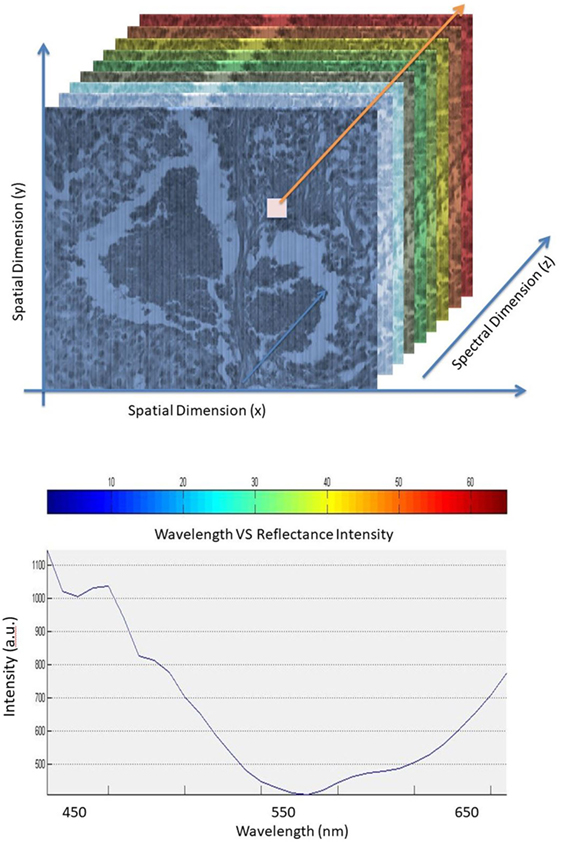
Figure 1. Hyperspectral cube (top). Pixel spectrum in the spectral dimension (bottom).
The information collected from the imaging system was analyzed to obtain a continuous spectrum for each image pixel or cell as shown in Figure 2. Areas targeted by the imaging system may have different biological, and chemical compositions that can be detected by the sensor due to differences in light reflection or absorption. The image spectra can be compared with reflectance spectra collected in the field or in a laboratory to recognize and map surface materials such as particular types of vegetation or diagnostic minerals associated with ore deposits (20). Hyperspectral images contain a rich collection of data, which requires an understanding of the optical properties of different materials, how they are being measured, and how they relate to the measurements made by the hyperspectral sensor (20).
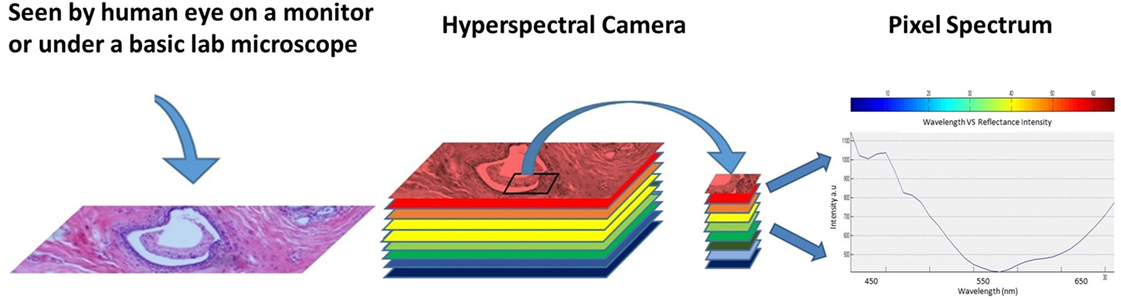
Figure 2. Regular image of the breast tissue, hyperspectral image, and the spectrum of the marked pixel.
There are several methods used to create hyperspectral imagery. When comparing between different methods, such as hyperspectral line scan and hyperspectral snapshot imaging, it is important to consider both imaging techniques, as well as advantages and disadvantages of both systems (24, 25). In the case of line scan, each image collects one wavelength after the other, and the field of view of the imaging system is fixed to build the hypercube (26, 27). However, in the case of the snapshot method, both spatial and spectral information of the target are captured with one exposure (28).
The snapshot method (used in this study) is an imaging technique that does not require scanning at all. As shown in Figure 3, the snapshot camera has the capability to produce a complete spectral data cube in a single integration by directly imaging the target zones onto the spectral, and spatial detectors simultaneously (28–30). In the line scan method, time and stability are required, and it is necessary to wait until all wavelength images have been recorded, which takes between several seconds to minutes of measurement time, in addition to a few seconds wait time between scans, depending on the imaged target and the imager capability from illumination and integration conditions (31).
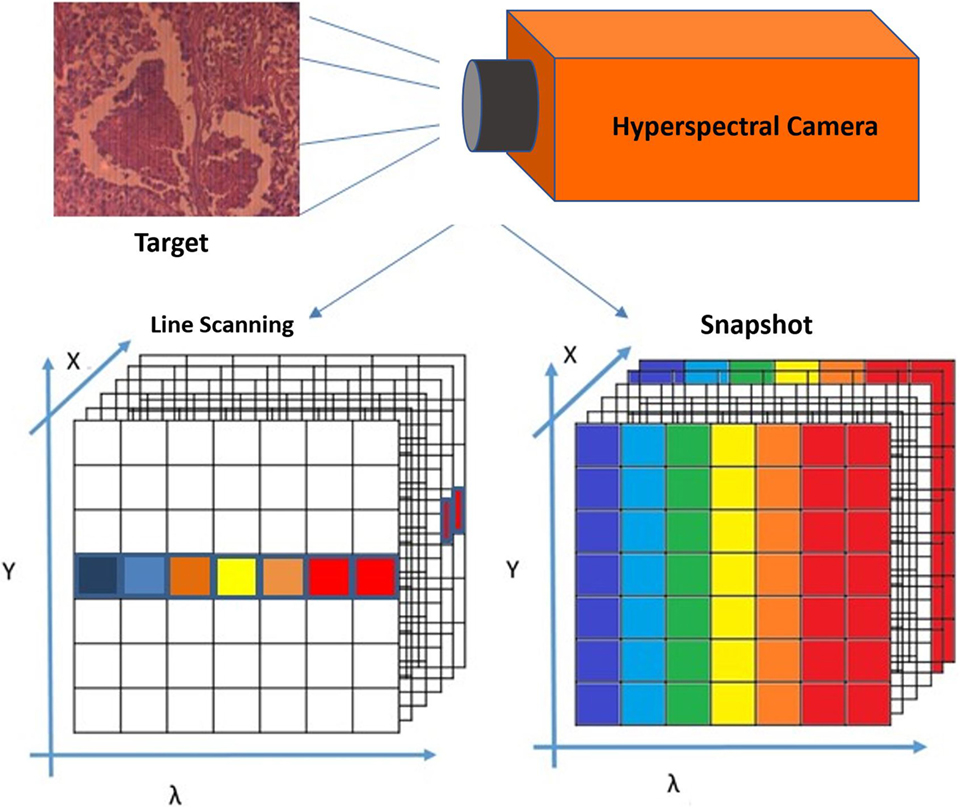
Figure 3. Building the spectral data cube in both line scan and snapshot systems.
HSI Image Processing and Data Analysis
Image processing consists of a mathematical algorithm that, when applied, derives information from an image that can be used in automated image analysis systems. K-means is a learning algorithm used to solve unsupervised data classification problems (15, 32). Unsupervised clustering is used to describe processes where a classifier is assigned a dataset without preexisting labels (33, 34). For hyperspectral data, the classifier can be used to find spectral classes in a multiband image without assigned values from the data provider. The clustering treats unsupervised data by providing access to the tools to learn the classification from the data itself to create clusters that group the data based on the desired classification (34).
The idea is to define k centers, one for each cluster. Ideally, the best choice is to place them as far away from each other as possible, to increase the detection accuracy, and to reduce the number of error events (35). The next step is to take each point belonging to a given data set and associate it to the nearest center. In this case, each class will have one centroid, and the result becomes more stable with increased iterations, which means they reach a consensus. Also, the more data the classifier is given, the better the centroid accuracy will be (35, 36).
Equations 1 and 2 describe the basic process of choosing clusters in the K-means algorithm. First, this algorithm minimizes the objective function, J(V), is calculated using [Ref. (36)]:
where “||xi − vj||” is the Euclidean distance between xi and vj. “ci” is the number of data points in ith cluster, and “c” is the number of cluster centers.
The process starts by randomly selecting “c” cluster centers, then calculating the distance between each data point and cluster centers. After that, a data point is assigned to the cluster center whose distance from the cluster center is the minimum of all the cluster centers.
The new cluster center, vi, is recalculated using the minimum-distance classifier equation [Ref. (35)]:
Then, the distance between each data point and newly obtained cluster centers is recalculated. Finally, if no data point was reassigned, the calculation loop is stopped. Otherwise, it is repeated until no changes in the centroid values occur (35).
Cellular Imaging
This section provides a description of the snapshot HSI of human breast cancer tissue [obtained under WVU IRB protocol #1509816662 (Non-Human Subject Research)]. The samples are grouped as follows: (1) hematoxylin and eosin (H&E) stained normal and ductal carcinoma in situ (DCIS) samples and (2) unstained samples of normal and DCIS tissues. In the first imaging experiment, the HSI system was applied on 10 samples from patients that have tested positive for invasive ductal carcinoma breast cancer. Each patient has two H&E tissue samples marked by a pathologist. The second imaging experiment includes set of breast tissue samples taken from the same 10 patients, but without staining to observe the spectral signature of both normal and cancer tissues in an unstained state. The thickness of each sample was 5 μm. Example images from biopsy slides shown in Figure 4 for a single subject displaying both normal and DCIS tissue DCIS. Each slide was imaged by the hyperspectral imager. Figure 4 shows the H&E stained and unstained samples of the normal ducts, and DCIS of the patient with a monochromatic hyperspectral image at the chosen wavelength channel. A visible image of H&E-stained as well as -unstained normal duct, and DCIS tissue are shown for the example subject, as well as the regions that were selected for HSI for select wavelengths ranging from 460 to 650 nm.
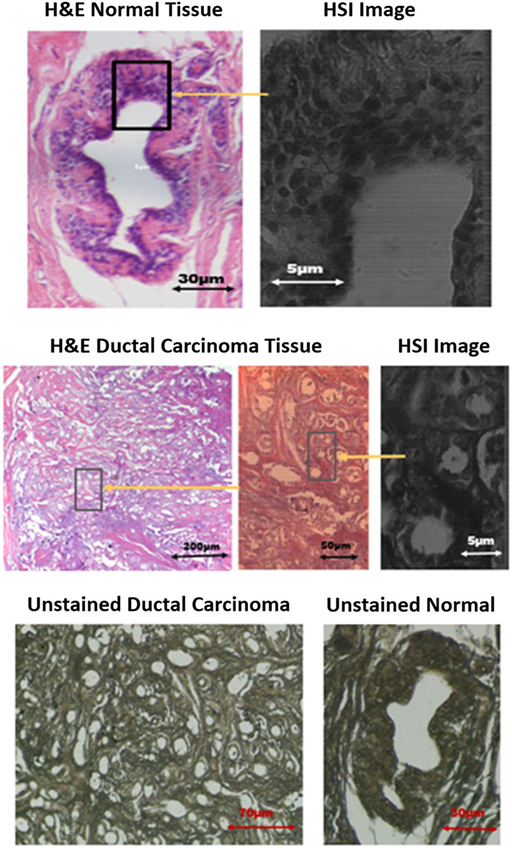
Figure 4. Images of stained and unstained samples. The marked [hyperspectral imaging (HSI)] are representing the chosen wavelength channel (550 nm) for detection.
Results and Discussion
The large amount of data contained in the three-dimensional hyperspectral data cube was evaluated in multiple steps as shown in Figure 5. All images were manually marked by a pathologist for providing ground-truth description of the tissue samples showing evidence of cancer. Training the auto detection algorithm and evaluating the accuracy on tissue samples that are not included in the training set is an important step. All marked areas on the samples possessed a high density of tumor tissue within the designated region, as identified by the pathologist. Image processing techniques were applied to look at the regions of interest identified by the pathologist and, ultimately, determine the spectral reflectance of tissues in these regions over the visible light wavelength spectrum. The image processing and HSI toolboxes contained in both MATLAB and Waikato Environment for Knowledge Analysis (WEKA) were used in image processing. WEKA is a collection of machine learning algorithms for data mining tasks that were developed at University of Waikato, New Zealand. In this work, the algorithms are used to learn the about the nature of the hyperspectral data to understand the spectral reflectance value and how it can be used to differentiate between different regions in the tissue samples. We analyzed the manually picked regions of the hyperspectral images, then plotted the spectral reflectance spectrum to compare between the tissues. A semi-automated algorithm was applied to both the supervised, and unsupervised (i.e., labeled, and unlabeled) hyperspectral data sets.
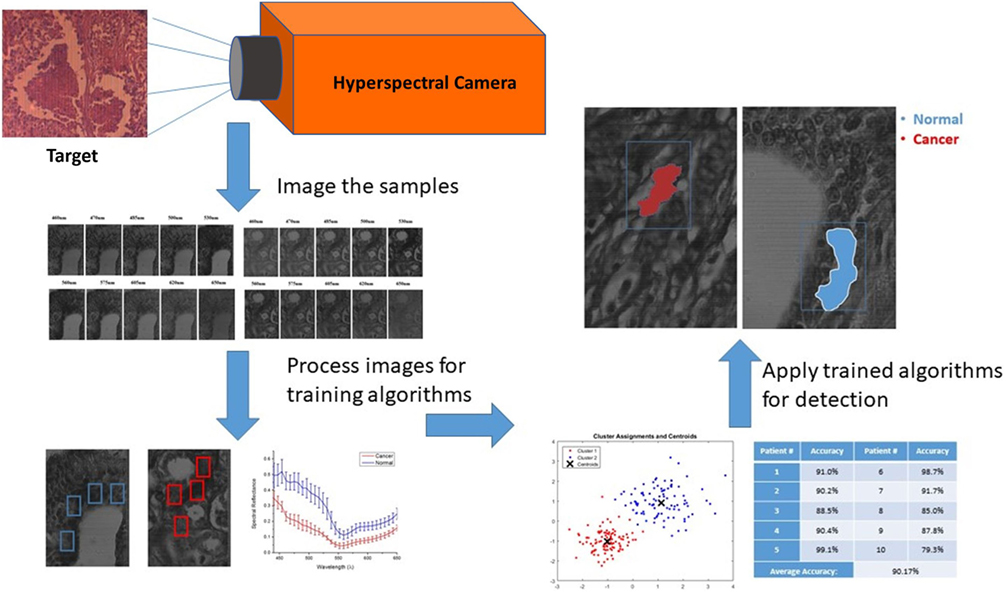
Figure 5. Hyperspectral imaging, training, and semi-auto detection workflow.
Spectral Reflectance Determination of Manually Marked Cancer Tissue
Because ductal carcinoma normally starts spreading from the duct, four square regions were randomly picked around each normal duct and in high density areas of the ductal carcinoma samples known to contain tumorous tissue. The results of hyperspectral images from each patient will consist of a comparison of spectral reflectance measurements from each area, and the average with error and SD computed for 10 measurements from each of 4 separate regions per ample type. Spectral reflectance plots of the 4 marked areas of the stained tissue samples of 1 out of 10 patients are shown in Figure 6.
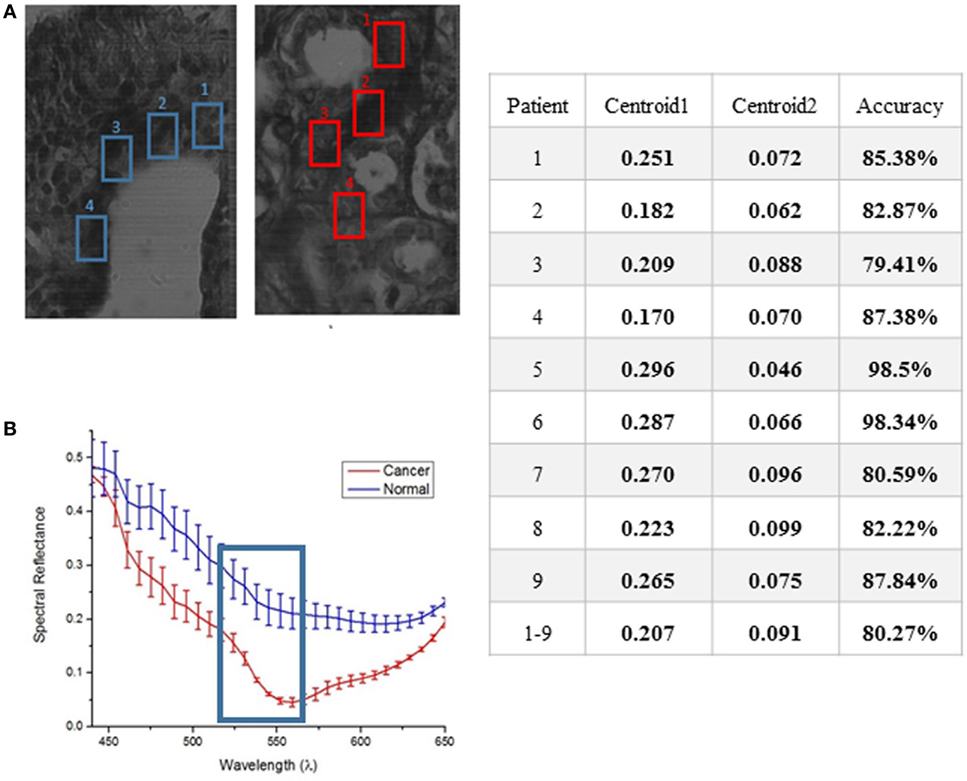
Figure 6. Average response showing spectral reflectance of the cancer and normal tissues (A). The error bars quantify uncertainty in the graph based on an average of 10 measurements taken from each of the four marked region of interest for both normal and cancer tissue (B). A clear separation between both tissues was displayed at 550 nm. The table shows the results of applying K-means separately on each set of data from 9 to 10 subjects for training.
Unsupervised Data for K-Means Algorithm on Human—Female H&E-Stained Breast Tissue
The method used to process and analyze images were contained in the HSI toolboxes of MATLAB and WEKA, as described previously. The K-means algorithm was applied to unsupervised (i.e., unlabeled) data. The user chooses the number of classes, which is 2 for this study (cancer, and non-cancer), and then the algorithm picks the best centroid for each class. The class centroids changes each time the algorithm runs until the program stops, i.e., when the numbers of each class do not change, and each centroid is considered the best pick. The table in Figure 6 shows the results of applying K-means separately on each set of data from 9 out of 10 patients for training, iterating to find the two best values of centroids, and finally, using the known labels of cancer and non-cancer to measure the accuracy of each run. The last step is to run the K-means trained algorithm on the 10th patient for testing the cancer detection scheme to determine if the classifier can identify and detect both classes, and then compare the detected results with the ground-truth pathologist diagnosis in order to support the algorithm accuracy.
K-means algorithm was applied to the hyperspectral data cubes, and we successfully detected spectral tissue differences with sensitivity of 85.45%, and specificity of 94.64% with a true-negative rate (TNR) of 95.8%, and a false-positive rate (FPR) of 4.2%. The result of training the K-means algorithm on the data that were extracted from the first 9 patients, then the trained algorithm was applied on the untrained data that were extracted from the 10th patient. The algorithm successfully detected normal and cancer tissue as shown in Figure 7. In this figure, the blue boxes indicate the areas containing cancer marked by the pathologist, and the red and blue shaded regions are the regions with cancer identified by the hyperspectral detection algorithm.
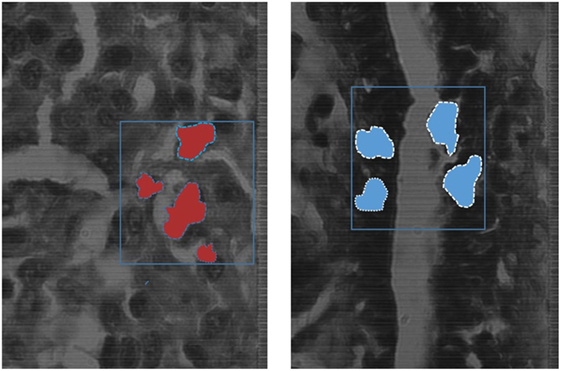
Figure 7. The blue boxes indicates the areas marked by the pathologist, the shaded areas shows the detection of the K-means algorithm detecting cancer tissues (red), and normal tissues (blue) on the spectral channel 550 nm.
Conclusion
The goal of this study is to evaluate the performance of a snapshot hyperspectral imager to see if measurable differences in spectral properties can be observed between normal and various stages of cancerous breast tissues fixed on biopsy slides, specifically in the case of ductal carcinoma. This interdisciplinary work may also build a bridge between pathology and hyperspectral optical diagnostic imaging to reduce time and workload on the pathologist, with a secondary benefit of leading to more accurate diagnoses.
Hyperspectral imaging technology was used to image stained and unstained tissue samples of normal and DCIS tissue from breast cancer patients. A region of interest in each tissue sample was manually chosen for testing to evaluate the effectiveness of automated cancer detection in these samples. The imaging results showed clear spectral reflectance separation between stained normal and ductal carcinoma tissues, with a TNR of 95.8%, and a FPR of 4.2%. These results indicate that the algorithm could provide a semi-automated “first pass” analysis of histology slides and flag those of interest or concern for further review by a pathologist. In most cases, the results showed the largest separation at the 550-nm wavelength channel of the snapshot hyperspectral camera, making it a good wavelength to choose as starting reference for testing the spectral reflectance of new samples. In the hyperspectral image analysis, the image processing algorithm, K-means, showed the greatest potential of building a semi-automated system that can identify and sort between the samples with a high degree of difference in spectral reflectance. This technique may also be used to distinguish between cancer cells at various stages of progression, as well as to develop a more advanced algorithm to allow a user to distinguish tumor margins from normal and cancerous tissue. Using a HSI system with the development of trained algorithms for detection shows great potential in automating cancer diagnostics in the future.
Author Contributions
YK, JD, and LV contributed in design, testing, and image analysis highlighted in this article. JC contributed the de-identified biopsy slides highlighted in this article. YK and JD wrote the manuscript highlighting the perspective of using hyperspectral imaging to evaluate ductal carcinoma in situ. All authors reviewed the manuscript and provided intellectual contributions.
Conflict of Interest Statement
All authors declare that the research was conducted in the absence of any commercial or financial relationships that could be construed as a potential conflict of interest.
Funding
This work was supported by the National Institutes of Health program and equipment grants (P20RR016440, P30 RR032138/GM103488, P20 RR016477, S10 RR026378) and by NIGMS/NIH program grants (P20 GM103434 and U54 GM104942).
References
1. Siegel R, Ma J, Zou Z, Jemal A. Cancer statistics. Cancer J Clin (2014) 64(1):9–29. doi:10.3322/caac.21208
2. Alteri R, Kalidas M, Gadd L, Wyant T, Simon S, Eidsmoe K, et al. American Cancer Society Annual Stewardship Report (2016). 980210 p.
3. Lu G, Fei B. Medical hyperspectral imaging: a review. J Biomed Opt (2014) 19(1):10901. doi:10.1117/1.JBO.19.1.010901
4. Tabár L, Vitak B, Chen HH, Yen MF, Duffy SW, Smith RA. Beyond randomized controlled trials: organized mammographic screening substantially reduces breast carcinoma mortality. Cancer (2001) 91:1724–32. doi:10.1002/1097-0142(20010501)91:9<1724::AID-CNCR1190>3.0.CO;2-V
5. Weinberg R. The Biology of Cancer. New York: Garland Science, Taylor & Francis Group, LLC (2014).
6. Brady DJ. Optical Imaging and Spectroscopy. New Jersey: John Wiley & Sons, Inc., and The Optical Society of America (2009).
7. Roblyer D, Richards-Kortum R, Sokolov K, El-Naggar AK, Williams MD, Kurachi C, et al. Multispectral optical imaging device for in vivo detection of oral neoplasia. J Biomed Opt (2008) 13(2):024019. doi:10.1117/1.2904658
8. Pike R, Patton SK, Lu G, Halig LV, Wang D, Chen ZG, et al. A minimum spanning forest based hyperspectral image classification method for cancerous tissue detection. Proc SPIE Int Soc Opt Eng (2014) 9034:90341W. doi:10.1117/12.2043848
9. Lu G, Halig L, Wang D, Chen ZG, Fei B. Spectral-spatial classification using tensor modeling for cancer detection with hyperspectral imaging. Proc SPIE Int Soc Opt Eng (2014) 9034:903413. doi:10.1117/12.2043796
10. Akbari H, Halig LV, Zhang H, Wang D, Chen ZG, Fei B. Detection of cancer metastasis using a novel macroscopic hyperspectral method. Proc SPIE Int Soc Opt Eng (2012) 8317:831711. doi:10.1117/12.912026
11. Masood K. Hyperspectral imaging with wavelet transform for classification of colon tissue biopsy samples. Proc SPIE Int Soc Opt Eng (2008) 7073:707319. doi:10.1117/12.797667
12. Akbari H, Halig LV, Schuster DM, Osunkoya A, Master V, Nieh PT, et al. Hyperspectral imaging and quantitative analysis for prostate cancer detection. J Biomed Opt (2012) 17(7):076005. doi:10.1117/1.JBO.17.7.076005
13. Galeano J, Jolivot R, Marzani F, Benezeth Y. Unmixing of human skin optical reflectance maps by non-negative matrix factorization algorithm. Biomed Signal Process Control (2013) 8(2):169–75. doi:10.1016/j.bspc.2012.08.007
14. Claridge E, Hidovic-Rowe D. Model based inversion for deriving maps of histological parameters characteristic of cancer from ex-vivo multispectral images of the colon. IEEE Trans Med Imaging (2014) 33(4):822–35. doi:10.1109/TMI.2013.2290697
15. Lu G, Halig L, Wang D, Chen ZG, Fei B. Hyperspectral imaging for cancer surgical margin delineation: registration of hyperspectral and histological images. Proc SPIE Int Soc Opt Eng (2014) 9036:90360S. doi:10.1117/12.2043805
16. Adams JB, Smith MO, Gillespie AR. Imaging spectroscopy: interpretation based on spectral mixture analysis. In: Pieters CM, Englert PAJ, editors. Remote Geochemical Analysis: Elementatl and Mineralogic Composition. Cambridge, UK: Cambridge University Press (1993). p. 145–66.
17. Masood K, Rajpoot N. Texture based classification of hyperspectral colon biopsy samples using CLBP. IEEE Int. Symposium on Biomedical Imaging: From Nano to Macro, 2009. ISBI ’09. Boston, MA (2009). p. 1011–4.
18. Saleh BEA. Fundamentals of Photonics. New Jersey: John Wiley & Sons, Inc., and The Optical Society of America (2007).
20. Han J, Kamber M, Pei J. Data Mining: Concepts and Techniques. Waltham, MA: Morgan Kaufmann Publishers (2011).
21. Clark RN, Gallagher AJ, Swayze GA. Material absorption band depth mapping of imaging spectrometer data using a complete band shape least-squares fit with library reference spectra. Proceedings of the Second Airborne Visible/Infrared Imaging Spectrometer (AVIRIS) Workshop. Denver, CO: JPL Publication (1990). p. 176–86.
22. Lu G, Halig L, Wang D, Qin X, Chen ZG, Fei B. Spectral-spatial classification for noninvasive cancer detection using hyperspectral imaging. J Biomed Opt (2014) 19(10):106004. doi:10.1117/1.JBO.19.10.106004
23. Martin ME, Wabuyele MB, Chen K, Kasili P, Panjehpour M, Phan M, et al. Development of an advanced hyperspectral imaging (HSI) system with applications for cancer detection. Ann Biomed Eng (2006) 34(6):1061–8. doi:10.1007/s10439-006-9121-9
24. Martin ME, Wabuyelea MB, Panjehpourb M, Phan MN, Overholt BF, Denovo RC, et al. Dual modality fluorescence and reflectance hyperspectral imaging: principle and applications. Proc SPIE Int Soc Opt Eng (2005) 5692:133–9. doi:10.1117/12.604445
25. Kolda TG, Bader BW. Tensor decompositions and applications. SIAM Rev (2009) 51(3):455–500. doi:10.1137/07070111X
27. Akbari H, Kosugi Y, Kojima K, Tanaka N. Hyperspectral imaging and diagnosis of intestinal ischemia. Proc. 30th Annu. Int. Conf. IEEE EMBC. Vancouver, BC (2008). p. 1238–41.
28. Vo-Dinh T, Panjehpour M, Overholt BD, Farris C, Sneed R. In vivo cancer diagnosis of the esophagus using differential normalized fluorescence (DNF) indices. Lasers Surg Med (1995) 16:41–7. doi:10.1002/lsm.1900160106
29. Vo-Dinh T, Stokes DL, Wabuyele MB, Martin ME, Song JM, Jagannathan R, et al. A hyperspectral imaging system for in vivo optical diagnostics. IEEE Eng Med Biol (2004) 23(5):40–9. doi:10.1109/MEMB.2004.1360407
30. Qin X, Cong Z, Jiang R, Shen M, Wagner MB, Kishbom P, et al. Extracting cardiac myofiber orientations from high frequency ultrasound images. Proc SPIE Int Soc Opt Eng (2013) 8675:867507. doi:10.1117/12.2006494
31. Kong SG, Du Z, Martin M, Vo-Dinh T. Hyperspectral fluorescence image analysis for use in medical diagnostics, advanced biomedical and clinical diagnostic systems III. Proc SPIE Int Soc Opt Eng (2005) 5692:21–8. doi:10.1117/12.596463
32. Jemal A, Murray T, Ward E, Samuels A, Tiwari RC, Ghafoor A, et al. Cancer statistics, 2005. CA Cancer J Clin (2005) 55:10–30. doi:10.3322/canjclin.55.1.10
33. Thomas DB, Gao DL, Ray RM, Wang WW, Allison CJ, Chen FL, et al. Randomized trial of breast self-examination in Shanghai: final results. J Natl Cancer Inst (2002) 94:1445–57. doi:10.1093/jnci/94.19.1445
34. Kushi LH, Doyle C, McCullough M, Rock CL, Demark-Wahnefried W, Bandera EV, et al. American Cancer Society guidelines on nutrition and physical activity for cancer prevention: reducing the risk of cancer with healthy food choices and physical activity. CA Cancer J Clin (2012) 62:30–67. doi:10.3322/caac.20140
35. Pisano ED, Gatsonis C, Hendrick E, Yaffe M, Baum JK, Acharyya S, et al. Diagnostic performance of digital versus film mammography for breast-cancer screening. N Engl J Med (2005) 353:1773–83. doi:10.1056/NEJMoa052911
36. Centers for Disease Control and Prevention. National Breast and Cervical Cancer Early Detection Program. (2015). Available from: www.cdc.gov/cancer/nbccedp/about.htm
Keywords: hyperspectral, breast cancer, ductal carcinoma, spectral reflectance, hematoxylin and eosin, unstained, K-means
Citation: Khouj Y, Dawson J, Coad J and Vona-Davis L (2018) Hyperspectral Imaging and K-Means Classification for Histologic Evaluation of Ductal Carcinoma In Situ. Front. Oncol. 8:17. doi: 10.3389/fonc.2018.00017
Received: 09 October 2017; Accepted: 17 January 2018;
Published: 07 February 2018
Edited by:
Natalie Julie Serkova, University of Colorado Denver School of Medicine, United StatesReviewed by:
Balaji Krishnamachary, Johns Hopkins University, United StatesAngelo Don I. I. Santos Grasparil, Cardinal MRI Center, Philippines
Copyright: © 2018 Khouj, Dawson, Coad and Vona-Davis. This is an open-access article distributed under the terms of the Creative Commons Attribution License (CC BY). The use, distribution or reproduction in other forums is permitted, provided the original author(s) and the copyright owner are credited and that the original publication in this journal is cited, in accordance with accepted academic practice. No use, distribution or reproduction is permitted which does not comply with these terms.
*Correspondence: Linda Vona-Davis, lvdavis@hsc.wvu.edu