Echocardiographic Assessment of Pulmonary Arterial Hypertension for Pediatricians and Neonatologists
 Gregory James Skinner
- East Midlands Congenital Heart Centre, University Hospitals of Leicester NHS Trust, Glenfield Hospital, Leicester, United Kingdom
There is a growing awareness of the role that increased pulmonary vascular resistance (PVR) plays in many pathologies; therefore, assessment of pulmonary artery pressure (PAP) is an increasingly requested investigation in the critical care environment. This article will go through the basic concepts regarding PAP and PVR, then will go on to outline the various echocardiographic parameters which are used to assess them. Finally, an outline of how to undertake this assessment will be presented.
Basic Concepts and Definitions
To start with, it is very important to understand the differences and interdependencies of three commonly quoted (and confused) variables (Table 1).
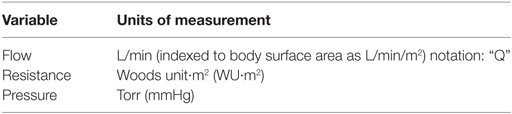
Table 1. Important variables in the assessment of pulmonary vascular resistance.
Pressure is the product of flow and resistance and is related to flow and resistance by the hydraulic Ohm’s law analogy:
In order to account for the pressure distal to the intrapulmonary vasculature, we need to add in the effect of left atrial pressure (LAp):
PAP, pulmonary artery pressure; Qp, pulmonary artery blood flow; PVR, pulmonary vascular resistance; LAp, left atrial pressure.
The gold standard for measurement of pulmonary vascular resistance (PVR) is cardiac catheterization (1–3), as this can measure all of these variables: pulmonary artery pressure (PAP), LAp (or pulmonary capillary wedge pressure), and Qp (Fick method or thermodilution). This is obviously invasive and not reproducible at the bed-side.
In most critical care patients in whom there is a concern about “pulmonary hypertension,” the underlying pathological process of interest is increased PVR. We cannot directly measure PVR on echocardiography, so we have to use another measurement as a surrogate for it: i.e., PAP. Unfortunately, there are other pathological processes which affect this; therefore, it is always vital to remember that:
Looking at Eq. 2, we can determine that there are four mechanisms, which will lead to increased PAP:
(1) Increased PVR.
(2) Increased Qp.
(3) Increased LAp.
(4) Any combination of the above.
Any assessment of PVR requires the assessment of all of these possibilities. Pulmonary arterial hypertension (PAH) from increased PVR can only be assumed if there is no increased flow (e.g. left-to-right shunt) and/or there is no suggestion of increased LAp (e.g. due to left ventricular failure or mitral stenosis).
Quantification
In adults, pulmonary hypertension is defined as a mean PAP > 25 mmHg (4). This can be derived from the systolic PAP (5):
In adult practice there are well-defined thresholds for indicating the degree of PAH (see Table 2). In children (and especially neonates and infants), the normal PVR (and, therefore, PAP) changes with age. To quantify the degree of pulmonary hypertension, therefore, the pulmonary artery peak systolic pressure is often quoted as a fraction of the systemic systolic blood pressure (Table 3).
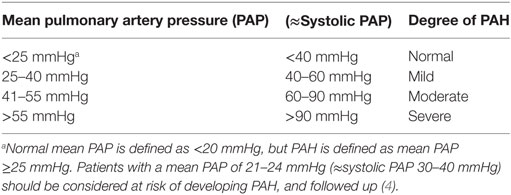
Table 2. Quantification of PAH in adults.
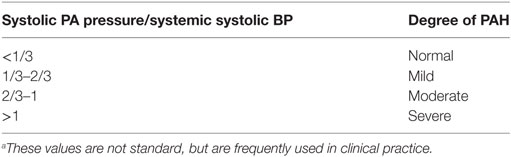
Table 3. Quantification of PAH in children.a
Echocardiographic Measurement of PAP
Tricuspid Regurgitation (TR)
The most common method used for assessing PAP is to perform a continuous wave spectral Doppler analysis of the TR jet (6, 7). Most patients will have a degree of TR, which is often (though not always) made worse when the right ventricle is operating at higher pressures.
The modified Bernoulli equation states that the pressure gradient between either side of a fixed obstruction with no significant length, is proportional to the velocity (v) of the flow across that obstruction:
Measuring the velocity of the TR jet can, therefore, give an estimate of the pressure gradient between the right ventricle and right atrium at peak systole. Therefore:
RVSP, right ventricular systolic pressure; TR max PG, Bernoulli equation derived pressure gradient from the peak tricuspid regurgitation velocity; RAp, right atrial pressure.
Central venous pressure monitoring is often used in the critical care environment, and can usually be treated as analogous to the right atrial pressure. If this is not available, the RAp component is often ignored, as its value usually only contributes a small amount to the overall result (especially in the context of increased RVSP).
Pitfalls
• Many patients will have no or only trivial TR. Given the motion of the AV valve plane during systole, it can be impossible to obtain a spectral Doppler TR trace for the duration of systole. The spectral Doppler trace of TR is quite characteristic, and values should not be quoted unless there is a clear trace, otherwise, there is the risk of a significant underestimate. This means that this technique cannot be used for all patients (see Figures 1A,B).
• The Doppler interrogation beam should be within 20° of the jet direction, or there will be significant underestimation of the velocity. This is not always possible with some eccentric jets.
• Many confuse the quantity of TR with the pressure gradient. It is possible to have severe TR with a low velocity or mild TR with a high velocity. The two are not directly related.
• In severe TR, the right atrial pressure will increase rapidly during systole, resulting in an underestimation of the RVSP.
• If there is any right ventricular outflow obstruction (e.g., pulmonary stenosis), then it is important to remember that the RVSP will not reflect the systolic PAP. It is very important to check the whole of the right ventricular outflow (subpulmonary area, pulmonary valve, main and branch pulmonary arteries) for evidence of obstruction.
• Large left-to-right shunts [e.g., large ventricular septal defect (VSD), aortopulmonary window, PDA] will cause equalization of right ventricular/PAP with left ventricular/aortic pressure. There is little point in measuring the TR velocity in this context as it will just reflect the systemic systolic blood pressure.
• A VSD ejecting into the region of the tricuspid valve may “contaminate” the spectral Doppler trace, making it uninterpretable.
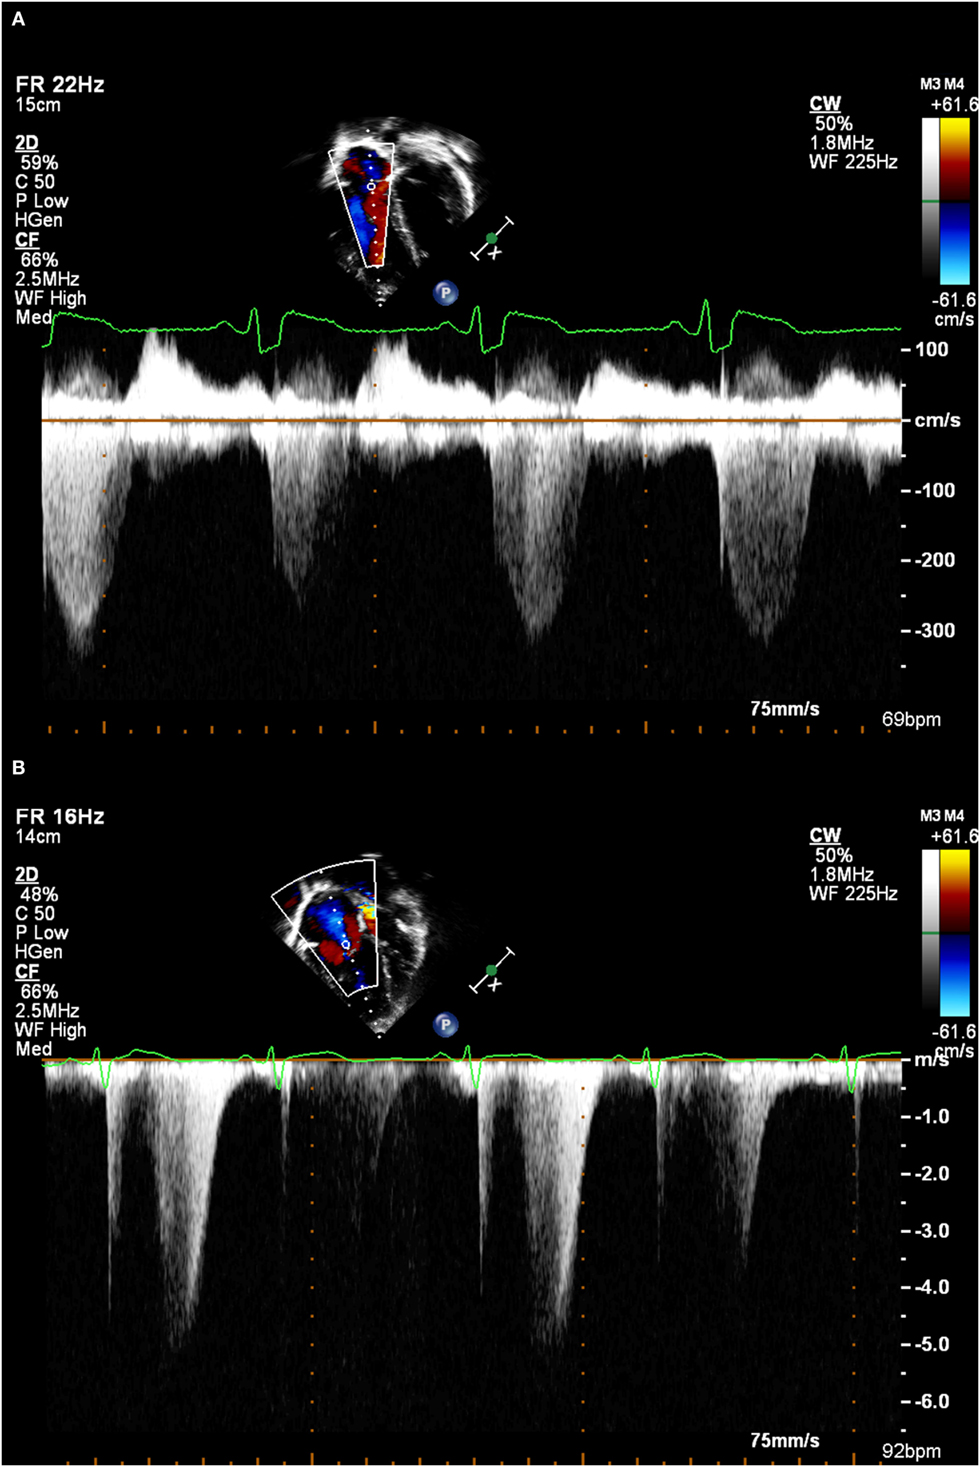
Figure 1. (A) A good tricuspid regurgitation jet envelope, suitable for analysis (note incomplete envelope on second beat due to respiratory motion). (B) An incomplete tricuspid regurgitation jet envelope, which will underestimate right ventricular systolic pressure.
Pulmonary Regurgitation (PR)
Similar to TR, most (but not all) patients will have some degree of PR. Analysis of the spectral Doppler pattern from this can also give important information regarding the PAP (8–10) (see Figures 2A,B). The following values can be obtained from this:
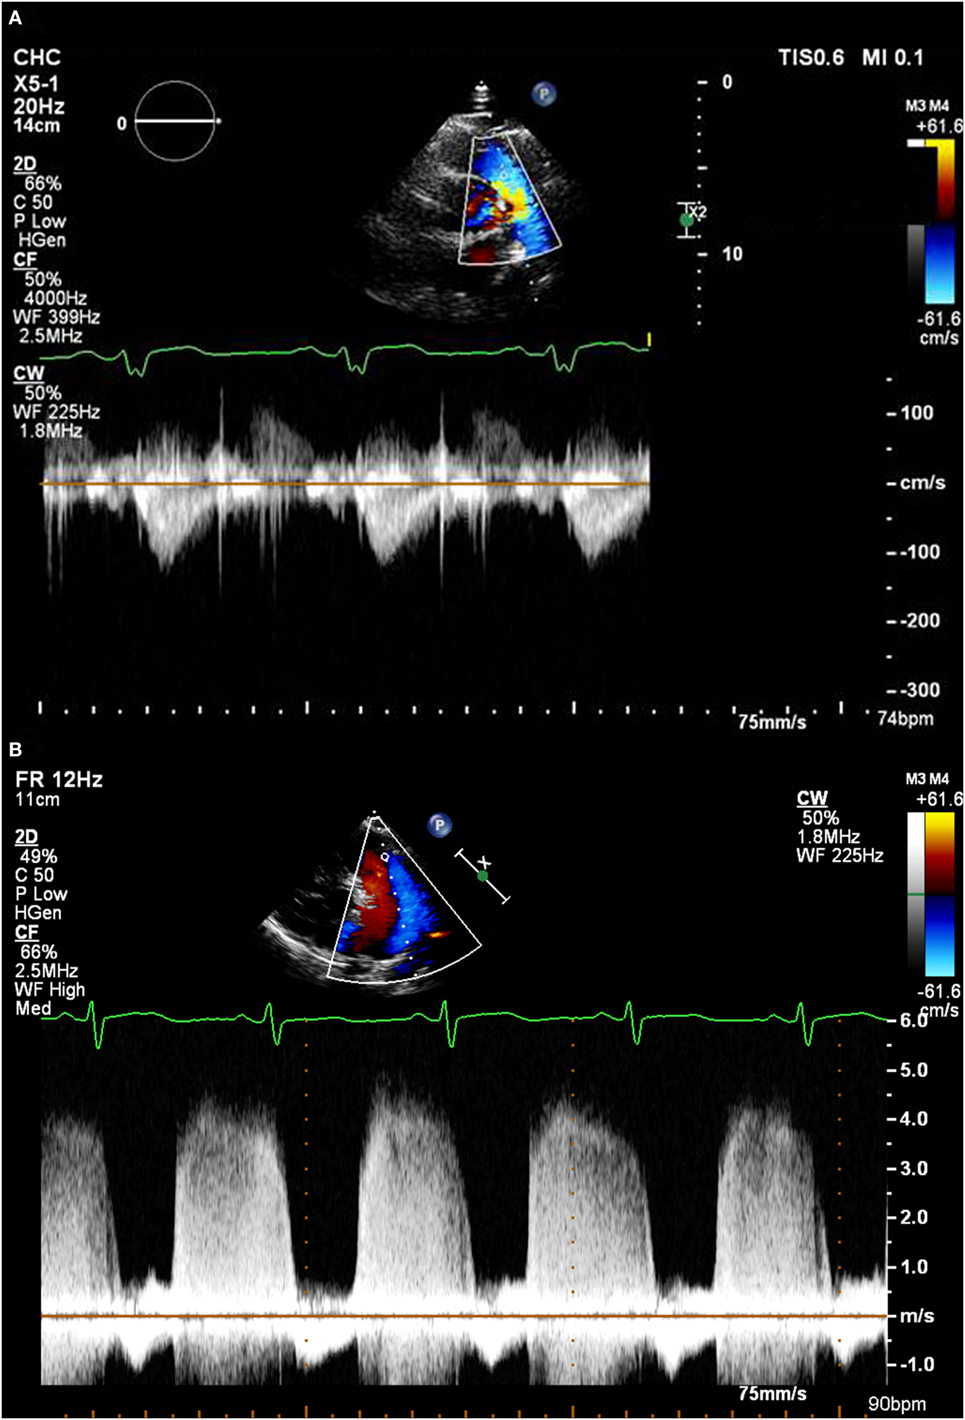
Figure 2. (A) A pulmonary regurgitation envelope with normal pulmonary artery pressure. (B) A pulmonary regurgitation envelope in a patient with very high pulmonary artery pressure.
PAP, pulmonary artery pressure; PR max PG, Bernoulli equation derived pressure gradient from the peak pulmonary regurgitation velocity; RAp, right atrial pressure; PR EDPG, Bernoulli equation derived pressure gradient from pulmonary regurgitation velocity at end diastole.
Pitfalls
• Not all patients will have a PR jet.
• It is vitally important to capture the full spectral Doppler envelope and be well aligned with it.
• This technique is not reliable in the context of severe PR.
• Given that the magnitude of the mean and diastolic PAP is less than the RVSP/systolic PAP, the RAp has more of an influence on this measurement. It is, therefore, more prone to underestimation if this is not known.
Assessment of Interventricular Septum
The geometry of the interventricular septum is dependent on the relative pressures within the ventricles. Usually, as the left ventricle is at much higher pressure than the right ventricle, the interventricular septum is pushed rightwards. This gives the characteristic circular profile of the left ventricle on the short-axis view. As right ventricular pressure increases, the septum is pushed more toward the left resulting in the left ventricle becoming “D-shaped.” While this does not provide quantitative information, it allows assessment in patients regardless of whether they have TR, PR, or a shunt (see Figures 3A–C).
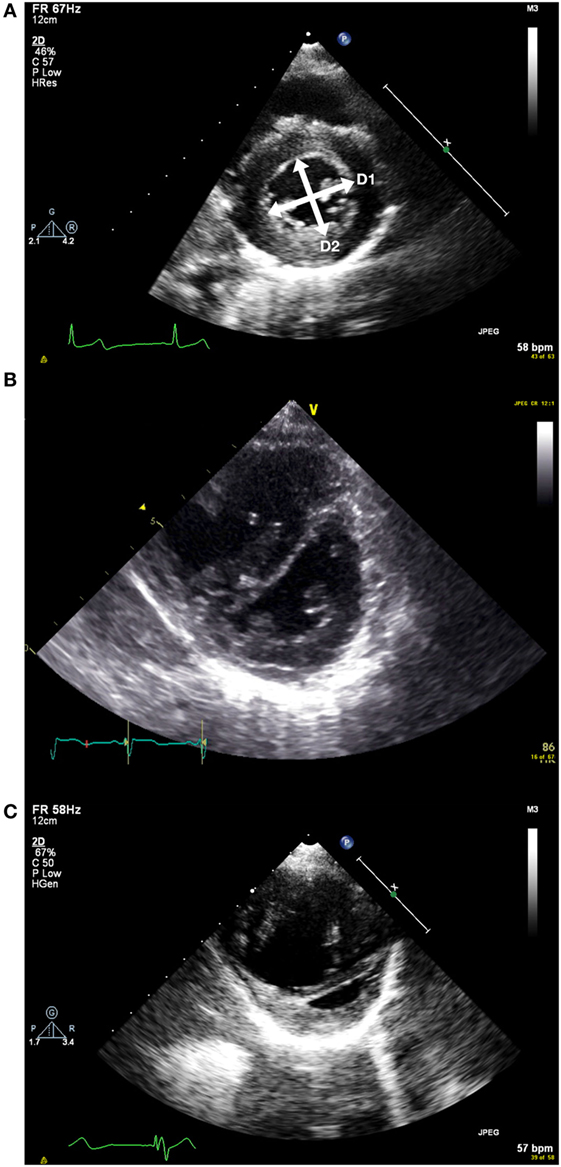
Figure 3. (A) Short axis view of the left ventricle in end systole. D1 and D2 represent the measurements taken to measure the end systolic eccentricity index. This shows a patient with normal right ventricular systolic pressure. (B) Flattened septum with increased end systolic eccentricity index with moderately increased right ventricular systolic pressure. (C) Short axis view with severely increased right ventricular systolic pressure. Note RV dilatation.
The end systolic eccentricity index (EIs) allows some categorization of the RV pressure (11) (see Table 4). It is measured on the short-axis view of the left ventricle, just below the level of the mitral valve tips. At end systole (i.e., when the LV cavity is smallest), the diameter of the left ventricle is measured parallel to (D1) and perpendicular to (D2) the interventricular septum.
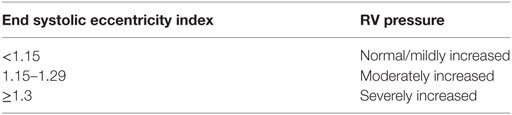
Table 4. Categorisation of RV pressure based on EIs (11).
EIs, end systolic eccentricity index; D1, LV diameter parallel to interventricular septum; D2, LV diameter perpendicular to interventricular septum.
Serial measurement of the EIs over time may allow monitoring of the progression of the RV pressure.
Pitfalls
• Interventricular conduction abnormalities (i.e., left or right bundle branch block) will alter the relative timing of peak left and right ventricular pressure, making this method unreliable.
• The presence of a large VSD will affect the motion of the interventricular septum, making this method unusable.
• Given this method indirectly measures the difference between LV and RV pressure, anything which increases LV pressure (e.g., aortic stenosis, coarctation of the aorta) will result in an underestimate of RV pressure.
Shunts
The presence of a shunt between the systemic and pulmonary circulations also allows estimation of the relative pressures of the two systems. Please note that pre-tricuspid valve level shunts (e.g., systemic arteriovenous malformation, partial anomalous pulmonary venous connection, atrial septal defect) do not communicate between the high-pressure portions of the circulation, so the points below do not apply.
Large Shunts
As previously stated, large non-restrictive shunts (in the absence of any outflow tract stenosis) will result in equalization of the systemic and pulmonary pressures. The direction and quantity of flow across the shunt will reflect the relative difference between the systemic vascular resistance and PVR—this can be assessed clinically as well as on echocardiography (NB: here, we are evaluating flow as opposed to pressure, see Table 5).
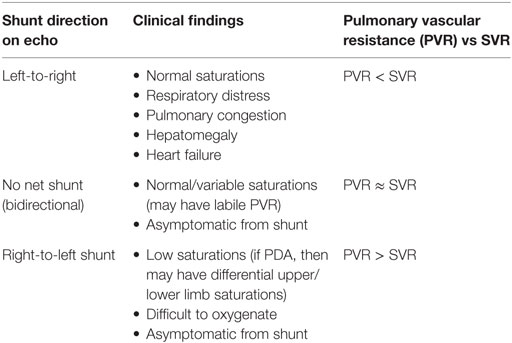
Table 5. Evaluation of PVR in the presence of a large shunt.
Small Shunts
If the size of the shunt is small, then it will not greatly affect the pressures between the two sides of the circulation. Therefore, using the modified Bernoulli equation will again allow estimation of the relative difference between the systemic and pulmonary pressures.
For example, if there is a small VSD, the peak systolic velocity across it will reflect the pressure gradient between the ventricles at peak systole. Therefore:
RVSP, right ventricular systolic pressure; BP, blood pressure; VSD max PG, Bernoulli derived pressure gradient from the peak ventricular septal defect velocity.
PDA Flow
The above principle applies to a PDA, although this also gives information regarding the differential between the relative diastolic pressures as well. Given that the diastolic PAP is less influenced by flow, it is often thought to better reflect the PVR and is less affected by shunts. Patterns of ductal flow can be used to infer PVR status (see Table 6).
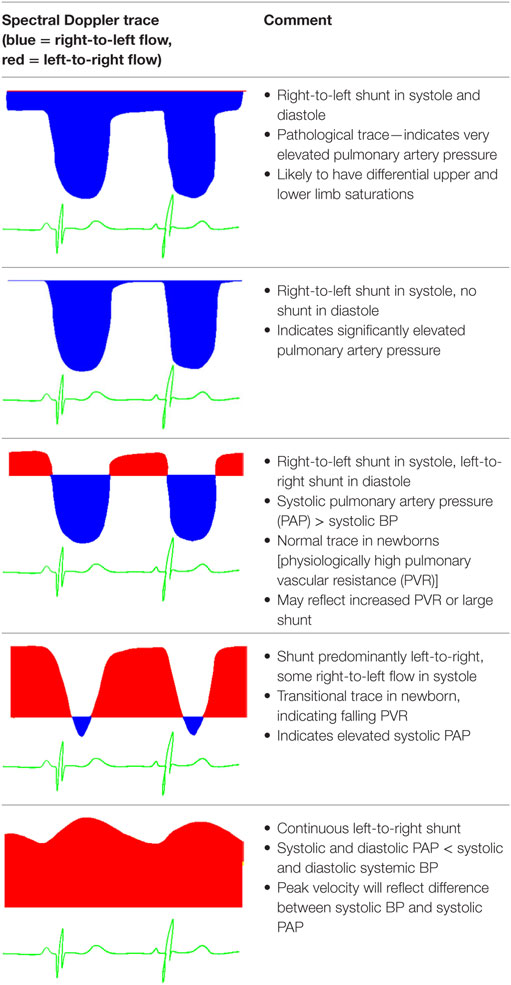
Table 6. Evaluation of pulmonary artery pressure based on PDA spectral Doppler pattern.
Given the high incidence of PDA in the neonatal population, this is often the best way of assessing PAP in this group.
Putting it all Together
There is no one perfect method of assessing PAP or PVR. Figure 4 demonstrates a framework built upon the methods stated above which should work for the vast majority of patients. It is always important to remember the pitfalls of all of these methods and to go back to first principals if the information obtained does not fit with the clinical picture.
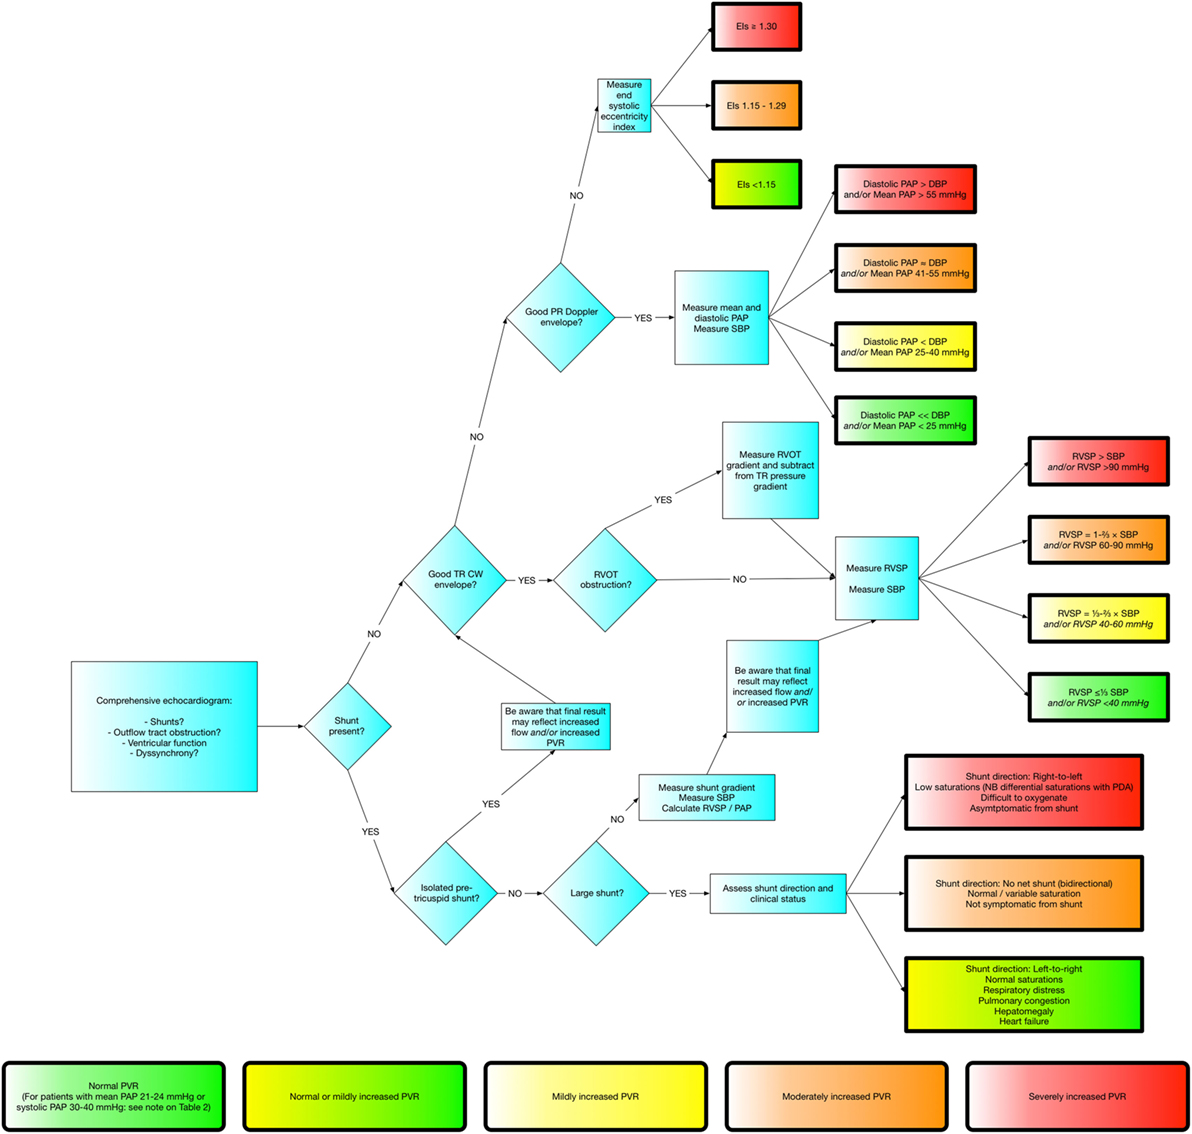
Figure 4. Flowchart demonstrating approach to evaluating pulmonary hypertension.
Pulmonary hypertension and/or elevated PVR is a complicated area, with highly specialized knowledge required to effectively diagnose or manage. The above guide provides a framework to allow the pediatric or neonatal echocardiographer to suspect the presence of these pathologies; but it would be highly recommended that if they are suspected, then advice from a specialist should be sought.
Author Contributions
The author confirms being the sole contributor of this work and approved it for publication.
Conflict of Interest Statement
The author declares that the research was conducted in the absence of any commercial or financial relationships that could be construed as a potential conflict of interest.
References
1. Galiè N, Humbert M, Vachiery J-L, Gibbs S, Lang I, Torbicki A, et al. 2015 ESC/ERS Guidelines for the diagnosis and treatment of pulmonary hypertension: the joint task force for the diagnosis and treatment of pulmonary hypertension of the European Society of Cardiology (ESC) and the European Respiratory Society (ERS): endorsed by: association for European Paediatric and Congenital Cardiology (AEPC), International Society for Heart and Lung Transplantation (ISHLT). Eur Heart J (2016) 37:67–119. doi:10.1093/eurheartj/ehv317
2. McLaughlin VV, Archer SL, Badesch DB, Barst RJ, Farber HW, Lindner JR, et al. ACCF/AHA 2009 expert consensus document on pulmonary hypertension: a report of the American College of Cardiology foundation task force on expert consensus documents and the American Heart Association: developed in collaboration with the American College of Chest Physicians, American Thoracic Society, Inc., and the Pulmonary Hypertension Association. Circulation (2009) 119:2250–94. doi:10.1161/CIRCULATIONAHA.109.192230
3. Abman SH, Hansmann G, Archer SL, Ivy DD, Adatia I, Chung WK, et al. Pediatric pulmonary hypertension: guidelines from the American Heart Association and American Thoracic Society. Circulation (2015) 132:2037–99. doi:10.1161/CIR.0000000000000329
4. Hoeper MM, Bogaard HJ, Condliffe R, Frantz R, Khanna D, Kurzyna M, et al. Definitions and diagnosis of pulmonary hypertension. J Am Coll Cardiol (2013) 62:D42–50. doi:10.1016/j.jacc.2013.10.032
5. Chemla D, Castelain V, Humbert M, Hébert J-L, Simonneau G, Lecarpentier Y, et al. New formula for predicting mean pulmonary artery pressure using systolic pulmonary artery pressure. Chest (2004) 126:1313–7. doi:10.1378/chest.126.4.1313
6. Yock PG, Popp RL. Noninvasive estimation of right ventricular systolic pressure by Doppler ultrasound in patients with tricuspid regurgitation. Circulation (1984) 70:657–62. doi:10.1161/01.CIR.70.4.657
7. Amsallem M, Sternbach JM, Adigopula S, Kobayashi Y, Vu TA, Zamanian R, et al. Addressing the controversy of estimating pulmonary arterial pressure by echocardiography. J Am Soc Echocardiogr (2016) 29:93–102. doi:10.1016/j.echo.2015.11.001
8. Rudski LG, Lai WW, Afilalo J, Hua L, Handschumacher MD, Chandrasekaran K, et al. Guidelines for the echocardiographic assessment of the right heart in adults: a report from the American Society of Echocardiography. J Am Soc Echocardiogr (2010) 23:685–713; quiz 786–8. doi:10.1016/j.echo.2010.05.010
9. Haddad F, Hunt SA, Rosenthal DN, Murphy DJ. Right ventricular function in cardiovascular disease, part I: anatomy, physiology, aging, and functional assessment of the right ventricle. Circulation (2008) 117:1436–48. doi:10.1161/CIRCULATIONAHA.107.653576
10. Haddad F, Doyle R, Murphy DJ, Hunt SA. Right ventricular function in cardiovascular disease, part II: pathophysiology, clinical importance, and management of right ventricular failure. Circulation (2008) 117:1717–31. doi:10.1161/CIRCULATIONAHA.107.653584
Keywords: pulmonary hypertension, pulmonary vascular resistance, echocardiography, pediatrics, neonatology
Citation: Skinner GJ (2017) Echocardiographic Assessment of Pulmonary Arterial Hypertension for Pediatricians and Neonatologists. Front. Pediatr. 5:168. doi: 10.3389/fped.2017.00168
Received: 06 May 2017; Accepted: 18 July 2017;
Published: 04 September 2017
Edited by:
Cecile Tissot, Clinique des Grangettes Geneva, SwitzerlandReviewed by:
Dunbar Ivy, University of Colorado Denver School of Medicine, United StatesMaurice Beghetti, University Hospitals of Geneva, Switzerland
Copyright: © 2017 Skinner. This is an open-access article distributed under the terms of the Creative Commons Attribution License (CC BY). The use, distribution or reproduction in other forums is permitted, provided the original author(s) or licensor are credited and that the original publication in this journal is cited, in accordance with accepted academic practice. No use, distribution or reproduction is permitted which does not comply with these terms.
*Correspondence: Gregory James Skinner, gregoryskinner@nhs.net