 Kim A. T. Verheijden
 Paul A. J. Henricks
 Frank A. Redegeld
 Johan Garssen1,2
 Gert Folkerts
- 1Division of Pharmacology, Faculty of Science, Utrecht Institute for Pharmaceutical Sciences, Utrecht University, Utrecht, Netherlands
- 2Immunology, Nutricia Research, Utrecht, Netherlands
In this study a direct comparison was made between non-invasive and non-ventilated unrestrained whole body plethysmography (Penh) (conscious animals) and the invasive ventilated lung resistance (RL) method (anesthetized animals) in both mild and severe allergic airway inflammation models. Mild inflammation was induced by intraperitoneal sensitization and aerosols of ovalbumin. Severe inflammation was induced by intraperitoneal sensitization using trinitrophenyl-ovalbumin, followed by intranasal challenges with IgE-allergen complexes. A significant increase in airway responsiveness to methacholine was observed in the mild inflammation group when RL was measured. Significant changes in both RL and Penh were observed in the severe inflammation groups. There was a significant increase in the number of inflammatory cells in the Broncho-Alveolar Lavage Fluid (BALF) in both the mild and severe inflammation animals. The enforced ventilation of the animals during the RL measurement further increased the number of cells in the BALF. IL-2 and RANTES levels in the BALF were higher in the severe inflammation groups compared to the mild inflammation groups. Penh gave only reliable measurements during severe airway inflammation. Measuring RL gave consistent results in both mild and severe allergic airway inflammation models however, ventilation induced an additional cell influx into the airways.
Introduction
Asthma is characterized by airway hyperresponsiveness and inflammation. Airway inflammation is initiated and propagated by multiple inflammatory mediators such as lipid mediators, cytokines, and chemokines (O'Byrne and Inman, 2003; Barnes, 2008). To investigate airway function in preclinical models both non-invasive and invasive analysis methods have been used. Unrestrained whole body plethysmography (Penh), a non-invasive method for measurement of airway responsiveness, has been used frequently but its validity is under debate. For this method the airway function is measured with enhanced pause (Penh), an empirical and dimensionless parameter (Frazer et al., 2011). Increased bronchoconstriction is considered to be paralleled with an increase in Penh. However, various experimental conditions resulting in a change of breathing pattern can also affect Penh (Sly et al., 2004). Penh is viewed as a better indicator for control of breathing (as seen in respiratory patterns) rather than an indicator for mechanical lung function (Bates and Irvin, 2003; Irvin and Bates, 2003; O'Byrne and Inman, 2003; Adler et al., 2004). Respiratory patterns can be influenced by stress Hoymann (2007), heating or humidification of the chamber, affecting the measured signal (Lundblad et al., 2002; Adler et al., 2004). Moreover, the outcome of unrestrained Penh may be dependent on the mouse strain used (Adler et al., 2004). Furthermore, unrestrained Penh measures changes in the upper airway parts (nose) as well as in the lower airways - of particular importance in rodents as these animals are nose-breathers (Hoymann, 2006). There are also practical advantages of Penh measurements because the animals do not need to be anesthetized and do not need surgery for ventilation hence, the method is simpler than others and less time-consuming (Bates and Irvin, 2003; Irvin and Bates, 2003; Berndt et al., 2011; Hoymann, 2012). Also, the animal can be used for repeated measurements in time (Albertine et al., 2002; Irvin and Bates, 2003; Adler et al., 2004; Lomask, 2006; Berndt et al., 2011). Invasive lung resistance measurement (RL) is another method for measuring airway function. Although RL measurements are considered to more accurately represent lung function, the method also has its limitations. First, the animals have to be anesthetized which might change physiological parameters such as body temperature. A cannula also has to be placed into the trachea which could cause local mechanical stress. Moreover, the animals are artificially ventilated with a fixed volume which artificially influences the pattern of breathing and might have an effect on the homeostasis of the airways. The technique is also time-consuming (Glaab et al., 2007) and terminal for the animals after measurement. There is however, no stress for the animal during the experiment (Hoymann, 2006, 2012), and exposing the lower airways to allergens or agonists is more accurate via a cannula in the trachea. When the trachea is orally intubated, instead of with an incision, repetitive measurements can be conducted in spontaneously breathing mice (Brown et al., 1999; Glaab et al., 2004; De Vleeschauwer et al., 2011). The most important advantage of the resistance method is that it is a sensitive and specific measurement to analyze pulmonary mechanics (Glaab et al., 2007; Hoymann, 2012). Due to the continuous discussion on the measurement of lung function in rodents, a comparative study between the non-invasive measurement airway function (Penh) and the invasive measurement airway function [Resistance (RL)] was conducted in mild and severe allergic airway inflammation models, which mimics some features of allergic asthma in humans.
Materials and Methods
Mice
Male BALB/c mice (Charles River, Maastricht, The Netherlands), 6–8 weeks old (20–25 g), were used in all experiments. Mice were maintained under standard laboratory conditions. Food and water were provided ad libitum. All animal experiments were conducted in compliance with the Guidelines of the Ethical Committee on the Use of Laboratory Animals of the University Utrecht.
Sensitization and Airway Challenge
Mild airway inflammation model
On days 0 and 7 mice were sensitized with ovalbumin (OVA; chicken egg albumin, grade V, Sigma, St. Louis, MO, USA) or treated with saline. Active sensitization was conducted by two intraperitoneal injections of 0.1 mL alum-precipitated antigen, comprising 10 μ g OVA absorbed into 2.25 mg alum (AlumImject; Pierce, Rockford, IL, USA). On days 35, 38, and 41 mice were exposed either to an OVA (1% ovalbumin in pyrogen-free saline, OVA group) or control solution (saline, SAL group) aerosol challenge for 30 min. The aerosol was conducted in a plexiglass exposure chamber (5 L) coupled to a Pari LC Star nebulizer (PARI Respiratory Equipment, Richmond, VA, USA; particle size 2.5–3.1 μm) driven by compressed air at a flow rate of 6 L/min (Ten Broeke et al., 2006) (Figure 1A). An overview of the groups included in this study is given in Table 1.
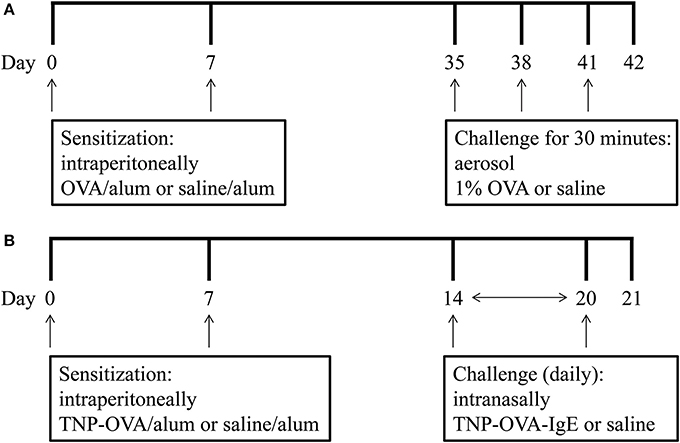
Figure 1. Experimental scheme of the mild airway inflammation model (A) and severe airway inflammation model (B).
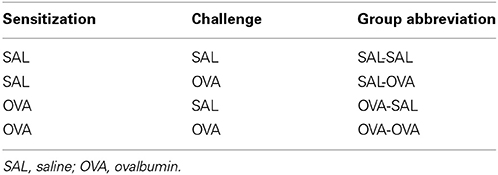
Table 1. Mouse groups included in the mild airway inflammation model.
Severe airway inflammation model
On days 0 and 7 mice were sensitized with trinitrophenyl (TNP) conjugated-ovalbumin (OVA; chicken egg albumine, grade V, Sigma, St. Louis, MO, USA) or saline. Sensitization was conducted by two intraperitoneal injections of 0.1 mL alum-precipitated antigen, comprising 10 μ g TNP-OVA absorbed into 2.25 mg alum (AlumImject; Pierce, Rockford, IL, USA) or saline. On days 14–20, mice were challenged daily by intranasal administration of a TNP-ovalbumin/IgE immune complex [2 μ g TNP-OVA plus 20 μ g DNP-specific IgE (clone H1 26.82)] or saline, as described by Pasquier et al. (2005) and Sagar et al. (2013) (Figure 1B). An overview of the groups included in this study is given in Table 2.
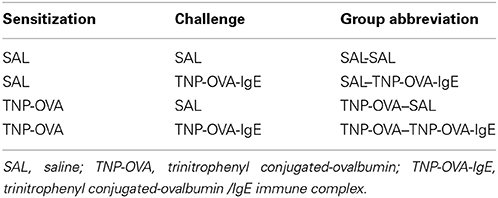
Table 2. Mouse groups included in the severe airway inflammation model.
Measurement of Airway Responsiveness in vivo
Non-invasive measurement airway function (Penh)
Airway responsiveness was measured 24 h after the last aerosol exposure by recording respiratory pressure curves using barometric unrestrained whole-body plethysmography (Buxco; EMKA Technologies, Paris, France) in response to inhaled methacholine (acetyl-β-methyl-choline chloride, Sigma, The Netherlands) in conscious unrestrained mice. Airway responsiveness was expressed as enhanced pause (Penh) as described in detail previously (Hamelmann et al., 1997). Briefly, mice were placed in a whole-body chamber and basal readings were obtained and averaged for a 3 min period. Subsequently, increasing doses of methacholine (0–50 mg/mL), were aerosolized for 3 min, and readings were taken and averaged for 3 min after each nebulization (Vos et al., 2007).
Invasive measurement airway function (resistance (RL))
The mice were intraperitoneally anesthetized with KM-mix (containing Ketamine (Vetoquinol S.A., France; 125 mg/kg) and Medetomidine (Pfizer, Netherlands; 0.4 mg/kg). The animals were ventilated [O2/air (1:2)] at a frequency of 150 beats/min (TV = 0.3 mL). An anesthesia-induced fall in body temperature was avoided by placing the animals in a heated box in which the body temperature was kept at 37°C. The mice were prepared for the measurement of lung parameters [pulmonary resistance (RL)]. Pressure was determined as follows: a small catheter was placed in the trachea of the mouse. This catheter was connected to a pressure transducer fixed on the box (EMKA Technologies, Paris, France) and transpulmonary pressure was determined by measuring pressure differences in the cannula in the trachea. Airflow and tidal volume were determined using a flow transducer fixed to the body box that measured flow differences inside the box. Increasing doses of methacholine (acetyl-β-methyl-choline chloride, Sigma) (0–50 mg/mL, 10% puff for 10 s) were administered by aerosol generated in a nebulizer (EMKA Technologies, Paris, France) connected in between the animal in the body box and the ventilator (EMKA Technologies, Paris, France). After the first dose of methacholine, pulmonary resistance (RL) was measured for 3 min and this procedure was repeated for all doses. RL was yielded by dividing transpulmonary pressure by airflow at isovolume points. Data are presented as average RL in cm H2O/mL*s−1 (Sagar et al., 2014a).
Bronchoalveolar Lavage
Mice were killed by an intraperitoneal overdose of pentobarbital (Nembutal™, Ceva Santé Animale, Naaldwijk, The Netherlands) after the airway responsiveness measurement. The trachea was trimmed free of connective tissue and a small incision was made for insertion of a cannula into the trachea. Lungs were lavaged with 1 mL of pyrogen-free saline (0.9% NaCl, 37°C) supplemented with protease inhibitor cocktail tablet. The supernatant of the first mL was used for cytokine and chemokine measurement. Afterwards the lungs were lavaged 3 times with 1 mL saline solution (0.9% NaCl, 37°C). The BAL cells were centrifuged (400 g, 5 min) and pellets of the four lavages were pooled, resuspended, and total numbers of BAL cells were counted by use of a Bürker-Türk chamber. For differential BAL cell counts cytospin preparations were made and stained with Diff-Quick (Merz and Dade A.G., Düdingen, Switzerland). After coding, all cytospin preparations were evaluated by one observer using oil immersion microscopy. Cells were differentiated into macrophages, lymphocytes, neutrophils, and eosinophils by standard morphology. At least 200 cells per cytospin preparation were counted and the absolute number of each cell type was calculated (Braber et al., 2011).
Measurement of Cytokines and Chemokines
A standard mouse cytokine 21-plex assay (GM-CSF, IFNγ, IL-10, IL-12p40, IL-12p70, IL-13, IL-17, IL-1β, IL-2, IL-4, IL-5, IL-6, IL-9, IP-10, KC, MCP-1, MIG, MIP-1α, MIP-2, RANTES, and TNFα, Luminex; Biosource, Invitrogen, Breda, The Netherlands) was used to determine cytokine and chemokine concentrations in the BALF (n = 4–5) according to the manufacturer's instructions (Braber et al., 2010). The concentrations of these cytokines and chemokines were expressed as pg/mL.
Lung Histology
After lung lavage, lungs were fixated with 10% formalin infusion through the cannula at a constant pressure of 25 cm H2O. After at least 24 h of fixation lungs were embedded in paraffin. After embedding, 5 μ sections were cut and stained with hematoxylin/eosin (H and E) according to standard methods. Photomicrographs were taken with an Olympus B × 50 microscope equipped with a Leica DFC 320 digital Camera (Akbari et al., 2014; Sagar et al., 2014b).
Statistical Analysis
Results are presented as the mean ± standard error of mean (SEM). Data were statistically analyzed using a One-Way ANOVA followed by a Bonferroni post-hoc analysis. P-values < 0.05 were considered to be significant. Statistical analyses were conducted using GraphPad Prism software (version 5.0).
Results
Airway Function
Airway responsiveness was measured in conscious unrestrained mice (Penh) or in anesthetized ventilated animals (RL) exposed to inhaled methacholine 24 h after the last OVA or saline challenge.
Measurement of airway function in the mild airway inflammation model
In unrestrained mice, basal airway resistance was significantly increased in the OVA-OVA group compared to the SAL-SAL group (Figure 2). Moreover, there was an increase in Penh observed after administrating a low dose of methacholine to the OVA-OVA group compared to the SAL-SAL group. However, this effect was not observed using higher doses of methacholine. The Penh dose-dependently increased in the SAL-SAL group in response to methacholine inhalation to a maximum of 5.47 ± 1.63. The Penh in the OVA-OVA group was increased by 56% to a maximum of 8.54 ± 1.84, but this increase was not significant compared to the SAL-SAL group (Figure 2). In ventilated mice, basal airway resistance was not significantly different between the experimental groups (Figure 3). Methacholine slightly increased the RL in the SAL-SAL group, while the RL was significantly increased by 71% in the OVA-OVA group after methacholine (12.5–50 mg/mL) inhalation (Figure 3).
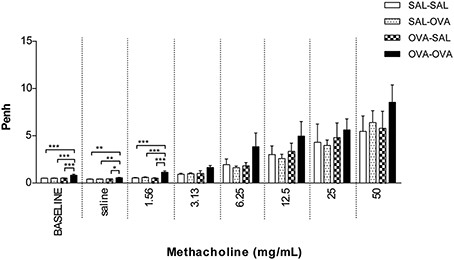
Figure 2. Airway responsiveness (Penh) to methacholine in the mild airway inflammation model. Airway responsiveness was measured in mice sensitized with saline or ovalbumin and challenged by aerosol with saline or ovalbumin. Values are expressed as mean ± s.e.m. *P < 0.05, **P < 0.01, ***P < 0.001; using a One-Way ANOVA followed by a Bonferroni post-hoc analysis, n = 5–9 mice/group.
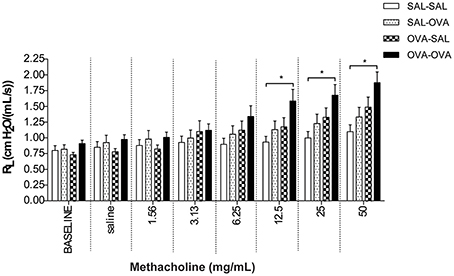
Figure 3. Resistance measurement (RL) to methacholine in the mild airway inflammation model. Resistance was measured in ventilated mice sensitized with saline or ovalbumin and challenged by aerosol with saline or ovalbumin. Values are expressed as mean ± s.e.m. *P < 0.05; using a One-Way ANOVA followed by a Bonferroni post-hoc analysis, n = 7–9 mice/group.
Measurement of airway function in the severe airway inflammation model
Basal airway resistance was significantly increased in the TNP-OVA—TNP-OVA-IgE group compared to the SAL-SAL group. The Penh increased dose-dependently in the SAL-SAL group after methacholine inhalation (Figure 4). The Penh in the TNP-OVA—TNP-OVA-IgE group was significantly increased compared to the SAL-SAL group to a maximum of 12.33 ± 1.99 (Figure 4). The increase in Penh was 1.5 times higher compared to the sensitized and challenged animals with mild airway inflammation (Figure 2). Although the basal RL did not differ in the OVA-OVA group of the mild model (Figure 3), basal RL tended to increase in the severe model (Figure 5), reaching the level of significance after saline exposure. As in the mild model, methacholine slightly increased the RL in the SAL-SAL group of the severe model. The RL was significantly increased in the TNP-OVA—TNP-OVA-IgE group after the methacholine inhalation to a maximum of 1.76 ± 0.18 cm H2O/mL*s−1. The maximal increase in RL to methacholine in the severe model was a level similar to the OVA-OVA group in the mild airway inflammation model, but the sensitivity was higher as evidenced by significant changes at lower doses of methacholine (Figures 3, 5).
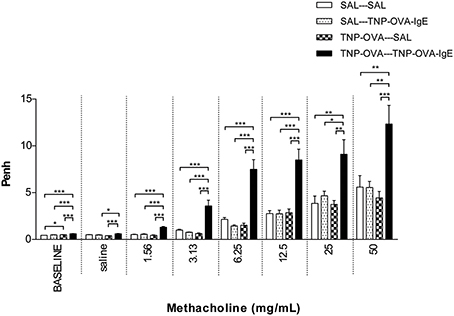
Figure 4. Airway responsiveness (Penh) to methacholine in the severe airway inflammation model. Airway responsiveness was measured in mice sensitized with saline or TNP-OVA and challenged intranasally with saline or TNP-OVA-IgE. Values are expressed as mean ± s.e.m. *P < 0.05, **P < 0.01, ***P < 0.001; using a One-Way ANOVA followed by a Bonferroni post-hoc analysis, n = 7–9 mice/group.
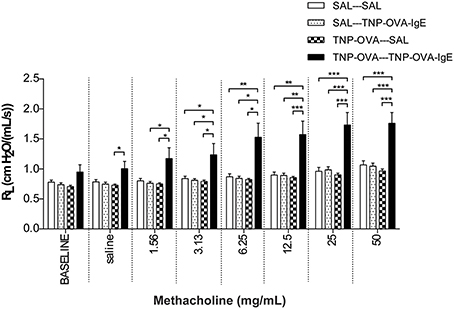
Figure 5. Resistance measurement (RL)to methacholine in the severe airway inflammation model. Resistance was measured in ventilated mice sensitized with saline or TNP-OVA and challenged intranasally with saline or TNP-OVA-IgE. Values are expressed as mean ± s.e.m. *P < 0.05, **P < 0.01, ***P < 0.001; using a One-Way ANOVA followed by a Bonferroni post-hoc analysis, n = 9 mice/group.
Airway Inflammation in the Mild Model
The influx of inflammatory cells (total and differentiated cell numbers) in the lungs was measured after lung function measurement. Total BAL cell numbers were 4 times higher in the OVA-OVA group compared to the SAL-SAL group after the Penh measurement (Table 3). This increase in total cells was mainly due to an increase in the number of eosinophils. Moreover, the number of lymphocytes in the OVA-OVA group was significantly increased. The total number of inflammatory cells after RL measurement was nine times higher in the OVA-OVA group compared to the SAL-SAL group. Lymphocytes, neutrophils, and eosinophils were all significantly increased in the OVA-OVA group. There were no differences between the SAL-SAL groups after measuring Penh or RL. In contrast, after RL measurement, the total number of BAL cells in the OVA-OVA group was three times higher compared to the OVA-OVA group after Penh measurement. This increase was mainly due to a significant increase in the number of eosinophils and to a lesser extent to an increase of lymphocytes and neutrophils (Table 3).
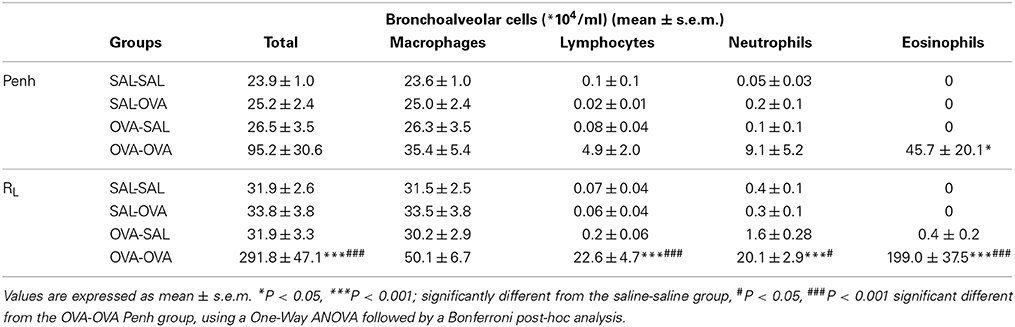
Table 3. Total and differential cell counts in broncho-alveolar lavage fluid in the mild airway inflammation model.
Airway Inflammation in the Severe Model
The total number of BAL cells after the Penh measurement in the SAL-SAL group of the severe model did not differ from the number of cells after the RL measurement (Table 4) and showed a slight increase compared to Penh and RL measurement in the mild model (Table 3). Daily intranasal administration of TNP-OVA-IgE from day 14–20 of the SAL group significantly increased the number of BAL cells whereas intranasal saline administration had no effect. This increase was mainly due to an increase in macrophages and neutrophils and not caused by changes in the number of eosinophils (Table 4). The total number of BAL cells was increased in the TNP-OVA—TNP-OVA-IgE group compared to the SAL-SAL group after the Penh measurement (Table 4). The total number of BAL cells was five times higher than in the mild OVA-OVA group (Table 3). This increase was mainly due to an increase in macrophages and eosinophils. The total number of BAL cells consisted for nearly 65% of eosinophils. Again the number of inflammatory cells was the highest in the severe group after ventilation of the animals (Table 4).
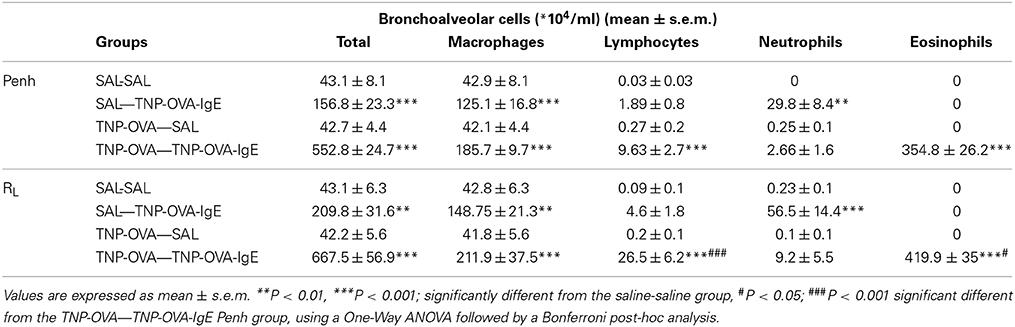
Table 4. Total and differential cell counts in broncho-alveolar lavage fluid in the severe airway inflammation model.
Cytokine Measurements
Inflammatory cytokines were measured in the BALF of the experimental groups. There was no relation between the cytokine profile or amount of cytokine protein and ventilation vs. no ventilation. Therefore, in contrast to the number of inflammatory cells, the ventilation procedure did not influence the type and amount of cytokines produced. However, the levels of IL-2 and RANTES were increased in BALF in the severe airway inflammation model compared to the mild model (Figures 6A,B, respectively). In the both models GM-CSF, IFNγ, IL-12p70, IL-13, IL-17, and MIP-2 were below detection limit. All other cytokines and chemokines are depicted in Tables 5, 6.
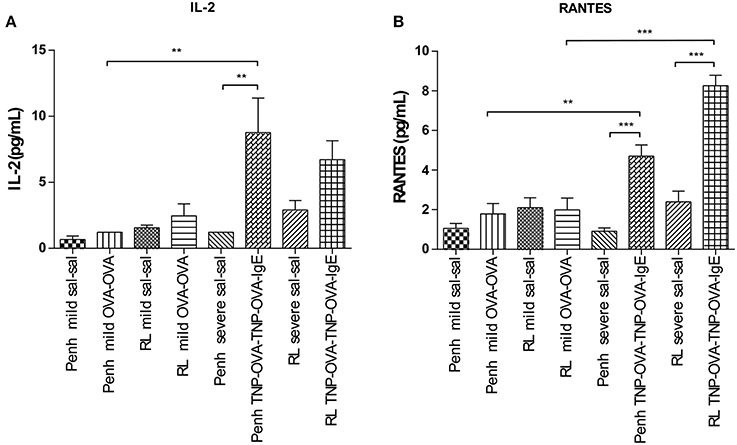
Figure 6. Cytokine measurement in BALF. Cytokines were measured in mice sensitized with saline or ovalbumin and challenged by aerosol with saline or ovalbumin (mild) and mice sensitized with saline or TNP-OVA and challenged intranasally with saline or TNP-OVA-IgE (severe) after Penh measurement or RL measurement. (A) IL-2 concentration in pg/mL, (B) RANTES concentration in pg/mL. Values are expressed as mean ± s.e.m. **P < 0.01, ***P < 0.001 using a One-Way ANOVA followed by a Bonferroni test, n = 4–5 mice/group.
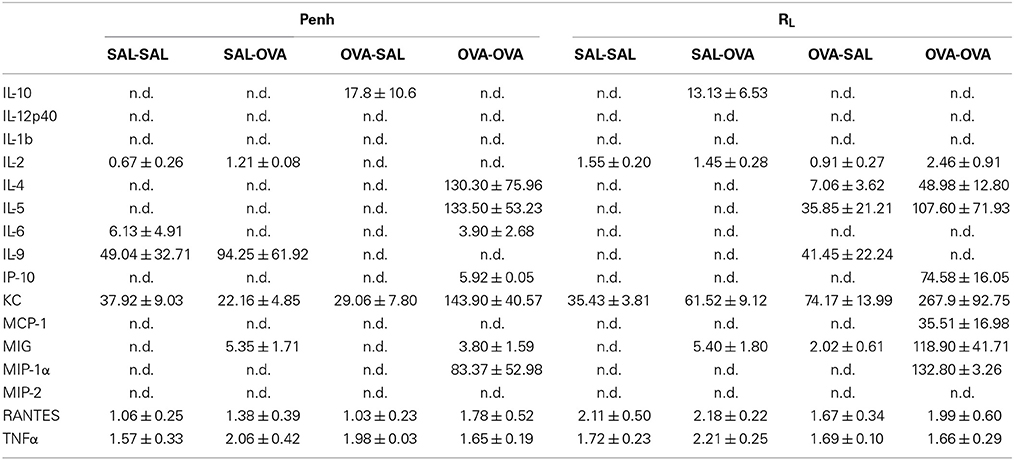
Table 5. Chemokine and cytokine concentration in broncho-alveolar lavage fluid in the mild airway inflammation model.
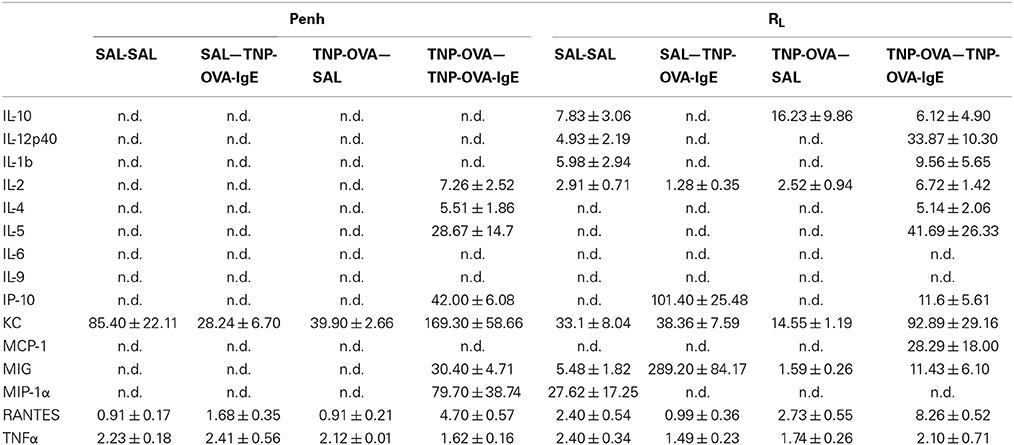
Table 6. Chemokine and cytokine concentration in broncho-alveolar lavage fluid in the severe airway inflammation model.
Discussion
In this study a comparison was made between the body plethysmography (Penh) and resistance (RL) measurements, to analyse murine airway function in two models for allergic airway inflammation. Although often referred to as a model for asthma these animal models do not reflect all pathophysiological mechanisms in asthma patients (Kumar and Foster, 2012). Therefor the models used in this manuscript are referred to as models of allergic airway inflammation. We demonstrated that the Penh measures are not as pronounced in the mild model as compared to RL measures. However, an additional increase in inflammatory cells was found during the RL measurement, which was most likely due to enforced pulmonary ventilation. In the severe inflammation model the increase in Penh was more pronounced compared to the RL. Using the bodyplethysmographic analysis of Penh, the total number of BAL cells in the OVA-OVA group increased three times compared to the SAL-SAL group in the mild inflammation model. The increase was mainly due to an increase in eosinophils. Eosinophilic inflammation were characteristic for allergic asthma (Barnes, 2008). In severe asthma, the numbers of eosinophils, macrophages, lymphocytes, and neutrophils are higher compared to mild asthma (Barnes, 2008). In agreement, in the severe inflammation model, the total number of BAL cells after TNP-OVA sensitization and TNP-OVA-IgE challenge was more than five times higher compared to OVA-OVA group in the mild inflammation model. The number of eosinophils in the severe airway inflammation model was more than seven times higher than in the mild inflammation model, as demonstrated earlier by Zuberi et al. (2000) and Sagar et al. (2013). After ventilation of the animals and RL measurements, the total number of BAL cells was higher compared to Penh, both in the mild (OVA-OVA group) and severe inflammation model (TNP-OVA—TNP-OVA-IgE group). In the severe airway inflammation model this increase was not as high as in the mild inflammation model. Potentially due to the number of BAL cells already at a maximum level caused by the process: ventilator-induced lung injury (VILI). Cannizzaro et al. (2011) and Zhang et al. (2009) demonstrated that mechanical ventilation increases the total number of BAL cells in BALB/c mice. In the mild inflammation model, only a slight but not significant increase in the Penh in the OVA-OVA group was found. Resistance of the upper airways may influence the outcome of changes in the lower airways (Hoymann, 2006), explaining this anomaly. In contrast, a pronounced airway hyperresponsiveness was observed in the severe inflammation model. This indicates that Penh measurements might only be useful to investigate airway function under conditions of severe inflammation. When the airway responsiveness was measured using the RL method, a significant increase in both the mild and severe allergic airway inflammation model was recorded. Strikingly, ventilation causes a significant increase in the number of BAL cells in the mild model, but not in the severe model. The number of inflammatory cells does not correlated with the airway hyperresponsiveness. From studies it is known that airway hyperresponsiveness to bronchoconstrictor agents does not correlate with inflammation, but indirect stimuli, like hypertonic saline does (Kumar and Foster, 2012). Histology of the lungs showed that more cells are present in mice with mild allergic airway inflammation after the RL measurement as compared to these after Penh measurement (Figure 7). The increase in the number of BAL cells in the ventilated animals of the mild inflammation model could not be explained by changes in chemokines or cytokines, but significantly higher levels of IL-2 and RANTES were observed in the severe model compared to the mild model. IL-2 can be produced by epithelial cells and eosinophils (Chung and Barnes, 1999) and increased levels are found in the BALF of patients with symptomatic asthma (Chung and Barnes, 1999; Bloemen et al., 2007). These experiments are in line with our observation that more eosinophils were present in the severe model. The eosinophilia might be further promoted by RANTES. RANTES is a CC chemokine involved in the chemoattraction of T lymphocytes, monocytes and eosinophils (Chung and Barnes, 1999; Saad-El-Din Bessa et al., 2012). Increased levels of RANTES are present in the BALF obtained from asthmatic patients (Lukacs et al., 1997; Chung and Barnes, 1999; Saad-El-Din Bessa et al., 2012) and blocking antibodies against RANTES are able to inhibit airway inflammation in a murine model of allergic airway disease (Saad-El-Din Bessa et al., 2012). In conclusion, in models with mild inflammation, body plethysmography for the determination of the airway hyperresponsiveness may not be as reliable as measurements of resistance which provided a more accurate analysis compared with previous studies. In severe models with more pronounced airway inflammation, both body plethysmography and measurement of RL may be used to analyze airway function. Along with the invasive procedure, a disadvantage of the RL method could be the ventilation-induced increase in BAL cell numbers under mild inflammatory conditions.
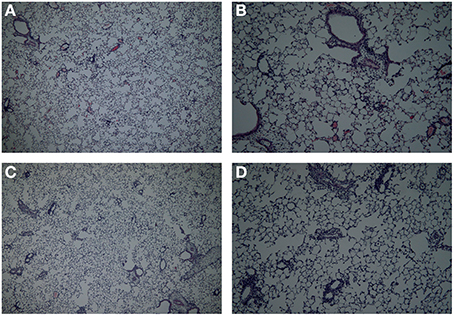
Figure 7. Lung histology in the mild airway inflammation model. Lungs were stained with H and E for histomorphometric analysis of the inflammation in mice sensitized with ovalbumin and challenged by aerosol with ovalbumin (mild) after Penh (A,B) or resistance measurement (C,D). Magnification 40× (A–C) or 100× (B–D).
Funding
This project is jointly financed by the European Union, European Regional Development Fund and The Ministry of Economic Affairs, Agriculture and Innovation, Peaks in the Delta, the Municipality of Groningen, the Provinces of Groningen, Fryslân and Drenthe, the Dutch Carbohydrate Competence Center (CCC WP25;www.cccresearch.nl), Nutricia Research and FrieslandCampina.
Conflict of Interest Statement
The authors declare that the research was conducted in the absence of any commercial or financial relationships that could be construed as a potential conflict of interest.
Acknowledgments
The authors would like to thank Ingrid van Ark, Thea Leusink, Marije Kleinjan, and Bart Blokhuis for their excellent technical assistance.
Abbreviations
BALF, Broncho-Alveolar Lavage Fluid; OVA, Ovalbumin; RL, Lung Resistance; TNP, Trinitrophenyl; VILI, Ventilator-Induced Lung Injury.
References
Adler, A., Cieslewicz, G., and Irvin, C. G. (2004). Unrestrained plethysmography is an unreliable measure of airway responsiveness in BALB/c and C57BL/6 mice. J. Appl. Physiol. 97, 286–292. doi: 10.1152/japplphysiol.00821.2003
Akbari, P., Braber, S., Gremmels, H., Koelink, P. J., Verheijden, K. A., Garssen, J., et al. (2014). Deoxynivalenol: a trigger for intestinal integrity breakdown. FASEB J. 28, 2414–2429. doi: 10.1096/fj.13-238717
Albertine, K. H., Wang, L., Watanabe, S., Marathe, G. K., Zimmerman, G. A., and McIntyre, T. M. (2002). Temporal correlation of measurements of airway hyperresponsiveness in ovalbumin-sensitized mice. Am. J. Physiol. Lung Cell. Mol. Physiol. 283, L219–L233. doi: 10.1152/ajplung.00324.2001
Barnes, P. J. (2008). Immunology of asthma and chronic obstructive pulmonary disease. Nat. Rev. Immunol. 8, 183–192. doi: 10.1038/nri2254
Bates, J. H., and Irvin, C. G. (2003). Measuring lung function in mice: the phenotyping uncertainty principle. J. Appl. Physiol. 94, 1297–1306. doi: 10.1152/japplphysiol.00706.2002
Berndt, A., Leme, A. S., Williams, L. K., Von Smith, R., Savage, H. S., Stearns, T. M., et al. (2011). Comparison of unrestrained plethysmography and forced oscillation for identifying genetic variability of airway responsiveness in inbred mice. Physiol. Genomics 43, 1–11. doi: 10.1152/physiolgenomics.00108.2010
Bloemen, K., Verstraelen, S., Van Den Heuvel, R., Witters, H., Nelissen, I., and Schoeters, G. (2007). The allergic cascade: review of the most important molecules in the asthmatic lung. Immunol. Lett. 113, 6–18. doi: 10.1016/j.imlet.2007.07.010
Braber, S., Henricks, P. A., Nijkamp, F. P., Kraneveld, A. D., and Folkerts, G. (2010). Inflammatory changes in the airways of mice caused by cigarette smoke exposure are only partially reversed after smoking cessation. Respir. Res. 11:99. doi: 10.1186/1465-9921-11-99
Braber, S., Overbeek, S. A., Koelink, P. J., Henricks, P. A., Zaman, G. J., Garssen, J., et al. (2011). CXCR2 antagonists block the N-Ac-PGP-induced neutrophil influx in the airways of mice, but not the production of the chemokine CXCL1. Eur. J. Pharmacol. 668, 443–449. doi: 10.1016/j.ejphar.2011.03.025
Brown, R. H., Walters, D. M., Greenberg, R. S., and Mitzner, W. (1999). A. method of endotracheal intubation and pulmonary functional assessment for repeated studies in mice. J. Appl.Physiol. 87, 2362–2365.
Cannizzaro, V., Hantos, Z., Sly, P. D., and Zosky, G. R. (2011). Linking lung function and inflammatory responses in ventilator-induced lung injury. Am. J. Physiol. Lung Cell. Mol. Physiol. 300, L112–L120. doi: 10.1152/ajplung.00158.2010
Chung, K. F., and Barnes, P. J. (1999). Cytokines in asthma. Thorax 54, 825–857. doi: 10.1136/thx.54.9.825
De Vleeschauwer, S. I., Rinaldi, M., De Vooght, V., VanOirbeek, J. A., VanAudenaerde, B. M., Verbeken, E. K., et al. (2011). Repeated invasive lung function measurements in intubated mice: an approach for longitudinal lung research. Lab. Anim. 45, 81–89. doi: 10.1258/la.2010.010111
Frazer, D. G., Reynolds, J. S., and Jackson, M. C. (2011). Determining when enhanced pause (Penh) is sensitive to changes in specific airway resistance. J. Toxicol. Environ. Health A 74, 287–295. doi: 10.1080/15287394.2010.514235
Glaab, T., Mitzner, W., Braun, A., Ernst, H., Korolewitz, R., Hohlfeld, J. M., et al. (2004). Repetitive measurements of pulmonary mechanics to inhaled cholinergic challenge in spontaneously breathing mice. J. Appl. Physiol. 97, 1104–1111. doi: 10.1152/japplphysiol.01182.2003
Glaab, T., Taube, C., Braun, A., and Mitzner, W. (2007). Invasive and noninvasive methods for studying pulmonary function in mice. Respir. Res. 8, 63. doi: 10.1186/1465-9921-8-63
Hamelmann, E., Schwarze, J., Takeda, K., Oshiba, A., Larsen, G. L., Irvin, C. G., et al. (1997). Noninvasive measurement of airway responsiveness in allergic mice using barometric plethysmography. Am. J. Respir. Crit. Care Med. 156, 766–775. doi: 10.1164/ajrccm.156.3.9606031
Hoymann, H. G. (2006). New developments in lung function measurements in rodents. Exp. Toxicol. Pathol. 57 (Suppl. 2), 5–11. doi: 10.1016/j.etp.2006.02.011
Hoymann, H. G. (2007). Invasive and noninvasive lung function measurements in rodents. J. Pharmacol. Toxicol. Methods 55, 16–26. doi: 10.1016/j.vascn.2006.04.006
Hoymann, H. G. (2012). Lung function measurements in rodents in safety pharmacology studies. Front. Pharmacol. 3:156. doi: 10.3389/fphar.2012.00156
Irvin, C. G., and Bates, J. H. (2003). Measuring the lung function in the mouse: the challenge of size. Respir. Res. 4, 4. doi: 10.1186/rr199
Kumar, R. K., and Foster, P. S. (2012). Are mouse models of asthma appropriate for investigating the pathogenesis of airway hyper-responsiveness? Front. Physiol. 3:312. doi: 10.3389/fphys.2012.00312
Lomask, M. (2006). Further exploration of the Penh parameter. Exp. Toxicol. Pathol. 57 (Suppl. 2), 13–20. doi: 10.1016/j.etp.2006.02.014
Lundblad, L. K., Irvin, C. G., Adler, A., and Bates, J. H. (2002). A reevaluation of the validity of unrestrained plethysmography in mice. J. Appl. Physiol. 93, 1198–1207. doi: 10.1152/japplphysiol.00080.2002
Lukacs, N. W., Strieter, R. M., Warmington, K., Lincoln, P., Chensue, S. W., and Kunkel, S. L. (1997). Differential recruitment of leukocyte populations and alteration of airway hyperreactivity by C-C family chemokines in allergic airway inflammation. J. Immunol. 158, 4398–4404.
O'Byrne, P. M., and Inman, M. D. (2003). Airway hyperresponsiveness. Chest 123, 411S-416S. doi: 10.1378/chest.123.3_suppl.411S
Pasquier, B., Launay, P., Kanamaru, Y., Moura, I. C., Pfirsch, S., Ruffie, C., et al. (2005). Identification of FcalphaRI as an inhibitory receptor that controls inflammation: dual role of FcRgamma ITAM. Immunity 22, 31–42. doi: 10.1016/j.immuni.2004.11.017
Saad-El-Din Bessa, S., Abo El-Magd, G. H., and Mabrouk, M. M. (2012). Serum chemokines RANTES and monocyte chemoattractant protein-1 in Egyptian patients with atopic asthma: relationship to disease severity. Arch. Med. Res. 43, 36–41. doi: 10.1016/j.arcmed.2012.01.009
Sagar, S., Morgan, M. E., Chen, S., Vos, A. P., Garssen, J., van Bergenhenegouwen, J., et al. (2014a). Bifidobacterium breve and Lactobacillus rhamnosus treatment is as effective as budesonide at reducing inflammation in a murine model for chronic asthma. Respir. Res. 15, 46. doi: 10.1186/1465-9921-15-46
Sagar, S., Verheijden, K. A., Georgiou, N. A., Garssen, J., Kraneveld, A. D., Vos, A. P., et al. (2013). Differential regulation of inflammation and immunity in mild and severe experimental asthma. Mediat. Inflamm. 2013:808470. doi: 10.1155/2013/808470
Sagar, S., Vos, A. P., Morgan, M. E., Garssen, J., Georgiou, N. A., Boon, L., et al. (2014b). The combination of Bifidobacterium breve with non-digestible oligosaccharides suppresses airway inflammation in a murine model for chronic asthma. Biochim. Biophys. Acta 1842, 573–583. doi: 10.1016/j.bbadis.2014.01.005
Sly, P. D., Turner, D. J., and Hantos, Z. (2004). Measuring lung function in murine models of pulmonary disease. Drug Discov. Today 1, 337–343. doi: 10.1016/j.ddmod.2004.11.016
Ten Broeke, R., De Crom, R., Van Haperen, R., Verweij, V., Leusink-Muis, T., Van Ark, I., et al. (2006). Overexpression of endothelial nitric oxide synthase suppresses features of allergic asthma in mice. Respir. Res. 7, 58. doi: 10.1186/1465-9921-7-58
Vos, A. P., van Esch, B. C., Stahl, B., M'Rabet, L., Folkerts, G., Nijkamp, F. P., et al. (2007). Dietary supplementation with specific oligosaccharide mixtures decreases parameters of allergic asthma in mice. Int. Immunopharmacol. 7, 1582–1587. doi: 10.1016/j.intimp.2007.07.024
Zhang, Q., Lai, K., Xie, J., Chen, G., and Zhong, N. (2009). Does unrestrained single-chamber plethysmography provide a valid assessment of airway responsiveness in allergic BALB/c mice? Respir. Res. 10, 61. doi: 10.1186/1465-9921-10-61
Keywords: airway hyperresponsiveness, airway inflammation, lung resistance, Penh
Citation: Verheijden KAT, Henricks PAJ, Redegeld FA, Garssen J and Folkerts G (2014) Measurement of airway function using invasive and non-invasive methods in mild and severe models for allergic airway inflammation in mice. Front. Pharmacol. 5:190. doi: 10.3389/fphar.2014.00190
Received: 19 May 2014; Accepted: 25 July 2014;
Published online: 12 August 2014.
Edited by:
Paul Thomas, University of New South Wales, AustraliaReviewed by:
Koichiro Asano, Tokai University School of Medicine, JapanJohn F. Alcorn, Children's Hospital of Pittsburgh of UPMC, USA
Paul Thomas, University of New South Wales, Australia
Copyright © 2014 Verheijden, Henricks, Redegeld, Garssen and Folkerts. This is an open-access article distributed under the terms of the Creative Commons Attribution License (CC BY). The use, distribution or reproduction in other forums is permitted, provided the original author(s) or licensor are credited and that the original publication in this journal is cited, in accordance with accepted academic practice. No use, distribution or reproduction is permitted which does not comply with these terms.
*Correspondence: Kim A. T. Verheijden, Division of Pharmacology, Faculty of Science, Utrecht Institute for Pharmaceutical Sciences, Utrecht University, Universiteitsweg 99, PO Box 80082, 3508 TB, Utrecht, Netherlands e-mail: k.a.t.verheijden@uu.nl