 Sheng Jin1†
 Bo Tan2†Xu Teng1Ruoni Meng1Xin Jiao1
 Danyang Tian1
 Lin Xiao1
 Hongmei Xue1
 Qi Guo1
 Xiaocui Duan1
 Yuming Wu1,3,4*
- 1Department of Physiology, Hebei Medical University, Shijiazhuang, China
- 2Clinical Pharmacokinetic Laboratory, Shuguang Hospital Affiliated to Shanghai University of Traditional Chinese Medicine, Shanghai, China
- 3Collaborative Innovation Center for Cardio-Cerebrovascular Disease, Hebei Medical University, Shijiazhuang, China
- 4Key Laboratory of Vascular Medicine of Hebei Province, Hebei Medical University, Shijiazhuang, China
Circadian rhythms are essential in a myriad of physiological processes to maintain homeostasis, especially the redox homeostasis. However, little is known about whether plasma H2S exhibits the physiological diurnal variation. The present study was performed to investigate the diurnal fluctuations of plasma H2S and explore the potential mechanisms. We found that the plasma H2S of the C57BL/6J mice was significantly higher at 19 o’clock than those at 7 o’clock which was not affected by the blood-collecting sequence and the concentrations of plasma cysteine (a precursor of H2S). No significant differences in mRNA or protein expression of the CSE, CBS, or MPST were observed between 7: 00 and 19: 00. There were also no significant differences in the CSE and CBS activities, while the activities of MPST in tissues were significantly higher at 19 o’clock. After treatment with AOAA (a CBS inhibitor) or PPG (a CSE inhibitor) for 14 days, plasma H2S concentrations at 19 o’clock were still significantly higher than those at 7 o’clock, although they were both significantly decreased as compared with controls. Identical findings were also observed in CSE KO mice. We also found the plasma H2O2 concentrations were significantly higher at 19 o’clock than those at 7 o’clock. However, H2O2 concentrations were significantly decreased at 19 o’clock than those at 7 o’clock when mice were exposed to continuous light for 24 h. Meanwhile, the diurnal fluctuations of plasma H2S levels and MPST activities in tissues were disappeared. After treatment with DTT for 14 days, there was no significant difference in plasma H2O2 concentrations between 7 o’clock and 19 o’clock. Meanwhile, the diurnal fluctuations of plasma H2S levels and MPST activities in tissues were disappeared. Identical findings were also observed in SOD2+/- mice. When heart tissues were incubated with increasing concentrations of H2O2 in vitro, H2O2 could dose-dependently increase the activity of MPST within a certain concentration range. In conclusion, our studies revealed that plasma H2S concentration and tissue MPST activity exhibited diurnal fluctuations. Modulated by plasma H2O2 concentration, changes of MPST activity probably led to the diurnal fluctuations of plasma H2S.
Introduction
Circadian rhythms are the natural patterns of physiological, mental, and behavioral changes in living organisms in response to the normal environmental challenges they face over a 24-h period (Panda, 2016). Although circadian rhythms are widespread throughout the body, the circadian timing system is hierarchical. In mammals, the suprachiasmatic nucleus houses the master circadian clock and coordinates a set of peripheral oscillators in different tissues. Molecular regulation by the clock genes in the circadian oscillator is based on interconnected transcriptional- translational feedback loops, whereby feedback to negatively regulate their own transcription (Robles et al., 2017). Moreover, clock proteins are regulated by mechanisms including microRNA, post-translational modification, and proteasomal degradation (Chen et al., 2014; DeBruyne et al., 2015; Hirano et al., 2016). In addition, a growing collection of data suggest that the intracellular redox status play a significant role in regulation of the circadian rhythms, while most redox couples have been reported to undergo circadian rhythms (Pekovic-Vaughan et al., 2014; Schmalen et al., 2014).
As a toxic weak reductant, H2S has been accepted as the third “gasotransmitter” after nitric oxide (NO) and carbon monoxide (CO) (Yang et al., 2008). Similar to NO and CO, H2S is endogenously generated by several enzymes in mammalian, including CBS, CSE, and MPST. CSE is primarily involved in maintaining cardiovascular function, whereas CBS has an important role in the central and peripheral nervous systems (Abe and Kimura, 1996; Xu et al., 2014). MPST contributes to H2S formation in both the brain and the cardiovascular systems (Shibuya et al., 2009; Kimura et al., 2015). It has been demonstrated that H2S influences a wide range of physiological processes, including blood vessel relaxation, cardioprotection, neurotransmission, neuroprotection, and insulin secretion (Kimura, 2014). Exogenous H2S may also regulate the oxidative stress observed in several diseases sometimes associated with the changes of endogenous H2S concentration (Kimura and Kimura, 2004). Recently, Shang et al. (2012) have shown that H2S can affect the intracellular redox state via affecting the expression of circadian clock genes mediated by NAD-dependent deacetylase sirtuin-1. Another study finds that cecal H2S production by gut microbes from high fat-fed mice exhibit diurnal patterns, which is absent in control mice. Conversely, fecal pellets from high fat-fed mice show loss of rhythmicity in H2S production, yet the rhythmicity become evident in control mice (Leone et al., 2015). However, it is not yet clear whether H2S in plasma exhibits the physiological diurnal fluctuations.
With this in mind, the aim of present study was to investigate the diurnal fluctuations of plasma H2S and explore the potential mechanisms.
Materials and Methods
Drugs and Chemicals
Monobromobimane, H2O2, DTT, AOAA, PPG, L-Cysteine, α-ketoglutarate, and pyridoxal-5′-phosphate were purchased from Sigma-Aldrich, Co., Ltd (St. Louis, MO, United States). Detection kit for H2O2 was purchased from Jiancheng BioEngineering (Nanjing, China). Bicinchoninic acid (BCA) reagent was purchased from Generay Biotechnology (Shanghai, China). Other chemicals and reagents were of analytical grade.
Animals and Treatments
Male C57BL/6J mice were purchased from Vital River Laboratories (Beijing, China) and acclimatized for at least 2 weeks before experiments. The CSE and superoxide dismutase 2 (SOD2) heterozygote mice with C57BL/6J genetic bases were kindly provided as gifts by Professor Yichun Zhu (Fudan University, Shanghai, China). CSE WT and knockout (CSE KO) mice were used in the experiments while heterozygote mice were maintained for breeding. SOD2 homozygous mice died within 21 days after birth, so heterozygote (SOD2+/-) mice were used for the experiments. Mice were housed in plastic cages in a room with a controlled humidity of 60%, at temperature of 22–24°C and on a regular 12-h light and dark cycle (lights on from 7:00 to 19:00). They were fed on standard rat chow and tap water ad libitum. At the time of experiments, all mice were 6–8 weeks old. After 2 weeks of acclimatization, the mice were treated as follows:
Male C57BL/6J mice were randomly divided into three groups. Group 1: blood was collected successively at 7:00 and 19:00 from the same mice after anaesthetized with isoflurane (1%); Group 2: blood was collected successively at 19:00 and 7:00 from the same mice; Group 3: blood was collected successively at 7:00 and 19:00 from the same mice which were exposed to continuous light for 24 h. After blood was drawn, the mice in group 1 or 3 were further divided into two subgroups: mice were euthanized with 6% chloral hydrate and tissues (heart, kidney, and liver) were rapidly removed at 7:00 and 19:00, respectively and retained at -80°C until further analysis.
In order to inhibit the activity of CSE, CSE KO mice were used for the experiments. The inhibitors of CSE and CBS, PPG and AOAA, were also used for long-term in C57BL/6J mice as literature (Tan et al., 2017). C57BL/6J mice were injected intraperitoneally with equal volumes of saline, PPG (33.9 mg/kg), or AOAA (17 mg/kg), respectively for 14 days. After treatment, blood was collected successively at 7:00 and 19:00 from the same mice.
In order to observe the effect of ROS on the generation of H2S, SOD2+/- mice were used for the experiments. DTT, a thiol-reducing reagent, was also used as a reducer to clean ROS (Deepmala et al., 2013). C57BL/6J mice were injected intraperitoneally with equal volumes of saline or DTT (15.4 mg/kg) respectively for 14 days. After treatment, blood was collected successively at 7:00 and 19:00 from the same mice. SOD2+/- mice or DTT-treatment mice were further divided into two subgroups: mice were euthanized with 6% chloral hydrate and tissues (heart, kidney, and liver) were rapidly removed at 7:00 and 19:00, respectively and retained at -80°C until further analysis.
Plasma was separated from the blood after centrifugation at 3500 rpm for 10 min, and then stored at -80°C until assay.
All our animal experimental procedures were performed according to the Guide for the Care and Use of Laboratory Animals of the National Institutes of Health (NIH) of the United States and approved by the Ethics Committee for Laboratory Animals Care and Use of Hebei Medical University.
Measurement of H2S Concentration in Plasma
The H2S in plasma was measured according to previously described methods (Tan et al., 2017). Thirty microliters of plasma were mixed with 80 μL MBB and 10 μL 0.1% ammonia with shaking for 1-h at room temperature for derivatization of sulfide. MBB reacts with sulfide to produce sulfide-dibimane (SDB). SDB is more hydrophobic than most physiological thiols and can be separated by gradient elution and analyzed by liquid chromatography-tandem mass spectrometry. The reaction was then terminated with 10 μL 20% formic acid and centrifuged at 15000 g for 10 min. The supernatants were stored at -80°C until H2S measurements were done. H2S concentrations were determined by using a curve generated with sodium sulfide (0–40 μmol/L) standards.
Measurement of the Activities of MPST, CSE, and CBS
The activities of MPST, CSE, and CBS in tissues (heart, kidney, and liver) were measured according to the previously described methods with some modified (Tao et al., 2013). Briefly, heart tissues were homogenized in ice-cold PBS and centrifuged at 12,000 g for 20 min at 4°C. The supernatant was immediately used to measure the activities of three enzymes, and proteins in the supernatant were quantified using the BCA reagent. To measure the CSE and CBS activity, the enzyme substrate L-cysteine (10 mmol/L) and the cofactor pyridoxal-5′-phosphate (2 mmol/L) were added to the supernatant for an incubation of 0.5 h. To measure the MPST activity, L-cysteine (10 mmol/L) and α-ketoglutarate (2 mmol/L) were added to the supernatant for an incubation of 0.5 h. Then H2S concentrations in the reaction system were measured and the amount of H2S produced per microgram protein per hour was calculated as the activities of three enzymes.
Measurement of H2O2 Concentration in Plasma
The H2O2 concentration in plasma was determined by using commercially assay kits according to the manufacturer’s instructions.
Measurement of Cysteine Concentration in Plasma
The plasma cysteine concentration was measured following a reported LC–MS/MS method with slight modification (Yuan et al., 2012). In brief, the plasma sample was added into four-folder methanol, mixed and centrifuged at 14,000 g for 10 min. Supernatant was collected and volatilized in nitrogen gas condition without heating. The residual was redissolved by HPLC mobile phase before analysis. The quantification experiment was conducted by a Prominence HPLC (Shimadzu, Japan) coupled with an AB Sciex API 5500 triple quadrupole mass spectrometer (Foster City, Canada). The chromatographic separation was performed on an Amide XBridge HPLC column (4.6 mm × 100 mm with a particle size of 3.5 μm). Positive ionization mode for electrospray ionization source was used for detection. Data were collected in selected reaction monitoring mode using transitions of m/z 122.1 →m/z 59.1 for cysteine.
Western Blot Analysis
Frozen heart tissues were homogenized with ice-cold RIPA lysis buffer. Proteins were extracted and quantified by the BCA method. Equal amount of protein samples were separated on 10% SDS-PAGE gels and transferred to polyvinylidene fluoride (PVDF) membranes. The membranes were blocked with 5% non-fat milk for 1 h and incubated with primary antibodies that recognized CSE (1:1000, Proteintech Biotechnology, Chicago, IL, United States), CBS (1:1000, Abcam, Cambridge, United Kingdom), and MPST (1:1000, Santa Cruz Biotechnology Company, Santa Cruz, CA, United States) at 4°C overnight. Then the membranes were incubated with horseradish peroxidase-conjugated secondary antibodies for 1 h after washing with TBST. Specific bands were detected with SuperSignal West Pico Chemiluminescent Substrate (Thermo, Scientific-Pierce, Waltham, MA, United States). The band intensity was quantified by Image J software.
Real-time qPCR
Frozen heart tissues were suspended in Trizol reagent (Invitrogen, Carlsbad, CA, United States), and the total RNA was extracted according to the manufacturer’s instructions. Reverse transcription was performed using a Reverse Transcription Kit (Toyobo, Osaka, Japan). A SYBRGreen RT-PCR Kit from Toyobo was used for quantitative real-time qPCR analysis with the StepOnePLUS Real-time PCR system (Applied Biosystems, Foster City, CA, United States), according to the manufacturer’s instructions. Gene-specific primers were used to detect mice CSE (forward primer: 5′-TGCTGCCACCATTACGATTAC-3′; reverse primer: 5′-CTTCAGTCCAAATTC AGATGCCA-3′), CBS (forward primer: 5′-GGCTTTCAGAGACACCTACCA-3′; reverse primer: 5′-ACTCGGGCATAGAGGATTCA-3′), and MPST (forward primer: 5′-CACTCTGACCCTGCTTTGC-3′; reverse primer: 5′-CCACCTTCTTGGCTA CCTCA-3′). The samples were normalized against endogenous mice β-actin (forward primer: 5′-TGTTACCAACTGGGACGACA-3′; reverse primer: 5′-AAGGAAGGC TGGAAAAGAGC-3′), and fold changes were calculated using the formula 2-ΔΔCT.
Reaction between H2O2 and MPST
In order to determine whether H2O2 could affect the activity of MPST in vitro, increasing concentrations of H2O2 (50 μL, 0–100 μmol/L) were incubated with 450 μL heart tissue proteins after homogenized with ice-cold PBS for 30 min at 37°C. MPST activity was measured as previously described in Section “Measurement of the Activities of MPST, CSE, and CBS.”
Statistical Analysis
Results were expressed as mean ± SEM. Statistical analysis was performed using an SPSS software package, version 13.0 (SPSS, Inc., Chicago, IL, United States). Comparisons between two time points from one mouse were made using paired-samples t-test. Comparisons between two groups were made using Student’s t-test. The results for three or more groups were compared using one-way ANOVA followed by Student-Newman-Keuls t-test. P < 0.05 was considered statistically significant.
Results
Diurnal Fluctuations of Plasma H2S in Mice
After 2 weeks of acclimatization on a regular 12-h light and dark cycle (lights on from 7:00 to 19:00), we first collected blood at 7 o’clock and then collected blood at 19 o’clock from the same mice. As was shown in Figure 1A, the plasma H2S concentrations were significantly higher at 19 o’clock than those at 7 o’clock. To rule out the effects of blood-collecting sequence on plasma H2S concentrations, we first collected blood at 19 o’clock and then collected blood at 7 o’clock the next day from the same mice. As was shown in Figure 1B, the plasma H2S concentrations were also significantly higher at 19 o’clock than those at 7 o’clock. So we uniformly collected blood at 7 o’clock and then collected blood at 19 o’clock from the same mice in the subsequent experiment. However, there was no significant difference in plasma H2S concentrations between 7 o’clock and 19 o’clock when the mice were exposed to continuous light for 24 h (Figure 1C).
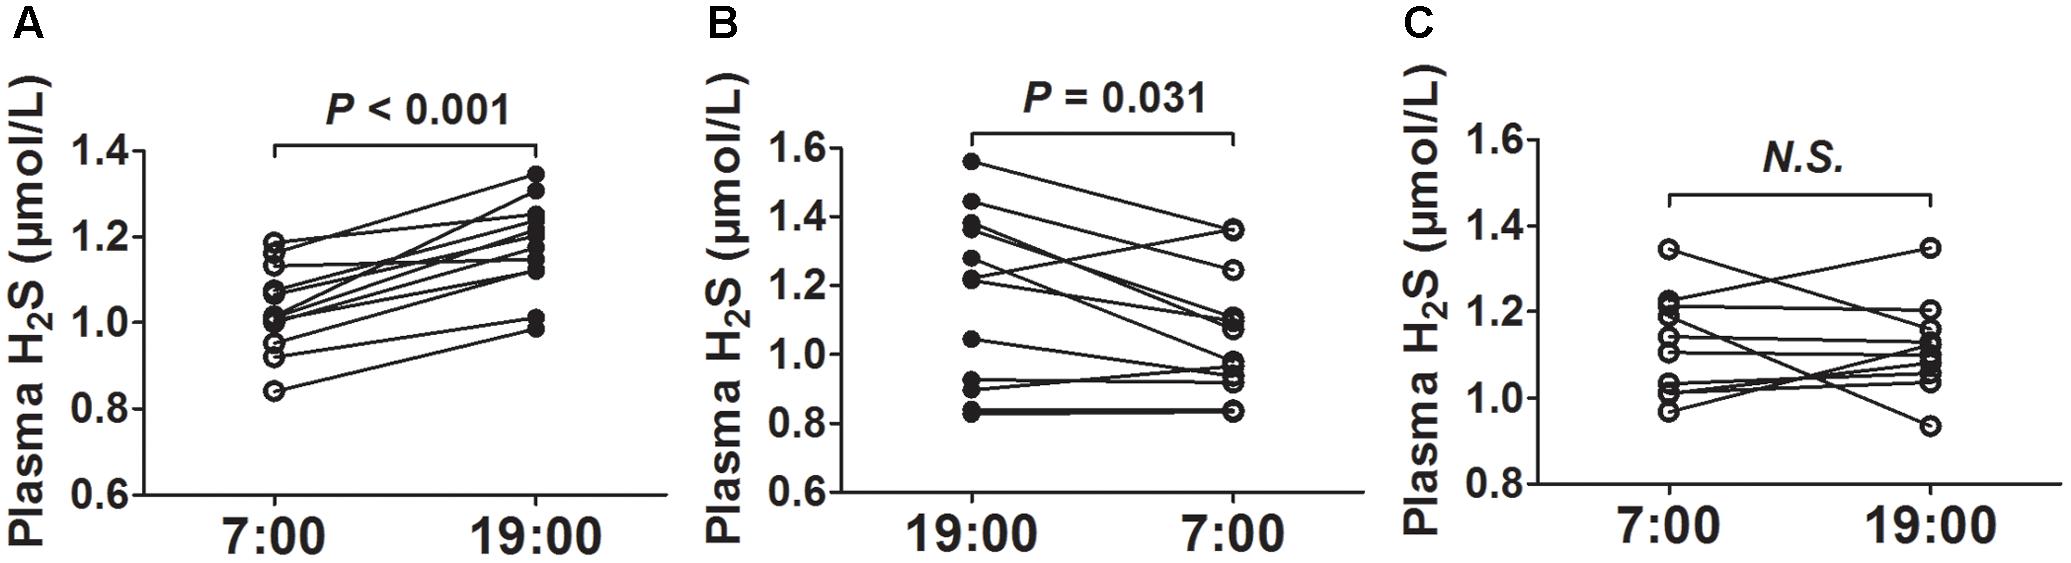
FIGURE 1. Diurnal fluctuations of plasma H2S in mice. (A) H2S levels in plasma successively at 7:00 and 19:00 from the same mice. (B) H2S levels in plasma successively at 19:00 and 7:00 from the same mice. (C) H2S levels in plasma successively at 7:00 and 19:00 from the same mice exposed to continuous light for 24 h. Results are means ± SEM. A P of <0.05 was considered significant.
Diurnal Fluctuations of Plasma H2S Were Modulated by MPST Activity
As was shown in Figure 2A, there was no significant difference in plasma cysteine (the substrate of H2S) concentrations between 7 o’clock and 19 o’clock. The activities of MPST in tissues (heart, kidney, and liver) were significantly higher at 19 o’clock than those at 7 o’clock (Figure 2C), while neither mRNA or protein expression of the MPST in heart had significant differences (Figures 2D–F). There were also no significant differences in activity, protein or mRNA expression of the CSE and CBS (Figures 2B,D–F).
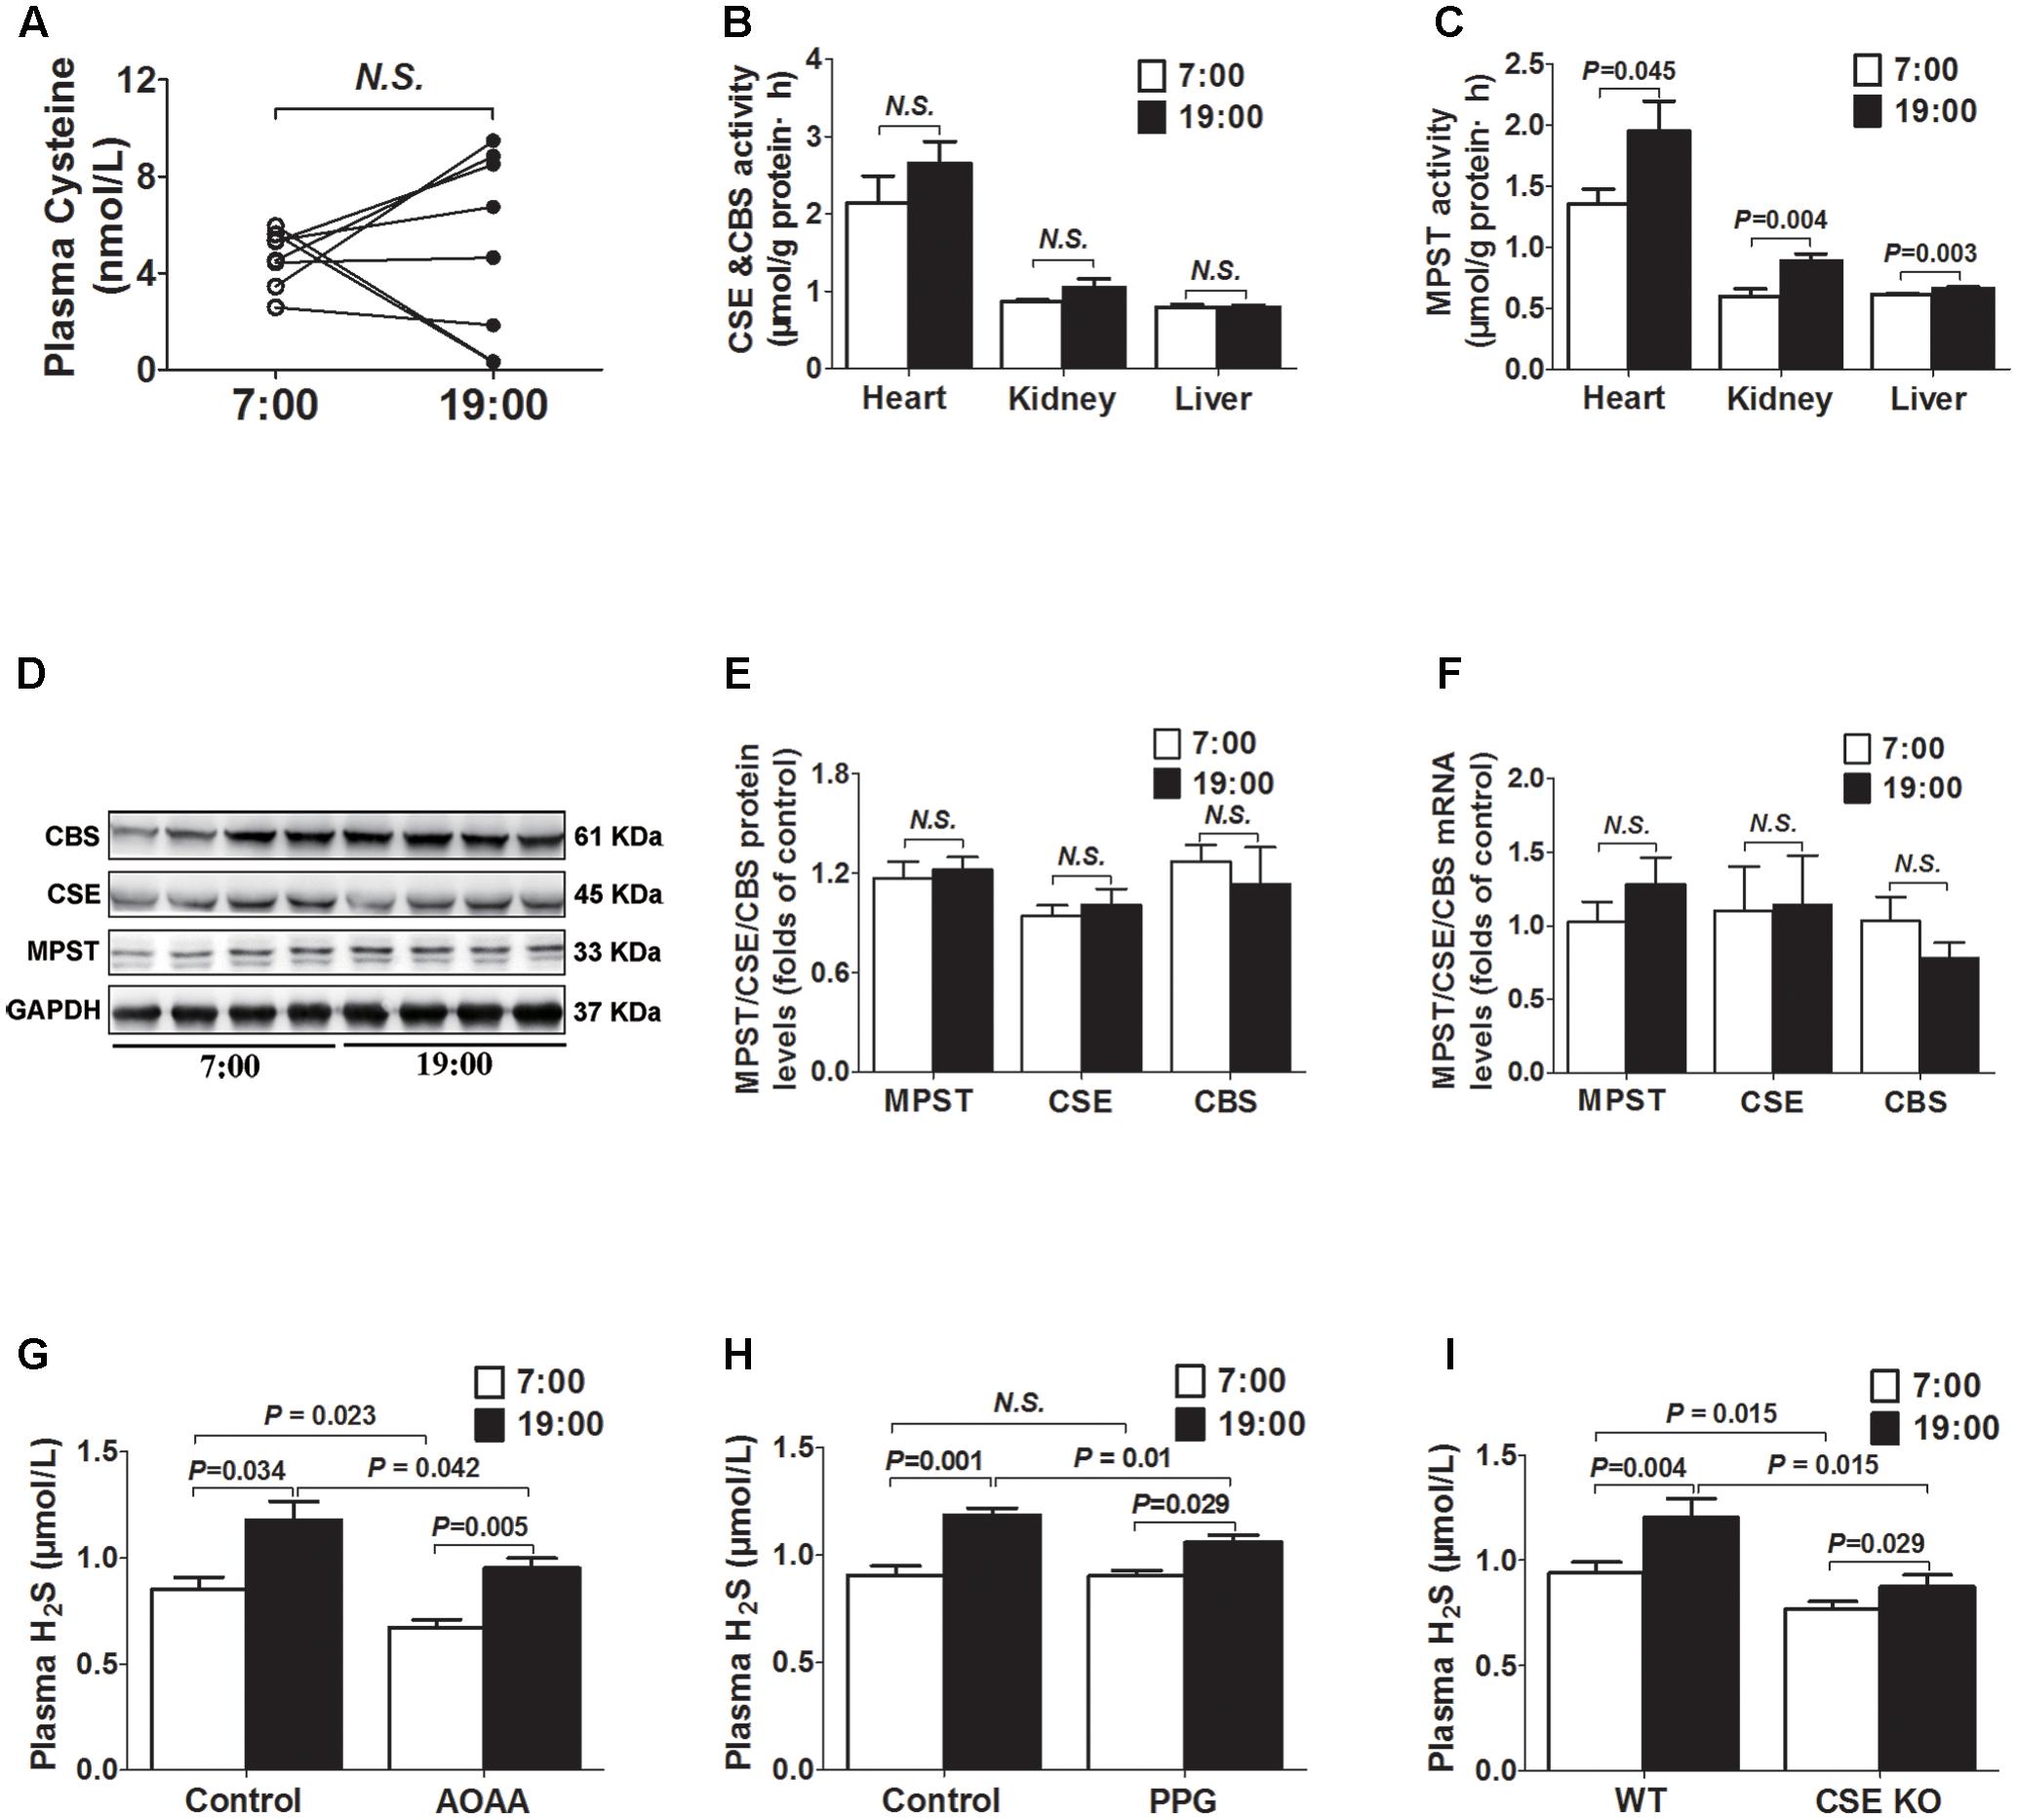
FIGURE 2. Diurnal fluctuations of plasma H2S were modulated by MPST activity. (A) Cysteine levels in plasma. (B) CSE and CBS activity in tissues. (C) MPST activity in tissues. (D,E) Representative Western blots and quantitative analysis for CSE, CBS, and MPST protein expression in heart tissues. (F) CSE, CBS, and MPST mRNA levels in heart tissues. (G) Plasma H2S levels in AOAA-treatment mice. (H) Plasma H2S levels in PPG-treatment mice. (I) Plasma H2S levels in CSE KO mice. Results are expressed as mean ± SEM. A P of <0.05 was considered significant.
After treatment with AOAA (a CBS inhibitor) for 14 days, H2S concentrations were significantly decreased either at 7 o’clock or 19 o’clock as compared with control group (Figure 2G). However, plasma H2S concentrations were still significantly higher at 19 o’clock than those at 7 o’clock. Similarly, after treatment with PPG (a CSE inhibitor) for 14 days, plasma H2S concentrations at 19 o’clock were still significantly higher than those at 7 o’clock, although they were significantly decreased at 19 o’clock as compared with controls (Figure 2H). In CSE KO mice, H2S concentrations were significantly decreased not only at 7 o’clock but also at 19 o’clock as compared with WT mice. However, plasma H2S concentrations were still significantly higher at 19 o’clock than those at 7 o’clock in CSE KO mice (Figure 2I).
MPST Activity Was Modulated by Plasma H2O2
As was shown in Figure 3A, the plasma H2O2 concentrations were significantly higher at 19 o’clock than those at 7 o’clock. To the contrary, H2O2 concentrations were significantly decreased at 19 o’clock than those at 7 o’clock when mice were exposed to continuous light for 24 h (Figure 3B). In addition, MPST activities in tissues (heart and liver) were also decreased at 19 o’clock after 24 h continuous light (Figure 3C).
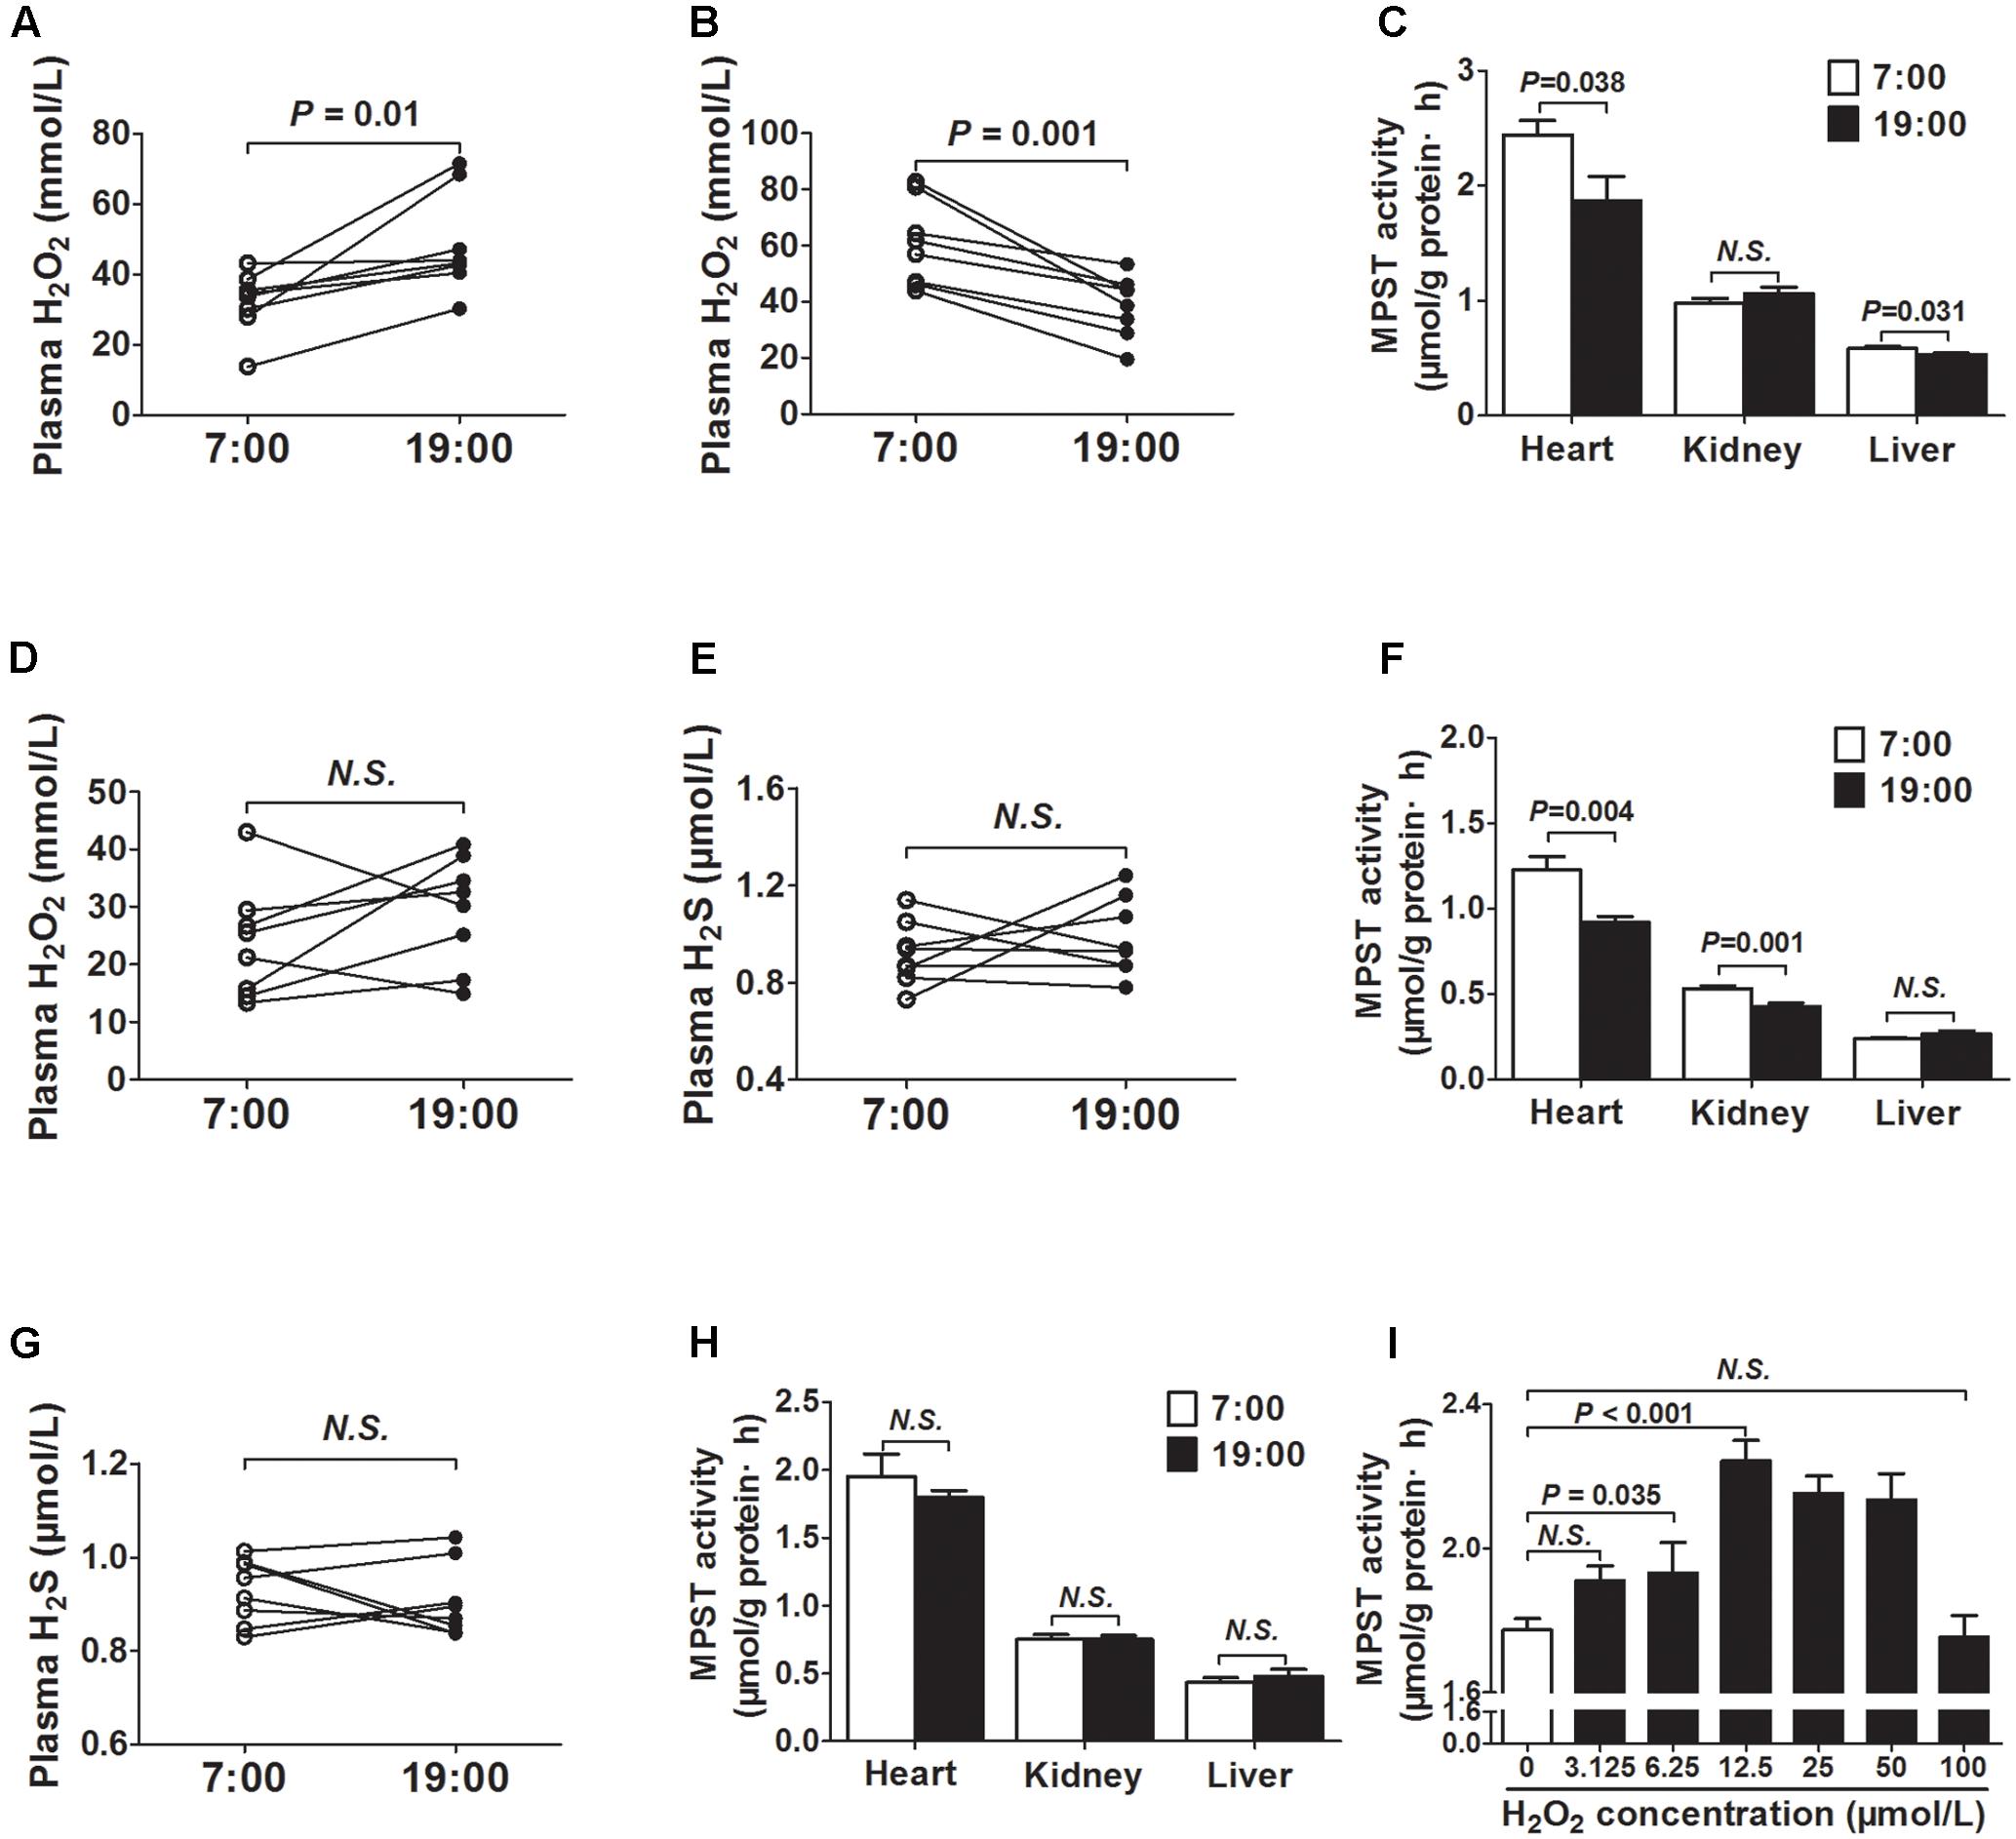
FIGURE 3. MPST activity was modulated by plasma H2O2. (A) H2O2 levels in plasma. (B) H2O2 levels in plasma from the same mice exposed to continuous light for 24 h. (C) MPST activity in tissues from the same mice exposed to continuous light for 24 h. (D) Plasma H2O2 levels in DTT-treatment mice. (E) Plasma H2S levels in DTT-treatment mice. (F) MPST activity in tissues from the DTT-treatment mice. (G) Plasma H2S levels in SOD2+/- mice. (H) MPST activity in tissues from SOD2+/- mice. (I) MPST activity in heart tissues incubated with increasing concentrations of H2O2 in vitro. Results are expressed as mean ± SEM. A P of <0.05 was considered significant.
To observe the effect of ROS on the generation of H2S, DTT, a thiol-reducing reagent, was also used as a reducer for 14 days to clean ROS. After DTT treatment, there was no significant difference in plasma H2O2 concentrations between 7 o’clock and 19 o’clock (Figure 3D). Meanwhile, the diurnal fluctuations of plasma H2S was disappeared (Figure 3E). MPST activities in tissues (heart and kidney) were also decreased at 19 o’clock after DTT treatment (Figure 3F). In SOD2+/- mice, the diurnal fluctuations of plasma H2S was also disappeared (Figure 3G). In addition, there was no significant difference in MPST activities of the tissues (heart, kidney, and liver) between 7 o’clock and 19 o’clock (Figure 3H).
Next, heart tissues incubated with increasing H2O2 concentrations were used to determine whether H2O2 could affect the activity of MPST in vitro. As was shown in Figure 3I, H2O2 could increase the activity of MPST within low concentrations.
Discussion
In the present study, we have focused on the diurnal fluctuations of plasma H2S levels and activities of its producing enzymes. There are two important findings: (1) plasma H2S concentrations exhibit diurnal fluctuations, which are higher at 19 o’clock than those at 7 o’clock; (2) changes of MPST activity which is modulated by plasma H2O2 concentrations probably lead to the diurnal fluctuations of plasma H2S.
In response to the changes of environment at 24-h rhythm of day and night, most species have evolved endogenous circadian clocks, which regulate the physiological and behavioral activities of the body. Current circadian models are based on transcription/translation feedback loops which clock genes regulate their own transcription and translation over approximately 24 h via a series of interacting negative feedback loops (Robles et al., 2017). In addition, to regulate their own levels of expression, clock genes serve as transcription factors for other genes which regulate a variety of functions, including cell metabolism, immune responses and redox homeostasis (Zhou et al., 2015; Zhu et al., 2017). Many ROS, by products of oxidative stress, antioxidants and enzymes oscillate with circadian rhythmicity (Wilking et al., 2013). Interestingly, we find that the plasma H2S, which is a relatively weak reductant and scavenges ROS to alleviate oxidative stress, are significantly higher at 19 o’clock than those at 7 o’clock which is not caused by the blood-collecting sequence in the present study.
The main H2S precursor is L-cysteine. The other sulfur-containing amino acid, L-methionine, is a precursor of L-homocysteine, which can be metabolized to cysteines. So, we assess whether the diurnal fluctuations of plasma H2S is caused by the differences in L-cysteine concentrations. Our results show that there was no significant difference in plasma L-cysteine concentrations between 7 o’clock and 19 o’clock. Recently, Tan et al. (2017) report that H2S can rapidly and reversibly bind to serum albumin with weaker affinity than that of warfarin. It is similar to many small molecules (such as fatty acids, hormones, and drugs), which are carried by albumin and distributed throughout the body. We also evaluate the concentration of plasma albumin and total proteins at 7 o’clock and 19 o’clock respectively, while there was no significant difference (Supplementary Figures 1, 2).
H2S is synthesized endogenously by three enzymes: CSE, CBS, and MPST. The decrease in the activities or expressions of H2S-producing enzymes leads to a decrease in H2S levels, which is associated with a variety of diseases (Cheng et al., 2016; Greaney et al., 2017). Neither mRNA nor protein of the three H2S-producing enzymes is altered at 7 o’clock and 19 o’clock, so we further measure the activities of the three enzymes. Our results show that the activities of MPST in tissues (heart, kidney, and liver) are significantly higher at 19 o’clock than those at 7 o’clock, while there are no significant differences in CSE and CBS. To confirm above results, PPG or AOAA is administrated for 14 days to inhibit the activities of CSE or CBS respectively. After inhibitors treatment, H2S concentrations are significantly decreased either at 7 o’clock or 19 o’clock as compared with control group, which is consistent with the previous observation (Roy et al., 2012; Liu et al., 2014). However, plasma H2S concentrations are still significantly higher at 19 o’clock than those at 7 o’clock, which is also observed in CSE KO mice. It suggests that the diurnal fluctuations of plasma H2S is induced by the changes of MPST activity. Most of the time, the circadian timing system is synchronized by a light stimulus. In photoreceptor cells, the production of H2S by MPST is regulated by the levels of its substrate 3-mercaptopyfuvate (3MP), which is produced by cysteine aminotransferase (CAT) whose activity is suppressed by Ca2+. In brightness, the voltage-gated Ca2+ channels are closed, and the intracellular concentrations of Ca2+ in photoreceptor cells are reduced to less than 10 nM, while in darkness, Ca2+ ions enter the photoreceptor cells, and the intracellular concentrations of Ca2+ reach ∼600 nM. Therefore, the light exposure can regulate H2S production by affecting the intracellular concentrations of Ca2+ in the retina (Mikami et al., 2011). In order to investigate whether the activity of MPST is regulated by the light, mice are exposed to continuous light for 24 h. We find that the diurnal fluctuations of plasma H2S is disappeared and MPST activities in tissues are also decreased at 19 o’clock after 24 h continuous light. It suggests light regulate the activity of MPST which induce the diurnal variation of plasma H2S. However, what is the exact mechanism?
Light, the strongest zeitgeber, can generate H2O2 to regulate the expression of the clock genes and in turn initiate synchronization of rhythms in the zebrafish (Hirayama et al., 2007). However, in the present study, the plasma H2O2 concentration is significantly higher at 19 o’clock than those at 7 o’clock, while it is significantly decreased at 19 o’clock than those at 7 o’clock when mice were exposed to continuous light for 24 h. The above differences may be due to the different responses to light between nocturnal and diurnal animals. In subsequent experiments, we use DTT, a reductant, to clean ROS. After DTT treatment, there is no significant difference in plasma H2O2 concentrations between 7 o’clock and 19 o’clock. Meanwhile, the diurnal fluctuations of plasma H2S is disappeared. MPST activities in tissues are also decreased at 19 o’clock. In SOD2+/- mice which exhibit persistent oxidative stress conditions (Roos et al., 2013), the diurnal fluctuations of plasma H2S and MPST activity are also disappeared. Our results indicate that the diurnal fluctuations of plasma H2S and MPST activity are consistent with the diurnal fluctuations of plasma H2O2. These are congruent with Lin et al. (2013) who find H2S production is dependent on NADPH oxidase-derived H2O2. It has been proposed that a medium concentration H2O2 can upregulate the expression of the CSE gene in the mammalian cells (Wang et al., 2012). However, there are no significant differences in protein or mRNA expression of the CSE, CBS, or MPST in our studies. Meanwhile, there are also no significant differences activities of CSE and CBS after different treatment (Supplementary Figures 3–5). It suggests that H2O2 should regulate the activity of MPST. MPST possesses two redox-sensing molecular switches, including a catalytic-site cysteine and an intersubunit disulfide bond, which contributes to redox-dependent regulation of MPST activity (Nagahara, 2013). It has been reported that the redox-sensing molecular switches are easily oxidized by excess molar of specific oxidant, resulting in loss of activity (Nagahara and Katayama, 2005). H2O2 also can concentration-dependently inhibit H2S production in mitochondria isolated from cultured murine hepatoma cells (Módis et al., 2013). In our studies increasing concentrations of H2O2 are incubated with heart tissue to determine whether H2O2 can affect the activity of MPST in vitro. As shown in the results, low dose of H2O2 can increase the activity of MPST, while high dose of H2O2 can inhibit the activity of MPST. These conflicting findings may be due to the different responses of different organs and different cell types. These questions as well as the actual molecular regulation of MPST need to be further investigated.
Conclusion
Our studies reveal that plasma H2S concentration and tissue MPST activity exhibit diurnal fluctuations. Modulated by plasma H2O2 concentration, changes of MPST activity probably lead to the diurnal fluctuations of plasma H2S.
Author Contributions
SJ, BT, and YW designed and performed experiments, developed methods, analyzed data and contributed to writing the manuscript. XT and DT designed and performed mouse tissue experiments to generate samples for analysis. RM and XJ performed mouse plasma H2S analysis. LX and HX performed western blot and qPCR experiments. QG and XD contributed to writing the manuscript.
Funding
This study was supported by the National Natural Science Foundation of China (Grant nos. 31171098, 31671185, and 81402917), the Specialized Research Fund for the Doctoral Program of Higher Education of China (Grant no. 20121323110008), the Hebei Province for Innovation Talents Support Plan (Grant no. LJRC017), the Natural Science Foundation of Hebei Province of China (Grant no. H2017206269), and the office of Education Foundation of Hebei Province of China (Grant no. QN2016144).
Conflict of Interest Statement
The authors declare that the research was conducted in the absence of any commercial or financial relationships that could be construed as a potential conflict of interest.
Acknowledgments
The authors would like to thank Professor Yichun Zhu (Fudan University, Shanghai, China) for kindly providing the CSE and SOD2 heterozygote mice.
Supplementary Material
The Supplementary Material for this article can be found online at: https://www.frontiersin.org/articles/10.3389/fphar.2017.00682/full#supplementary-material
Abbreviations
AOAA, amino-oxyacetate; CBS, cystathionine β-synthase; CSE, cystathionine-γ-lyase; CSE KO mice, CSE knockout mice; DTT, dithiothreitol; H2O2, hydrogen peroxide; H2S, hydrogen sulfide; MBB, monobromobimane; MPST, 3-mercaptopyruvate sulfurtransferase; PPG, DL-propargylglycine; SOD2+/-mice, superoxide dismutase 2 heterozygote mice; ROS, reactive oxygen species; WT mice, wild-type mice.
References
Abe, K., and Kimura, H. (1996). The possible role of hydrogen sulfide as an endogenous neuromodulator. J. Neurosci. 16, 1066–1071.
Chen, W., Liu, Z., Li, T., Zhang, R., Xue, Y., Zhong, Y., et al. (2014). Regulation of Drosophila circadian rhythms by miRNA let-7 is mediated by a regulatory cycle. Nat. Commun. 5, 5549. doi: 10.1038/ncomms6549
Cheng, Z., Garikipati, V. N., Nickoloff, E., Wang, C., Polhemus, D. J., Zhou, J., et al. (2016). Restoration of hydrogen sulfide production in diabetic mice improves reparative function of bone marrow cells. Circulation 134, 1467–1483. doi: 10.1161/CIRCULATIONAHA.116.022967
DeBruyne, J. P., Baggs, J. E., Sato, T. K., and Hogenesch, J. B. (2015). Ubiquitin ligase Siah2 regulates RevErbα degradation and the mammalian circadian clock. Proc. Natl. Acad. Sci. U.S.A. 112, 12420–12425. doi: 10.1073/pnas.1501204112
Deepmala, J., Deepak, M., Srivastav, S., Sangeeta, S., Kumar, S. A., and Kumar, S. S. (2013). Protective effect of combined therapy with dithiothreitol, zinc and selenium protects acute mercury induced oxidative injury in rats. J. Trace Elem. Med. Biol. 27, 249–256. doi: 10.1016/j.jtemb.2012.12.003
Greaney, J. L., Kutz, J. L., Shank, S. W., Jandu, S., Santhanam, L., and Alexander, L. M. (2017). Impaired hydrogen sulfide-Mediated vasodilation contributes to microvascular endothelial dysfunction in hypertensive adults. Hypertension 69, 902–909. doi: 10.1161/HYPERTENSIONAHA.116.08964
Hirano, A., Fu, Y. H., and Ptáček, L. J. (2016). The intricate dance of post-translational modifications in the rhythm of life. Nat. Struct. Mol. Biol. 23, 1053–1060. doi: 10.1038/nsmb.3326
Hirayama, J., Cho, S., and Sassone-Corsi, P. (2007). Circadian control by the reduction/oxidation pathway: catalase represses light-dependent clock gene expression in the zebrafish. Proc. Natl. Acad. Sci. U.S.A. 104, 15747–15752. doi: 10.1073/pnas.0705614104
Kimura, H. (2014). The physiological role of hydrogen sulfide and beyond. Nitric Oxide 41, 4–10. doi: 10.1016/j.niox.2014.01.002
Kimura, Y., and Kimura, H. (2004). Hydrogen sulfide protects neurons from oxidative stress. FASEB J. 18, 1165–1167. doi: 10.1096/fj.04-1815fje
Kimura, Y., Toyofuku, Y., Koike, S., Shibuya, N., Nagahara, N., Lefer, D., et al. (2015). Identification of H2S3 and H2S produced by 3-mercaptopyruvate sulfurtransferase in the brain. Sci. Rep. 5:14774. doi: 10.1038/srep14774
Leone, V., Gibbons, S. M., Martinez, K., Hutchison, A. L., Huang, E. Y., Cham, C. M., et al. (2015). Effects of diurnal variation of gut microbes and high-fat feeding on host circadian clock function and metabolism. Cell Host Microbe 17, 681–689. doi: 10.1016/j.chom.2015.03.006
Lin, V. S., Lippert, A. R., and Chang, C. J. (2013). Cell-trappable fluorescent probes for endogenous hydrogen sulfide signaling and imaging H2O2-dependent H2S production. Proc. Natl. Acad. Sci. U.S.A. 110, 7131–7135. doi: 10.1073/pnas.1302193110
Liu, F., Chen, D. D., Sun, X., Xie, H. H., Yuan, H., Jia, W., et al. (2014). Hydrogen sulfide improves wound healing via restoration of endothelial progenitor cell functions and activation of angiopoietin-1 in type 2 diabetes. Diabetes Metab. Res. Rev. 63, 1763–1778. doi: 10.2337/db13-0483
Mikami, Y., Shibuya, N., Kimura, Y., Nagahara, N., Yamada, M., and Kimura, H. (2011). Hydrogen sulfide protects the retina from light-induced degeneration by the modulation of Ca2+ influx. J. Biol. Chem. 286, 39379–39386. doi: 10.1074/jbc.M111.298208
Módis, K., Asimakopoulou, A., Coletta, C., Papapetropoulos, A., and Szabo, C. (2013). Oxidative stress suppresses the cellular bioenergetic effect of the 3-mercaptopyruvate sulfurtransferase/hydrogen sulfide pathway. Biochem. Biophys. Res. Commun. 433, 401–407. doi: 10.1016/j.bbrc.2013.02.131
Nagahara, N. (2013). Regulation of mercaptopyruvate sulfurtransferase activity via intrasubunit and intersubunit redox-sensing switches. Antioxid. Redox Signal. 19, 1792–1802. doi: 10.1089/ars.2012.5031
Nagahara, N., and Katayama, A. (2005). Post-translational regulation of mercaptopyruvate sulfurtransferase via a low redox potential cysteine-sulfenate in the maintenance of redox homeostasis. J. Biol. Chem. 280, 34569–34576. doi: 10.1074/jbc.M505643200
Panda, S. (2016). Circadian physiology of metabolism. Science 354, 1008–1015. doi: 10.1126/science.aah4967
Pekovic-Vaughan, V., Gibbs, J., Yoshitane, H., Yang, N., Pathiranage, D., Guo, B., et al. (2014). The circadian clock regulates rhythmic activation of the NRF2/glutathione- mediated antioxidant defense pathway to modulate pulmonary fibrosis. Genes Dev. 28, 548–560. doi: 10.1101/gad.237081.113
Robles, M. S., Humphrey, S. J., and Mann, M. (2017). Phosphorylation is a central mechanism for circadian control of metabolism and physiology. Cell Metab. 25, 118–127. doi: 10.1016/j.cmet.2016.10.004
Roos, C. M., Hagler, M., Zhang, B., Oehler, E. A., Arghami, A., and Miller, J. D. (2013). Transcriptional and phenotypic changes in aorta and aortic valve with aging and MnSOD deficiency in mice. Am. J. Physiol. Heart Circ. Physiol. 305, H1428–H1439. doi: 10.1152/ajpheart.00735.2012
Roy, A., Khan, A. H., Islam, M. T., Prieto, M. C., and Majid, D. S. (2012). Interdependency of cystathione γ-lyase and cystathione β-synthase in hydrogen sulfide-induced blood pressure regulation in rats. Am. J. Hypertens. 25, 74–81. doi: 10.1038/ajh.2011.149
Schmalen, I., Reischl, S., Wallach, T., Klemz, R., Grudziecki, A., Prabu, J. R., et al. (2014). Interaction of circadian clock proteins CRY1 and PER2 is modulated by zinc binding and disulfide bond formation. Cell 157, 1203–1215. doi: 10.1016/j.cell.2014.03.057
Shang, Z., Lu, C., Chen, S., Hua, L., and Qian, R. (2012). Effect of H2S on the circadian rhythm of mouse hepatocytes. Lipids Health Dis. 11:23. doi: 10.1186/1476-511X-11-23
Shibuya, N., Tanaka, M., Yoshida, M., Ogasawara, Y., Togawa, T., Ishii, K., et al. (2009). 3-Mercaptopyruvate sulfurtransferase produces hydrogen sulfide and bound sulfane sulfur in the brain. Antioxid. Redox Signal. 11, 703–714. doi: 10.1089/ars.2008.2253
Tan, B., Jin, S., Sun, J., Gu, Z., Sun, X., Zhu, Y., et al. (2017). New method for quantification of gasotransmitter hydrogen sulfide in biological matrices by LC-MS/MS. Sci. Rep. 7:46278. doi: 10.1038/srep46278
Tao, B. B., Liu, S. Y., Zhang, C. C., Fu, W., Cai, W. J., Wang, Y., et al. (2013). VEGFR2 functions as an H2S-targeting receptor protein kinase with its novel Cys1045-Cys1024 disulfide bond serving as a specific molecular switch for hydrogen sulfide actions in vascular endothelial cells. Antioxid. Redox Signal. 19, 448–464. doi: 10.1089/ars.2012.4565
Wang, M., Guo, Z., and Wang, S. (2012). Cystathionine gamma-lyase expression is regulated by exogenous hydrogen peroxide in the mammalian cells. Gene Expr. 15, 235–241. doi: 10.3727/105221613X13571653093286
Wilking, M., Ndiaye, M., Mukhtar, H., and Ahmad, N. (2013). Circadian rhythm connections to oxidative stress: implications for human health. Antioxid. Redox Signal. 19, 192–208. doi: 10.1089/ars.2012.4889
Xu, S., Liu, Z., and Liu, P. (2014). Targeting hydrogen sulfide as a promising therapeutic strategy for atherosclerosis. Int. J. Cardiol. 172, 313–317. doi: 10.1016/j.ijcard.2014.01.068
Yang, G., Wu, L., Jiang, B., Yang, W., Qi, J., Cao, K., et al. (2008). H2S as a physiologic vasorelaxant: hypertension in mice with deletion of cystathionine gamma-lyase. Science 322, 587–590. doi: 10.1126/science.1162667
Yuan, M., Breitkopf, S. B., Yang, X., and Asara, J. M. (2012). A positive/negative ion-switching, targeted mass spectrometry-based metabolomics platform for bodily fluids, cells, and fresh and fixed tissue. Nat. Protoc. 7, 872–881. doi: 10.1038/nprot.2012.024
Zhou, M., Wang, W., Karapetyan, S., Mwimba, M., Marqués, J., Buchler, N. E., et al. (2015). Redox rhythm reinforces the circadian clock to gate immune response. Nature 523, 472–476. doi: 10.1038/nature14449
Keywords: hydrogen sulfide, diurnal fluctuations, hydrogen peroxide, 3-mercaptopyruvate sulfurtransferase, oxidative stress
Citation: Jin S, Tan B, Teng X, Meng R, Jiao X, Tian D, Xiao L, Xue H, Guo Q, Duan X and Wu Y (2017) Diurnal Fluctuations in Plasma Hydrogen Sulfide of the Mice. Front. Pharmacol. 8:682. doi: 10.3389/fphar.2017.00682
Received: 29 June 2017; Accepted: 12 September 2017;
Published: 06 October 2017.
Edited by:
Jinsong Bian, National University of Singapore, SingaporeReviewed by:
Hideo Kimura, National Center of Neurology and Psychiatry, JapanXiaotian Sun, Huashan Hospital Affiliated to Fudan University, China
Copyright © 2017 Jin, Tan, Teng, Meng, Jiao, Tian, Xiao, Xue, Guo, Duan and Wu. This is an open-access article distributed under the terms of the Creative Commons Attribution License (CC BY). The use, distribution or reproduction in other forums is permitted, provided the original author(s) or licensor are credited and that the original publication in this journal is cited, in accordance with accepted academic practice. No use, distribution or reproduction is permitted which does not comply with these terms.
*Correspondence: Yuming Wu, wuyum@yahoo.com
†These authors have contributed equally to this work.