 Vanessa Gonzalez-Covarrubias1*
 Javier Urena-Carrion1Beatriz Villegas-Torres1J. Eduardo Cossío-Aranda2Sergio Trevethan-Cravioto2Raul Izaguirre-Avila2O. Javier Fiscal-López2Xavier Soberon1
- 1Instituto Nacional de Medicina Genomica, Mexico City, Mexico
- 2Instituto Nacional de Cardiologia, Mexico City, Mexico
Coumarins are widely prescribed worldwide, and in Mexico acenocumarol is the preferred form. It is well known that despite its efficacy, coumarins show a high variability for dose requirements. We investigated the pharmacogenetic variation of 110 genes in patients receiving acenocumarol using a targeted NGS approach. We report relevant population differentiation for variants on CYP2C8, CYP2C19, CYP4F11, CYP4F2, PROS, and GGCX, VKORC1, CYP2C18, NQO1. A higher proportion of novel-to-known variants for 10 genes was identified on 41 core pharmacogenomics genes related to the PK (29), PD (3), of coumarins, and coagulation proteins (9) including, CYP1A1, CYP3A4, CYP3A5, and F8, and a low proportion of novel-to-known variants on CYP2E1, VKORC1, and SULT1A1/2. Using a Bayesian approach, we identified variants influencing acenocumarol dosing on, VKORC1 (2), SULT1A1 (1), and CYP2D8P (1) explaining 40–55% of dose variability. A collection of pharmacogenetic variation on 110 genes related to the PK/PD of coumarins is also presented. Our results offer an initial insight into the use of a targeted NGS approach in the pharmacogenomics of coumarins in Mexican Mestizos.
Introduction
Anticoagulants such as warfarin, acenocumarol, and phenprocoumon act as inhibitors of vitamin K reducing enzymes, which regenerate vitamin K, a cofactor for several clotting proteins. Acenocumarol is the coumarin of choice in Europe and Latin America (Ufer, 2005). The heterogeneity in coumarins efficacy, safety, and dosing has been partly explained by clinical, demographic, and genetic parameters. Several polymorphisms on CYP2C9, VKORC1, and CYP4F2 can account for about 40–50% on coumarin dose differences (Scott et al., 2014). However, most studies have been performed for warfarin and in populations other than Mexican. Acenocumarol (4-nitrowarfarin) is the most commonly prescribed oral coumarin in the public health care system in Mexico. In contrast to warfarin, the more potent isomer, S-acenocumarol, is rapidly eliminated and the drug's therapeutic effect is most likely due to R-acenocumarol. The R isomer is metabolized by several members of the cytochrome P-450 family including, CYP2C9, CYP2C19, CYP2C8, CYP2C18, CYP3A4, CYP1A1, and CYP1A2 (Tassies et al., 2002; Ufer, 2005). Hence, genetic variation on genes coding for these proteins should putatively influence acenocumarol dosing.
The collection of pharmacogenetic variation in Mexican populations is still scarce (Fricke-Galindo et al., 2016). Reports indicate that some of the actionable markers on VKORC1 and UGT1A1 present significant population differences (Bonifaz-Peña et al., 2014), suggesting the existence of variants with distinctive allele frequency in these populations potentially influencing drug response.
Endeavors are currently ongoing to amass a more comprehensive picture of the pharmacogenetic variation in Mexican Mestizos. Here, we investigated genetic variation in over 100 genes by targeted NGS in patients receiving acenocumarol, including genes involved in general pharmacokinetics and pharmacodynamics, vitamin K recycling, and coagulation proteins, these latter also potentially affecting acenocumarol response (Allan et al., 2005; Harrington et al., 2008; Carcao et al., 2015; Tong et al., 2016). Clinical and genetic data were used to develop an algorithm to explain dose variability in this group of patients.
Genomic data analyses provided with a collection of pharmacogenetic variation for this population. This approach hints to toward the consideration of multiple variants to assess acenocumarol dosing for an individualized dose assessment.
Materials and Methods
Participants and DNA extraction. The National Institute of Cardiology in Mexico City prescribes acenocumarol on a regular basis mostly after stroke, stent implants, or for thrombosis. A hundred and fifty patients treated with acenocumarol between 2006 and 2010 were surveyed and monitored for acenocumarol efficacy through at least three consecutive INR measurements. Of these, 103 blood samples were available for DNA extraction using the DNeasy Blood & Tissue kit (Qiagen, Valencia CA, USA) from a routine blood sample in EDTA-Vacutainer collection tubes, sample characteristics are depicted in Table 1. All participants gave written informed consent according with the Declaration of Helsinki. The project was reviewed and approved by The Research and Ethics Committees at The National Institute of Cardiology and The National Institute of Genomic Medicine (INMEGEN) Mexico City, project approval 25/2016/I.
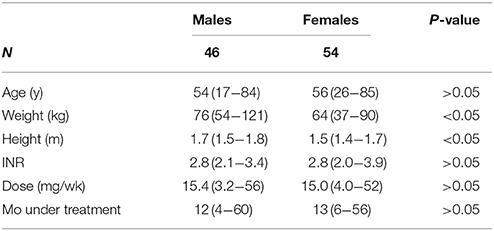
Table 1. Patient demographics.
Next Generation Sequencing
We investigated coding, 25 bp of adjacent introns, and 5′ and 3′ UTR regions of 110 genes related to general pharmacogenomics including core pharmacokinetics and pharmacodynamics targets in 100 DNA samples. We selected these genes according to the general PGx and the PK/PD of acenocumarol by searching the available literature using the keywords, pharmacogenetics, pharmacogenomics, acenocumarol, coumarin pharmacokinetics, and pharmacodynamics (van Leeuwen et al., 2008; Soria et al., 2009; Whirl-Carrillo et al., 2012; Tong et al., 2016). Regions of interest were captured using a Haloplex custom Target Enrichment System (Agilent Technologies, Santa Clara, CA, USA) defined for 150 × 2 paired-end reads, in a panel size of 1.1Mbp. In addition, we included a set of 360 ancestry informative markers (AIMS) to assess genetic admixture using SNPs from the HapMap database for CEU and YRI populations, and Natives from Mexico (Galanter et al., 2012). Sequencing libraries were generated according to the manufacturer's protocol (version D.5, May 2013). Briefly, all 100 DNA samples (225 ng) were digested with 8-paired restriction enzymes, fragmentation pattern was analyzed in a 2100 Biolanalyzer (Agilent Technologies). DNA fragments were hybridized with the Haloplex synthetic probes, adapters were ligated followed by PCR amplification for library enrichment. Library quality for fragment size and molarity was also performed using 2100 Biolanalyzer information. Samples were pooled and sequenced in a Genome Analyzer II (Illumina, San Diego, CA, USA) according to the manufacturer's instructions. Targeted genes are listed in Supplemental Table ST1.
Bioinformatic and Statistical Analyses
Sequence reads were processed according to the Broad Institute recommended best practices workflow and the Genome Analysis ToolKit (GATK) (Acland et al., 2013; Van der Auwera et al., 2013). Briefly, paired-end reads were trimmed to remove adapters and low quality regions using Trimmomatic (Bolger et al., 2014), reads with an average Q ≤ 30 were discarded, followed by elimination of reads shorter than 36 nucleotides. Mapping and alignment of sequencing reads were performed with BWA, Samtools, and Picard using the hg19 human genome reference (dbSNP build 137) (McKenna et al., 2010). Base quality score calibration and single nucleotide variant (SNV) calling were assessed using GATK v3.3. Variants were confirmed visually in the integrative genomic viewer, IGV (Robinson et al., 2011), and their functional impact was annotated using SnpEff, and ranked as low, moderate, modifier, or high (Sherry et al., 2001; Cingolani et al., 2012; Exome Variant Server1).
The data analysis toolset, PLINK was used to determine descriptive statistics, allele frequencies, Hardy-Weinberg, and population differentiation, this latter was assessed by determining the measure of genetic variance in this subpopulation relative to population variance in other continental groups using the FST statistic. A threshold value of P < 0.05 after FDR was considered as statistically significant (Purcell et al., 2007).
Pharmacogenetic Model
We utilized a Bayesian statistical approach to incorporate genetic variants to an algorithm for acenocumarol dose estimation (Sebastiani et al., 2009; Chen et al., 2012). The rejection of the null hypothesis (lack of association between acenocumarol dose and genetic variants) was based on probabilities of stochastic computations of Markov Chain Monte Carlo methods (MCMC). Also, we tested the association between dose and all SNV alone or in combination including those previously identified via single-SNP analysis (P > 0.05, FDR). We considered 4614 SNPs and 815 variant interactions for model development. This strategy allows for the identification of independent genetic variants or those that depend on each to influence dose variation. Variants were considered with a MAF <0.95 and >0.05, and interactions between variants within the same gene with frequencies <0.9 and >0.10, i.e., that two or more variants in a gene may have adding or balancing effects on the dose. First, we used a Bayesian Generalized Linear model for variable selection to obtain the posterior probability of a gene variant affecting acenocumarol dose, then we used Bayes Factors, a form of Bayesian hypothesis tests, to prioritize a set of models, and then we evaluated the selected models through Deviance Information Criterion (DIC), a measure of model selection related to AIC and BIC criteria, commonly used in Bayesian hierarchical models. Briefly, for the former, we used a gamma likelihood function with logarithmic link function, variance τ and mean conforming to Equation (1), where v1, j and v2, j represent binary variables for each genotype of a SNPj, refers to interactions between variants, G is a set of genes g, and ng the number of SNPs in g; vr,jg represents genotype r of SNP j in gene g, and represents the effect size of genotypes vr1, jg and vr2, kg; Ij and Ij,k are binary variables for the inclusion or exclusion of SNPs and SNP interactions, and xi and αi represent m non-genetic covariates including age, sex, BMI, and height.
Where, τ ~ Gamma (λ, κ), , , , , Ij ~ Bernoulli(π), Ijg, kg ~ Bernoulli(π), π ~ U(a, b), and
Next, we standardized clinical variables for mean zero and unitary variance, and using JAGS 4.1.0 and R 3.2,0 we obtained MCMC from the posterior distribution. We ran five chains of 110,000 iterations each, including a burn-in period of 10,000 iterations and random initial values, convergence was verified via the Gelman-Rubin statistic , followed by a series of Bayes Factors to condition on the presence or absence of variants, branching them into a decision tree, as part of the pharmacogenetic model development. Further details on the model development were included in Supplemental Table ST2.
Results
Demographic characteristics stratified by sex are presented in Table 1. Bioinformatic analyses revealed 5108 variants in 110 genes in 100 DNA samples with an average depth of 250x and >98% coverage, but a wide range was registered depending on the gene (30x−600x, 80–100%). These 110 genes represent less than 1% of the coding genome, approximately 25% of a pharmacogenome, more than half of the Coriell reference list for pharmacogenomics, and include >20% of actionable pharmacogenetic markers listed by CPIC (Pratt et al., 2010; Relling and Klein, 2011). After quality control, variant calling, and annotation, 4290 SNVs were utilized for statistical analyses (ST3). There was a complete agreement between genotypes of variants assessed by NGS and allele discrimination performed for CYP2C9*2,*3, and *5, CYP4F2 rs2108622, and VKORC1 rs9934438. Admixture analysis with 314 ancestry informative markers showed an average population structure of 50–92% Mexican Native and 6–54% Caucasian (CEU), all individuals showed less than 5% of Sub-Saharan African (YRI) admixture.
Of these 4290 SNVs, 28% have not been reported before (1237 without an rs identifier) and 274 of these novel variants had a minor allele frequency (MAF>1%). On average, each individual showed 908 SNVs, 534 heterozygous and 374 homozygous, of which 258 were present per individual (Table 2). Four-hundred and seven variants in 65 genes did not suffice the equilibrium of Hardy-Weinberg (9.8%, Supplemental Table ST4).
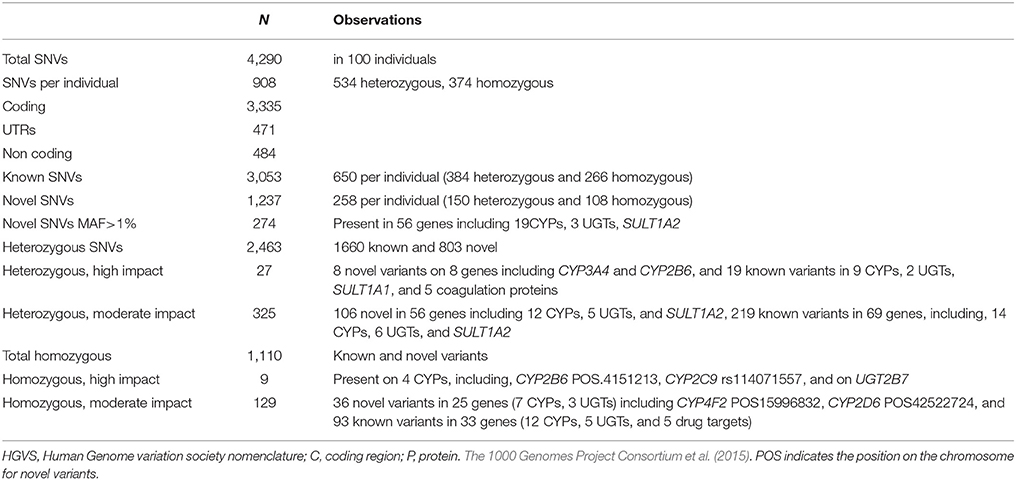
Table 2. Summary of NGS genetic variation.
Variants were classified by SNPEff according to their to their in-silico functional impact as high, moderate, modifier, or low (Cingolani et al., 2012). We listed a total of 36 known SNVs (27 heterozygous and 9 homozygous) with a high functional impact (Table 2 and ST3). These resequencing descriptive statistics seem to compare to other reports (Waldron, 2016).
Pharmacogenetic Variation
The FST statistic was assessed to evaluate genetic differentiation between Mexican Mestizos and three major continental populations, Chinese Han from Beijing (CHB), Yoruba from Ibadan, Nigeria (YRI), and Europeans from Utah, USA (CEU) utilizing the 1000 genomes database. YRI showed the largest differentiation with 377 variants with a FST value above 0.25, followed by CEU (51 variants with FST > 0.25), and CHB (32 variants with FST > 0.25, ST5). FST >0.25 values were identified for variants on several genes related to the coagulation cascade or coumarin metabolism. For example, when comparing to Caucasians we found high population differentiation for variants on CYP2C8, CYP2C19, CYP4F11, CYP4F2, PROS, and GGCX. Comparing to CHB, differences arose on CYP2C8, VKORC1, 2C18, NQO1, and for YRI differences were observed on major CYPs, FMOs, F13B, F8, PROS, and SERPINA10 among others (ST5). Allele frequency comparisons between Mexicans from the 1000 genome project (MXL) and those in this study showed similar FST values for most variants, except for CYP2C18 rs2281889, CYP2C8 rs1891071, CYP4F2 rs309319, and CYP4F11 rs11086013, for which we observed FST values between 0.15 and 0.33.
We analyzed allele frequency variation for 30 major pharmacogenes and 10 genes related to the coagulation cascade. The largest number of variants per gene was observed on SULT1A1, CYP2E1, CYP1B1, CYP3A4, CYP3A5, F5, and F11. Interestingly, CYP1A2, CYP3A4, CYP3A5, CYP1A6, F11, F13B, and F8 showed a large proportion of novel variants compared to known variants. Genes with significantly fewer variants were, CYP1A3, CYP1A5, CYP1A9, and F9, the three former did not show any novel variants (ST3). Next, we assessed the presence of known and novel variant considering a MAF >5% and a predicted functional impact as high or moderate in these genes. For known variants, we list 7 with a high predicted functional impact, 2 on UGTs and one on SULT1A1, CYP2C9, CYP2C19, and CYP2C8 (Table 3).
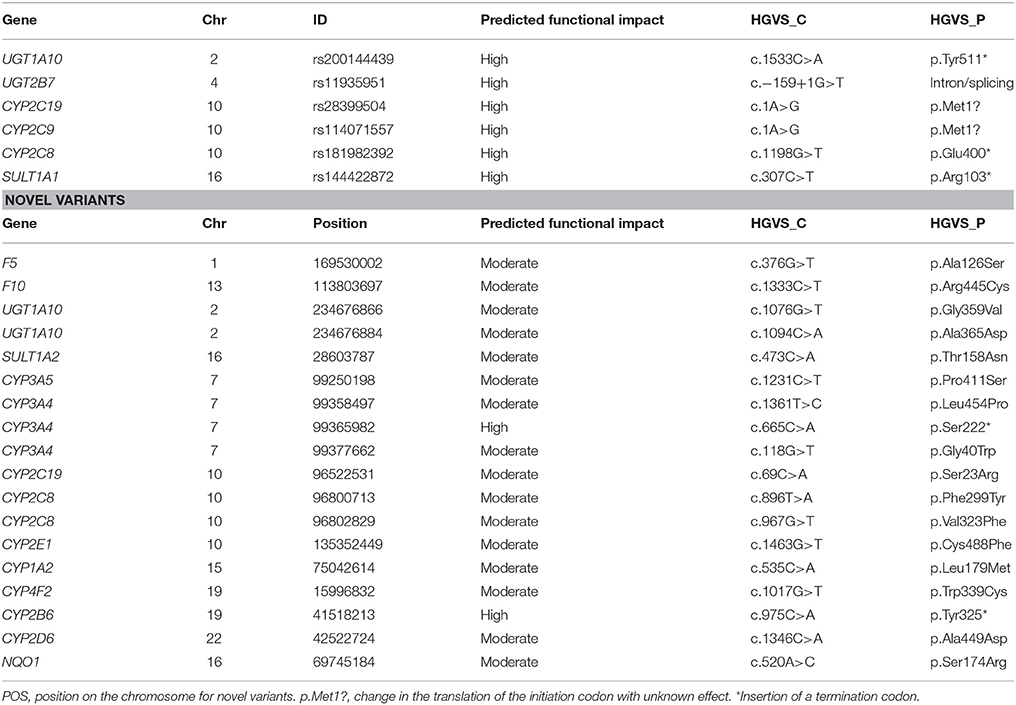
Table 3. Novel and known variants on relevant pharmacogenes at MAF > 5%.
Novel variants were observed on 37 of these 40 genes in counts from 1 on UGT1A1, to 23 on CYP3A5, 25 in F5, and 26 in F8. Of these, 2 showed a high functional impact predicting a stop codon on CYP3A4 and CYP2B6, a moderate impact was reported for 16 variants on 14 genes (Table 3). The proportion of novel-to-known variants and its functional impact for these pharmacogenes is represented in Figure 1.
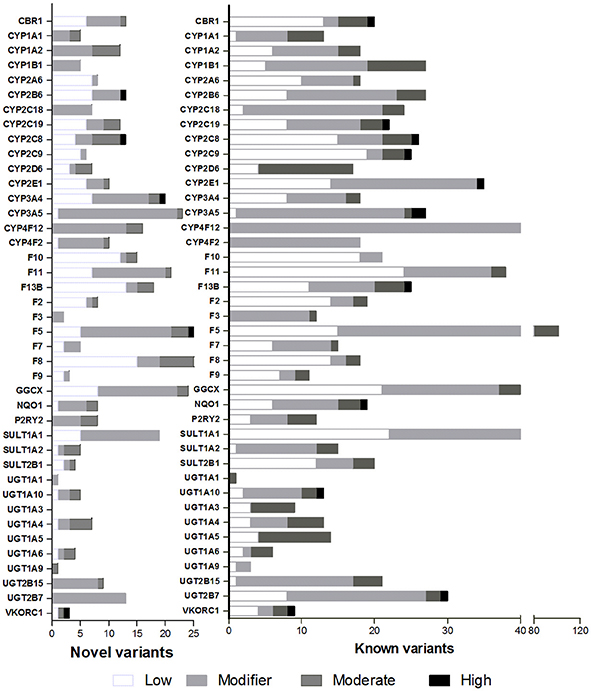
Figure 1. Proportion of novel and known variants. Functional impact determined in-silico is depicted in white for low impact, light gray for modifier, dark gray for moderate impact, and black for high impact.
Acenocumarol Pharmacogenetic Model
We developed a pharmacogenomic model to predict acenocumarol dose, using a Bayesian approach that included all SNP variants and the interaction among those on the same gene. We fitted the Bayesian GLM through five MCMC chains where genetic variants were prioritized by their posterior inclusion probability. The higher the posterior probability of a variant, the larger its influence on dose. Figure 2 shows a hierarchical tree indicating an ordered relevance of variants from VKORC1, CYP2D8P, and SULT1A1, followed by those on CYP4F12, F13B, and F8, Values of posterior probability for all variants are listed in ST7 and ST8.
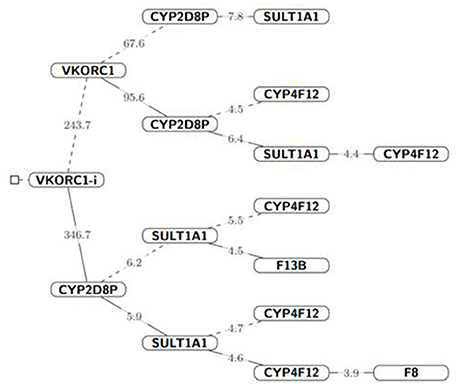
Figure 2. Hierarchical tree of variants influencing acenocoumarol dose. The parent node (solid lines) represent gene variants from which other variants depend for acenocouumaorl dose estimation, i.e., all probability statement in that branch are conditioned to the probabilistic event of the parent node (gene) Iparent = 1, dashed lines indicate that the parent node was conditioned to zero, Iparent = 0. The number on each line represents the Bayes Factor for the following branched off node; given the cut-off values. For visualization purposes, we did not condition on CYP2D8P, which was strongly associated with high-dose values (≥40 mg/wk) in 3 of the 6 patients receiving high doses. Nevertheless, both frequentist and Bayesian hypothesis testing suggested a strong association to coumarin dose for this variant (P-value < 0.05 and Bayes Factor > 100, respectively).
The dosing algorithm accounted for age, sex, weight, and height. The interaction between VKORC1 variants rs8050894 and rs9934438 which are in LD (R = 0.492), showed the highest posterior inclusion probability (mean, 0.96), followed by a novel variant, on CYP2D8P (POS42547668), and variants on SULT1A1 rs11648192, and CYP2C8 rs1058932, and rs2275620. Unfortunately, pharmacogenetic variant VKORC1 rs9923231 did not pass NGS quality controls thus, it was not modeled, but it is in complete LD with rs9934438, which was included in these analyses (Rieder et al., 2005).
Final model evaluation, we used R to implement the series of Bayes Factors as described in Supplemental Table ST2 with a cut-off value, cj = 3+mj, where mj is the number of variants conditioned to be absent from the model, and 3 as a minimum cut-off value based on Harold Jeffrey scale of interpretation for Bayes Factors (Baldi and Long, 2001). We selected two models according to the lowest DIC values, the first one included SNVs interactions, VKORC1 rs8050894 and rs9934438 and variants on SULT1A1 and CYP2D8P (ST7). The second model excluded variant interactions. Modeled variants and clinical parameters (age, sex, weight, and height) explain up-to 55.9% of dose variation for this study group. Values of high density intervals (HDI) are presented considering for 95% posterior probability (ST7 and ST8). The addition of additional variants to the model increased DIC values significantly which translates into a decreasing impact on acenocumarol dose (Table 4).
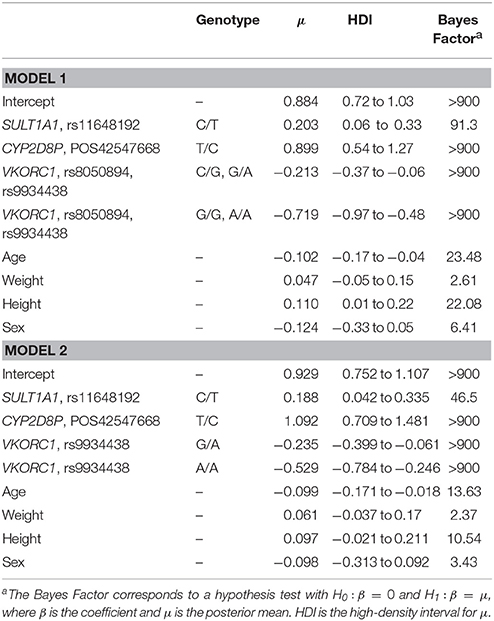
Table 4. Pharmacogenomic model parameters.
Pharmacogenetic Model Considering Variant Interactions
Ln Dose = −0.6935–0.0071*age (y) + 0.0035*weight (kg) – 0.1136 (if male) + 1.0709*height (m) – 0.213 (if VKORC1 rs8050894 is C/G and rs9934438 is G/A) – 0.719 (if VKORC1 rs8050894 is G/G and rs9934438 is A/A) + 0.899 (if CYP2D8P POS.42547668 is T/C) + 0.203 (if SULT1A1 rs11648192 is C/T). Variance explained 55.9%.
Pharmacogenetic Model without Variant Interactions
Ln Dose = −0.5846 – 0.0069*age (y) + 0.0045*weight (kg) – 0.0945 (if male) + 0.9795*height (m) – 0.239 (if VKORC1 rs9934438 is G/A) – 0.529 (if VKORC1 rs9934438 is A/A) + 1.092 (if CYP2D8P POS. 42547668 is T/C) + 0.188 (if SULT1A1 rs11648192 is C/T). Variance explained 40.0%.
Finally, we used these models to recalculate acenocumarol dose in patients with an INR 2–3 receiving a stable dose. Pharmacogenetic dose calculations approached given acenocumarol doses for all INR-sable patients (P > 0.05) except for one patient, R4 who needed 5.4 mg/day, and models estimated 2.47 mg/day. All individual dose estimations were listed in ST9.
Discussion
Here, we investigated pharmacogenetic variation in 110 genes by targeted NGS in patients treated with acenocumarol.
Novel Variants
Genetic variation analyses showed that the presence of novel variants varied widely among genes. For example, the largest number of novel variants (≥20) was observed on CYP3A4, CYP3A5, SULT1A1, GGCX, F11, F5, F8, and F9. High functional impact variants were present on CYP2B6 (MAF, 50%), CYP2C8 (MAF 1%), CYP3A4 (MAF 8%), F5 (MAF 2%), and VKORC1 (MAF 1%). These are relevant for its allele frequency, the dozens of drugs they metabolize, and because their impact predicts a stop codon. CYP2B6 and CYP3A4 are among the most polymorphic genes thus, it is not surprising the presence of relevant novel variants. Similarly, for VKORC1 population differentiation has been previously reported and the presence of a novel variant with a high functional impact may be in part, a consequence of this stratification (Bonifaz-Peña et al., 2014). Novel variants on major metabolizing genes, CBR1, CYP1A2, CYP3A4, CYP3A5, P2RY2, and UGT1A6 represented 40–50% of novel and known variants, suggesting that the collection of variation on these genes is probably not yet complete in Mestizos. Other metabolizing genes, CYP1B1, CYP2C18, CYP2C19, UGT1A members, CYP2E1, SULT2B1, and SULT1A1 showed a low proportion of novel-to-know variants (Figure 1). This may not necessarily mean that genetic variation is complete for these genes. For example, SULT1A1 presented 63 known and 19 novel variants ranking this gene as second with the largest number of variants.
Also, we confirmed population differences previously reported with an Fst > 0.19, on VKORC1 rs9934438 and four variants on UGT2B15 when comparing to YRI and CHB (Bonifaz-Peña et al., 2014). Differences between Mestizos and CEU were observed for UGT2B15, CYP2E1, CYP1A2, CYP4F2, UGT2B7, F12, and F12 (ST5). Interestingly, a few variants showed an Fst > 0.20 between Mestizos from this study and Mexicans from Los Angeles (MXL) from the 1000 genome project, on CYP2C8, CYP2C18, and CYP4F2 relevant for the pharmacokinetics of coumarins, phenytoin, vitamin K, and lipids. Allele frequencies of all variants are listed on ST6. Observations on these relevant pharmacogenes highlight the need to for a cautious implementation of pharmacogenomics in Mexican Mestizos.
We developed a pharmacogenetic model to estimate acenocumarol dose testing over four thousand variants. The model considered relevant variants on, SULT1A1, CYP2D8P, and VKORC1. For the latter gene, variants, rs8050894 and rs9934438, are well-known pharmacogenetic markers of coumarin dosing with the highest PharmGKB level of evidence. The interaction of these SNPs has already been reported as part of a haplotype (CG vs. TA) that aids to classify patients into high and low dose requirements (Rieder et al., 2005).
Interestingly, the model did not associate variants on CYP4F2 or CYP2C9 with acenocumarol dose (Table 4). Maybe because CYP4F2 (rs2108622) has a lower impact (Danese et al., 2012), and R-acenocumarol is metabolized by several CYPs other than CYP2C9. Moreover, reported variants that impair CYP2C9 activity are present in low frequency in Mexican Mestizos (Villegas-Torres et al., 2015). Instead, we observed dose association with variants on SULT1A1 and CYP2DP8. CYP2D8P is a pseudogene in the CYP2D cluster comprising CYP2D6, CYP2D7P, and CYP2D8P the former known to metabolize around 25% of all prescribed drugs. This cluster seems to have rapidly evolved due to environmental adversity with ethnic differences (Heim and Meyer, 1992). Wang et al identified a CYP2D6 transcription enhancer in the CYP2D cluster supporting the consideration of variants outside the CYP2D6 loci for functional genotyping (Wang et al., 2015). We identified a new variant on CYP2D8P POS.42547668, 26 Kbp upstream CYP2D6, and although there is no xenobiotic metabolism reported for this pseudogene, we can speculate that this variant is in LD with another one affecting gene expression or drug metabolism. The inclusion of many variants to dissect a pharmacogenetic phenotype is becoming more common as it increases our knowledge in paths and network interactions not previously considered (Cruz-Correa et al., 2017; Oliveira-Paula et al., 2017).
Our model is similar to others in that it includes typical clinical variants (age, sex, weight, and height), a dose prediction around 50% confidence, and the inclusion of VKORC1 as the primary determinant of acenocumarol dose. And even though we report VKORC1 rs9934438 vs. VKORC1 9923231 this latter, most commonly studied (Zhang et al., 2015; Tong et al., 2016) these are in complete LD. Finally, dose assessment using this model closely approached the dose received to achieve an INR 2–3, except for patient R4. Therefore, we delved into the genetic variability of this sample observing 20 heterozygous and 9 homozygous variants, these latter on SULT1A1, FGB, CDH12, KCNJ6, CBR3, and CYP2E1. However, this variation does not necessarily explain a lack of dose prediction. We can speculate that it is the presence of multiple variants on certain genes that affects several steps of the pharmacodynamics or pharmacokinetics and thus, drug efficacy.
We acknowledge the size and closed patient group studied retrospectively in individuals that were already assigned a dose by trial and error, not allowing for a prospective use of the genetic information. These observations will require confirmation and replication. We provide a list of 20 variants in 18 genes ordered by its impact on acenocumarol dose around the PK/PD of coumarins and the biochemistry of the coagulation cascade.
Our results offer an initial insight to the use of a genomic approach in pharmacogenetics showing that the advent of next generation sequencing may offer an alternative to identify and utilize individual variation to potentially explain a pharmacological relevant phenotype (Cheng et al., 2015). Future endeavors should focus on confirming these observations in a larger population.
As of June 2017, there are under a dozen reported studies of NGS in Mexican populations (NBCI), here, we present a list of variants in 110 pharmacogenes in Mexican Mestizos providing population information for allele frequency, differentiation from other continental groups and phenotype associations, which may complement the current catalog of pharmacogenomic variation in different populations.
Author Contributions
VG-C: Performed genomic experiments, interpreted results, and wrote the manuscript, JU-C: Analyzed the data and developed the Bayesian model, BV-T: Coordinated demographics and clinica data, performed genotyping experiments. JC-A: Conceived, planned, and performed the clinical study, ST-C: Conceived, planned, and performed the clinical study, RI-A: Conceived, planned, and performed the clinical study, OF-L: Conceived, planned, and performed the clinical study, XS: Conceived and coordinated genomic analyses.
Conflict of Interest Statement
The authors declare that the research was conducted in the absence of any commercial or financial relationships that could be construed as a potential conflict of interest.
Acknowledgments
This work was supported by Conacyt CB-2015-01 No.252952 to the project “Diversidad Farmacogenetica en Mexicanos, coleccion e interpretacion,” and by INMEGEN to the Pharmacogenomics Laboratory, project No.22/2014/I. The technical expertise of Roberto Galindo from Winter Genomics during bioinformatic analyses is gratefully acknowledged. M.Sc. Alfredo Mendoza Vargas from the NGS unit, kindly provided support and assistance during DNA sequencing. We also thank the staff at the National Institute of Cardiology, Marisol Serna Galarza, Sandra J. Rodriguez Duarte, MD. Jose Luis Lopez, and at INMEGEN Itsel A. Alva-Velazquez, and Anayelli Munoz-Rivas for their clinical and technical assistance during patient treatment, and sample management.
Supplementary Material
The Supplementary Material for this article can be found online at: https://www.frontiersin.org/articles/10.3389/fphar.2017.00863/full#supplementary-material
Abbreviations
AIC, Akaike information criteria; BIC, Bayesian information criterion; DIC, deviance information criterion; FDR, false discovery rate; Fst, fixation index as a measure of genetic variance; GLM, generalized linear model; BMI, body mass index; INR, international normalized ratio based on prothrombin time; LD, linkage disequilibrium; MAF, minor allele frequency; NGS, next generation sequencing; PD, pharmacodynamics; PharmGKB, pharmacogenomics knowledge base; PK, pharmacokinetics; SNV, single nucleotide variant; SNP, single nucleotide polymorphism.
Footnotes
1. ^Exome Variant Server. [updated 2014/01/02/10:04:37]. Available online at: http://evs.gs.washington.edu/EVS
References
Acland, A., Agarwala, R., Barrett, T., Beck, J., Benson, D. A., Bollin, C., et al. (2013). Database resources of the national center for biotechnology information. Nucleic Acids Res. 41, D8–D20. doi: 10.1093/nar/gks1189
Allan, P., Rettie, E., and Jones, J. P. (2005). clinical and toxicological relevance of cyp2c9: drug-drug interactions and pharmacogenetics. Annu. Rev. Pharmacol. Toxicol. 45, 477–494. doi: 10.1146/annurev.pharmtox.45.120403.095821
Baldi, P., and Long, A. D. (2001). A Bayesian framework for the analysis of microarray expression data: regularized t-test and statistical inferences of gene changes. Bioinformatics 17, 509–519. doi: 10.1093/bioinformatics/17.6.509
Bolger, A. M., Lohse, M., and Usadel, B. (2014). Trimmomatic: a flexible trimmer for Illumina sequence data. Bioinformatics 30, 2114–2120. doi: 10.1093/bioinformatics/btu170
Bonifaz-Peña, V., Contreras, A. V., Struchiner, C. J., Roela, R. A., Furuya-Mazzotti, T. K., Chammas, R., et al. (2014). Exploring the distribution of genetic markers of pharmacogenomics relevance in brazilian and mexican populations. PLoS ONE 9:e112640. doi: 10.1371/journal.pone.0112640
Carcao, M., Re, W., and Ewenstein, B. (2015). The role of previously untreated patient studies in understanding the development of FVIII inhibitors. Haemophilia 22, 22–31. doi: 10.1111/hae.12790
Chen, C., Mengersen, K. L., Ickstadt, K., Keith, J., Clair, L., Alston Anthony, N., et al. (2012). Case Studies in Bayesian Statistical Modelling and Analysis, 1st Edn. Brisbane, QLD: John Wiley.
Cheng, R., Leung, R. K., Chen, Y., Pan, Y., Tong, Y., Li, Z., et al. (2015). Virtual pharmacist: a platform for pharmacogenomics. PLoS ONE 10:e0141105. doi: 10.1371/journal.pone.0141105
Cingolani, P., Platts, A., Wang le, L., Coon, M., Nguyen, T., Wang, L., et al. (2012). A program for annotating and predicting the effects of single nucleotide polymorphisms, SnpEff: SNPs in the genome of Drosophila melanogaster strain w1118; iso-2; iso-3. Fly 6, 80–92. doi: 10.4161/fly.19695
Cruz-Correa, O. F., León-Cachón, R. B. R., Barrera-Saldaña, H. A., and Soberón, X. (2017). Prediction of atorvastatin plasmatic concentrations in healthy volunteers using integrated pharmacogenetics sequencing. Pharmacogenomics 18, 121–131. doi: 10.2217/pgs-2016-0072
Danese, E., Montagnana, M., Johnson, J. A., Rettie, A. E., Zambon, C. F., Lubitz, S. A., et al. (2012). Impact of the CYP4F2 p.V433M polymorphism on coumarin dose requirement: systematic review and meta-analysis. Clin. Pharmacol. Ther. 92, 746–756. doi: 10.1038/clpt.2012.184
Fricke-Galindo, I., Jung-Cook, H., LLerena, A., López-López, M., Scott, S., and Stein, C. (2016). Interethnic variability of pharmacogenetic biomarkers in Mexican healthy volunteers: a report from the RIBEF (Ibero-American Network of Pharmacogenetics and Pharmacogenomics). Drug Metab. Pers. Ther. 31, 625–629. doi: 10.1515/dmpt-2015-0030
Galanter, J. M., Fernandez-Lopez, J. C., Gignoux, C. R., Barnholtz-Sloan, J., Fernandez-Rozadilla, C., Via, M., et al. (2012). Development of a panel of genome-wide ancestry informative markers to study admixture throughout the Americas. PLoS Genet. 8:e1002554. doi: 10.1371/journal.pgen.1002554
Harrington, D. J., Gorska, R., Wheeler, R., Davidson, S., Murden, S., Morse, C., et al. (2008). Pharmacodynamic resistance to warfarin is associated with nucleotide substitutions in VKORC1. J. Thromb. Haemost. 6, 1663–1670. doi: 10.1111/j.1538-7836.2008.03116.x
Heim, M. H., and Meyer, U. A. (1992). Evolution of a highly polymorphic human cytochrome P450 gene cluster: CYP2D6. Genomics 14, 49–58. doi: 10.1016/S0888-7543(05)80282-4
McKenna, A., Hanna, M., Banks, E., Sivachenko, A., Cibulskis, K., Kernytsky, A., et al. (2010). The genome analysis toolkit: a mapreduce framework for analyzing next-generation DNA sequencing data. Genome Res. 20, 1297–1303. doi: 10.1101/gr.107524.110
Oliveira-Paula, G. H., Luizon, M. R., Lacchini, R., Fontana, V., Silva, P. S., Biagi, C., et al. (2017). Gene-gene interactions among PRKCA, NOS3 and BDKRB2 polymorphisms affect the antihypertensive effects of enalapril. Basic Clin. Pharmacol. Toxicol. 120, 284–291. doi: 10.1111/bcpt.12682
Pratt, V. M., Zehnbauer, B., Wilson, J. A., Baak, R., Babic, N., Bettinotti, M., et al. (2010). Characterization of 107 genomic DNA reference materials for CYP2D6, CYP2C19, CYP2C9, VKORC1, and UGT1A1: A GeT-RM and association for molecular pathology collaborative project. J. Mol. Diagnost. 12, 835–846. doi: 10.2353/jmoldx.2010.100090
Purcell, S., Neale, B., Todd-Brown, K., Thomas, L., Ferreira, M. A., Bender, D., et al. (2007). PLINK: a tool set for whole-genome association and population-based linkage analyses. Am. J. Hum. Genet. 81, 559–575. doi: 10.1086/519795
Relling, M. V., and Klein, T. E. (2011). CPIC: Clinical Pharmacogenetics Implementation Consortium of the pharmacogenomics research network. Clin. Pharmacol. Ther. 89, 464–467. doi: 10.1038/clpt.2010.279
Rieder, M. J., Reiner, A. P., Gage, B. F., Nickerson, D. A., Eby, C. S., McLeod, H. L., et al. (2005). Effect of VKORC1 Haplotypes on transcriptional regulation and warfarin dose. N. Engl. J. Med. 352, 2285–2293. doi: 10.1056/NEJMoa044503
Robinson, J. T., Thorvaldsdóttir, H., Winckler, W., Guttman, M., Lander, E. S., Getz, G., et al. (2011). Integrative genomics viewer. Nat. Biotech. 29, 24–26. doi: 10.1038/nbt.1754
Scott, S. A., Khasawneh, R., Peter, I., Kornreich, R., and Desnick, R. J. (2014). Combined CYP2C9, VKORC1 and CYP4F2 frequencies among racial and ethnic groups. Pharmacogenomics 11, 781–791. doi: 10.2217/pgs.10.49
Sebastiani, P., Timofeev, N., Dworkis, D. A., Perls, T. T., and Steinberg, M. H. (2009). Genome-wide association studies and the genetic dissection of complex traits. Am. J. Hematol. 84, 504–515. doi: 10.1002/ajh.21440
Sherry, S. T., Ward, M. H., Kholodov, M., Baker, J., Phan, L., and Smigielski, E. M. (2001). dbSNP: the NCBI database of genetic variation. Nucleic Acids Res. 29, 308–311. doi: 10.1093/nar/29.1.308
Soria, J. M., Almasy, L., Souto, J. C., Sabaterlleal, M., Fontcuberta, J., and Blangero, J. (2009). The F7 gene and clotting factor VII levels: dissection of a human quantitative trait locus. 2005. Hum. Biol. 81, 853–867. doi: 10.3378/027.081.0627
Tàssies, D., Freire, C., Pijoan, J., Maragall, S., Monteagudo, J., Ordinas, A., et al. (2002). Pharmacogenetics of acenocoumarol: cytochrome P450 CYP2C9 polymorphisms influence dose requirements and stability of anticoagulation. Haematologica 87, 1185–1191.
The 1000 Genomes Project Consortium, Auton, A., Brooks, L. D., Durbin, R. M., Garrison, E. P., Kang, H. M., et al. (2015). A global reference for human genetic variation. Nature 526, 68–74. doi: 10.1038/nature15393
Tong, H. Y., Dávila-Fajardo, C. L., Borobia, A. M., Martínez-González, L. J., Lubomirov, R., Perea León, L. M., et al. (2016). A new pharmacogenetic algorithm to predict the most appropriate dosage of acenocoumarol for stable anticoagulation in a mixed spanish population. PLoS ONE 11:e0150456. doi: 10.1371/journal.pone.0150456
Ufer, M. (2005). Comparative pharmacokinetics of vitamin K antagonists. Clin. Pharmacokinet. 44, 1227–1246. doi: 10.2165/00003088-200544120-00003
Van der Auwera, G. A., Carneiro, M. O., Hartl, C., Poplin, R., Del Angel, G., Levy-Moonshine, A., et al. (2013). From fastq data to high confidence variant calls: the genome analysis toolkit best practices pipeline. Curr. Protoc. Bioinformatics 43, 11.10.1–33. doi: 10.1002/0471250953.bi1110s43
van Leeuwen, Y., Rosendaal, F. R., and van der Meer, F. J. M. (2008). The relationship between maintenance dosages of three vitamin K antagonists: acenocoumarol, warfarin and phenprocoumon. Thromb. Res. 123, 225–230. doi: 10.1016/j.thromres.2008.01.020
Villegas-Torres, B., Sánchez-Girón, F., Jaramillo-Villafuerte, K., Soberón, X., and Gonzalez-Covarrubias, V. (2015). Genotype frequencies of VKORC1 and CYP2C9 in Native and Mestizo populations from Mexico, potential impact for coumarin dosing. Gene 558, 235–240. doi: 10.1016/j.gene.2014.12.068
Waldron, D. (2016). Genetic variation: diving deep into the genome. Nat. Rev. Genet. 17, 716–717. doi: 10.1038/nrg.2016.144
Wang, D., Papp, A. C., and Sun, X. (2015). Functional characterization of CYP2D6 enhancer polymorphisms. Hum. Mol. Genet. 24, 1556–1562. doi: 10.1093/hmg/ddu566
Whirl-Carrillo, M., McDonagh, E. M., Hebert, J. M., Gong, L., Sangkuhl, K., Thorn, C. F., et al. (2012). Pharmacogenomics knowledge for personalized medicine. Clin. Pharmacol. Ther. 92, 414–417. doi: 10.1038/clpt.2012.96
Zhang, Y., de Boer, A., Verhoef, T. I., van der Meer, F. J., Le Cessie, S., Maitland-van der Zee, A. H., et al. (2015). Comparison of dosing algorithms for acenocoumarol and phenprocoumon using clinical factors with the standard care in the Netherlands. Thromb. Res. 136, 94–100. doi: 10.1016/j.thromres.2015.04.034
Keywords: coumarins, acenocumarol, pharmacogenomics, Mexican Mestizo, population differences, targeted sequencing
Citation: Gonzalez-Covarrubias V, Urena-Carrion J, Villegas-Torres B, Cossío-Aranda JE, Trevethan-Cravioto S, Izaguirre-Avila R, Fiscal-López OJ and Soberon X (2017) Pharmacogenetic Variation in Over 100 Genes in Patients Receiving Acenocumarol. Front. Pharmacol. 8:863. doi: 10.3389/fphar.2017.00863
Received: 14 September 2017; Accepted: 09 November 2017;
Published: 23 November 2017.
Edited by:
Ulrich M. Zanger, Dr. Margarete Fischer-Bosch Institut für Klinische Pharmakologie (IKP), GermanyReviewed by:
Marcelo Rizzatti Luizon, Universidade Federal de Minas Gerais, BrazilWenndy Hernandez, University of Chicago, United States
Copyright © 2017 Gonzalez-Covarrubias, Urena-Carrion, Villegas-Torres, Cossío-Aranda, Trevethan-Cravioto, Izaguirre-Avila, Fiscal-López and Soberon. This is an open-access article distributed under the terms of the Creative Commons Attribution License (CC BY). The use, distribution or reproduction in other forums is permitted, provided the original author(s) or licensor are credited and that the original publication in this journal is cited, in accordance with accepted academic practice. No use, distribution or reproduction is permitted which does not comply with these terms.
*Correspondence: Vanessa Gonzalez-Covarrubias, vgonzalez@inmegen.gob.mx