 Anca Toiu1†
 Andrei Mocan2†
 Laurian Vlase3*
 Alina E. Pârvu4
 Dan C. Vodnar5Ana-Maria Gheldiu3Cadmiel Moldovan2
 Ilioara Oniga1
- 1Department of Pharmacognosy, “Iuliu Haţieganu” University of Medicine and Pharmacy, Cluj-Napoca, Romania
- 2Department of Pharmaceutical Botany, “Iuliu Haţieganu” University of Medicine and Pharmacy, Cluj-Napoca, Romania
- 3Department of Pharmaceutical Technology and Biopharmacy, “Iuliu Haţieganu” University of Medicine and Pharmacy, Cluj-Napoca, Romania
- 4Department of Pathophysiology, “Iuliu Haţieganu” University of Medicine and Pharmacy, Cluj-Napoca, Romania
- 5Department of Food Sciences, Faculty of Food Science and Technology, University of Agricultural Sciences and Veterinary Medicine, Cluj-Napoca, Romania
In the Romanian folk medicine, aerial parts of Ajuga laxmannii (“nobleman’s beard,” Romanian – “barba boierului” or “avrămească” or “creştinească”) are traditionally used as galactagogue and anti-inflammatory agents. The present study aimed to evaluate the chemical composition (polyphenols, iridoids, and phytosterols), antioxidant, antimicrobial and in vivo anti-inflammatory activity of different extracts of A. laxmannii aerial parts. The major identified bioactive compounds were rutin, 8-O-acetylharpagide and β-sitosterol. The antioxidant activity of A. laxmannii extracts was evaluated using several methods, and the results showed good antiradical effects. Moreover, the antimicrobial evaluation showed a potent antifungal activity against C. albicans and P. funiculosum. Furthermore, the anti-inflammatory effect was determined by monitoring some parameters involved in the inflammatory process. The results obtained showed differences between the analyzed extracts; and therefore the importance of choosing the best solvent in order to extract the appropriate amount of bioactive compounds. A. laxmannii ethanol extract showed an anti-inflammatory effect by reducing total leukocytes, PMN, phagocytosis, and oxidative stress. Compared to diclofenac, only the 50 mg/mL A. laxmannii extract had better anti-inflammatory and anti-oxidative stress effects, and this could justify the importance of a correlation between the activity and the used concentration. These findings strongly suggest that A. laxmannii could be considered as a valuable source of bioactive compounds, which could be further valued as anti-inflammatory agents in the composition of several herbal drugs.
Introduction
Medicinal plants have proven their value as sources of molecules with therapeutic potential, and still represent an important pool for the identification of novel drug leads (Atanasov et al., 2015). Moreover, nowadays herbal medicines have received great scientific interest because they provide both important biomolecules which are used in the treatment of several diseases, as well as a broad spectrum of long-term use and safety. Nevertheless, plant secondary metabolites are excellent candidates for developing new phytopharmaceuticals with various biological activities, including antioxidant, antimicrobial, and anti-inflammatory (Shahidi and Ambigaipalan, 2015; Liao et al., 2017; Zhang et al., 2017).
In many parts of the world such as Europe, Asia, Africa, South America, plants and/or plant compounds are used to cure or prevent different diseases, being in the same time part of the cultural inheritage of different nations or ethnicities. Still, herbal medicines were used and applied only based on traditional knowledge and empirical observations of “indigenous healers,” without elucidating the chemical composition of the used extracts or mechanistic knowledge of their pharmacological activities and main bioactive compounds (Atanasov et al., 2015). Often, the empirical value of medicinal plants is seen as a proof of effectiveness and safety, and still many plant preparations are traditionally used without having a certain scientific proof of their pharmacological effects or long-term safety and efficacy.
Phytochemicals are biomolecules that occur in herbal drugs or phytopharmaceuticals, and possess the ability to modulate one or more metabolic processes or pathways in the human organism resulting in health benefits and promotion of well-being (Abuajah et al., 2014; Ferrante et al., 2017; Locatelli et al., 2017). Within this frame, new studies on uninvestigated traditionally used medicinal plants or plant products provide remarkable interest for the development of novel herbal drugs or herbal formulations.
The genus Ajuga part of the Lamiaceae family comprises 50 species, and about 300 taxa (including subspecies and varieties), distributed in Asia, Africa, Australia, North America, and Europe (Riaz et al., 2007; Atay et al., 2016). Some Ajuga species are used in folk medicine for the treatment of diabetes, inflammation, malaria, high blood pressure, pain, fever, and as antihelmintic (Cocquyt et al., 2011). Moreover, several studies have been carried out on Ajuga species indicating pharmacological activities such as antimalarial (Njoroge and Bussmann, 2006; Cocquyt et al., 2011), hypoglycemic (El-Hilaly et al., 2006), anti-inflammatory (Gautam et al., 2011), anti-arthritis, antipyretic, anabolic, antibacterial, hepatoprotective, antifungal, antioxidant, cardiotonic (Israili and Lyoussi, 2009), and analgesic properties (Ono et al., 2008).
Additionally, several phytochemical studies on Ajuga species have shown the presence of iridoids, diterpenes, phytoecdy steroids, flavonoids, sterol glycosides and phenylethanoid glycosides as the main secondary metabolites of the genus (Manguro et al., 2006, 2011; Ono et al., 2011; Atay et al., 2016).
Ajuga laxmannii (Murray) Benth. is an erect rhizomatous pubescent herb that belongs to the genus Ajuga, growing in the grasslands of Romania and other parts of Europe. In Romania, the local name for this species is “nobleman’s beard” (Romanian – “barba boierului” or “avrămească” or “creştinească”), and it is used as a galactogogue and anti-inflammatory agent. To the best of our knowledge, there is only one study on A. laxmannii (Murray) Benth. regarding its antiprotozoal activity (Atay et al., 2016).
Within this frame, the aim of this study was to perform a phytochemical analysis of A. laxmannii aerial parts extracts, particularly polyphenolic compounds, iridoids and phytosterols, and to investigate the antioxidant, antimicrobial and anti-inflammatory activities.
Materials and Methods
Chemicals
The standards used were chlorogenic acid, p-coumaric acid, caffeic acid, rutin, apigenin, quercetin, isoquercitrin, hyperoside, kaempferol, quercetol, myricetol, fisetin, gallic acid, aucubin, catalpol, harpagoside, β-sitosterol, brassicasterol, stigmasterol, campesterol and ergosterol from Sigma–Aldrich (Germany), ferulic acid, sinapic acid, gentisic acid, patuletin, luteolin from Roth (Germany), caftaric acid from Dalton (United States), harpagide, 8-O-acetyl-harpagide from PhytoLab GmbH & Co. (Germany). Methanol of HPLC analytical-grade, acetonitrile of HPLC analytical-grade, ammonium acetate of HPLC analytical-grade, silver nitrate of HPLC analytical-grade, chloroform, petroleum ether, n-hexane, potassium hydroxide of analytical-grade and hydrochloric acid of analytical-grade, acetic acid of analytical-grade, Folin–Ciocâlteu reagent were purchased from Merck (Germany). Sodium carbonate, Copper (II) sulfate pentahydrate, sodium acetate trihydrate and anhydrous aluminum chloride were acquired from Sigma–Aldrich (Germany). The DPPH (2,2-diphenyl-1-picrylhydrazyl), Trolox (6-hydroxy-2,5,7,8-tetramethylchroman-2-carboxylic acid) were obtained from Alfa-Aesar (Karlsruhe, Germany), HRP (horseradish peroxidase), Fremy’s salt were purchased from Sigma–Aldrich (Germany).
Methanolic stock solutions (100 mg/mL) of the flavonoid standards were prepared and stored at 4°C, protected from daylight. They were appropriately diluted with double distilled water before being used as working solutions. Methanolic stock solutions of iridoids (1 mg/mL) were prepared and stored at 4°C, protected from daylight. They were appropriately diluted with double distilled water before being used as working solutions. Chloroform stock solutions (1 mg/mL) of the phytosterol standards were prepared and stored at 4°C, protected from daylight. Before being used as working solutions, they were appropriately diluted with acetonitrile. Distilled, deionised water was produced by a Direct Q-5 Millipore (Millipore SA, Molsheim, France) water system.
Plant Sample and Extraction Procedure
Ajuga laxmannii aerial parts were collected from Cluj County (Romania) spontaneous flora during flowering stage in June 2015. The air-dried powder of herbal material was extracted with different solvents. The methanol extract was obtained from 5 g herbal material and 50 mL 70% methanol for 30 min on a water bath at 60°C (Methanol Extract, ME). The 10% tincture was prepared at room temperature from 100 g of herbal material and 1000 mL 70% ethanol by maceration at room temperature for 7 days (Ethanol Extract, EE) as previously described by Toiu et al. (2017). In order to evaluate the anti-inflammatory activity of A. laxmannii aerial parts, three extracts were used: A. laxmannii ethanol extract 100% (100 mg dry weight herbal material/mL), A. laxmannii ethanol extract 50% (50 mg dw herbal material/mL), and A. laxmannii ethanol extract 25% (25 mg dw herbal material/mL).
For identification and quantification of phytosterols, and for determination of antifungal properties, chloroform (CE) and petroleum ether extracts (PEE) were also prepared. Thus, 2.5 g of herbal material were extracted with 25 mL chloroform and 25 mL petroleum ether, respectively, for 30 min in a sonication bath at 60°C. The extracts were cooled down, and then centrifuged at 4500 rpm for 15 min, and the supernatant was recovered (Mocan et al., 2014).
Quantitative Determinations of Total Bioactive Compounds
Total Phenolic Content (TPC)
The total phenolic content (TPC) of the A. laxmannii extracts was determined photometrically, by Folin-Ciocâlteu method with slight modifications (Tămaş et al., 2009). Briefly, 2 mL of each ethanolic and methanolic extracts were diluted 25 times, then mixed with Folin-Ciocâlteu reagent (1 mL) and distilled water (10.0 mL), and further diluted to 25 mL with a 290 g/L solution of sodium carbonate. The samples were incubated in the dark for 30 min. The absorbance was measured at 760 nm, using a JASCO V-530 (Jasco International Co., Ltd., Tokyo, Japan) UV-VIS spectrophotometer. TPC values were expressed as gallic acid equivalents (R2 = 0.999), mg gallic acid/g dry weight herbal material (mg GAE/g dw herbal material). Assay was performed in triplicate.
Total Flavonoid Content (TFC)
The total flavonoid content (TFC) of the A. laxmannii extracts was calculated and expressed as rutin equivalents after the method previously described (Mocan et al., 2014). Briefly, each extract (EE and ME) (5 mL) was mixed with sodium acetate (5.0 mL, 100 g/L), aluminum chloride (3.0 mL, 25 g/L), and mixed up to 25 mL in a calibrated flask with methanol. The absorbance was measured at 430 nm. The TFC was expressed as rutin equivalents (R2 = 0.999), mg rutin equivalents/g dry weight herbal material (mg RE/g dw herbal material). Assay was performed in triplicate.
Total Iridoid Content (TIC)
The total iridoid content (TIC) of the A. laxmannii extracts was determined by a photometric method based on a Trim-Hill reaction and the results were expressed as aucubin equivalents (mg AE/g dw herbal material). Each extract (0.4 mL) was mixed with 4 mL of Trim-Hill reagent (acetic acid –0.2% CuSO4 - conc. HCl, 10:1:0.5), afterwards the absorbance was measured at 609 nm, and the blue color indicated the presence of iridoids. The amount of iridoids was calculated using an aucubin (0.1–1 mg/mL) calibration curve (R2 = 0.999) (Erdenechimeg et al., 2017). Assay was performed in triplicate.
Antioxidant Capacity Assays
For testing the antioxidant capacity, the A. laxmannii extracts were further tested using three different assays.
DPPH Radical Scavenging Activity
The effect of the A. laxmannii extracts against the 2,2-diphenyl-1-picrylhydrazyl (DPPH) radical was tested according to Savran et al. (2016). Two milliliters of sample solution (2 mL, 3.75–30 μg/mL) was added to 2 mL of a 0.1 mg/mL DPPH methanol solution. After 30 min of incubation at room temperature in the dark, the absorbance was read at 517 nm. The DPPH radical scavenging activity was expressed as IC50 (μg/mL). The percentage of DPPH consumption was converted to trolox equivalents (TE) using a calibration curve (R2 = 0.985) of Trolox standard solutions (0.5–5 μg/mL). Considering the results, an IC50 < 50 μg TE/mL shows a very good antioxidant potential; an IC50 of 50–100 μg TE/mL displays a good antioxidant potential; an IC50 of 100–200 μg TE/mL reveals a weak antioxidant potential; an IC50 > 200 μg TE/mL means no antioxidant potential (Araniciu et al., 2014). Assay was performed in triplicate.
ABTS Radical Cation Scavenging Activity
The scavenging activity of the A. laxmannii ethanol extract against the ABTS radical cation (2,2′-azino-bis(3-ethyl-benzothiazoline)-6-sulphonic acid) was measured according to Zengin et al. (2014). ABTS•+ was produced directly by reacting 7 mM ABTS solution with 2.45 mM potassium persulfate and allowing the mixture to stand for 12–16 h in the dark at room temperature. Prior to beginning the assay, ABTS solution was diluted with methanol to an absorbance of 0.700 ± 0.02 at 734 nm. Sample solution was added to ABTS solution (2 mL) and mixed. After 30 min incubation at room temperature, the sample absorbance was read at 734 nm. The ABTS radical cation scavenging activity was expressed as milligrams of TE per gram of extract (mg TE/g). Assay was performed in triplicate.
Electron Paramagnetic Resonance (EPR) Spectroscopy
In order to compare with the results of the spectrophotometric measurements, the radical scavenging activity of the A. laxmannii ethanol extract was additionally measured with EPR spectrometry using the stable synthetic radical Fremy’s salt as reported previously (Barakat and Rohn, 2014; Moussa-Ayoub et al., 2014). A mixture of 25 mL of the diluted extract and a 25 mL of a 1 mM Fremy’s salt solution [potassium nitrosodisulfonate, K2NO(SO3)2] in phosphate buffer (pH 7.4) were filled into a 50 mL capillary. After a reaction time of 30 min, the EPR spectrum of Fremy’s salt radical was recorded and intensity was obtained by integration of the signal. The antioxidant activity of the extract, expressed as milligrams of Fremy’s salt equivalents per gram dry weight (mg FSE/g dw), was calculated in comparison to a control reaction with the solvent. Spectra were recorded at 21°C on a Miniscope MS 200 X-band spectrometer (Magnettech GmbH, Berlin, Germany) with the microwave power set to 10 dB and using modulation amplitude of 1500 mG. Assay was performed in triplicate.
Identification and Quantification of Polyphenolic Compounds
General Apparatus and Chromatographic Conditions
An Agilent 1100 HPLC Series system was used (Agilent Technologies, Darmstadt, Germany), coupled with an Agilent Ion Trap SL mass spectrometer equipped with an electrospray or APCI ion source.
Chromatographic Conditions for the Analysis of Polyphenolic Compounds
The experiment was carried out using an Agilent 1100 HPLC Series system (Agilent, United States) equipped with degasser, binary gradient pump, column thermostat, autosampler and UV detector. The HPLC system was coupled with an Agilent 1100 mass spectrometer (LC/MSD Ion Trap VL). For the separation, a reverse-phase analytical column was employed (Zorbax SB-C18 100 mm × 3.0 mm i.d., 3.5 μm particle); the work temperature was 48°C. The detection of the compounds was performed on both UV and MS mode. The UV detector was set at 330 nm until 17.5 min, then at 370 nm. The MS system operated using an electrospray ion source in negative mode. The chromatographic data were processed using ChemStation and Data Analysis software from Agilent, United States.
The mobile phase was a binary gradient prepared from methanol and solution of 0.1% acetic acid (v/v). The elution started with a linear gradient, beginning with 5% methanol and ending at 42% methanol, for 35 min; isocratic elution followed for the next 3 min with 42% methanol. The flow rate was 1 mL/min and the injection volume was 5 μL.
The MS signal was used only for qualitative analysis based on specific mass spectra of each compound. The MS spectra obtained from a standard solution of polyphenols were integrated in a mass spectra library. Later, the MS traces/spectra of the compounds from analyzed samples were compared to spectra from library, which allows positive identification of each substance, based on spectral match. The UV trace was used for quantification of identified compounds from MS detection. Using the chromatographic conditions described above, the polyphenols eluted in less than 35 min. Four polyphenols cannot be quantified in current chromatographic conditions due overlapping (caftaric acid with gentisic acid and caffeic acid with chlorogenic acid). However, all four compounds can be selectively identified in MS detection (qualitative analysis) based on differences between their molecular mass and MS spectra. The detection limits were calculated as minimal concentration producing a reproductive peak with a signal-to-noise ratio greater than three. Quantitative determinations were performed using an external standard method. Calibration curves in the range of 0.5–50 μg/mL range with good linearity (R2 > 0.999) for a five point plot were used to determine the concentration of polyphenols in plant samples.
Mass Spectrometry Analyses
The detection and quantification of polyphenols was made in UV assisted by mass spectrometry. Due peak overlapping, four polyphenol-carboxylic acids (caftaric, gentisic, caffeic, and chlorogenic) were determined only based on MS spectra, whereas for the rest of compounds the linearity of calibration curves was very good (R2 > 0.998), with detection limits in the range of 18 to 92 ng/mL. The detection limits were calculated as minimal concentration producing a reproductive peak with a signal-to-noise ratio greater than three. Quantitative determinations were performed using an external standard method; retention times were determined with a standard deviation ranging from 0.04 to 0.19 min. Accuracy was checked by spiking samples with a solution containing each polyphenol in a concentration of 10 μg/mL. In all analyzed samples, the compounds were identified by comparison of their retention times and the recorded electrospray mass spectra with those of standards in the same chromatographic conditions (Vlase et al., 2013; Andriamadio et al., 2015).
Identification and Quantification of Phytosterols
Chromatographic Conditions for the Analysis of Phytosterols
Compounds were separated using a Zorbax SB-C18 reversed-phase analytical column (100 mm × 3.0 mm i.d., 5 μm particle) fitted with a guard column Zorbax SB-C18, both operated at 40°C. Sterols were separated under isocratic conditions using a mobile phase consisting of 10:90 (v/v) methanol and acetonitrile. The flow rate was 1 mL/min and the injection volume was 5 μL. Mass spectrometry analysis was performed on an Agilent Ion Trap 1100 VL mass spectrometer with atmospheric pressure chemical ionization (APCI) interface. The instrument was operated in positive ion mode. Operating conditions were optimized in order to achieve maximum sensitivity values: gas temperature (nitrogen) 325°C at a flow rate of 7 L/min, nebulizer pressure 60 psi and capillary voltage -4000 V.
The identification of sterols was performed by comparing the retention times and mass spectra with those of standards in the same chromatographic conditions. To avoid or limit the interference from background, the multiple reactions monitoring analysis mode was used instead of single ion monitoring (e.g., MS/MS instead of MS). Linearity of calibration curves was very good (R2 > 0.998), with detection limits in the range of 69 to 3312 ng/mL for ergosterol, 62 to 2952 ng/mL for brassicasterol, 59 to 2808 ng/mL for campesterol, 136 to 6528 ng/mL for stigmasterol, and 132 to 6336 ng/mL for β-sitosterol. The results are expressed as μg per mL of extract (μg/mL).
The software ChemStation (vA09.03) and DataAnalysis (v5.3) from Agilent, United States were used for the acquisition and analysis of chromatographic data (Vlase et al., 2013).
Identification and Quantification of Iridoids
Targeted A. laxmannii iridoids (aucubin, catalpol, harpagide, harpagoside, and 8-O-acetylharpagide) were analyzed by HPLC-MS on a Agilent 1100 liquid chromatography system equipped with a binary pump, autosampler, thermostat and detector (all 1100 Series from Agilent Inc., United States). The system was controlled with Data Analysis software (version B01.03, Agilent Inc., United States). The separation was carried out on an Atlantis HILIC 3.5 μm (100 mm × 3.0 mm i.d.) (Waters Inc., United States) column equipped with an online 0.2 μm filter (Agilent Inc.), at a working temperature of 40°C, a flow rate of 0.75 mL/min and an injection volume of 8 μL. A binary gradient system with eluent (A) 0.1% acetic acid (v/v) and 20 μM sodium acetate in water, and eluent (B) 0.1% acetic acid (v/v) and 20 μM sodium acetate in acetonitrile was used for the analyzed samples with the following gradient: 95–80% B (0–5 min). The HPLC system was coupled with an Agilent Ion Trap 1100 SL mass spectrometer equipped with an electrospray ionisation (ESI) source and operated in the positive mode with a scan range between 360 and 680 m/z. The newly developed LC-ESI-MS/MS method was used to identify the targeted compounds based on their sodium adducts (M+23 m/z): aucubin (369 m/z), catalpol (385 m/z), harpagide (387.2 m/z), harpagoside (517.4 m/z) and 8-O-acetylharpagide (429.3 m/z), and by comparison with standards in the same chromatographic conditions. The capillary voltage was set to 4 kV and the capillary temperature to 300°C. Nitrogen (N2) was used as dry gas with a dry flow of 12 L/min and a pressure of 60 psi for the nebulizer. For quantification of the iridoids, stock solutions of the five commercially available standards substances were prepared in acetonitrile, and different concentrations of each standard were used. All calibration curves yielded a coefficient of determination of R2 ≥ 0.990. The results are expressed as μg per mL of extract (μg/mL). All phytochemical assays were performed in triplicate.
Antibacterial Activity
Microorganisms and Culture Conditions
For the bioassay, five aerobic bacterial strains were used, two Gram positive: Staphylococcus aureus (ATCC 49444), Listeria monocytogenes (ATCC 19114) and three gram negative: Pseudomonas aeruginosa (ATCC 27853), Salmonella typhimurium (ATCC 14028) and Escherichia coli (ATCC 25922). All of the tested microorganisms were obtained from Food Biotechnology Laboratory, Life Sciences Institute, University of Agricultural Sciences and Veterinary Medicine Cluj Napoca, Romania. The bacteria were cultured on Muller-Hinton Agar and cultures were stored at 4°C and subcultured once a month.
Microdilution Method
The modified microdilution technique was used to evaluate antimicrobial activity. Bacterial species were cultured overnight at 37°C in Tryptic Soy Broth (TSB) medium at 37°C. The bacterial cell suspensions were adjusted with sterile saline to a concentration of approximately 2.5 × 10⁵ CFU/mL in a final volume of 100 μL per well. The inoculum was stored at +4°C for further use. Dilutions of the inoculum were cultured on solid Muller–Hinton (MH) for bacteria in order to verify the absence of contamination and to check the validity of the inoculum. Determinations of minimum inhibitory concentrations (MICs) were performed by a serial dilution technique using 96-well microtitre plates. Different A. laxmannii ethanol extract dilutions were carried out over the wells containing 100 μL of TSB and afterwards, 10 μL of inoculum was added to all the wells. The microplates were incubated for 24–48 h at 37°C. The MIC of the samples was detected following the addition of 20 μL (0.2 mg/mL) of resazurin solution to each well, and the plates were incubated 2 h at 37°C. A change from blue to pink indicates reduction of resazurin, therefore, the bacterial growth. The MIC was defined as the lowest drug concentration that prevented this color change. The minimum bactericidal concentrations (MBCs) were determined by serial subcultivation of a 2 μL into microtitre plates containing 100 μL of broth per well and further incubation for 48 h at 37°C. The lowest concentration, with no visible growth, was defined as MBC, indicating 99.5% killing of the original inoculum. Gentamycin (25 μL/well at concentration of 4 μg/mL) was used as positive control for bacterial growth. A 50% solution of ethanol in water was used as negative control. All determinations were performed in triplicate, and values are the averages of three replicates (Mocan et al., 2014).
Antifungal Activity
To investigate the antifungal activities of A. laxmannii extracts, the following fungi were used: Aspergillus flavus (ATCC 9643), Aspergillus niger (ATCC 6275), Candida albicans (ATCC 10231), Candida parapsilosis (ATCC 22019) and Penicillium funiculosum (ATCC 56755). These fungi were obtained from the Food Biotechnology Laboratory, Life Sciences Institute, University of Agricultural Sciences and Veterinary Medicine Cluj-Napoca, Romania. Cultures were maintained on malt agar at 4°C and subcultured every month. Spore suspension (1.0 × 10⁵ CFU/mL) was obtained by washing agar plates with sterile solution containing [0.85% saline, 0.10% Tween 80 (v/v)], then added to each well to a final volume of 100 μL. Inocula were screened for contamination by culturing on a solid medium. The minimum inhibitory (MIC) and minimum fungicidal (MFC) concentrations assays were determined using the microdilution method by preparing a serial of dilutions in 96-well microtiter plates. The extracts (EE, PEE, CE) were diluted in 0.85% saline (10 mg/mL), then added to microplates containing Broth Malt medium with inoculum and incubated for 72 h at 28°C on a rotary shaker. The lowest concentrations without visible growth (at the binocular microscope) were defined as MICs. The MFCs were determined by serial sub-cultivation of 2 μL of tested extracts dissolved in medium and inoculated for 72 h, into microtiter plates containing 100 μL of broth per well and further incubation 72 h at 28°C. The lowest concentration with no visible growth was defined as MFC indicating 99.5% killing of the original inoculum. The fungicide fluconazole was used as positive control (1–3500 μg/mL). All the experiments were performed in duplicate and repeated three times (Stana et al., 2017).
In Vivo Anti-inflammatory Effects
Experimental Design
All procedures that involved the use of life animals followed the European guidelines and rules as established by the EU Directive 2010/63/EU. The study protocol was approved by the Research Ethics Committee of the Iuliu Haţieganu University of Medicine and Pharmacy Cluj-Napoca (No. 382/2017).
The experiments were performed on adult male Wistar (strain Crl:WI) albino rats (Charles River Laboratories, United States), weighing 200–250 g, that were bred in the Animal Facility of Iuliu Haţieganu University of Medicine and Pharmacy. The animals were randomly assigned to six groups (n = 8). Rats from group I were injected intramuscularly (i.m.) with 0.9% saline solution as a negative control. Inflammation was induced by i.m. injection of turpentine oil (6 mL/kg BW) in groups II–VI. Animals were housed under controlled conditions (12 h light/dark cycle, at an average temperature of 21–22°C and humidity of 50–55%), and had free access to standard pellet (Cantacuzino Institute, Bucharest, Romania) basal diet and water ad libitum. After the i.m. injection, the animals received the following intraperitoneal (i.p.) injections: groups I and II received 1 mL of a 0.9% saline solution; groups III–V received 5 mL/kg BW of A. laxmannii ethanol extract diluted in distilled water to concentrations of 25% (25 mg dw/mL), 50% (50 mg dw/mL) and 100% (100 mg dw/mL), respectively; group VI received 20 mg/kg BW diclofenac (Araniciu et al., 2014).
In previous studies on anti-inflammatory activity of A. bracteosa, the evaluated dose was 200 mg/kg BW (Kayani et al., 2016), therefore in this research the animals received 400 mg/kg BW (100%), 200 mg/kg BW (50%), and 100 mg/kg BW (25%) of A. laxmannii ethanol extract.
Twenty-four hours after the incubation of inflammation, the rats were anesthetized using a combination of 50 mg/kg BW ketamine and 20 mg/kg BW xylazine (Parvu et al., 2014), and blood was withdrawn by retro-orbital puncture. Blood collected for use in the phagocytosis test and for white blood cells count (WBC) was collected on ethylenediaminetetraacetic acid (EDTA), while blood collected for use in the nitro-oxidative stress tests was collected without anticoagulant. Coagulated blood was centrifuged and the separated serum was stored in -80°C until use. The total nitrites and nitrates (NOx), total oxidative status (TOS), total antioxidant response (TAR) and oxidative stress index (OSI) calculation was measured in the serum.
The experiments were performed in triplicate. At the end of the experiments under anesthesia using a combination of ketamine (60 mg/kg BW) and xylazine (15 mg/kg BW) (Francischi et al., 2017) animals were killed by cervical dislocation.
In Vitro Phagocytosis Test
Phagocytic activity (PA) was determined as previously described with minor modifications (Moldovan et al., 2011). The blood samples that were harvested on EDTA were incubated with an E. coli suspension (4 × 10⁶ bacteria/mL, in 0.9% saline solution in the ratio of 0.2 mL of blood/20 μL E. coli suspension) in a silicon tube at 37°C for 30 min. May-Grünwald-Giemsa stained smears were then prepared and counted by light microscopy using an Olympus microscope. We used two parameters to assess phagocytic capacity: the PA which was the number of the E. coli bacteria that were phagocytized by 100 leukocytes, and the phagocytic index (PI) which was the percentage of leukocytes that phagocytized at least one bacterium.
WBC Count
For the WBC count, a blood sample dilution 1:10 in Türk solution was prepared in a Potain leukocyte-dropper. The count was performed with an optical microscope (Olympus), using a Bürcker-Türk counting chamber. The differential leukocyte count was expressed as a percentage and carried out on May-Grünwald-Giemsa stained smears.
Oxidative Stress Evaluation
First serum samples were passed through 10-kDd filters (Sartorius AG, Goettingen, Germany) and contaminant proteins were removed by extraction with a 3:1 (v:v) solution of methanol/diethyl ether. The sample methanol/diethyl ether ratio was 1:9 (v:v) (Harma et al., 2003). The Griess reaction was used to indirectly determine NO synthesis (NOx). In brief, 100 μL of 8 mg/mL VCl3 was added to 100 μL of filtered and extracted serum supernatant in order to reduce nitrate to nitrite, followed by the addition of the Griess reagents, 50 μL of SULF (2%) and 50 μL of NEDD (0.1%). After 30 min incubation at 37°C, the sample absorbance was read at 540 nm. The concentration of serum NOx was determined using a sodium nitrite-based curve, and expressed as nitrite μmol/L (Miranda et al., 2001). The TOS of the serum was measured using a colorimetric assay (Erel, 2005). This assay measures the oxidation of ferrous ions to ferric ions in the presence of various reactive oxygen species in an acidic medium. The ferric ions are detected by reaction with xylenol orange. Assay measurements were standardized using hydrogen peroxide (H2O2) as the oxidative species, and the obtained results were expressed in μmol H2O2 equivalents/L. The TAR was measured in serum using a colorimetric assay (Erel, 2004). In this assay, the rate of hydroxyl radical producion by the Fenton reaction was monitored by following the changes in the absorbance of colored dianisidyl radicals. Upon addition of a serum sample, the hydroxyl radical initiated oxidative reactions are suppressed by antioxidant present in the serum. Inhibition of dianisidyl oxidation prevents the subsequent color change, thereby effectively measuring the total antioxidant capacity of the serum. This assay is calibrated using trolox and results are expressed as micromol TE/L. The ratio of the TOS to the TAR represents the OSI, an indicator of the degree of oxidative stress (Harma et al., 2003): OSI (Arbitrary Unit) = TOS (micromol H2O2 equivalents/L)/TAR (micromol TE/L).
All of the spectroscopic measurements were performed using a Jasco V-530 UV-Vis spectrophotometer (Jasco International Co., Ltd., Tokyo, Japan).
Statistical Analysis
All results were expressed as the mean ± SD. Otherwise, the median and first quartile (Q1) and third quartile (Q3) were reported. Statistical comparisons between two independent groups were performed using the Student’s t-test (with equal and unequal variances, depending upon to the results of the F-test) for normally distributed data. Mann–Whitney’s test was used for non-parametric data. Pearson and Spearman’s correlation analyses were used to calculate statistical relationships between parameters. A p-value < 0.05 was considered as statistically significant. Analyses were performed using SPSS 16.0 for Windows (SPSS Inc., United States).
Results and Discussion
Quantitative Determinations of Total Bioactive Compounds
Various studies showed that phenolic compounds are widely distributed in the Ajuga species and these compounds could contribute to their antioxidant activity. In this part, a preliminary comparative overview of the total phenolic, flavonoid and iridoid contents of the different extracts of the A. laxmannii is presented. The TPC is presented in Table 1 and was 67.68 ± 1.57 mg GAE/g dw for ethanol extract, and 56.76 ± 0.92 mg GAE/g dw for methanol extract. The TPC values of analyzed A. laxmannii aerial parts extracts were higher than those obtained previously for A. reptans flower extracts (20.86 ± 0.53 and 24.11 ± 0.57 mg GAE/g dw, for methanol and ethanol extracts, respectively) by Toiu et al. (2017). Another study performed by Movahhedin et al. (2016) revealed that ethanol extract of Ajuga chamaecistus subsp. scoparia (Boiss.) Rech.f. aerial parts (6.5 g extract obtained from 50 g plant material) had a TPC value of 20.32 ± 0.39 mg GAE/g extract (representing 2.64 mg GAE/g dw), and the water extract had TPC values of 18.94 ± 0.13 mg GAEs/g extract, which is lower than both previously considered Ajuga species.
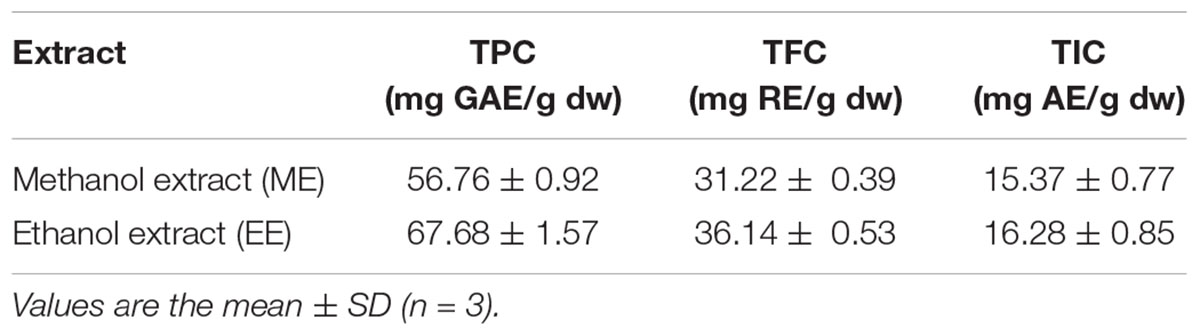
TABLE 1. TPC, TFC and TIC in A. laxmannii extracts (±SD).
The TFC for ethanol extract of A. laxmannii (36.14 ± 0.53 mg RE/g dw), was lower than the one reported for the ethyl acetate, methanol and acetone extract of A. chamaepitys (L.) Schreb (91.76 ± 0.81, 63.87 ± 0.66, and 61.77 ± 0.51 mg RE/g, respectively), and considerably higher than the water extract from same species (9.32 ± 0.33 mg RE/g) (Jakovljević, 2015). However, a clear comparison between the results of the present study is rather impossible, due to different extraction protocols and ways of expressing results.
In previous studies, Toiu et al. (2017) found a TFC value of 12.38 ± 0.22 mg RE/g dw for a methanol extract of A. reptans flowers.
Concerning the TIC of different species of Ajuga, the available data is limited. In a former research on A. reptans flowers, Toiu et al. (2017) revealed that the methanol extract content in iridoids is lower than ethanol extract from the same species (22.17 ± 0.89 vs. 27.49 ± 0.94 mg AE/g dw). The same trend was observed in this study for the A. laxmannii, the TIC being 15.37 ± 0.77 and 16.28 ± 0.85 mg AE/g dw for methanol and ethanol extract, respectively.
Identification and Quantification of Polyphenolic Compounds
In order to determine the polyphenolic compounds from A. laxmannii extracts, an optimized HPLC/MS method for the identification and quantification of 18 polyphenols was employed. The A. laxmannii extracts contain one caffeic acid derivative (chlorogenic acid), corresponding to peak 1, with m/z 353, three flavonoid glycosides (isoquercitrin, rutin, and quercitrin), corresponding to peaks 2, 3, and 4, with m/z 463, 609, and 447, respectively. Additionally, two free aglycones (luteolin and apigenin), with m/z 285 and 279, corresponding to peaks 5 and 6 were identified.
The HPLC chromatogram of A. laxmannii ethanol extract (Figure 1), and the amounts of polyphenols identified in the analyzed extracts expressed as μg/g dw are presented (Table 2).
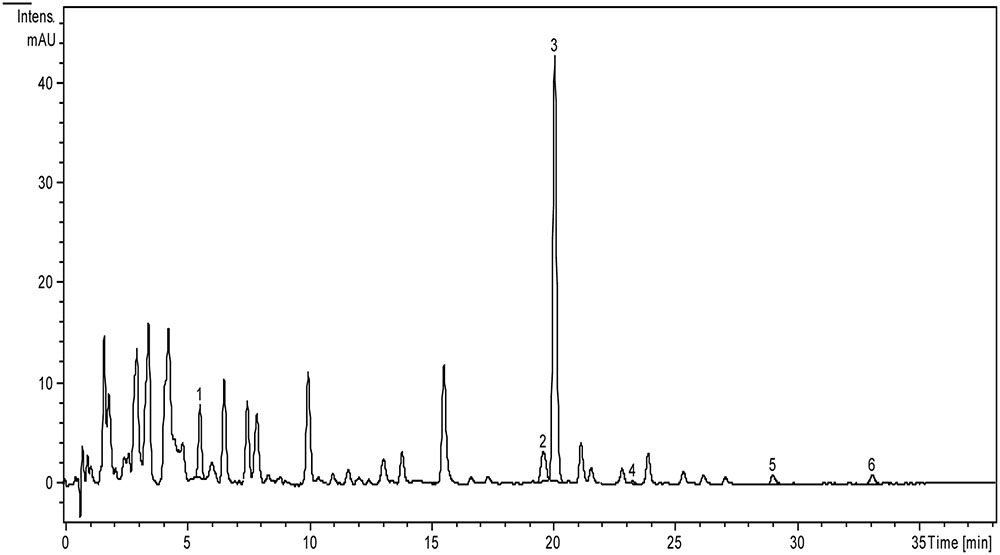
FIGURE 1. HPLC chromatogram of polyphenols from A. laxmannii aerial parts extract. The identified compounds: chlorogenic acid (1), isoquercitrin (2), rutin (3), quercitrin (4), luteolin (5), apigenin (6).
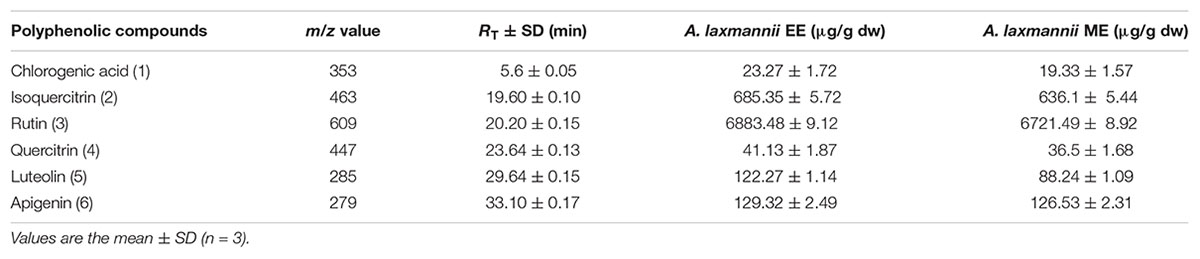
TABLE 2. The content of polyphenolic compounds in A. laxmannii extracts by HPLC (μg/g dw).
Rutin, an important flavonoid glycoside, was the major compound found in a significant quantity, both in ethanol and methanol extract (6883.48 ± 9.12 and 6721.49 ± 8.92 μg/g dw, respectively). Various studies showed the effectiveness of rutin in various diseases such as inflammatory bowel disease and Alzheimer’s disease (Kim et al., 2005; Xu et al., 2014). Another flavonoid glycoside compound which was found and quantified in ethanol and methanol A. laxmannii extracts was isoquercitrin, which is known to have good anti-inflammatory effects (Rogerio et al., 2007). The quantities obtained are significant lower than those obtained for rutin, but still important (685.35 ± 5.72 and 636.1 ± 5.44 μg/g dw), for ethanol and methanol extracts, respectively.
Considering the correlation between the type of the extract and the quantity of a particular compound, with one exception, all extracts showed similar values. Only in case of luteolin, the methanol extract showed a lower value than the ethanol extract (88.24 ± 1.09 vs. 122.27 ± 1.14 μg/g dw).
Identification and Quantification of Phytosterols
Under the proposed chromatographic conditions, retention times of the five analyzed sterols were: 3.2 min for ergosterol, 3.9 min for brassicasterol, 4.9 min for stigmasterol and campesterol (co-elution) and 5.7 min for β-sitosterol. The ions monitorized in the MS method are presented in Table 3. In the ionization conditions all sterols have lost a water molecule, therefore the ions detected by the mass spectrometer are always in the form [M-H2O+H]+.
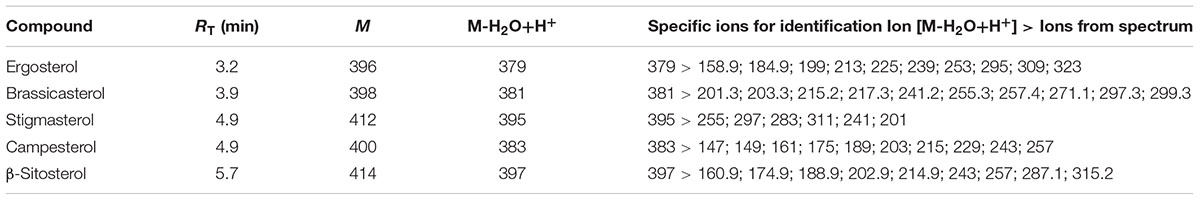
TABLE 3. Characteristic ions of standard sterols in full scan mode by LC-MS/MS.
The pseudo-molecular ions of sterols (379 for ergosterol, 381 for brassicasterol, 395 for stigmasterol, 383 for campesterol, and 397 for β-sitosterol) have been fragmented, and based on their daughter ions from the MS spectrum the extracted chromatograms of each compound were constructed. The method can also be applied for quantitative determination because the intensity of ions in the mass spectrum is proportional to the concentration of the substance in the sample.
In order to quantify the five sterols from A. laxmannii extracts (EE, PEE, CE), we have constructed the extracted chromatograms for each compound, taking into account the intensity of major ions in the mass spectrum (Table 3).
Calibration curves were obtained from standard solutions at different concentration levels, selected as representative of the range of concentration in the sample. Regression analysis of various concentrations of standard solutions (0.08–8 μg/mL) gave good correlation coefficients for the calibration curves of sterols. Concentrations of phytosterols in A. laxmannii extracts are presented in Table 4. Significant differences between the three A. laxmannii extracts were observed: all five sterols were identified in CE, whereas the EE contains β-sitosterol, stigmasterol, ergosterol and brassicasterol and PEE contains campesterol, stigmasterol, ergosterol and brassicasterol. The A. laxmannii CE was the richest in phytosterols, with β-sitosterol as major compound in very high concentration (11589.96 ± 8.66 μg/mL), while in EE it was found in smaller quantities (367.24 ± 2.97 μg/mL), and in PEE campesterol was the main sterol (598.04 ± 4.22 μg/mL). The concentrations of stigmasterol, ergosterol, and brassicasterol were comparable in all three extracts. To the best of our knowledge, this is the first report on phytosterols from A. laxmannii aerial parts extracts. Previous studies showed the presence of stigmasterol and β-sitosterol in other Ajuga species, such as A. bracteosa, A. relicta, A. taiwanensis (Israili and Lyoussi, 2009).
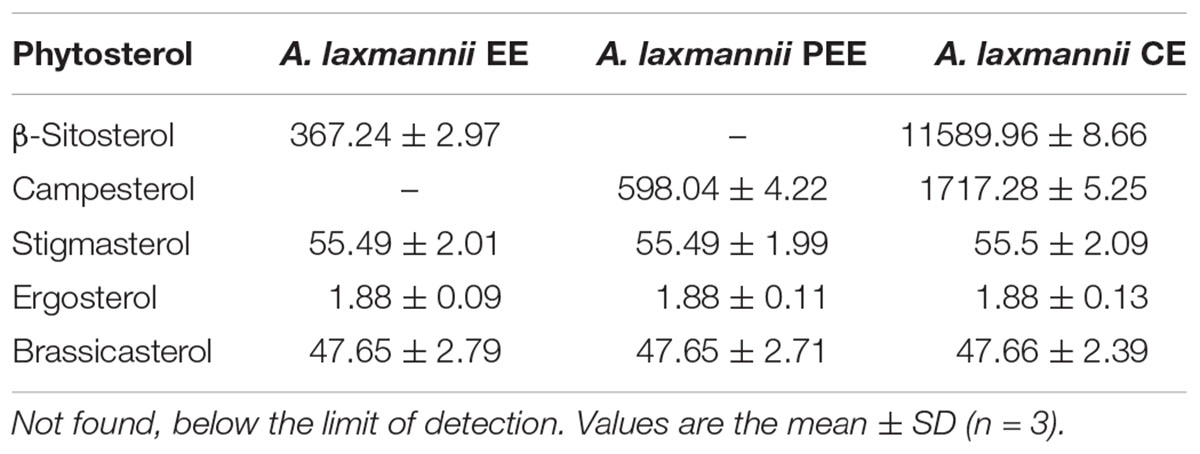
TABLE 4. The content in sterols in A. laxmannii extracts (μg/mL extract).
Identification and Quantification of Iridoids
Iridoids are important compounds for the genus Ajuga, and many Ajuga species contain the iridoid glycoside harpagide (Manguro et al., 2011; Mamadalieva et al., 2013). The main known ethnopharmacological indications for Ajuga species are oedema, hypertension, fever, intestinal and biliary disorders, ulcer, they are used as antipyretic, diuretic, and astringent (Toiu et al., 2017), and several studies have shown that iridoid glycosides in Ajuga species are linked to this therapeutic effects (Makni et al., 2013; Hailu and Engidawork, 2014). The HPLC-MS results from the present study show the characterization of Ajuga laxmannii aerial parts in five commercially available iridoid glycosides, namely aucubin, catalpol, harpagide, harpagoside, and 8-O-acetylharpagide. From a pharmaceutical point of view, the concentrations of the compounds determined in plant extract cannot be neglected as they are directly linked to their pharmaceutical efficacy and effectiveness. 8-O-acetylharpagide was the major compound found in ethanol extract (266.3 ± 3.92 μg/mL extract), followed by harpagide (87.4 ± 2.39 μg/mL extract). The concentrations of aucubin and catalpol (7.2 ± 0.41 and 3.1 ± 0.23 μg/mL ethanol extract, respectively) were significantly lower than the other iridoids. We observed that A. laxmannii aerial parts ethanol extract contains higher amounts of iridoids than methanol extract (Table 5). As far as one can tell, this is the first report of a rapid, simple and highly accurate HPLC-MS/MS method for the identification and quantification of iridoids from A. laxmannii extracts.
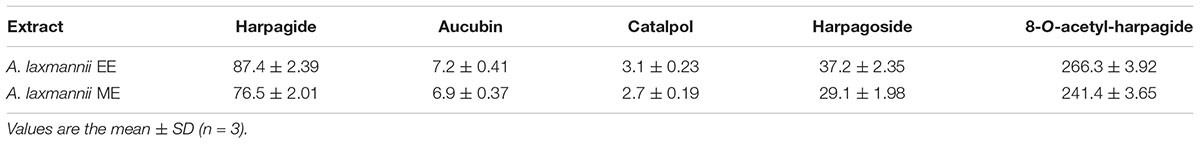
TABLE 5. The quantification of iridoids in A. laxmannii extracts (μg/mL extract).
Antioxidant Activity
DPPH and ABTS Radical Scavenging Activity
Several studies showed that the number and position of the substituents on the aromatic ring affects the antioxidant properties of phenolics; different substituents affect the reactivity and thus, the antioxidant capacity of the phenolic compounds (Shahidi and Ambigaipalan, 2015).
The DPPH and ABTS radical scavenging assays are reliable and commonly used methods for evaluation of the radical scavenging activity. These measurements are based on the reduction of radical species by electron-transferring or hydrogen-donating radical scavengers. DPPH• method is used for anion radicals and ABTS•+ is used for cation radicals. DPPH• is a stable free radical, the largest absorbance occurs at 517 nm, and when it reacts with antioxidants free radicals its absorbance decreases.
The antioxidant activity of A. laxmannii was investigated for the first time and the IC50 values were determined: 22.64 ± 0.88 and 24.89 ± 0.83 μg/mL for ethanol and methanol extract, respectively, while for Trolox 11.2 ± 0.21 μg/mL (Table 6). In comparison with other research, A. laxmannii showed a higher antiradical capacity. For example, a study concerning antioxidant capacity of A. turkestanica reported a value of 57.84 ± 4.19 μg/mL (Mamadalieva et al., 2013), whereas a similar study concerning A. reptans reported a slightly higher value (65.7 ± 3.82 μg/mL) (Ono et al., 2011). A similar antiradical activity was reported by Movahhedin et al. (2016) for A. chamaecistus subsp. scoparia (Boiss.) Rech.f. (22.69 ± 1.30 μg/mL).
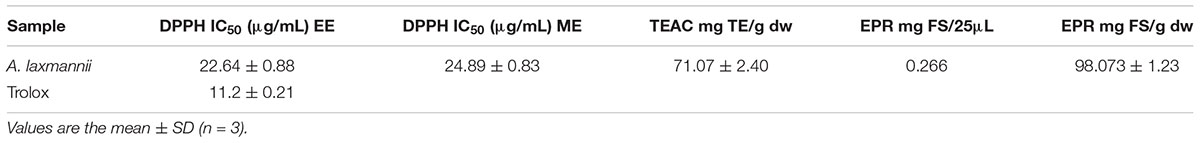
TABLE 6. DPPH, TEAC, EPR activity of A. laxmannii (mean ± SD).
2,2′-Azino-bis-(3-ethylbenzothiazoline-6-sulfonic acid) (ABTS) is another free radical used for evaluation of antioxidant capacity. In the ABTS•+ (TEAC) scavenging assay, the value of antiradical capacity of A. laxmannii ethanol extract was 71.07 ± 2.40 mg TE/g extract (Table 6), which is higher than the one reported by Movahhedin et al. (2016) for A. chamaecistus subsp. scoparia (Boiss.) Rech.f. (53.87 ± 2.11 mg TE/g extract).
Electron Paramagnetic Resonance (EPR) Spectroscopy
To support the results from the TEAC assay, the Ajuga laxmannii ethanol extract was additionally analyzed using EPR with Fremy’s salt as a stable radical. EPR is a very common method to assess the antioxidant activity of different samples. The main advantage of this assay is the matrix-independent measurement of the reaction between potential antioxidants and radicals in an electro-magnetic field instead of the absorbance of light (Yu and Cheng, 2008). The degraded amount of Fremy’s salt after 30 min incubation time was 98.07 ± 1.23 mg FS/g extract (Table 6). The EPR is a common, well-characterized, established methodology for detecting radicals and their kinetics. Unfortunately, it is not so frequently used in combination with other assays to detect the overall antioxidant activity. Therefore, in this case, a comparison with the results of other researchers with regard to other Ajuga species is lacking.
Antibacterial Activity
The obtained results for the antibacterial activity of A. laxmannii extracts and gentamicin against Gram+ and Gram- bacteria are presented in Table 7. The antimicrobial effect was measured by microdilution assay, and the determination of MIC (mg/mL) and MBC (mg/mL) was assessed.
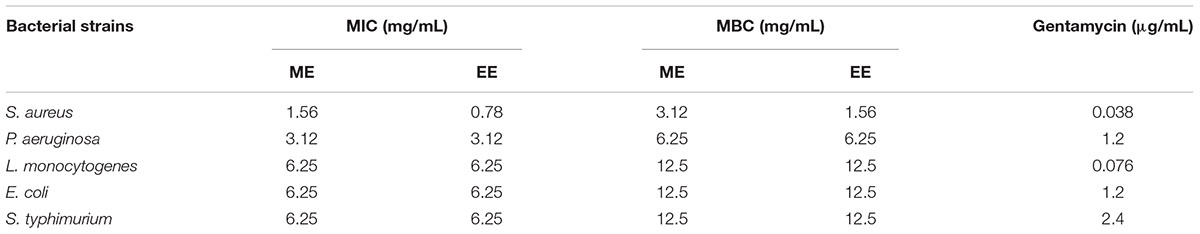
TABLE 7. Antibacterial activity of A. laxmannii extracts (MIC, MBC).
The MIC values obtained for the ethanol extract ranged from 0.78 to 6.25 mg/mL, and from 1.56 to 6.25 mg/mL for the methanol extract of A. laxmannii. Against some bacterial strains, such as Pseudomonas aeruginosa, Listeria monocytogenes, Escherichia coli and Salmonella typhimurium, both extracts showed comparable activities. The best antimicrobial activity against S. aureus is associated with A. laxmannii ethanol extract (MIC value = 0.78 mg/mL and MBC value = 1.56 mg/mL). The less susceptible strains were: Listeria monocytogenes, Escherichia coli and Salmonella typhimurium, for both methanol and ethanol extracts. Previous studies showed a similar trend in terms of MIC and MBC for A. reptans (Toiu et al., 2017). According to Salvat et al. (2004), herbal extracts with MIC values less than/around 0.50 mg/mL indicate good antimicrobial effect. Consequently, the results presented herein showed moderate antibacterial activity.
Generally, the bacterial strains were more sensitive to ethanol extract of A. laxmannii. Considering HPLC–MS results presented in this study, we can derive some assumptions regarding antibacterial activity of A. laxmannii aerial parts. The content of polyphenolic compounds in ethanol extract of A. laxmannii was higher than in methanol extract. Many recent investigations confirmed antibacterial and antifungal properties of phenolic compounds from plant origin, among which are the main constituents of examined extracts (rutin and isoquercitrin) (Alves et al., 2013; Stojković et al., 2013). The exerted antibacterial potential of A. laxmannii could be associated with higher level of mentioned phenolic compounds in ethanol extract.
Antifungal Activity
The antifungal activity of the A. laxmannii extracts (EE, PEE, and CE) was tested against a panel of five fungi, selected on the basis of their relevance for public health. The results obtained for the antifungal efficacy of A. laxmannii extracts and fluconazole against tested strains are presented in Table 8. Candida parapsilosis possessed the highest sensitivity to the ethanolic extract of A. laxmannii, with MIC = 0.012 mg/mL and MFC = 0.025 mg/mL. Moreover, Candida albicans and Penicillium funiculosum were similarly susceptible to the inhibitory (MICs = 0.012 mg/mL) and fungicidal effects (MFCs = 0.025 mg/mL) of the chloroform extract. Nonetheless, the most resistant fungal strains were Candida parapsilosis and Candida albicans, toward petroleum ether extract with MFCs 0.5 and 0.2 mg/mL, respectively. According to Kawamura and Ohara (2005), the antifungal activity of plant extracts might be ascribed to the high level of iridoids. Both methanol and ethanol extracts from A. laxmannii aerial parts showed high values for iridoid glycosides, especially for 8-O-acetylharpagide. These results are in accordance to previous studies performed by Makni et al. (2013), who similarly demonstrated the antifungal effect of A. iva extracts.
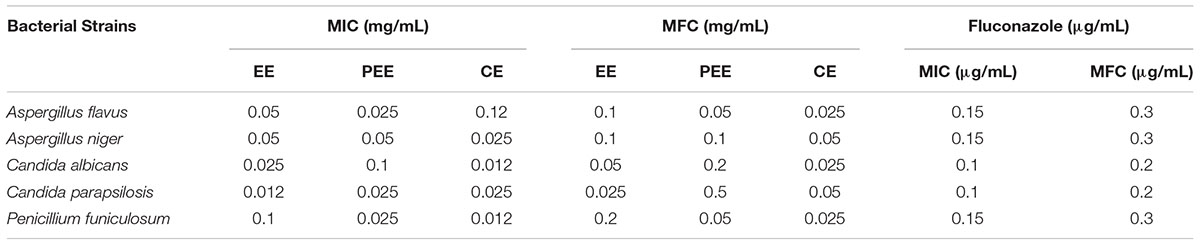
TABLE 8. Antifungal activity of A. laxmannii extracts (MIC, MFC).
Anti-inflammatory Activity
The anti-inflammatory effects of three A. laxmannii ethanol extract concentrations (25 mg dw/mL, 50 mg dw/mL, and 100 mg dw/mL) were evaluated in vivo on a model turpentine oil-induced inflammation in rats by determining WBC count, differential WBC count, serum total nitrites and nitrates, TOS, TAR and OSI. These three extract dilutions were also evaluated in vitro for the ability to inhibit phagocytosis. The 50 mg dw/mL diluted extract had the best inhibitory activity on phagocytosis and oxidative stress. In conclusion, these results support the hypothesis that extracts from A. laxmannii aerial parts exert anti-inflammatory activities by inhibiting phagocytosis through the reduction of oxidative stress (Table 9).
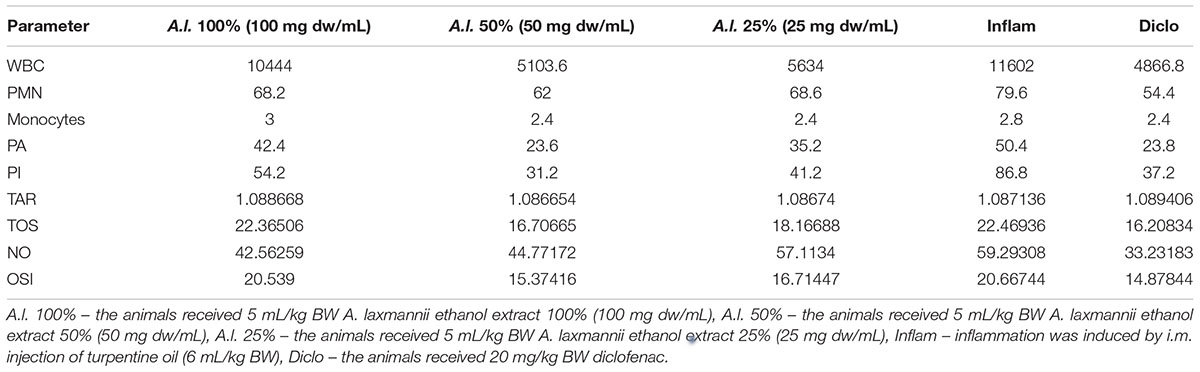
TABLE 9. Anti-inflammatory activity of A. laxmannii extracts (WBC, PMN, Monocytes, PA, PI, TAR, TOS, NO, OSI).
Compared to the inflammation group, A. laxmannii ethanol extracts significantly reduced (p < 0.001) total WBC count (Figure 2) by lowering PMN% (Figures 3, 4). That was associated with an important decrease of the phagocytosis indices PA (Figure 5) and PI (Figure 6) (p < 0.001). Extracts 50 mg dw/mL and 25 mg dw/mL had the best inhibitory effects (p < 0.001) and this was comparable to diclofenac activity (p > 0.05).
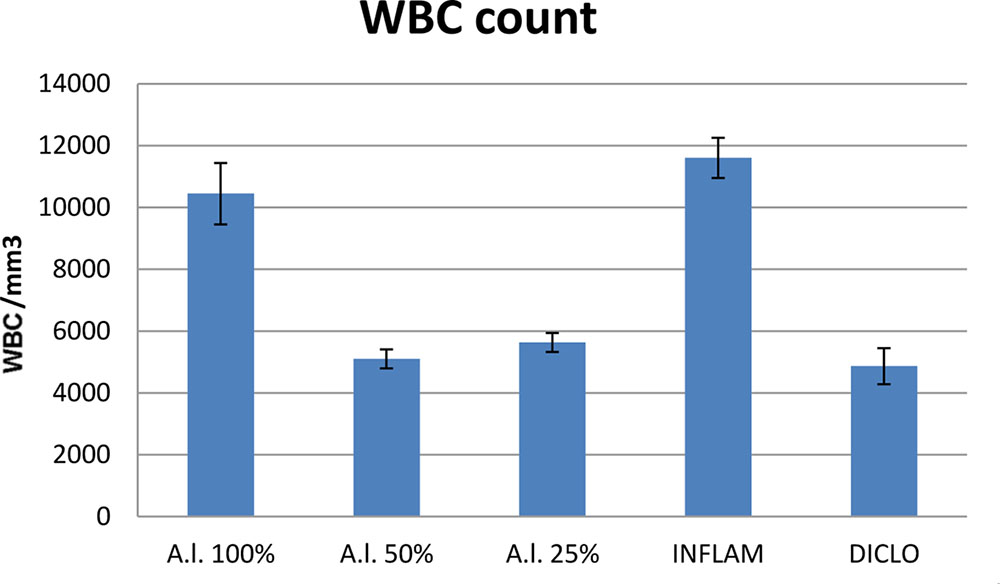
FIGURE 2. White blood cells (WBC) count. A.l. 100% – the animals received 5 mL/kg BW A. laxmannii ethanol extract 100% (100 mg dw/mL), A.l. 50% – the animals received 5 mL/kg BW A. laxmannii ethanol extract 50% (50 mg dw/mL), A.l. 25% – the animals received 5 mL/kg BW A. laxmannii ethanol extract 25% (25 mg dw/mL), Inflam – inflammation was induced by i.m. injection of turpentine oil (6 mL/kg BW), Diclo – the animals received 20 mg/kg BW diclofenac (p < 0.001).
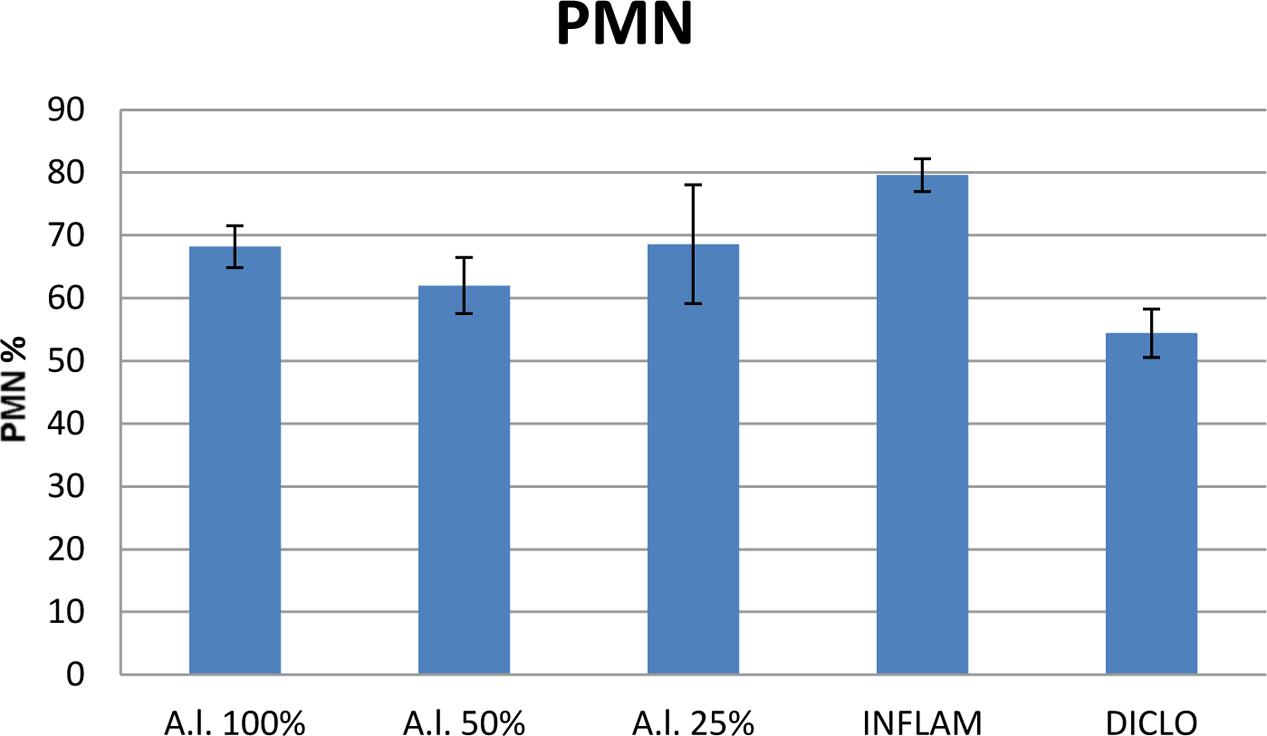
FIGURE 3. Polymorphonuclear leukocytes (PMN). A.l. 100% – the animals received 5 mL/kg BW A. laxmannii ethanol extract 100% (100 mg dw/mL), A.l. 50% – the animals received 5 mL/kg BW A. laxmannii ethanol extract 50% (50 mg dw/mL), A.l. 25% – the animals received 5 mL/kg BW A. laxmannii ethanol extract 25% (25 mg dw/mL), Inflam – Inflammation was induced by i.m. injection of turpentine oil (6 mL/kg BW), Diclo – the animals received 20 mg/kg BW diclofenac (p < 0.001).
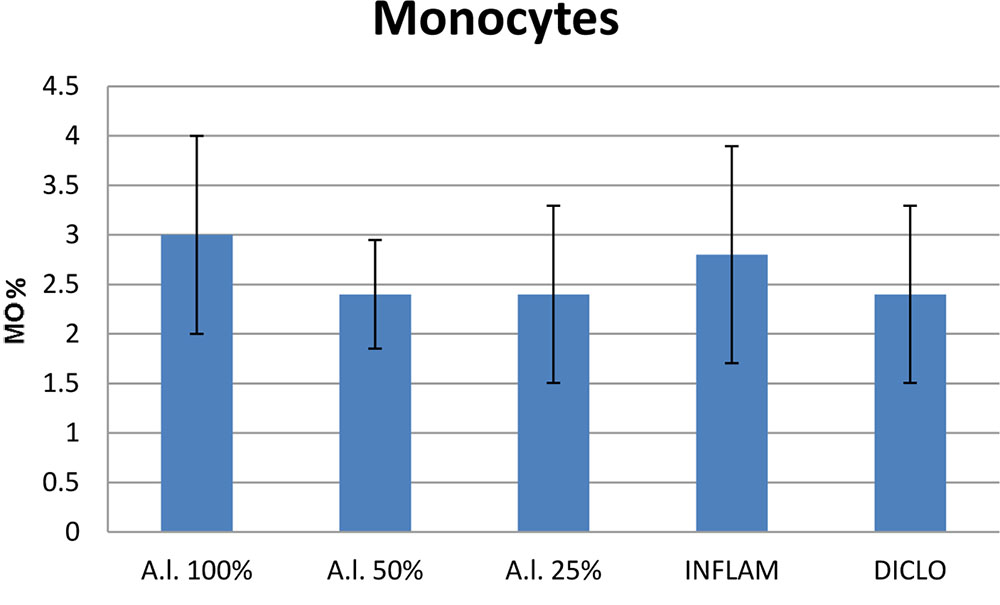
FIGURE 4. Total number of monocytes. A.l. 100% – the animals received 5 mL/kg BW A. laxmannii ethanol extract 100% (100 mg dw/mL), A.l. 50% – the animals received 5 mL/kg BW A. laxmannii ethanol extract 50% (50 mg dw/mL), A.l. 25% – the animals received 5 mL/kg BW A. laxmannii ethanol extract 25% (25 mg dw/mL), Inflam – Inflammation was induced by i.m. injection of turpentine oil (6 mL/kg BW), Diclo – the animals received 20 mg/kg BW diclofenac (p < 0.001).

FIGURE 5. Phagocytic activity (PA) of A. laxmannii extract. A.l. 100% – the animals received 5 mL/kg BW A. laxmannii ethanol extract 100% (100 mg dw/mL), A.l. 50% – the animals received 5 mL/kg BW A. laxmannii ethanol extract 50% (50 mg dw/mL), A.l. 25% – the animals received 5 mL/kg BW A. laxmannii ethanol extract 25% (25 mg dw/mL), Inflam – Inflammation was induced by i.m. injection of turpentine oil (6 mL/kg BW), Diclo – the animals received 20 mg/kg BW diclofenac (p < 0.001).
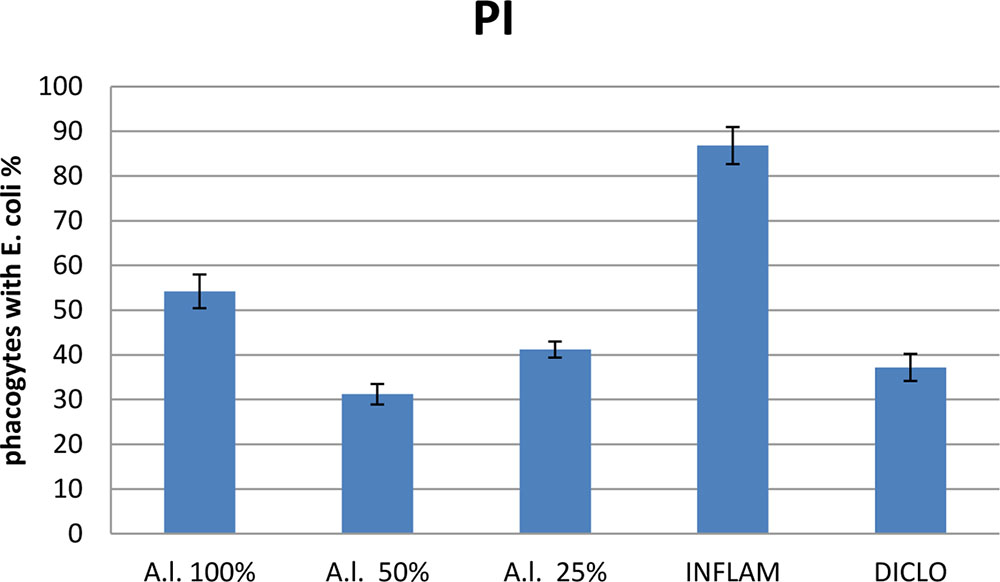
FIGURE 6. Phagocytic index (PI) of A. laxmannii extract. A.l. 100% – the animals received 5 mL/kg BW A. laxmannii ethanol extract 100% (100 mg dw/mL), A.l. 50% – the animals received 5 mL/kg BW A. laxmannii ethanol extract 50% (50 mg dw/mL), A.l. 25% – the animals received 5 mL/kg BW A. laxmannii ethanol extract 25% (25 mg dw/mL), Inflam – Inflammation was induced by i.m. injection of turpentine oil (6 mL/kg BW), Diclo – the animals received 20 mg/kg BW diclofenac (p < 0.001).
Turpentine-induced inflammation significantly increased (p < 0.001) and treatment with diclofenac significantly reduced (p < 0.001) the TOS (Figure 7). Importantly, the TOS was also reduced by the treatment with all dilutions of the A. laxmannii extract. The inhibitory effects were strongest for the 50 mg dw/mL (p < 0.001) and 25 mg dw/mL (p < 0.01) plant extracts. Diclofenac treatment had a similar effect on TOS inhibition (p < 0.01) compared to treatment with either the 25 mg dw/mL (p < 0.01) or the 50 mg dw/mL (p < 0.01) extract. The A. laxmannii extract had no important effect on TAR (Figure 8) (p > 0.05).
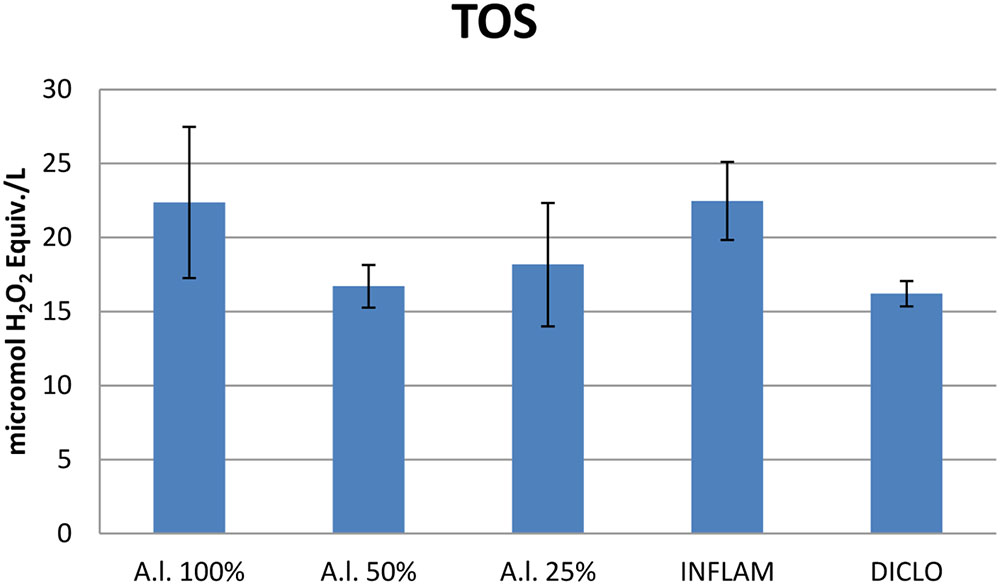
FIGURE 7. Total oxidative status (TOS). A.l. 100% – the animals received 5 mL/kg BW A. laxmannii ethanol extract 100% (100 mg dw/mL), A.l. 50% – the animals received 5 mL/kg BW A. laxmannii ethanol extract 50% (50 mg dw/mL) (p < 0.001), A.l. 25% – the animals received 5 mL/kg BW A. laxmannii ethanol extract 25% (25 mg dw/mL) (p < 0.01), Inflam – Inflammation was induced by i.m. injection of turpentine oil (6 mL/kg BW), Diclo – the animals received 20 mg/kg BW diclofenac (p < 0.001).
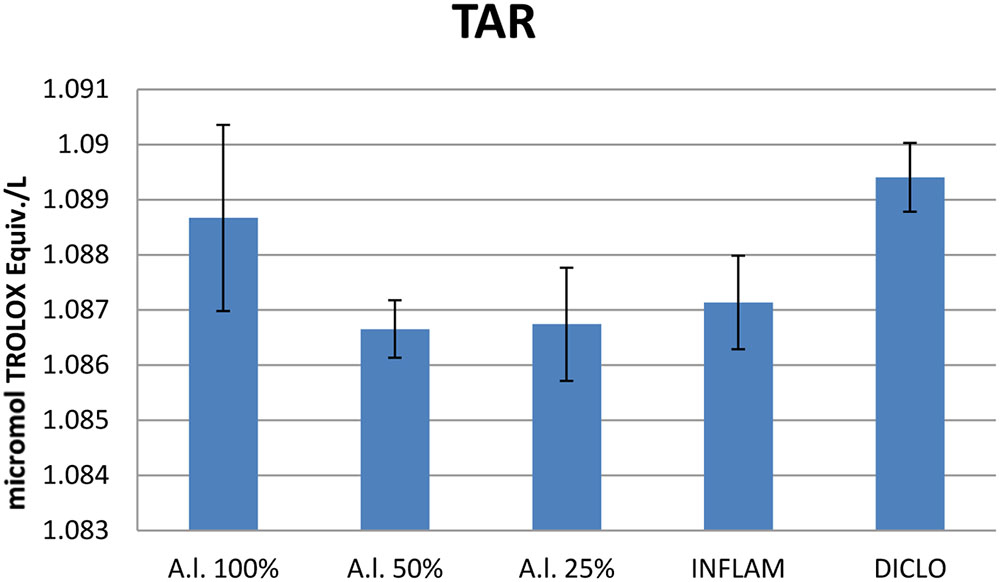
FIGURE 8. Total antioxidant response (TAR). A.l. 100% – the animals received 5 mL/kg BW A. laxmannii ethanol extract 100% (100 mg dw/mL), A.l. 50% – the animals received 5 mL/kg BW A. laxmannii ethanol extract 50% (50 mg dw/mL), A.l. 25% – the animals received 5 mL/kg BW A. laxmannii ethanol extract 25% (25 mg dw/mL), Inflam – Inflammation was induced by i.m. injection of turpentine oil (6 mL/kg BW), Diclo – the animals received 20 mg/kg BW diclofenac (p > 0.05).
In the inflammation group, the OSI was significantly elevated (p < 0.001), and diclofenac treatment decreased the OSI (p < 0.001) (Figure 9). The 25 mg dw/mL and 50 mg dw/mL extracts of A. laxmannii aerial parts induced a significant decline in OSI (p < 0.001). The 50 mg dw/mL extract was the best OSI inhibitor (p < 0.001). The 50 mg dw/mL (p < 0.001) and 25 mg dw/mL (p < 0.01) A. laxmannii extract dilutions significantly reduced NOx (Figure 10). The OSI correlated with the TOS (r = 0.92) and NOx (r = 0.81).
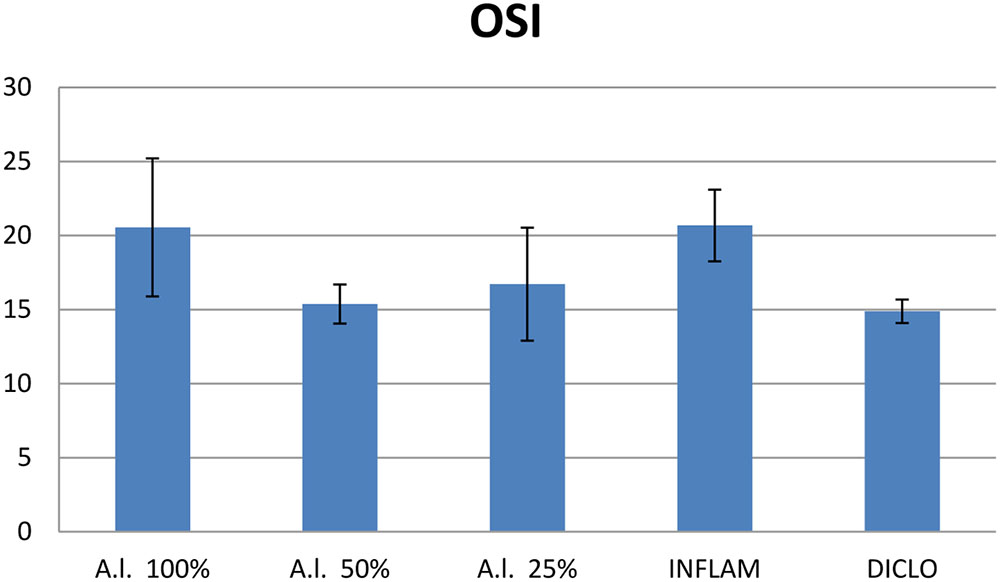
FIGURE 9. Oxidative stress index (OSI). A.l. 100% – the animals received 5 mL/kg BW A. laxmannii ethanol extract 100% (100 mg dw/mL), A.l. 50% – the animals received 5 mL/kg BW A. laxmannii ethanol extract 50% (50 mg dw/mL), A.l. 25% – the animals received 5 mL/kg BW A. laxmannii ethanol extract 25% (25 mg dw/mL), Inflam – Inflammation was induced by i.m. injection of turpentine oil (6 mL/kg BW), Diclo – the animals received 20 mg/kg BW diclofenac (p < 0.001).
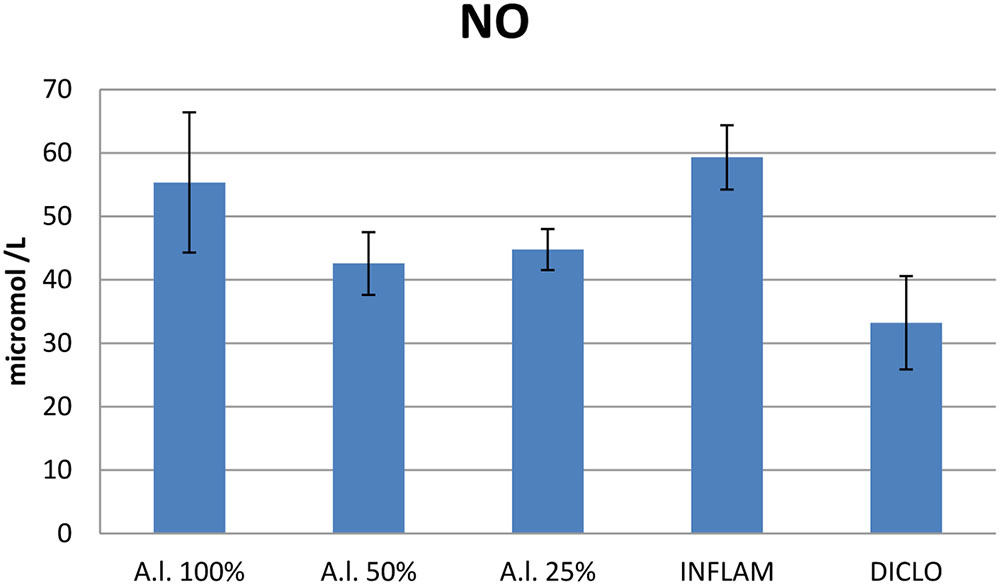
FIGURE 10. NO synthesis. A.l. 100% – the animals received 5 mL/kg BW A. laxmannii ethanol extract 100% (100 mg dw/mL), A.l. 50% – the animals received 5 mL/kg BW A. laxmannii ethanol extract 50% (50 mg dw/mL), A.l. 25% – the animals received 5 mL/kg BW A. laxmannii ethanol extract 25% (25 mg dw/mL), Inflam – Inflammation was induced by i.m. injection of turpentine oil (6 mL/kg BW), Diclo – the animals received 20 mg/kg BW diclofenac (p < 0.001).
Compared to diclofenac treatment, A. laxmannii extract had a lower anti-inflammatory and anti-nitro-oxidative stress effect upon all measured parameters (p < 0.001). Among the three extracts, the 50 mg dw/mL A. laxmannii one had the best effect in comparison with diclofenac.
Conclusion
In the present study, the chemical composition, antioxidant, antimicrobial, and anti-inflammatory properties of different A. laxmannii (from Romania) extracts were evaluated for the first time. The major identified compounds were rutin, 8-O-acetylharpagide and β-sitosterol. The content in polyphenolic compounds, iridoids and phytosterols could be correlated with the evaluated pharmacological effects. The antioxidant activity of A. laxmannii extracts was assessed using several methods, and results showed good antiradical effects. The results of the antimicrobial evaluation showed a potent antifungal activity against C. albicans and P. funiculosum. The anti-inflammatory effect was determined by monitoring some parameters involved in the inflammatory process, and these findings could indicate a possible mechanism of action. The obtained results showed differences between the analyzed extracts; and therefore the importance of choosing the best solvent in order to extract the appropriate amounts of bioactive compounds. A. laxmannii ethanol extract possessed anti-inflammatory effect by reducing total leukocytes, PMN, phagocytosis, and oxidative stress. Compared to diclofenac, only the 50 mg/mL A. laxmannii extract showed better anti-inflammatory and anti-oxidative stress effects, and this could justify the importance of the correlation between the activity and the dose. The results confirm the use of A. laxmannii in traditional medicine as an anti-inflammatory agent. Further research is needed in order to deeply comprehend the bioavailability and how processes are involved in the metabolic pathways.
Author Contributions
AT, AM, LV, AP, DV, A-MG, and IO conceived and designed the structure of the manuscript and data collection. AT, AM, CM, and AP drafted and revised the manuscript. AT, AM, and IO critically reviewed the manuscript. All authors have seen and agreed on the final version of the manuscript.
Conflict of Interest Statement
The authors declare that the research was conducted in the absence of any commercial or financial relationships that could be construed as a potential conflict of interest.
Acknowledgments
AT acknowledges the support by UEFISCDI, Romania, project no. PNII-RU-TE-2014-4-1247.
References
Abuajah, C. I., Ogbonna, A. C., and Osuji, C. M. (2014). Functional components and medicinal properties of food: a review. J. Food Sci. Technol. 52, 2522–2529. doi: 10.1007/s13197-014-1396-5
Alves, M. J., Ferreira, I. C., Froufe, H. J., Abreu, R. M., Martins, A., and Pintado, M. (2013). Antimicrobial activity of phenolic compounds identified in wild mushrooms, SAR analysis and docking studies. J. Appl. Microbiol. 115, 346–357. doi: 10.1111/jam.12196
Andriamadio, J. H., Rasoanaivo, L. H., Benedec, D., Vlase, L., Gheldiu, A. M., Duma, M., et al. (2015). HPLC/MS analysis of polyphenols, antioxidant and antimicrobial activities of Artabotrys hildebrandtii O. Hffm. extracts. Nat. Prod. Res. 29, 2188–2196. doi: 10.1080/14786419.2015.1007458
Araniciu, C., Parvu, A. E., Palage, M. D., Oniga, S. D., Benedec, D., Oniga, I., et al. (2014). The effect of some 4,2 and 5,2 bisthiazole derivatives on nitro-oxidative stress and phagocytosis in acute experimental inflammation. Molecules 19, 9240–9256. doi: 10.3390/molecules19079240
Atanasov, A. G., Waltenberger, B., Pferschy-wenzig, E., Linder, T., Wawrosch, C., Uhrin, P., et al. (2015). Discovery and resupply of pharmacologically active plant-derived natural products?: a review. Biotechnol. Adv. 33, 1582–1614. doi: 10.1016/j.biotechadv.2015.08.001
Atay, I., Kirmizibekmez, H., Kaiser, M., Akaydin, G., Yesilada, E., and Tasdemir, D. (2016). Evaluation of in vitro antiprotozoal activity of Ajuga laxmannii and its secondary metabolites. Pharm. Biol. 54, 1808–1814. doi: 10.3109/13880209.2015.1129542
Barakat, H., and Rohn, S. (2014). Effect of different cooking methods on bioactive compounds in vegetarian, broccoli-based bars. J. Funct. Foods 11, 407–416. doi: 10.1016/j.jff.2014.10.009
Cocquyt, K., Cos, P., Herdewijn, P., Maes, L., Van Den Steen, P. E., and Laekeman, G. (2011). Ajuga remota Benth.: from ethnopharmacology to phytomedical perspective in the treatment of malaria. Phytomedicine 18, 1229–1237. doi: 10.1016/j.phymed.2011.08.063
El-Hilaly, J., Tahraoui, A., Israili, Z. H., and Lyoussi, B. (2006). Hypolipidemic effects of acute and sub-chronic administration of an aqueous extract of Ajuga iva L. whole plant in normal and diabetic rats. J. Ethnopharmacol. 105, 441–448. doi: 10.1016/j.jep.2005.11.023
Erdenechimeg, C., Guiqide, A., Dejidmaa, B., Chimedragchaa, C., and Purevsuren, S. (2017). Total phenolic, flavonoid, alkaloid and iridoid content and preventive effect of Lider-7-tang on lipopolysaccharide-induced acute lung injury in rats. Braz. J. Med. Biol. Res. 50, 6–11. doi: 10.1590/1414-431x20175916
Erel, O. (2004). A novel automated method to measure total antioxidant response against potent free radical reactions. Clin. Biochem. 37, 112–119. doi: 10.1016/j.clinbiochem.2003.10.014
Erel, O. (2005). A new automated colorimetric method for measuring total oxidant status. Clin. Biochem. 38, 1103–1111. doi: 10.1016/j.clinbiochem.2005.08.008
Ferrante, C., Recinella, L., Locatelli, M., Guglielmi, P., Secci, D., Leporini, L., et al. (2017). Protective effects induced by microwave-assisted aqueous harpagophytum extract on rat cortex synaptosomes challenged with amyloid β-peptide. Phyther. Res. 31, 1257–1264. doi: 10.1002/ptr.5850
Francischi, J. N., Frade, T. I. C., Almeida, M. P. A., Queiroz, B. F. G., and Bakhle, Y. S. (2017). Ketamine-xylazine anaesthesia and orofacial administration of substance P: a lethal combination in rats. Neuropeptides 62, 21–26. doi: 10.1016/j.npep.2017.01.003
Gautam, R., Jachak, S. M., and Saklani, A. (2011). Anti-inflammatory effect of Ajuga bracteosa Wall Ex Benth. mediated through cyclooxygenase (COX) inhibition. J. Ethnopharmacol. 133, 928–930. doi: 10.1016/j.jep.2010.11.003
Hailu, W., and Engidawork, E. (2014). Evaluation of the diuretic activity of the aqueous and 80% methanol extracts of Ajuga remota Benth (Lamiaceae) leaves in mice. BMC Complement. Altern. Med. 14:135. doi: 10.1186/1472-6882-14-135
Harma, M., Harma, M., and Erel, O. (2003). Increased oxidative stress in patients with hydatidiform mole. Swiss Med. Wkly. 133, 563–566.
Israili, Z. H., and Lyoussi, B. (2009). Ethnopharmacology of the plants of genus Ajuga. Pak. J. Pharm. Sci. 22, 425–462.
Jakovljević, D. Z., Vasić, S. M., Stanković, M. S., Čomić, L. R., and Topuzović, M. D. (2015). Secondary metabolite content and in vitro biological effects of Ajuga chamaepitys (L.) Schreb. subsp. chamaepitys. Arch. Biol. Sci. 67, 1195–1202. doi: 10.2298/ABS150225095J
Kawamura, F., and Ohara, S. (2005). Antifungal activity of iridoid glycosides from the heartwood of Gmelina arborea. Holzforschung 59, 153–155. doi: 10.1515/HF.2005.023
Kayani, W. K., Dilshad, E., Ahmed, T., Ismail, H., and Mirza, B. (2016). Evaluation of Ajuga bracteosa for antioxidant, anti-inflammatory, analgesic, antidepressant and anticoagulant activities. BMC Complement. Altern. Med. 16:375. doi: 10.1186/s12906-016-1363-y
Kim, H., Kong, H., Choi, B., Yang, Y., Kim, Y., Mi, J. L., et al. (2005). Metabolic and pharmacological properties of rutin, a dietary quercetin glycoside, for treatment of inflammatory bowel disease. Pharm. Res. 22, 1499–1509. doi: 10.1007/s11095-005-6250-z
Liao, B.-Y., Zhu, D.-Y., Thakur, K., Li, L., Zhang, J.-G., and Wei, Z.-J. (2017). Thermal and antioxidant properties of polysaccharides sequentially extracted from mulberry leaves (Morus alba L.). Molecules 22:E2271. doi: 10.3390/molecules22122271
Locatelli, M., Ferrante, C., Carradori, S., Secci, D., Leporini, L., Chiavaroli, A., et al. (2017). Optimization of aqueous extraction and biological activity of Harpagophytum procumbens root on ex vivo rat colon inflammatory model. Phyther. Res. 31, 937–944. doi: 10.1002/ptr.5821
Makni, M., Haddar, A., Kriaa, W., and Zeghal, N. (2013). Antioxidant, free radical scavenging, and antimicrobial activities of Ajuga iva leaf extracts. Int. J. Food Prop. 16, 756–765. doi: 10.1080/10942912.2011.561465
Mamadalieva, N. Z., El-readi, M. Z., Ovidi, E., Ashour, M. L., Hamoud, R., Sagdullaev, S. S., et al. (2013). Antiproliferative, antimicrobial and antioxidant activities of the chemical constituents of Ajuga turkestanica. Phytopharmacology 4, 1–18.
Manguro, L. O. A., Lemmen, P., and Hao, P. (2011). Iridoid glycosides from underground parts of Ajuga remota. Rec. Nat. Prod. 5, 147–157.
Manguro, L. O. A., Otieno, S., and Lemmen, P. (2006). Flavonol and iridoid glycosides of Ajuga remota aerial parts. Phytochemistry 67, 830–837. doi: 10.1016/j.phytochem.2006.01.005
Miranda, K. M., Espey, M. G., and Wink, D. A. (2001). A rapid, simple spectrophotometric method for simultaneous detection of nitrate and nitrite. Nitric Oxide 5, 62–71. doi: 10.1006/niox.2000.0319
Mocan, A., Crişan, G., Vlase, L., Crişan, O., Vodnar, D. C., Raita, O., et al. (2014). Comparative studies on polyphenolic composition, antioxidant and antimicrobial activities of Schisandra chinensis leaves and fruits. Molecules 19, 15162–15179. doi: 10.3390/molecules190915162
Moldovan, C. M., Oniga, O., Pârvu, A., Tiperciuc, B., Verite, P., Pîrnău, A., et al. (2011). Synthesis and anti-inflammatory evaluation of some new acyl-hydrazones bearing 2-aryl-thiazole. Eur. J. Med. Chem. 46, 526–534. doi: 10.1016/j.ejmech.2010.11.032
Moussa-Ayoub, T. E., Abd El-Hady, E. S. A., Omran, H. T., El-Samahy, S. K., Kroh, L. W., and Rohn, S. (2014). Influence of cultivar and origin on the flavonol profile of fruits and cladodes from cactus Opuntia ficus-indica. Food Res. Int. 64, 864–872. doi: 10.1016/j.foodres.2014.08.021
Movahhedin, N., Zengin, G., Bahadori, M. B., Sarikurkcu, C., Bahadori, S., and Dinparast, L. (2016). Ajuga chamaecistus subsp. scoparia (Boiss.) Rech.f.: a new source of phytochemicals for antidiabetic, skin-care, and neuroprotective uses. Ind. Crops Prod. 94, 89–96. doi: 10.1016/j.indcrop.2016.08.028
Njoroge, G. N., and Bussmann, R. W. (2006). Diversity and utilization of antimalarial ethnophytotherapeutic remedies among the Kikuyus (Central Kenya). J. Ethnobiol. Ethnomed. 2:8. doi: 10.1186/1746-4269-2-8
Ono, M., Furusawa, C., Ozono, T., Oda, K., Yasuda, S., Okawa, M., et al. (2011). Four new iridoid glucosides from Ajuga reptans. Chem. Pharm. Bull. 59, 1065–1068. doi: 10.1248/cpb.59.1065
Ono, Y., Fukaya, Y., Imai, S., and Yamakuni, T. (2008). Beneficial effects of Ajuga decumbens on osteoporosis and arthritis. Biol. Pharm. Bull. 31, 1199–1204. doi: 10.1248/bpb.31.1199
Parvu, A. E., Parvu, M., Vlase, L., Miclea, P., Mot, A. C., and Silaghi-Dumitrescu, R. (2014). Anti-inflammatory effects of Allium schoenoprasum L. leaves. J. Physiol. Pharmacol. 65, 309–315.
Riaz, N., Nawaz, S. A., Mukhtar, N., Malik, A., Afza, N., Ali, S., et al. (2007). Isolation and enzyme-inhibition studies of the chemical constituents from Ajuga bracteosa. Chem. Biodivers. 4, 72–83. doi: 10.1002/cbdv.200790008
Rogerio, A. P., Kanashiro, A., Fontanari, C., Da Silva, E. V. G., Lucisano-Valim, Y. M., Soares, E. G., et al. (2007). Anti-inflammatory activity of quercetin and isoquercitrin in experimental murine allergic asthma. Inflamm. Res. 56, 402–408. doi: 10.1007/s00011-007-7005-6
Salvat, A., Antonacci, L., Fortunato, R. H., Suarez, E. Y., and Godoy, H. M. (2004). Antimicrobial activity in methanolic extracts of several plant species from northern Argentina. Phytomedicine 11, 230–234. doi: 10.1078/0944-7113-00327
Savran, A., Zengin, G., Aktumsek, A., Mocan, A., Glamočlija, J., Ćirić, A., et al. (2016). Phenolic compounds and biological effects of edible Rumex scutatus and Pseudosempervivum sempervivum: potential sources of natural agents with health benefits. Food Funct. 7, 3252–3262. doi: 10.1039/C6FO00695G
Shahidi, F., and Ambigaipalan, P. (2015). Phenolics and polyphenolics in foods, beverages and spices: antioxidant activity and health effects - a review. J. Funct. Foods 18, 820–897. doi: 10.1016/j.jff.2015.06.018
Stana, A., Vodnar, D. C., Tamaian, R., Pîrnău, A., Vlase, L., Ionuţ, I., et al. (2017). Design, synthesis and antifungal activity evaluation of new thiazolin-4-ones as potential lanosterol 14α-demethylase inhibitors. Int. J. Mol. Sci. 18:E177. doi: 10.3390/ijms18010177
Stojković, D., Petrović, J., Soković, M., Glamočlija, J., Kukić-Marković, J., and Petrović, S. (2013). In situ antioxidant and antimicrobial activities of naturally occurring caffeic acid, p-coumaric acid and rutin, using food systems. J. Sci. Food Agric. 93, 3205–3208. doi: 10.1002/jsfa.6156
Tămaş, M., Toiu, A., Oniga, I., Deliu, C., Oltean, B., and Coldea, G. (2009). Quantitative determination of total polyphenols and flavonoids from indigenous species of Epilobium of wild origin and “in vitro” regenerated plantlets. Contrib. Bot. 44, 119–123.
Toiu, A., Vlase, L., Gheldiu, A. M., and Vodnar, D. (2017). Evaluation of the antioxidant and antibacterial potential of bioactive compounds from Ajuga reptans extracts. Farmacia 65, 351–355.
Vlase, L., Parvu, M., Parvu, E. A., and Toiu, A. (2013). Chemical constituents of three Allium species from Romania. Molecules 18, 114–127. doi: 10.3390/molecules18010114
Xu, P. X., Wang, S. W., Yu, X. L., Su, Y. J., Wang, T., Zhou, W. W., et al. (2014). Rutin improves spatial memory in Alzheimer’s disease transgenic mice by reducing Aβ oligomer level and attenuating oxidative stress and neuroinflammation. Behav. Brain Res. 264, 173–180. doi: 10.1016/j.bbr.2014.02.002
Yu, L., and Cheng, Z. (2008). Application of electron spin resonance (ESR) spectrometry in nutraceutical and food research. Mol. Nutr. Food Res. 52, 62–78. doi: 10.1002/mnfr.200700395
Zengin, G., Uysal, A., Gunes, E., and Aktumsek, A. (2014). Survey of phytochemical composition and biological effects of three extracts from a wild plant (Cotoneaster nummularia Fisch. et Mey.): a potential source for functional food ingredients and drug formulations. PLoS One 9:e113527. doi: 10.1371/journal.pone.0113527
Keywords: Ajuga laxmannii, polyphenols, iridoids, sterols, anti-inflammatory, antimicrobial
Citation: Toiu A, Mocan A, Vlase L, Pârvu AE, Vodnar DC, Gheldiu A-M, Moldovan C and Oniga I (2018) Phytochemical Composition, Antioxidant, Antimicrobial and in Vivo Anti-inflammatory Activity of Traditionally Used Romanian Ajuga laxmannii (Murray) Benth. (“Nobleman’s Beard” – Barba Împăratului). Front. Pharmacol. 9:7. doi: 10.3389/fphar.2018.00007
Received: 15 December 2017; Accepted: 04 January 2018;
Published: 02 March 2018.
Edited by:
Atanas G. Atanasov, Institute of Genetics and Animal Breeding (PAS), PolandReviewed by:
Zhaojun Wei, Hefei University of Technology, ChinaClaudio Ferrante, Università degli Studi “G. d’Annunzio” Chieti-Pescara, Italy
Copyright © 2018 Toiu, Mocan, Vlase, Pârvu, Vodnar, Gheldiu, Moldovan and Oniga. This is an open-access article distributed under the terms of the Creative Commons Attribution License (CC BY). The use, distribution or reproduction in other forums is permitted, provided the original author(s) and the copyright owner are credited and that the original publication in this journal is cited, in accordance with accepted academic practice. No use, distribution or reproduction is permitted which does not comply with these terms.
*Correspondence: Laurian Vlase, laurian.vlase@umfcluj.ro
†Shared first authorship