 Paolo Montuschi1*†
 Giuseppe Santini1†
 Nadia Mores1†
 Alessia Vignoli2†
 Francesco Macagno3
 Rugia Shoreh4
 Leonardo Tenori2Gina Zini5
 Leonello Fuso3
 Chiara Mondino6Corrado Di Natale7Arnaldo D'Amico7Claudio Luchinat2
 Peter J. Barnes8Tim Higenbottam9
- 1Department of Pharmacology, Faculty of Medicine, Catholic University of the Sacred Heart, University Hospital Agostino Gemelli Foundation, Rome, Italy
- 2Magnetic Resonance Center (CERM), University of Florence, Florence, Italy
- 3Department of Internal Medicine and Geriatrics, Catholic University of the Sacred Heart, University Hospital Agostino Gemelli Foundation, Rome, Italy
- 4Department of Drug Sciences, Faculty of Pharmacy, University “G. d'Annunzio”, Chieti, Italy
- 5Department of Hematology, Faculty of Medicine, Catholic University of the Sacred Heart, University Hospital Agostino Gemelli Foundation, Rome, Italy
- 6Department of Allergology, ‘Bellinzona e Valli’ Hospital, Bellinzona, Switzerland
- 7Department of Electronic Engineering, University of Tor Vergata, Rome, Italy
- 8Airway Disease Section, Faculty of Medicine, National Heart and Lung Institute, Imperial College, London, United Kingdom
- 9Faculty of Pharmaceutical Medicine, Royal College of Physicians, London, United Kingdom
Background: Prospective pharmacological studies on breathomics profiles in COPD patients have not been previously reported. We assessed the effects of treatment and withdrawal of an extrafine inhaled corticosteroid (ICS)-long-acting β2-agonist (LABA) fixed dose combination (FDC) using a multidimensional classification model including breathomics.
Methods: A pilot, proof-of-concept, pharmacological study was undertaken in 14 COPD patients on maintenance treatment with inhaled fluticasone propionate/salmeterol (500/50 μg b.i.d.) for at least 8 weeks (visit 1). Patients received 2-week treatment with inhaled beclomethasone dipropionate/formoterol (100/6 μg b.i.d.) (visit 2), 4-week treatment with formoterol alone (6 μg b.i.d.) (visit 3), and 4-week treatment with beclomethasone/formoterol (100/6 μg b.i.d.) (visit 4). Exhaled breath analysis with two e-noses, based on different technologies, and exhaled breath condensate (EBC) NMR-based metabolomics were performed. Sputum cell counts, sputum supernatant and EBC prostaglandin E2 (PGE2) and 15-F2t-isoprostane, fraction of exhaled nitric oxide, and spirometry were measured.
Results: Compared with formoterol alone, EBC acetate and sputum PGE2, reflecting airway inflammation, were reduced after 4-week beclomethasone/formoterol. Three independent breathomics techniques showed that extrafine beclomethasone/formoterol short-term treatment was associated with different breathprints compared with regular fluticasone propionate/salmeterol. Either ICS/LABA FDC vs. formoterol alone was associated with increased pre-bronchodilator FEF25−75% and FEV1/FVC (P = 0.008–0.029). The multidimensional model distinguished fluticasone propionate/salmeterol vs. beclomethasone/formoterol, fluticasone propionate/salmeterol vs. formoterol, and formoterol vs. beclomethasone/formoterol (accuracy > 70%, P < 0.01).
Conclusions: Breathomics could be used for assessing ICS treatment and withdrawal in COPD patients. Large, controlled, prospective pharmacological trials are required to clarify the biological implications of breathomics changes. EUDRACT number: 2012-001749-42.
Introduction
Respiratory inflammation has a central role in the pathophysiology of COPD. Inhaled corticosteroids (ICS) are the principal anti-inflammatory treatment for COPD (Global initiative for chronic obstructive lung disease (GOLD), 2018), but little is known about the pattern of inflammatory markers which are affected by this pharmacotherapy. While ICS are generally effective in asthma, their anti-inflammatory efficacy in COPD is not clearly established (Barnes, 2010).
Electronic noses (e-noses), consisting of cross-reactive chemical sensor arrays for the detection of volatile chemical species (Horvath et al., 2017), discriminate between patients with COPD, asthmatic patients, healthy smokers and healthy non-smokers (Fens et al., 2009), and predict oral corticosteroid responsiveness in asthmatic patients (van der Schee et al., 2013). E-nose breathprints are associated with airway inflammatory markers, including sputum eosinophils and neutrophils, in COPD patients and can be useful for subphenotyping (Fens et al., 2011, 2013). Metabolomics is a global approach to understanding regulation of metabolic pathways and metabolic networks of a biological system (Rochfort, 2005). Nuclear magnetic resonance (NMR)-based metabolomic analysis of exhaled breath condensate (EBC), the liquid fraction of exhaled breath, is suitable for identifying and quantifying semi-volatile/non-volatile small molecular weight metabolites and has been applied to the assessment of airway inflammation in COPD patients (De Laurentiis et al., 2008; Motta et al., 2012; Airoldi et al., 2016). Published prospective clinical studies on effects of pharmacological treatment on breathomics in COPD patients are not available.
We aimed to assess the effects of treatment and steroid withdrawal of an extrafine ICS/long-acting β2-agonist (LABA) fixed dose combination (FDC) on breathprints and non-invasive inflammatory outcomes in COPD patients; to compare accuracy of a multidimensional classification model vs. a standard spirometry-based model.
Methods
Study Subjects
Fourteen COPD ex-smokers for at least 1 year with stable mild, moderate or severe airflow limitation (GOLD stage I-III, post-bronchodilator forced expiratory volume in 1 s (FEV1) >30% predicted value, FEV1/FVC < 70%, GOLD group A-D), who were on a fixed dose combination (FDC) of fluticasone propionate/salmeterol delivered via a dry powder inhaler (DPI) at a constant dose of 500/50 μg b.i.d. for at least 8 weeks, were studied. Diagnosis of COPD was based on GOLD guideline criteria (Global initiative for chronic obstructive lung disease (GOLD), 2018). Six subjects had clinical and radiological signs of emphysema. Three patients had bronchiectasis documented by chest CT scan. Regarding co-morbidities, six patients with COPD had concomitant ischemic heart disease, four patients had congestive heart failure, five patients had arterial blood hypertension, three patients had type 2 diabetes mellitus, and one patient had peripheral vascular disease.
COPD patients had negative reversibility test to 400 μg of inhaled salbutamol (< 12% and 200 ml increase in FEV1), no history of asthma and atopic disease, negative skin prick test results, no upper respiratory tract infections in the previous 3 weeks, and were excluded from the study if they had used systemic corticosteroids in the previous 4 weeks.
Study Design
This was a single center, prospective, open label, pilot, proof-of-concept, pharmacological study of ICS withdrawal and treatment in COPD patients on maintenance treatment with inhaled fluticasone propionate/salmeterol at full doses (visit 1, screening visit). Study duration was 10 weeks including 4 visits (Figure 1). After a 2-week phase treatment with inhaled beclomethasone/formoterol (100/6 μg 2 puffs b.i.d. via pressurized metered dose inhaler [pMDI]) (visit 2, baseline visit) to allow them to become familiar with the new inhaler, patients received inhaled formoterol alone (6 μg 2 puffs b.i.d. via pMDI) for 4 weeks (visit 3, post-withdrawal visit), and inhaled beclomethasone/formoterol (100/6 μg 2 puffs b.i.d.) for 4 weeks (visit 4, post-treatment visit) (Figure 1). Breathomics included analysis of exhaled breath gaseous phase with two different e-noses, and NMR-based metabolomics of exhaled breath condensate (EBC). Sputum cell counts, prostaglandin (PG) E2 and 15-F2t-isoprostane in sputum supernatants and EBC, and fraction of exhaled nitric oxide (FENO) were also measured.
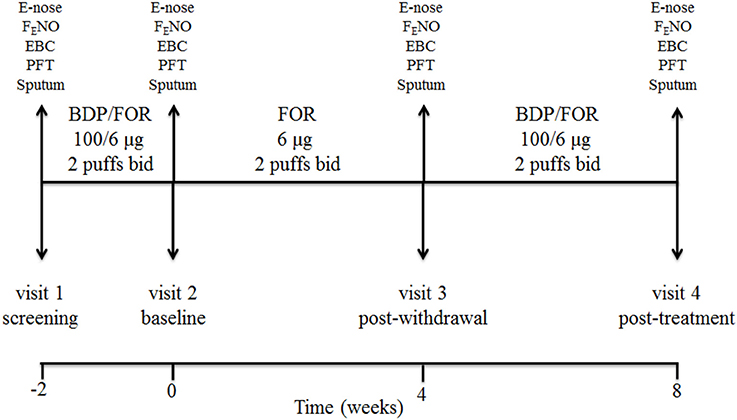
Figure 1. Study design and detail of interventions. At screening visit (visit 1), treatment with a constant dose of inhaled fluticasone propionate/salmeterol xinafoate fixed dose combination (FDC) (500/50 μg b.i.d. via a dry powder inhaler) for at least 8 weeks was switched to an extrafine formulation of inhaled beclomethasone dipropionate (BDP)/formoterol fumarate (FOR) FDC (100/6 μg 2 puffs b.i.d. via a pressurized metered dose inhaler [pMDI]). After a run-in phase of 2 weeks, the FDC containing beclomethasone was suspended (visit 2, baseline visit), while maintaining formoterol alone (6 μg 2 puffs b.i.d. via pMDI). After 4 weeks of beclomethasone withdrawal (visit 3, post-withdrawal visit), treatment with inhaled beclomethasone/formoterol FDC at the same dose (100/6 μg 2 puffs b.i.d. via pMDI) was reintroduced. Exhaled breath sampling for e-nose analysis, measurement of fraction of exhaled nitric oxide (FENO), exhaled breath condensate (EBC) collection, pulmonary function tests (PFT), and sputum induction were performed at each visit. Study duration was 10 weeks.
Both informed and written consent was obtained from patients. The study was approved by the Ethics Committee (A.942/C.E./2012) of the Catholic University of the Sacred Heart, University Hospital Agostino Gemelli, Rome, Italy. EudraCT number: 2012-001749-42.
Pulmonary Function
Spirometry was performed with a Pony FX spirometer (Cosmed, Rome, Italy) and the best of three consecutive maneuvers chosen.
FENO Measurement
FENO was measured with the NIOX system (Aerocrine, Stockholm, Sweden) with a single breath on-line method at constant flow of 50 ml/sec according to American Thoracic Society guidelines (American Thoracic Society and European Respiratory Society, 2005; Dweik et al., 2011). Exhalations were repeated after 1 min relaxation period until the performance of three FENO values varies less than 10% (American Thoracic Society and European Respiratory Society, 2005). FENO measurements were obtained before spirometry.
Collection of Exhaled Breath
Exhaled breath was collected from each subject at 8.30 a.m. as previously described (Fens et al., 2009; Bofan et al., 2013) and based on recent ERS technical standard (Horvath et al., 2017). No food or drinks were allowed at least 12 h prior to sampling.
Subjects were asked to breathe tidally volatile organic compound (VOC)-filtered air for 5 min, while wearing a nose-clip, into a 2-way non-rebreathing valve with an inspiratory VOC filter and an expiratory silica reservoir to reduce sample water vapor (Röck et al., 2008). Then, subjects were asked to inhale to maximal inspiration and perform a FVC maneuver into a Tedlar® bag. Two consecutive samples were collected 15 min apart and immediately analyzed.
Electronic Noses
The first sample was analyzed with a commercially available e-nose (Cyranose 320, Sensigent, Baldwin Park, USA) (Lewis, 2004; Fens et al., 2009) which consists of an array of 32 cross-reactive carbon black polymer composite sensors and detects resistance variations; the second sample was analyzed with an e-nose prototype (Ten 2011, University of Rome Tor Vergata, Italy) (Montuschi et al., 2010) which consists of an array of 8 cross-reactive quartz microbalance gas sensors coated by molecular films of metallo-porphyrins and detects frequency variations (Montuschi et al., 2010). Breathprints were analyzed by pattern recognition algorithms (Bishop, 2006).
Ambient VOCs were subtracted from measures and results were automatically adjusted for ambient VOCs.
EBC Sampling
Before EBC collection, subjects refrained from eating for at least 3 h. EBC was collected using a condenser (Ecoscreen, Jaeger, Hoechberg, Germany) (Motta et al., 2012), in a windowless clinic facility without disinfectant dispensers (Motta et al., 2012). Samples were snap frozen in liquid nitrogen to immediately “quench” metabolism and preserve the metabolite concentrations.
Metabolomic Analysis of EBC With NMR Spectroscopy
1H-NMR spectra for EBC samples were acquired using a Bruker 600 MHz spectrometer operating at 600.13 MHz using standard nuclear Overhauser effect spectroscopy (NOESY) experiments and standard protocols for sample preparation (Bertini et al., 2014). Signals of interest were assigned on template one-dimensional NMR profiles and integrated to calculate their relative concentrations (Montuschi et al., 2012; Motta et al., 2012; Bertini et al., 2014). Multilevel partial least squares (PLS) analysis was used to analyse EBC spectra from the same subject obtained at paired visits.
Measurement of PGE2 and 15-F2t-Isoprostane in Sputum Supernatants and EBC
PGE2 and 15-F2t-isoprostane concentrations in sputum supernatants and EBC were measured with radioimmunoassays developed in our laboratory, previously validated and compared with gas chromatography/mass spectrometry and high performance liquid chromatography (Wang et al., 1995; Montuschi et al., 2003).
Sputum Cell Analysis
Sputum induction, processing and analysis were performed according to the European Respiratory Society (ERS) guidelines (Djukanovic et al., 2002; Efthimiadis et al., 2002; Paggiaro et al., 2002).
Baseline FEV1 was recorded before sputum induction. Subjects were pre-treated with inhaled salbutamol (400 μg), and, after 10 min, a spirometry was repeated (Paggiaro et al., 2002). Subjects were asked to inhale hypertonic saline (3%) for 5 min and then, to rinse their mouths and try to expectorate into a sterilized box (Paggiaro et al., 2002). Five-minute inhalation sessions were repeated four times for a total of 20 min (Paggiaro et al., 2002). A spirometry was performed after each inhalation session to detect significant fall of FEV1. The procedure was stopped when approximately 1 g of plugs was collected, or if patients had symptoms or/and if FEV1 was reduced more than 20% over baseline values (Paggiaro et al., 2002). Sputum was processed within 2 h to ensure optimum cell counting and staining, with the sample always kept in ice (Efthimiadis et al., 2002). One hundred to 500 μg sputum was selected for sputum analysis. Dithiothreitol (DTT) 0.1% was added to sputum samples which were kept in a shaking rocker at room temperature for 20 min for sample homogenization (Efthimiadis et al., 2002). Samples were filtered through a 48 μm nylon mesh into a pre-weighed conical tube and filtrate was weighed. Total cell count was performed manually using a haemocytometer and cell viability was assessed by the trypan blue exclusion method before centrifugation (Efthimiadis et al., 2002). To separate cell pellet from sputum supernatants, samples were centrifuged at 4°C for 10 min with a centrifugal force of 1,200 × g (Efthimiadis et al., 2002). Sputum supernatant samples were collected and stored at −80°C for measurement of PGE2 and 15-F2t-isoprostane concentrations. Cell pellets were resuspended in PBS buffer and cell concentrations were adjusted to 1 × 10⁶ cells/ml. Cytospins were prepared by adding 40–60 μl of cell resuspension to each cytospin and using a Shandon cytocentrifuge at 22 × g for 6 min (Efthimiadis et al., 2002). Cytospins were stained for differential cell counts using Giemsa staining (Efthimiadis et al., 2002). The differential cell counts were performed by counting a minimum of 400 nonsquamous cells and reported as the relative numbers of eosinophils, neutrophils, macrophages, lymphocytes, and bronchial epithelial cells, expressed as a percentage of total non-squamous cells (Efthimiadis et al., 2002). The percentage of squamous cells was reported separately. Slides with squamous cells >30% of total cells were discarded. Slides were read blindly by two qualified and fully trained physicians. Monthly quality control was performed including internal slide reading and equipment calibration.
Skin Testing
Atopy was assessed by skin prick tests for common aeroallergens (mixture for house dust mite [Dermatophagoides pteronyssinus and Dermatophagoides farinae, grass pollen [cocksfoot and timothy], weed pollen [Parietaria officinalis and Ambrosia artemisifolia], tree pollen [birch, ash tree, olive tree, oak, and cypress], animal danders [cat and dog allergens], and fungal allergens [Aspergillus species and Alternaria alternata]; (Stallergenes, Antony, France) (Montuschi et al., 2006). A positive skin test response was defined as a wheal with a mean diameter (mean of maximum and 90° midpoint diameters) of at least 3 mm greater than that produced with a saline control (Montuschi et al., 2006).
Multivariate Data Analysis
E-nose and NMR spectroscopy data analysis requires multivariate statistical algorithms (Bishop, 2006; Wilson and Baietto, 2009). Multilevel PLS was used for data reduction; the K-nearest neighbors method, applied on the multilevel PLS scores, was used for classification purposes (Bishop, 2006; Wilson and Baietto, 2009). The global classification accuracy was assessed by means of Monte Carlo cross-validation scheme. The threshold for significant classification was set at a value of 70% (Bijlsma et al., 2006). Correlations among multidimensional data were calculated using the algorithm implemented in the R-library “psych” (Hahsler et al., 2008; Revelle, 2017) and are shown as a heatmap built using the R-function “heatmap.2,” implemented in the “gplots” package (Warnes et al., 2016).
Statistical Analysis
Data were expressed as mean ± SEM or medians and interquartile ranges (25th and 75th percentiles), after assessing for normality with the D'Agostino-Pearson omnibus normality test. Depending on data distribution, repeated-measures ANOVA or Friedman test was used for assessing within-group pharmacological treatment effect. If overall P value was found significant, paired t-test or Wilcoxon signed rank test were performed. Correlation was expressed as a Pearson coefficient. Significance was defined as a value of P < 0.05.
In this pilot, proof-of-concept study, we did not adjust our analysis for multiple testing to reduce the risk of missing promising biomarkers, but this also increased our risk of a type I error. Further details on the methodology are provided in the online Supplementary Material (Presentation 1).
Results
Study Subjects
Subject characteristics are shown in Table 1.
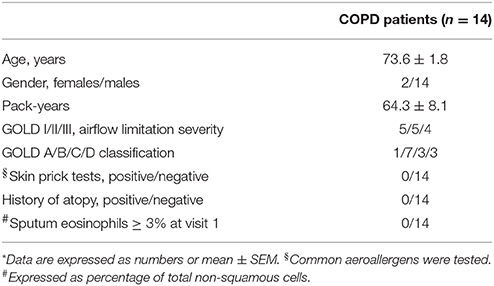
Table 1. Subject characteristics*.
Pulmonary Function Testing
Pre-bronchodilator and post-bronchodilator lung function test values across visits in patients with COPD are shown in Tables 2, 3, respectively. Higher mean pre-bronchodilator forced expiratory flow at 25–75% of forced vital capacity (FEF25−75%) percentage of predicted and absolute values were observed after 2-week inhaled beclomethasone/formoterol FDC (visit 2) compared with post-4-week treatment with inhaled formoterol alone (visit 3) (P = 0.026 and P = 0.029, respectively) (Figures 2A,B; Table 2).
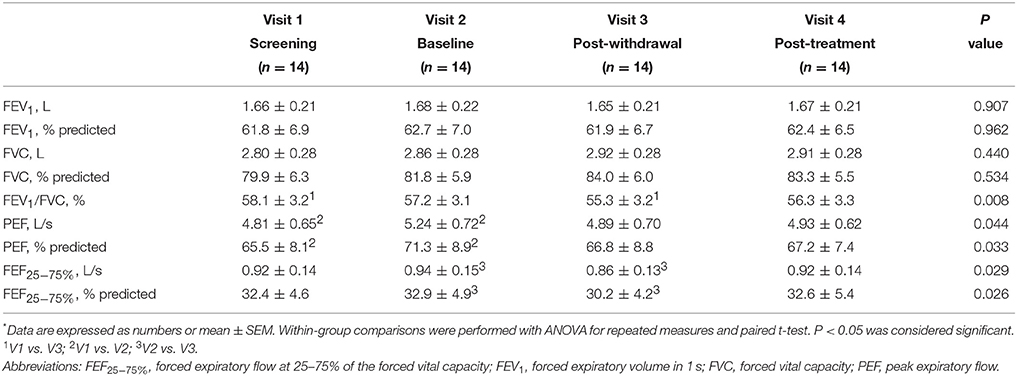
Table 2. Lung function tests, pre-bronchodilator values*.
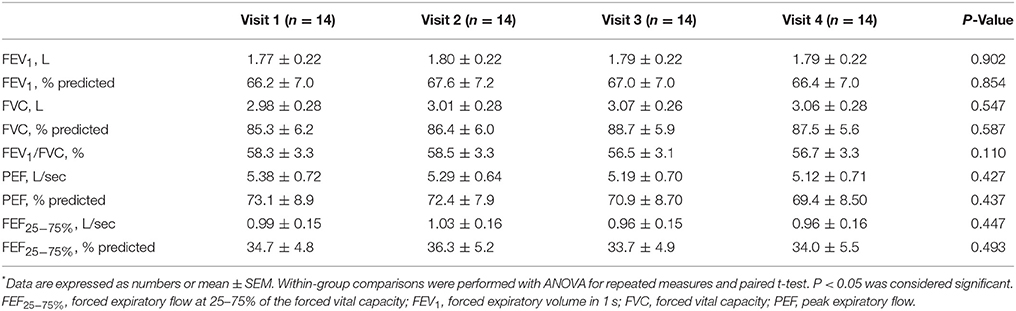
Table 3. Lung function tests, post-bronchodilator values*.
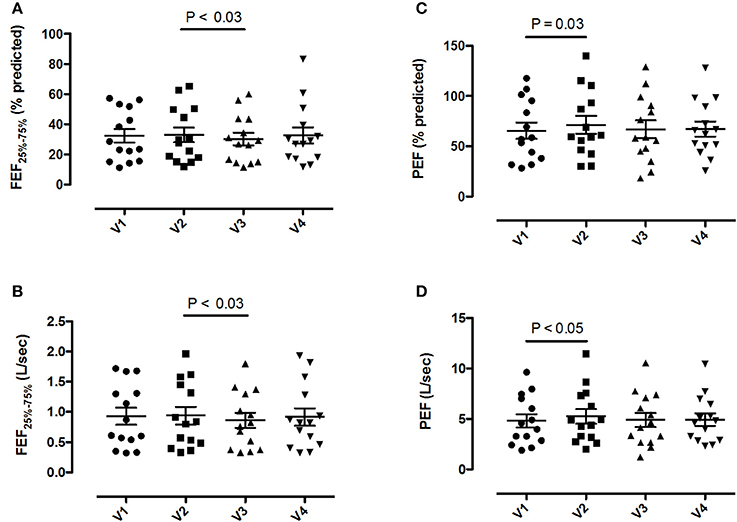
Figure 2. Pre-bronchodilator forced expiratory flow at the 25-75% of the forced vital capacity (FEF25−75%) and peak expiratory flow (PEF) values in 14 patients with COPD at visit 1 (V1) to visit 4 (V4). (A) FEF25−75% percentage predicted values; (B) absolute FEF25−75% values; (C) PEF percentage predicted values; (D) absolute PEF values. Mean values ± SEM are shown.
Mean pre-bronchodilator FEV1/FVC ratio was higher on maintenance treatment with fluticasone propionate/salmeterol FDC (visit 1) compared with post-treatment with formoterol alone (visit 3) (P = 0.008) (Table 2).
Higher mean pre-bronchodilator peak expiratory flow (PEF) percentage of predicted and absolute values were observed after 2-week beclomethasone/formoterol FDC (visit 2) compared with maintenance treatment with inhaled fluticasone propionate/salmeterol (visit 1) (P = 0.033 and P = 0.044, respectively) (Figures 2C,D, Table 2). No within-group differences in post-bronchodilator functional parameters were observed (Table 3).
Electronic Nose
E-nose analysis with either e-nose was successfully performed in all 14 subjects at all visits. A total of 56 breathprints for each e-nose was collected. Fifteen out of 32 carbon polymer sensors showed significant mean differences between inhaled fluticasone propionate/salmeterol FDC maintenance treatment (visit 1) and post-4-week beclomethasone/formoterol FDC treatment (visit 4), whereas 7 sensors showed significant mean differences between fluticasone propionate/salmeterol maintenance treatment (visit 1) and 2-week treatment with beclomethasone/formoterol (visit 2) (Table 4).
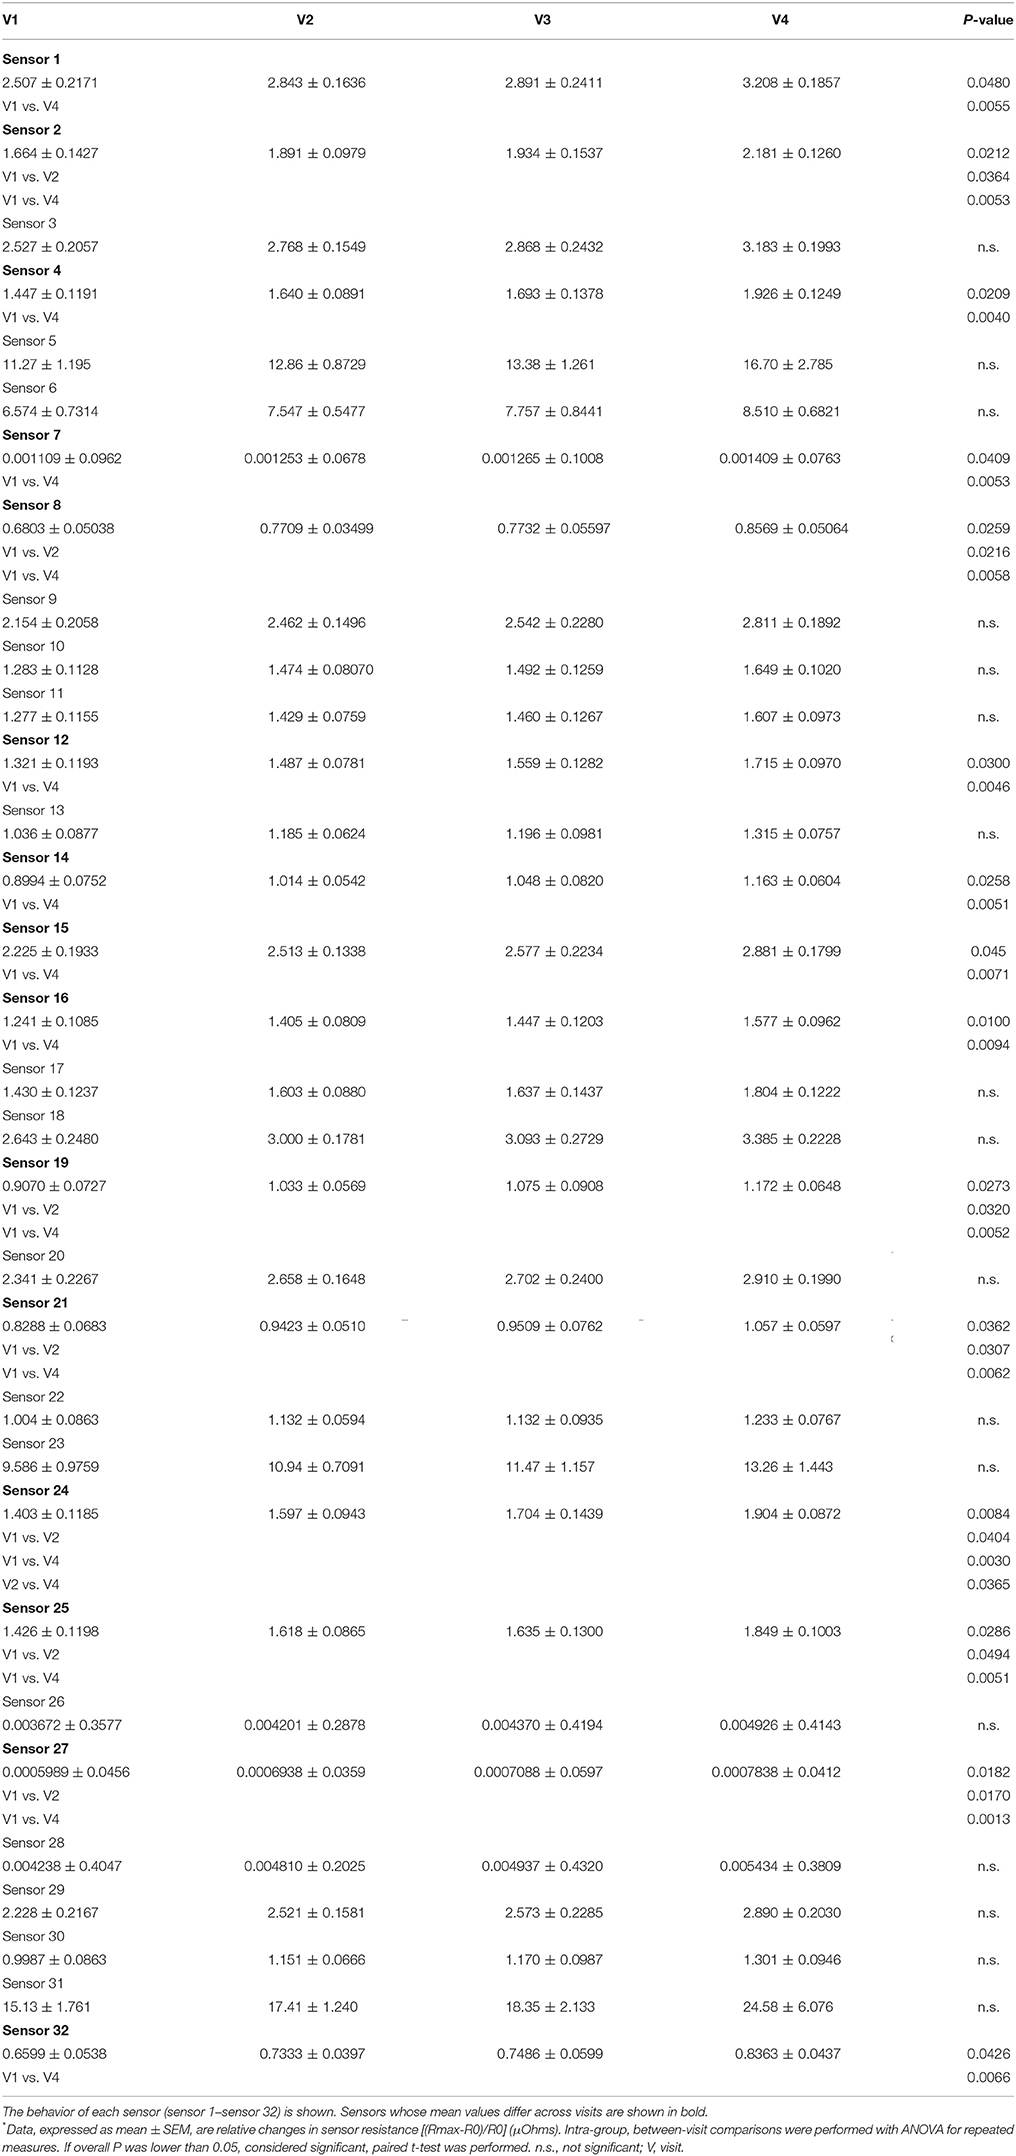
Table 4. Univariate analysis of carbon polymer sensor e-nose response*.
Consistent with carbon polymer sensor behavior, two quartz crystal sensors showed significant mean differences between fluticasone propionate/salmeterol maintenance treatment (visit 1) and post-4-week beclomethasone/formoterol FDC treatment (visit 4); sensor 3 and 4 showed significant mean differences between fluticasone propionate/salmeterol maintenance treatment (visit 1) and 2-week beclomethasone/formoterol treatment (visit 2) (Table 5).
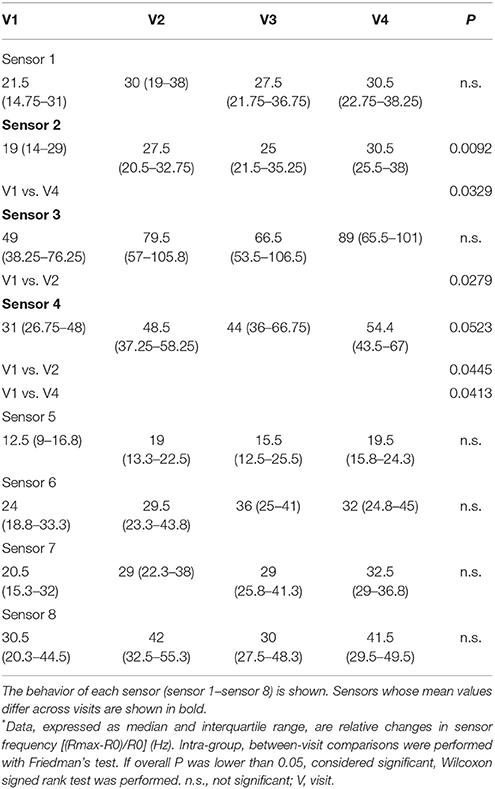
Table 5. Univariate analysis of quartz crystal sensor e-nose response*.
There was no difference in sensor response using either e-nose when other paired visits were compared (Tables 4, 5).
Metabolomic Analysis of EBC With NMR Spectroscopy
A total of 56 EBC NMR spectra obtained from 14 study subjects across visits were analyzed. Typical EBC 1H-NMR spectra obtained from a COPD patient across visits are shown in Figure S1. EBC metabolomics with NMR spectroscopy discriminated between fluticasone propionate/salmeterol FDC maintenance treatment (visit 1) and treatment with beclomethasone/formoterol FDC for 4 weeks (visit 4) (accuracy = 72%, P = 0.01) (Figure S2). Formate levels were higher at visit 1 (694.9 ± 360.5 arbitrary units, median ± median absolute deviation [MAD]) than at visit 4 (409.2 ± 224.8 arbitrary units, P = 0.029) (Table 6, Figures S3A,B). Other paired comparisons showed accuracy below the significant threshold set at 70% (Table S1). After 4-week treatment with beclomethasone/formoterol FDC (visit 4), EBC acetate levels were lower than those measured after 4-week treatment with formoterol alone (visit 3) (P = 0.009) (Table 6). Several EBC metabolites, including formate, phenol, methanol, trimethylamine, acetone, acetoine, acetate, n-butyrate, lactate, 3-hydroxyisovalerate, ethanol, propionate, and leucine-o-butyrate were identified (Figure 3). Apart from formate and acetate, their levels were similar across visits (Table 6).
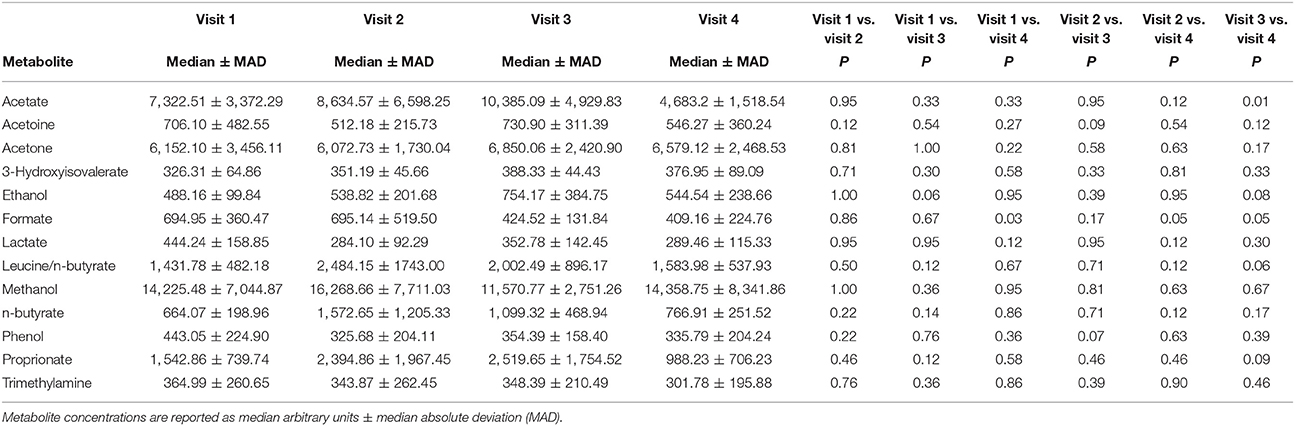
Table 6. Paired comparison of exhaled breath condensate (EBC) metabolite concentrations at each visit using Wilcoxon signed-rank test.
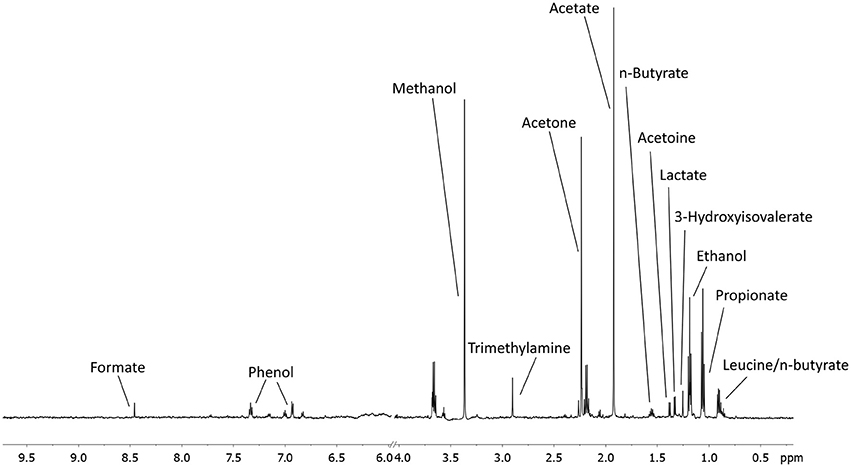
Figure 3. An example of a typical EBC NMR spectrum at 600 MHz. All metabolites assigned and quantified are reported in figure.
FENO
There was no difference in FENO concentrations in patients with COPD across visits (overall P = 0.35) (Table S2).
Measurement of PGE2 and 15-F2t-Isoprostane in Sputum Supernatants and EBC
PGE2 concentrations were detected in 49 out of a total of 56 sputum supernatant samples. Compared with formoterol alone post-treatment values (visit 3), lower sputum PGE2 concentrations were observed after 4-week treatment with beclomethasone/formoterol FDC (visit 4) (P = 0.008) and on maintenance treatment with fluticasone propionate/salmeterol FDC (visit 1) (P = 0.021) (Table S3). These data suggest that treatment with ICS FDC, containing either fluticasone propionate or beclomethasone dipropionate, reduces sputum PGE2 concentrations. There was no between-visit differences in EBC PGE2 or sputum and EBC 15-F2t-isoprostane concentrations (Table S3).
Sputum Cell Analysis
Eight patients with COPD had a complete set of sputum slides (visit 1 to visit 4) (Table S4). No patient with COPD had sputum eosinophilia, as defined by sputum cell counts >3%, at visit 1 (screening visit). There was no within-group difference in sputum cell counts (Table S4). Percentage sputum cell counts in all valid sputum slides are shown in Table S5.
Correlations
Responses within each individual e-nose and between e-noses were correlated, whereas EBC metabolites detected by NMR spectroscopy were not correlated with either e-noses, except EBC phenol which was correlated with 16 carbon polymer sensors (Figure 4). In EBC, there was a correlation between PGE2 and formate (r = 0.78, P = 5.06·10−11), acetone (r = 0.63, P = 1.64·10−6), lactate (r = 0.64, P = 6.03·10−7), n-butyrate (r = 0.82, P = 5.89·10−13), propionate (r = 0.59, P = 8.26·10−6), and acetate (r = 0.71, P = 1.23·10−8) (Figure 4).
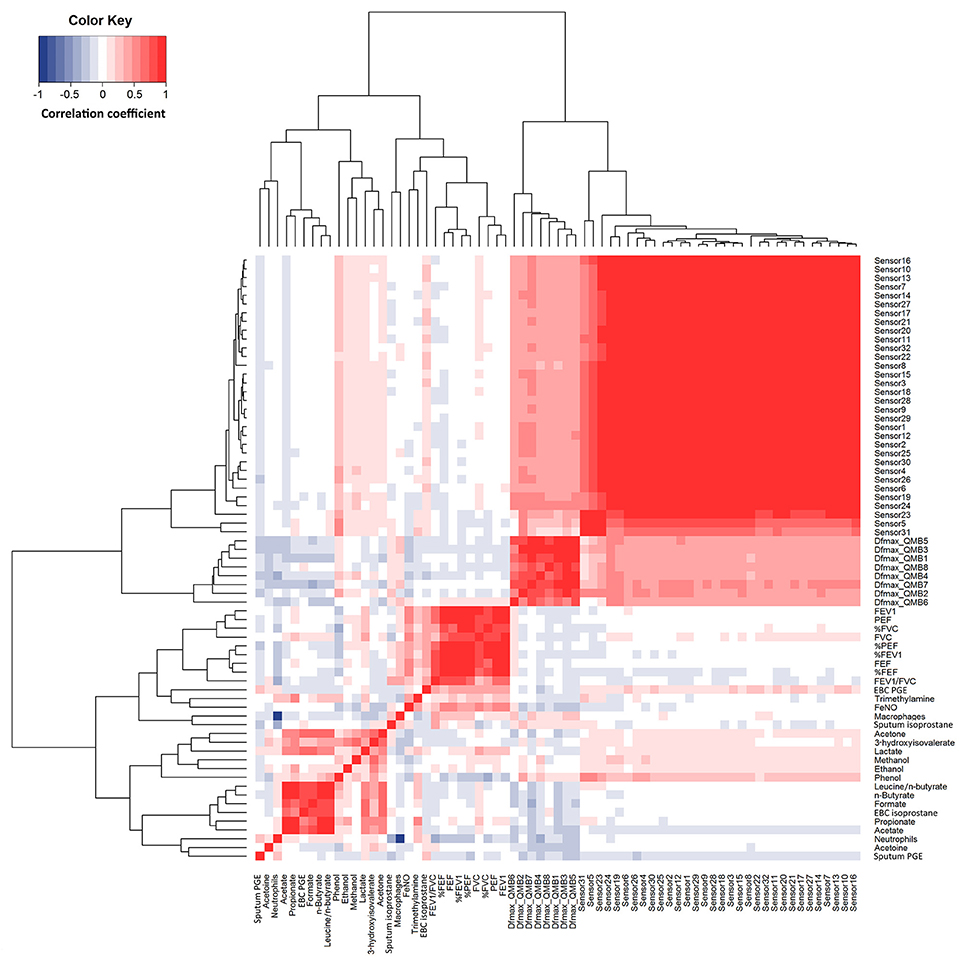
Figure 4. Heatmap showing correlations between study outcome measures in 14 patients with COPD at visit 1 to visit 4 (n = 56). R values are shown as different degree of color intensity (red, positive correlations; blue, negative correlation).
Quartz crystal sensor 4 (r = −0.35, P = 0.023) and 7 (r = −0.31, P = 0.041) negatively correlated with sputum neutrophils. These showed negative correlation with FEV1/FVC (r = −0.34; P = 0.028) (Figure 4).
Multidimensional Integrated Model for Assessment of Pharmacological Treatment
In the 14 COPD study participants, multidimensional pairwise discrimination models were built. The models discriminated between maintenance treatment with fluticasone propionate/salmeterol (visit 1) vs. 4-week treatment with formoterol alone (visit 3) (accuracy = 71.5%, P < 0.01); the univariate analysis showed differences in sputum supernatant PGE2 and FEV1/FVC ratio (Table 7); between maintenance treatment with fluticasone propionate/salmeterol (visit 1) vs. 4-week treatment with beclomethasone/formoterol (visit 4) (accuracy = 82.5%, P < 0.01); the univariate analysis showed differences in EBC formate and e-noses (Table 7); between 4-week treatment with formoterol alone (visit 3) vs. 4-week treatment with beclomethasone/formoterol (visit 4) (accuracy = 74.6%, P < 0.01); the univariate analysis showed differences in sputum PGE2 and EBC acetate (Table 7).
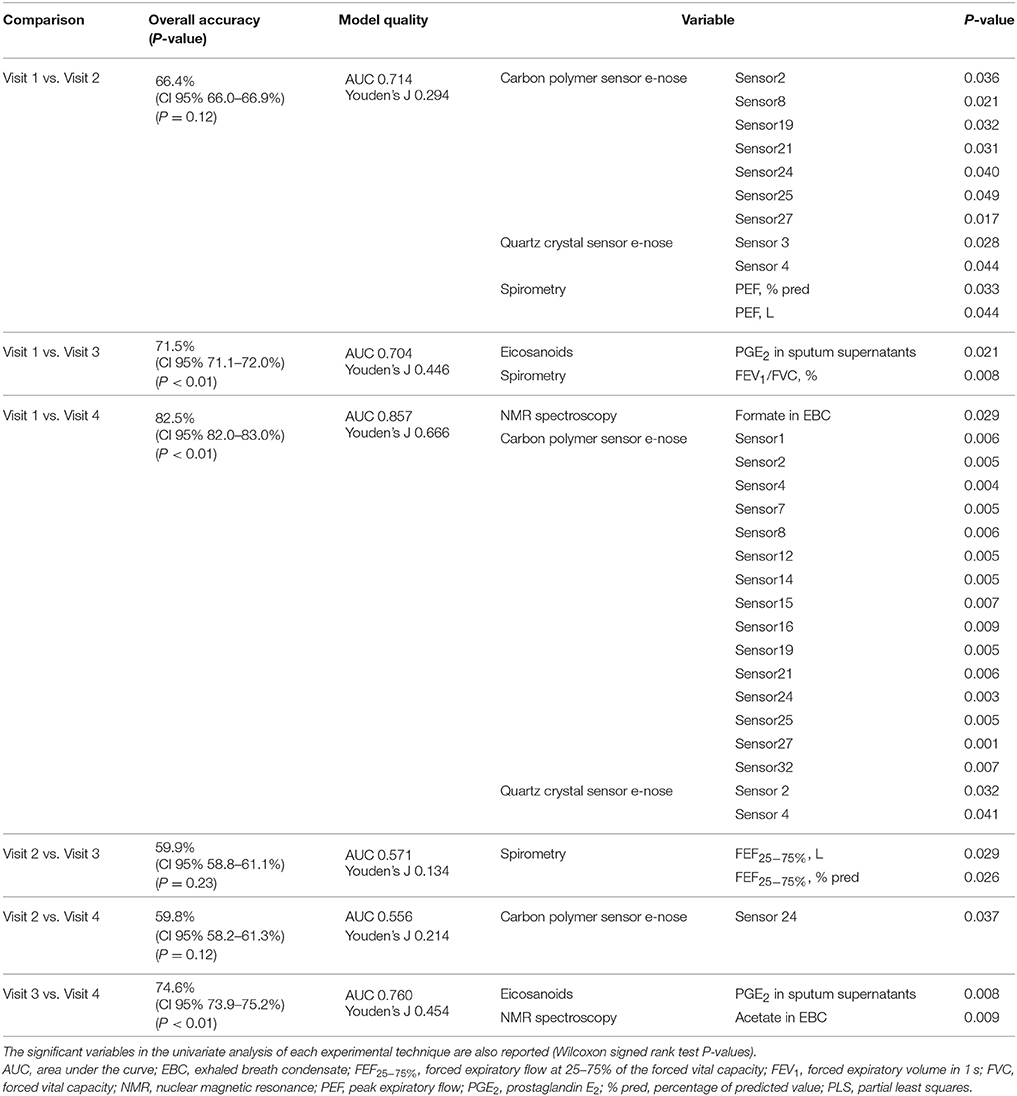
Table 7. Classification accuracies with 95% confidence interval and P values among different pharmacological treatments from visit 1 to visit 4 based on multidimensional PLS models in 14 patients with COPD.
The multidimensional models showed higher accuracy than the models based on spirometry alone (Table 8). PLS score plots are centrosymmetric given the pairwise nature of the analyses performed which leads to a matrix with a two block structure with opposite signs, thus producing symmetric PLS scores. This explains the same values of sensitivity and specificity. During cross-validation, when a multilevel PLS model is built from the training set, the entire variation splitting procedure is performed (van Velzen et al., 2008; Westerhuis et al., 2010). The procedure should, therefore, be adapted to keep the paired data structure both in the training and in the test set. As a result, complete individuals are left out of the training set (per individual validation, not per sample). At each step, if a sample of one individual is mistaken, inevitably the other is mistaken in the opposite way, leading to a fully symmetric confusion matrix. Of course, this symmetry is broken when considering more than just two time points. Further information on results is provided in the online Supplementary Material (Presentation 1).
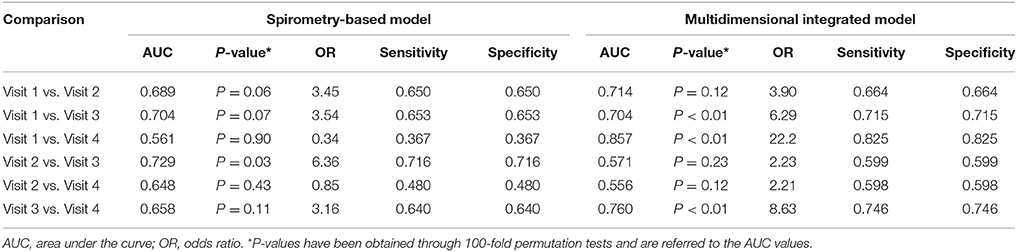
Table 8. Comparison between a multidimensional integrated model including breathomics and a model based on spirometry alone used for assessing the effects of pharmacological treatment in 14 patients with COPD.
Discussion
The principal messages of the present study are: (1) breathomics can be successfully applied to assessment of effects of corticosteroid treatment and withdrawal with ICS/LABA in patients with COPD; (2) breathomics results are confirmed by the concordance of three different breathomics techniques (carbon polymer sensor e-nose, quartz crystal sensor e-nose, NMR-based metabolomics) applied to the gaseous and aerosol particle (EBC) phase of the exhaled breath. These techniques provide complementary information; (3) a multidimensional, integrated, model including breathomics, improves the ability of identifying pharmacological treatment-induced effects compared with a monodimensional model based on standard pulmonary function testing; (4) this approach provides insights into the anti-inflammatory effects of ICS in patients with COPD as reflected by reduced sputum PGE2 and EBC acetate concentrations after beclomethasone/formoterol FDC vs. formoterol alone.
In a breathomics multidimensional approach to assessment of drugs for COPD, we show anti-inflammatory effects of an extrafine beclomethasone/formoterol FDC pMDI vs. formoterol alone as reflected by reduced levels of sputum PGE2, a potent inflammatory mediator in the airways (Clarke et al., 2005; Holden et al., 2010), and EBC acetate which were found elevated in COPD patients (De Laurentiis et al., 2008, 2013; Airoldi et al., 2016; Santini et al., 2016).
We also show that short-term treatment with an extrafine beclomethasone/formoterol FDC pMDI is associated with different breathprints as compared with regular fluticasone propionate/formoterol FDC DPI in patients with COPD. These results might suggest that various ICS/LABA formulations have different effects on breathomics outcomes, although the biological implications of these findings are unknown and have to be defined.
Treatment with either ICS/LABA FDC vs. inhaled formoterol alone was associated with a slight, but significant, increase in small airway function as reflected by FEF25−75% and FEV1/FVC values, whereas higher PEF values were observed after beclomethasone/formoterol (visit 2) than on regular fluticasone propionate/salmeterol (visit 1), suggesting that treatment-induced e-nose breathprint variations parallel the observed functional changes only to a limited extent. Interestingly, functional effects were observed after only 4-week treatment with inhaled beclomethasone/formoterol, a relatively short duration of treatment for COPD trials, and in patients with COPD who had normal sputum eosinophils, negative reversibility test to bronchodilators, negative skin prick tests, and no history of atopy, thus, excluding an asthma component, on which ICS are generally more effective.
The strong correlation between most sensors within each individual e-nose indicates a high degree of sensor redundancy, whereas a similar behavior of e-nose based on different technologies confirms the results of the exhaled breath analysis. Of note, quartz crystal sensors, but not carbon polymer sensors, showed correlation with sputum neutrophils. On the other hand, the lack of correlation between EBC metabolites detected by NMR spectroscopy and either e-noses suggests that a comprehensive breathomics approach might be complementary and increase the level of information. In EBC, there was a correlation between PGE2, an eicosanoid which can have potent pro-inflammatory effects in the airways, and formate (r = 0.78), acetone (r = 0.63), lactate (r = 0.64), n-butyrate (r = 0.82), propionate (r = 0.59), and acetate (r = 0.71) suggesting that these EBC metabolites might reflect respiratory inflammation. These correlations are unlikely to be explained by individual variability in aerosol particle formation (Effros et al., 2003) as there was no correlation between EBC 15-F2t-isoprostane and EBC metabolites nor between EBC PGE2 and EBC 15-F2t-isoprostane. For discussion on correlations see also online Supplemenatry Material (Presentation 1).
Unlike a standard efficacy model based on spirometry, the multidimensional model used in our study was able to distinguish between pharmacological treatments (accuracy > 70%) in 3 out of 6 possible paired comparisons. This might increase the chance of detecting drug effects in COPD patients. In line with an anti-inflammatory effect of ICS, sputum concentrations of PGE2, the key between-treatment discriminating outcome measure, were lower after treatment with either ICS/LABA FDC compared with formoterol alone. By contrast, other inflammatory outcomes, including sputum neutrophil cell counts, EBC PGE2, and sputum and EBC 15-F2t-isoprostane, showed steroid resistance.
Most of the EBC metabolites derive from pyruvate (Airoldi et al., 2016). Many breath volatile and non-volatile compounds are product of bacterial metabolism (Airoldi et al., 2016). Moreover, breathomics techniques, including e-noses and NMR spectroscopy, can be used for detecting and identifying bacterial species (Lim et al., 2016; Palama et al., 2016). For these reasons, exhaled breath analysis has been proposed as a powerful tool to identify bacterial metabolomic signatures (Airoldi et al., 2016). However, our approach is not suitable for identifying the cellular source(s) of EBC metabolites for which in vitro studies are required.
Elevated EBC formate and acetate levels have been reported in COPD patients compared with healthy subjects (De Laurentiis et al., 2008, 2013). These findings have been confirmed in a recent 1H-NMR spectroscopy study showing that EBC acetate is 36-fold higher and EBC formate is 2.5 higher in patients with emphysema due to α1-antitrypsin deficiency than in healthy subjects. Interestingly, we found reduced EBC levels of acetate and formate after 4-week beclomethasone/formoterol treatment. These preliminary findings suggest a potential anti-inflammatory mechanism of ICS involving a change in bacterial metabolism which might have profound implications in how ICS reduce the frequency of COPD exacerbations or increase the risk of pneumonia.
Study strengths rely on the fact that this is the first prospective evidence of the effects of pharmacological treatment and steroid withdrawal on breathomics in COPD patients, the multidimensional, non-invasive, approach to drug assessment requiring a systems medicine-based data analysis, the use of complementary breathomics techniques, and the completeness of data collected. The limited number of study subjects, the open-label, uncontrolled, design of the pharmacological study, the short duration of treatment/withdrawal phases, the lack of training and testing validation and external validation cohorts, represent limitations which preclude definitive conclusions.
In conclusion, breathomics can be used for assessing the effects of treatment and steroid withdrawal with ICS/LABA in patients with COPD. The present pilot, proof-of-concept, study provides a rational basis for large, randomized, controlled, pharmacological trials in patients with COPD using a similar multidimensional approach.
Guarantor Statement
PM takes responsibility for the content of the manuscript and the work as a whole, including the integrity of data and data analysis.
Author Contributions
PM was responsible for study planning, study design, clinical trial, electronic nose analysis, data analysis, data interpretation, and manuscript writing. GS was responsible for measurement of FENO, spirometry, sputum induction and analysis, data analysis, and manuscript revision. NM was responsible for study planning, sputum induction and analysis, data analysis, data interpretation, drug vigilance, and manuscript revision. AV was responsible for EBC NMR spectroscopy, multivariate data analysis, data interpretation, and manuscript revision. FM was responsible for patient recruitment, spirometry and manuscript revision. RS was responsible for measurement of PGE2 and 15-F2t-isoprostane in sputum supernatants and EBC, and for manuscript revision. LT was responsible for EBC NMR spectroscopy, multivariate data analysis, data interpretation, and manuscript revision. GZ was responsible for sputum cell analysis and manuscript revision. LF was responsible for patient recruitment, spirometry and manuscript revision. CM was responsible for skin prick testing and manuscript revision. CDN was responsible for e-nose prototype design, chemical sensor assembling and instrument calibration, and manuscript revision. AD was responsible for e-nose prototype design, chemical sensor assembling and instrument calibration, and manuscript revision. CL was responsible for EBC NMR spectroscopy, data analysis, multivariate data analysis, data interpretation, and manuscript preparation and revision. PB was responsible for manuscript preparation and revision. TH was responsible for study planning, study design, data interpretation, and manuscript preparation and revision.
Funding
This work was supported by Chiesi Farmaceutici, as Investigator Initiated Trial, and by Catholic University of the Sacred Heart, Rome, Italy, Academic Grant 2013.
Conflict of Interest Statement
TH, a full time employee of Allergy Therapeutics (UK) Ltd.
The other authors declare that the research was conducted in the absence of any commercial or financial relationships that could be construed as a potential conflict of interest.
The handling editor is currently co-organizing a Research Topic with one of the authors PM, and confirms the absence of any other collaboration.
Supplementary Material
The Supplementary Material for this article can be found online at: https://www.frontiersin.org/articles/10.3389/fphar.2018.00258/full#supplementary-material
References
Airoldi, C., Ciaramelli, C., Fumagalli, M., Bussei, R., Mazzoni, V., Viglio, S., et al. (2016). 1H NMR to explore the metabolome of exhaled breath condensate in α1-antitrypsin deficient patients: a pilot study. J. Proteome Res. 15, 4569–4578. doi: 10.1021/acs.jproteome.6b00648
American Thoracic Society and European Respiratory Society (2005). ATS/ERS recommendations for standardized procedures for the online and offline measurement of exhaled lower respiratory nitric oxide and nasal nitric oxide, 2005. Am. J. Respir. Crit. Care Med. 171, 912–930. doi: 10.1164/rccm.200406-710ST
Barnes, P. J. (2010). Inhaled corticosteroids in COPD: a controversy. Respiration 80, 89–95. doi: 10.1159/000315416
Bertini, I., Luchinat, C., Miniati, M., Monti, S., and Tenori, L. (2014). Phenotyping COPD by 1H NMR metabolomics of exhaled breath condensate. Metabolomics 10, 302–311. doi: 10.1007/s11306-013-0572-3
Bijlsma, S., Bobeldijk, I., Verheij, E. R., Ramaker, R., Kochhar, S., Macdonald, I. A., et al. (2006). Large-scale human metabolomics studies: a strategy for data (pre-) processing and validation. Anal. Chem. 78, 567–574. doi: 10.1021/ac051495j
Bofan, M., Mores, N., Baron, M., Dabrowska, M., Valente, S., Schmid, M., et al. (2013). Within-day and between-day repeatability of measurements with an electronic nose in patients with COPD. J. Breath Res. 7:017103. doi: 10.1088/1752-7155/7/1/017103
Clarke, D. L., Belvisi, M. G., Smith, S. J., Hardaker, E., Yacoub, M. H., Meja, K. K.A., et al. (2005). Prostanoid receptor expression by human airway smooth muscle cells and regulation of the secretion of granulocyte colony-stimulating factor. Am. J. Physiol. Lung Cell Mol. Physiol., 288, L238–L250. doi: 10.1152/ajplung.00313.2004
De Laurentiis, G., Paris, D., Melck, D., Maniscalco, M., Marsico, S., Corso, G., et al. (2008). Metabonomic analysis of exhaled breath condensate in adults by nuclear magnetic resonance spectroscopy. Eur. Respir. J. 32, 1175–1183. doi: 10.1183/09031936.00072408
De Laurentiis, G., Paris, D., Melck, D., Montuschi, P., Maniscalco, M., Bianco, A., et al. (2013). Separating smoking-related diseases using NMR-based metabolomics of exhaled breath condensate. J. Proteome Res. 12, 1502–1511. doi: 10.1021/pr301171p
Djukanovic, R., Sterk, P. J., Fahy, J. V., and Hargreave, F. E. (2002). Standardised methodology of sputum induction and processing. Eur. Respir. J. 37 (Suppl.), 1s−2s. doi: 10.1183/09031936.02.00000102
Dweik, R. A., Boggs, P. B., Erzurum, S. C., Irvin, C. G., Leigh, M. W., Lundberg, J. O., et al. (2011). American Thoracic Society Committee on interpretation of exhaled nitric oxide levels (FENO) for clinical applications. An official ATS clinical practice guideline: interpretation of exhaled nitric oxide levels (FENO) for clinical applications. Am. J. Respir. Crit. Care Med. 184, 602–615. doi: 10.1164/rccm.9120-11ST
Effros, R. M., Biller, J., Foss, B., Hoagland, K., Dunning, M. B., Castillo, D., et al. (2003). A simple method for estimating respiratory solute dilution in exhaled breath condensates. Am. J. Respir. Crit. Care Med. 168, 1500–1505. doi: 10.1164/rccm.200307-920OC
Efthimiadis, A., Spanevello, A., Hamid, Q., Kelly, M. M., Linden, M., Louis, R., et al. (2002). Methods of sputum processing for cell counts, immunocytochemistry and in situ hybridisation. Eur. Respir. J. 37 (Suppl.), 19s−23s. doi: 10.1183/09031936.02.00001902
Fens, N., de Nijs, S. B., Peters, S., Dekker, T., Knobel, H. H., Vink, T. J., et al. (2011). Exhaled air molecular profiling in relation to inflammatory subtype and activity in COPD. Eur. Respir. J. 38, 1301–1309. doi: 10.1183/09031936.00032911
Fens, N., van Rossum, A. G., Zanen, P., van Ginneken, B., van Klaveren, R. J., Zwinderman, A. H., et al. (2013). Subphenotypes of mild-to-moderate COPD by factor and cluster analysis of pulmonary function, CT imaging and breathomics in a population-based survey. COPD 10, 277–285. doi: 10.3109/15412555.2012.744388
Fens, N., Zwinderman, A. H., van der Schee, M. P., de Nijs, S. B., Dijkers, E., Roldaan, A. C., et al. (2009). Exhaled breath profiling enables discrimination of chronic obstructive pulmonary disease and asthma. Am. J. Respir. Crit. Care Med. 180, 1076–1082. doi: 10.1164/rccm.200906-0939OC
Global Initiative for Chronic Obstructive Lung Disease (GOLD) (2018). Global Strategy for The Diagnosis, Management, and Prevention of Chronic Obstructive Pulmonary Disease Available online at: www.goldcopd.org (Accessed Jan 8, 2018).
Hahsler, M., Hornik, K., and Buchta, C. (2008). Getting things in order: an introduction to the R package seriation. J. Stat. Soft. 25, 1–34. doi: 10.18637/jss.v025.i03
Holden, N. S., Rider, C. F., Bell, M. J., Velayudhan, J., King, E. M., Kaur, M., et al. (2010). Enhancement of inflammatory mediator release by beta2-adrenoceptoragonists in airway epithelial cells is reversed by glucocorticoid action. Br. J. Pharmacol. 160, 410–420. doi: 10.1111/j.1476-5381.2010.00708.x
Horvath, I., Barnes, P. J., Loukides, S., Sterk, P. J., Högman, M., Olin, A. C., et al. (2017). A European Respiratory Society technical standard: exhaled biomarkers in lung disease. Eur. Respir. J. 49:4. doi: 10.1183/13993003.00965-2016
Lewis, N. S. (2004). Comparisons between mammalian and artificial olfaction based on arrays of carbon black-polymer composite vapor detectors. Acc. Chem. Res. 37, 663–672. doi: 10.1021/ar030120m
Lim, S. H., Mix, S., Anikst, V., Budvytiene, I., Eiden, M., Churi, Y., et al. (2016). Bacterial culture detection and identification in blood agar plates with an optoelectronic nose. Analyst 141, 918–925. doi: 10.1039/c5an01990g
Montuschi, P., Mondino, C., Koch, P., Barnes, P. J., and Ciabattoni, G. (2006). Effects of a leukotriene receptor antagonist on exhaled leukotriene E4 and prostanoids in children with asthma. J. Aller. Clin. Immunol. 118, 347–353. doi: 10.1016/j.jaci.2006.04.010
Montuschi, P., Paris, D., Melck, D., Lucidi, V., Ciabattoni, G., Raia, V., et al. (2012). NMR spectroscopy metabolomic profiling of exhaled breath condensate in patients with stable and unstable cystic fibrosis. Thorax 67, 222–228. doi: 10.1136/thoraxjnl-2011-200072
Montuschi, P., Ragazzoni, E., Valente, S., Corbo, G., Mondino, C., Ciappi, G., et al. (2003). Validation of 8-isoprostane and prostaglandin E2 measurements in exhaled breath condensate. Inflamm. Res. 52, 502–507. doi: 10.1007/s00011-003-1212-6
Montuschi, P., Santonico, M., Mondino, C., Pennazza, G., Mantini, G., Martinelli, E., et al. (2010). Diagnostic performance of an electronic nose, fractional exhaled nitric oxide, and lung function testing in asthma. Chest 137, 790–796. doi: 10.1378/chest.09-1836
Motta, A., Paris, D., Melck, D., De Laurentiis, G., Maniscalco, M., Sofia, M., et al. (2012). Nuclear magnetic resonance-based metabolomics of exhaled breath condensate: methodological aspects. Eur. Respir. J. 39, 498–500. doi: 10.1183/09031936.00036411
Paggiaro, P., Chanez, P., Holz, O., Ind, P. W., Djukanovic, R., Maestrelli, P., et al. (2002). Sputum induction. Eur. Respir. J. 37(Suppl.), 3s−8s. doi: 10.1183/09031936.02.00000302
Palama, T. L., Canard, I., Rautureau, G. J., Mirande, C., Chatellier, S., and Elena-Herrmann, B. (2016). Identification of bacterial species by untargeted NMR spectroscopy of exo-metabolome. Analyst 141, 4558–4561. doi: 10.1039/C6AN00393A
Revelle, W. (2017). An Overview of the Psych Package. Package “psych” (version 1.6.9). Available online at: “https://cran.r-project.org/web/packages/psych/vignettes/overview.pdf” (Accessed: 9 January 2018).
Rochfort, S. (2005). Metabolomics reviewed: a new “omics” platform technology for systems biology and implications for natural products research. J. Nat. Prod. 68, 1813–1820. doi: 10.1021/np050255w
Röck, F., Barsan, N., and Weimar, U. (2008). Electronic nose: current status and future trends. Chem. Rev. 108, 705–711. doi: 10.1021/cr068121q
Santini, G., Mores, N., Shohreh, R., Valente, S., Dabrowska, M., Trové, A., et al. (2016). Exhaled and non-exhaled non-invasive markers for assessment of respiratory inflammation in patients with stable COPD and healthy smokers. J. Breath. Res. 10:017102. doi: 10.1088/1752-7155/10/1/017102
van der Schee, M. P., Palmay, R., Cowan, J. O., and Taylor, D. R. (2013). Predicting steroid responsiveness in patients with asthma using exhaled breath profiling. Predicting steroid responsiveness in patients with asthma using exhaled breath profiling. Clin. Exp. Allergy 43, 1217–1225. doi: 10.1111/cea.12147
van Velzen, E. J., Westerhuis, J. A., van Duynhoven, J. P., van Dorsten, F. A., Hoefsloot, H. C., Jacobs, D. M., et al. (2008). Multilevel data analysis of a crossover designed human nutritional intervention study. J. Proteome Res. 7, 4483–4491. doi: 10.1021/pr800145
Wang, Z., Ciabattoni, G., Créminon, C., Lawson, J., Fitzgerald, G. A., Patrono, C., et al. (1995). Immunological characterization of urinary 8-epi-prostaglandin F2α excretion in man. J. Pharmacol. Exp. Ther. 275, 94–100.
Warnes, G. R., Bolker, B., Bonebakker, L., Gentleman, R., Liaw, W. H. A., Lumley, T., et al. (2016). Various R Programming Tools for Plotting Data. Package “gplots” (version 3.0.1). Available online at: https://cran.r-project.org/web/packages/gplots/gplots.pdf (Accessed Jan 9, 2018).
Westerhuis, J. A., van Velzen, E. J., Hoefsloot, H. C., and Smilde, A. K. (2010). Multivariate paired data analysis: multilevel PLSDA versus OPLSDA. Metabolomics 6, 119–128. doi: 10.1007/s11306-009-0185-z
Keywords: breathomics, inhaled corticosteroids, long-acting β2-agonists, COPD, pharmacotherapy
Citation: Montuschi P, Santini G, Mores N, Vignoli A, Macagno F, Shoreh R, Tenori L, Zini G, Fuso L, Mondino C, Di Natale C, D'Amico A, Luchinat C, Barnes PJ and Higenbottam T (2018) Breathomics for Assessing the Effects of Treatment and Withdrawal With Inhaled Beclomethasone/Formoterol in Patients With COPD. Front. Pharmacol. 9:258. doi: 10.3389/fphar.2018.00258
Received: 30 January 2018; Accepted: 08 March 2018;
Published: 17 April 2018.
Edited by:
Irfan Rahman, University of Rochester, United StatesReviewed by:
Alessandro Sanduzzi, University of Naples Federico II, ItalyMario Malerba, Università degli Studi del Piemonte Orientale, Italy
Copyright © 2018 Montuschi, Santini, Mores, Vignoli, Macagno, Shoreh, Tenori, Zini, Fuso, Mondino, Di Natale, D'Amico, Luchinat, Barnes and Higenbottam. This is an open-access article distributed under the terms of the Creative Commons Attribution License (CC BY). The use, distribution or reproduction in other forums is permitted, provided the original author(s) and the copyright owner are credited and that the original publication in this journal is cited, in accordance with accepted academic practice. No use, distribution or reproduction is permitted which does not comply with these terms.
*Correspondence: Paolo Montuschi, paolo.montuschi@unicatt.it
†These authors have contributed equally to this work.