 Yu-Zhu Wang
 Qing Xu
- Department of Pharmacy, Zhongshan Hospital, Fudan University, Shanghai, China
Ginsenoside Rb1 (Rb1) has been demonstrated its protection for central nervous system and is apparently highly distributed to the brain. The objective of this study was to characterize Rb1 transport at the blood–brain barrier (BBB) using primary cultured rat brain microvascular endothelial cells (rBMEC), an in vitro BBB model. The initial uptake velocity of Rb1 in rBMEC was temperature- and concentration-dependent, and was significantly reduced by phloretin, an inhibitor of GLUT1 transporter, but was independent of metabolic inhibitor. Furthermore, the transport of Rb1 into rBMEC was significantly diminished in the presence of natural substrate α-D-glucose, suggesting a facilitated transport of Rb1 via GLUT1 transporter. The impact of GLUT1 on the distribution of Rb1 between brain and plasma was studied experimentally in rats. Administration of phloretin (5 mg/kg, i.v.) to normal rats for consecutive 1 week before Rb1 (10 mg/kg, i.v.) at 0.5, 2, and 6 h did not alter Rb1 concentrations in plasma, but resulted in significant decreased brain concentrations of Rb1 compared to in the phloretin-untreated normal rats (489.6 ± 58.3 versus 105.1 ± 15.1 ng/g, 193.8 ± 11.1 versus 84.8 ± 4.1 ng/g, and 114.2 ± 24.0 versus 39.9 ± 4.9 ng/g, respectively). The expression of GLUT1 in the phloretin-treated group by western blotting analysis in vitro and in vivo experiments was significantly decreased, indicating that the decreased transport of Rb1 in brain was well related to the down-regulated function and level of GLUT1. Therefore, our in vitro and in vivo results indicate that the transport of Rb1 at the BBB is at least partly mediated by GLUT1 transporter.
Introduction
The root of ginseng has been in widespread use for Chinese traditional medicine for millions of years. It has been suggested to have a varieties of pharmacological activities such as vasorelaxation, anti-inflammatory, antidiabetic, anticancer, antioxidation (Kang et al., 2006; Lu et al., 2009; Gao et al., 2010; Qi et al., 2010). The effects of ginseng are mostly attributed to a class of dammarane-type triterpene saponins known as ginsenosides. These ginsenosides are further classified according to their aglycone moieties as 20(S)-protopanaxadiol type (ginsenoside Rb1, Rb2, Rb3, Rc, and Rd) and 20(S)-protopanaxatriol (ginsenoside Re, Rg1, Rg2, and Rh1) (Liu et al., 2009). Ginsenoside Rb1 is one of prominent active constituents in the root of ginseng and accumulating evidence indicates that Rb1 possesses neuroprotection for central nervous system (CNS). Particularly, Rb1 was considered as a potent agent, which could protect brain from ischemia-reperfusion injury possibly by scavenging free radicals, preserving the structural integrity of the neurons, modulating the expression of apoptosis-associated proteins, inhibiting the expression of Beclin 1 and LC3 via activation of PI3K/Akt pathway, and upregulating levels of brain-derived neurotrophic factors (Jiang and Qian, 1995; Lim et al., 1997; Zhang et al., 2006; Liu et al., 2009; Gao et al., 2010; Lu et al., 2011).
Our previous study has determined pharmacokinetic and absolute bioavailability of Total Panax Notoginsenoside (TPNS) after intravenous administration of TPNS injection at the dosage of 10.0 mg/kg to rats. Results show that the largest content of Rb1 and its duration in brain tissue are up to about 1.4 μg/g and 24 h, whereas those of Rg1 are only about 0.2 μg/g and 1 h. Rb1 and Rg1 are present in the greatest amounts in TPNS, because the concentrations of Rb1 and Rg1 are in large amounts in rat plasma or excretory samples. The contents of Rb1 and Rg1 in TPNS are almostly equivalent, about 34 and 26%, respectively (Li et al., 2007). This phenomenon indicates that Rb1 is capable of crossing the blood–brain barrier (BBB) into brain and the specific distribution of Rb1 in rat brain has no obvious correlation with its high content in TPNS. As we all know, the BBB is consisted of brain microvascular endothelial cells (BMEC) working together with astrocytes and pericytes, in which the physical barrier developed by the endothelial tight junctions and the transporter barrier resulting from membrane transporters strictly control the entry of endogenous and exogenous substances from the circulating blood into the CNS, therefore playing an essential role in brain homeostasis and protecting the CNS against many toxic compounds (Abbott et al., 2010). The characteristics of the BBB include high electric impedance, low water conductivity, high reflection coefficient, and low diffusion permeability of water-soluble substances. Evidence from the above described indicates that the impenetrability of BBB constitutes a barrier to most polar molecules and macromolecules delivery to brain parenchyma (Cardoso et al., 2010). The polarity of Rb1 is high and its molecular weight is also large, about 1109.29. So we speculate that some transporters in BMEC membranes are possibly involved in the transport of Rb1 across the BBB. However, what transporter involved in the transport of Rb1 across the BBB has not been reported in the present study so far.
GLUT proteins are encoded by the SLC2 genes and belong to members of the major facilitator superfamily of membrane transporters, which primary function is to transport extracellular glucose from interstitial fluid across the cellular plasma membrane by a passive and facilitative transport process along with the downward gradient concentration of glucose (Shibuya et al., 2014). GLUT proteins consist of 14 members, and GLUT1 and GLUT3 are mostly expressed in the CNS (Mueckler and Thorens, 2013). The ginsenoside Rb1 possesses two glucose moieties at the C-3 and C-20 positions, respectively, so we hypothesize that GLUT1 or GLUT3 in BMEC membranes is involved in the transport of Rb1 across cell membranes.
Therefore, the aim of this study was to demonstrate the transport mechanism of Rb1 across the BBB into brain. First, we measured the uptake kinetics of Rb1 using rBMEC in vitro for the sake of obtaining evidence for active uptake of Rb1 into cells. We then further investigated the effects of multiple inhibitors of transporters on the uptake of Rb1 into rBMEC. Finally, the brain-to-plasma concentration ratio value of Rb1 (Kp) in the phloretin-treated normal rats was measured using LC–MS/MS method for further obtaining evidence that transport of Rb1 across the BBB is actively facilitated by GLUT1 or GLUT3 transporter.
Materials and Methods
Materials
Ginsenoside Rb1 and digoxin (internal standard, IS) were purchased from the National Institute for the Control of Pharmaceutical and Biological Products (Beijing, China). Collagenase type II, bovine serum albumin (BSA), gelatin, phloretin, and D (+)-glucose were purchased from Sigma (Sigma-Aldrich Co. LLC., United States). Fetal bovine serum (FBS) was purchase from GIBCO (Invitrogen Corporation, United States). Dulbecco’s modified Eagle’s medium (DMEM-F12) was purchased from HyClone (Thermo Scientific, United States). Rabbit anti-GLUT1, rabbit anti-GLUT3, and goat anti-rabbit IgG (H+L) conjugated with the appropriate horseradish peroxidase were purchased from Abcam. All other chemicals and reagents were of analytical or LC–MS grade as appropriate.
Animals
Male Sprague-Dawley rats (220–250 g) were supplied by Center of Experimental Animals, Shanghai First People’s Hospital Affiliated Shanghai Jiao Tong University. Animals were housed under a constant environment condition (temperature, 25 ± 1°C; humidity, 50 ± 5%) with free access to standard laboratory diet and water. Sprague-Dawley neonate rats of 10 days old were used. All the experiments were performed in accordance with China’s Guidelines for Care and Use of Laboratory Animals.
Isolation and Primary Culture of rBMEC
Isolation and culture of rat brain microvessel endothelial cells were operated according to previous studies with some modifications (Liu et al., 2013). The isolated rBMEC was seeded in cultured flasks coated with 2% gelatin and cultured in culture medium. The culture medium consisted of DMEM/F12 supplemented with 20% FBS, 2 mM L-glutamine, heparin (50 mg/L), 100 IU/mL penicillin, 100 μg/mL streptomycin, and NaHCO3 (0.5 g/L). On the first day after seeding, the culture medium was replaced, after which the culture medium was replaced every 2 days. At 5–6 days, the rBMEC was transferred to 6-well plates coated with gelatin and cultured in an incubator with a saturated humidity at 37°C in 5% CO2 and 95% air. Transport studies were performed when cells reached 100% confluency. The endothelial phenotype of the rBMEC was identified by staining for the endothelial cell marker vWF using a confocal laser scanning microscope (Leica TCS SP8).
Transport Studies
When rBMEC was grown to 100% confluency in gelatin-coated 6-well plates, uptake experiments were performed. Briefly, the cultured cell monolayer was washed three times with 1 mL of pH 7.4 Hanks’ balanced salt solution (HBSS). The cultured rBMEC was pre-incubated for 30 min in 1 mL HBSS at 37 or 4°C. After pre-incubation, the HBSS solution was removed by suction, and HBSS (1 mL) containing 60 μg/mL Rb1 was added to initiate uptake. Then the cells were incubated at 37 or 4°C at a set time (5, 10, 15, 30, 60, 120, and 240 min). After the end of the incubation, the incubation solution was aspirated and the monolayers were carefully washed three times with 1 mL ice-cold HBSS to terminate the uptake. Then, 0.5 mL ultrapure water was added to each incubated well, and the material in the wells was frozen (at -80°C)/thawed (at room temperature) repeatedly four times to lyse cells. After the solubilized, the monolayer supernatants were collected and 10 μL was injected into LC–MS/MS to determine Rb1 concentration. The protein contents of the cell monolayers were measured by the method of Bradford using BSA as the standard (Bradford, 1976). Uptake was expressed as the cell-to-medium ratio (μL/mg protein or μL/mg protein/min) and termed the volume of distribution (Vd), obtained by dividing the uptake amount by the concentration of substrate in the transport medium. Vd is derived from the ratio of ng/mg protein to ng/μL buffer.
In order to assess the kinetic parameters, Rb1 uptake data (7.5 to 960 μg/mL for 120 min) were analyzed using Michaelis-Menten plots based on the following equation: , where V is the initial uptake rate of substrate (nmol/mg protein/min), Vmax is the maximum uptake rate (nmol/mg protein/min), S is the concentration of Rb1 in the medium (μM), Km is the Michaelis-Menten constant (μM), and Pdiff is the non-saturable uptake clearance (μL/mg protein/min), respectively (Kitamura et al., 2014). The uptake data were fitted to the above equation by nonlinear least-squares regression analysis with Graphpad Prism 5.0 software.
Transporter Inhibition Assays
Our study showed that the uptake of Rb1 by rBMEC was dependent on time, concentration, and temperature. A steady-state uptake occurred at 120 min. In the present study, the uptake at 120 min was selected to measure the effect of test agents on the transport characteristics of Rb1. Rb1 concentration was set to be 60 μg/mL. The rBMEC was seeded out in 6-well plates, allowed to adhere, and grown to confluency. To study the transport mechanisms, uptake of Rb1 was carried out in the presence of a metabolic energy inhibitor and a series of established transporter inhibitors. The impact of these inhibitors on Rb1 uptake by rBMEC was assessed at the steady state at 37°C. NaN3 (500 μM), probenecid (100 μM), CsA (25, 50, and 100 μM), or phloretin (5 μM) was added to inhibit different transport systems. In the inhibition study, to further assess the effect of phloretin on Rb1 uptake into rBMEC, the cells were incubated at 37°C at a set time (5, 15, 30, 60, and 120 min). Uptake was measured after incubation with Rb1 in the presence of phloretin at the concentration of 5 μM.
In the competition experiments, Rb1 uptake (30–960 μg/mL) was measured in the absence and presence of D-glucose (100 mM) which is a principal physiological substrate of GLUT1. Briefly, cells were grown in 6-well plates for 7 days before their medium was removed, pre-incubated with warm glucose-free Hanks’ solution for 30 min. Subsequently, samples and controls were treated as described transport studies, but this time in addition with 100 mM D-glucose to the various concentrations of Rb1 in glucose-free Hanks’ solution at 37°C for 120 min.
Cell Viability Assessment
The cytotoxic effects of the test agents used in this study were assessed on confluent monolayers of cells in 96-well plates using a CCK-8 assay. Cells were subjected to a 200 μL/well of each drug in Hanks’ solution at the concentrations used in the experiments, followed by incubation for another 4 h. Then, 10 μL Cell Counting Kit-8 (CCK8, Dojindo) solution was added to each well. Plates were incubated for additional 4 h. Absorbance readings at 450 nm were obtained using a spectrophotometer (Thermo Varioskan) and expressed as percentage viability compared to control untreated cells.
Effect of Phloretin on Distribution of Rb1 in Plasma and Brain of Normal Rats
Rats were randomly divided into two groups in 36 of each group. One group served as the control and another group were treated with phloretin. Dose of phloretin was set to be 5 mg/kg. Rb1 (10 mg/kg, i.v.) was administered to the experimental rats after i.v. administration of phloretin or saline for consecutive 1 week. Six rats from each group were selected and the blood samples were collected into heparinized Eppendorf tubes via the abdominal aorta at 0.5, 2, and 6 h after Rb1 administration. Then, brain samples were immediately collected. The plasma samples were obtained by centrifuging at 1000 × g for 10 min. Plasma and brain samples were frozen at -80°C until analysis.
HPLC–MS/MS Method for Rapid Quantification of Rb1 in Cells, Plasma, and Brain
HPLC–MS/MS was composed by a Shimadzu LC-20A chromatographic system and an API 4000 mass spectrometer equipped with electrospray ionization (ESI) source system. MS/MS detection was performed on an API 4000 mass spectrometer using multiple reaction monitoring (MRM) mode by monitoring the fragmentation of m/z 1107.6 → 179.0 for Rb1 and m/z 779.4 → 345.2 for digoxin (IS). Chromatographic separations were carried out on a Shim-pack XD-ODS column (2.0 mm × 30 mm, 2.2 μm) with a Shim-pack GVD-ODS (2.0 mm × 5 mm, 4.6 μm) guard column (Shimadzu, Japan) at a flow rate of 0.28 mL/min using 10 mM acetic acid in water (phase A) and methanol (phase B) as mobile phase. A linear step gradient elution was performed as followed: phase B was increased from 45 to 90% within the first 3 min, and decreased to 45% within the next 3 min (total gradient time: 6 min). A 10 μL sample was injected into the system with the auto-sample conditioned at 4°C and column temperature maintained at 40°C.
The biological samples (100 μL) were placed in a 1.5 mL Eppendorf tube, and mixed with 10 μL IS solution (500 ng/mL) for 3 min by vortexing. The mixture was extracted with methanol (0.9 mL) by vortexing, and then centrifuged at 14,000 rpm for 5 min. The supernatant (0.8 mL) was transferred to a new 1.5 mL Eppendorf tube and evaporated to dryness under vacuum. The dried residue was reconstituted with 100 μL methanol, vortex-mixed for 30 s, and centrifuged at 14,000 rpm for 5 min. Finally, 10 μL of the supernatant liquid was immediately subjected to HPLC–MS/MS analysis. The system control and data analysis were performed by AB Sciex Analyst software (the software version: Analyst 1.5.1). Retention time for Rb1 was tR = 3.80 ± 0.01 min and for IS digoxin tR = 3.13 ± 0.01 min. The lowest limits of quantitation of Rb1 in cell lysate, plasma, and brain homogenate were 1, 2.5, and 1 ng/mL, respectively. The recoveries were higher than 90%; the relative standard deviations (SD) of intra-day and inter-day were lower than 10%.
Western Blotting
Total proteins were extracted and 60 μg of each protein was separated on SDS-10% polyacrylamide gels. Proteins on the gel were transferred to PVDF membrane (Merck-Millipore). Blots were blocked with 5% skimmed milk dissolved in PBS containing 0.1% Tween-20 (PBST) for 2 h at room temperature. The membrane was incubated with primary antibody at 4°C overnight. Washing of the blots with PBST three times was followed by incubation with horseradish peroxidase-conjugated secondary antibody for 2 h at room temperature. After washing, the chemiluminescence signal was monitored using the ChemiDoc XRS+ system (Bio-Rad, Hercules, CA, United States). Densitometric semi-quantitative analysis of protein bands was carried out using Image J.
Statistical Analysis
All data were expressed as mean ± SD. Statistical significance of difference among groups was evaluated by one-way of analysis of variance (ANOVA) and the Student’s t-test. A P-value of <0.05 indicated a statistical significance.
Results
Uptake Kinetics of Rb1 by rBMEC
Uptake of Rb1 by rBMEC was evaluated at various intervals (5, 10, 15, 30, 60, 120, and 240 min) to obtain the optimal time for uptake studies. Figure 1 shows the time course of the uptake of Rb1 by rBMEC at a concentration of 60 μg/mL at 37 and at 4°C. Rb1 uptake increased linearly with time until 120 min, and a plateau of accumulation was observed at 120–240 min. Accordingly, uptake at 120 min was used for subsequent kinetic and inhibition studies. However, in contrast, the uptake rate at 4°C was slow and the intracellular amounts of Rb1 were about two to threefold greater at 37°C than those at 4°C. This indicated transporters in rBMEC membranes were involved in the Rb1 transport.
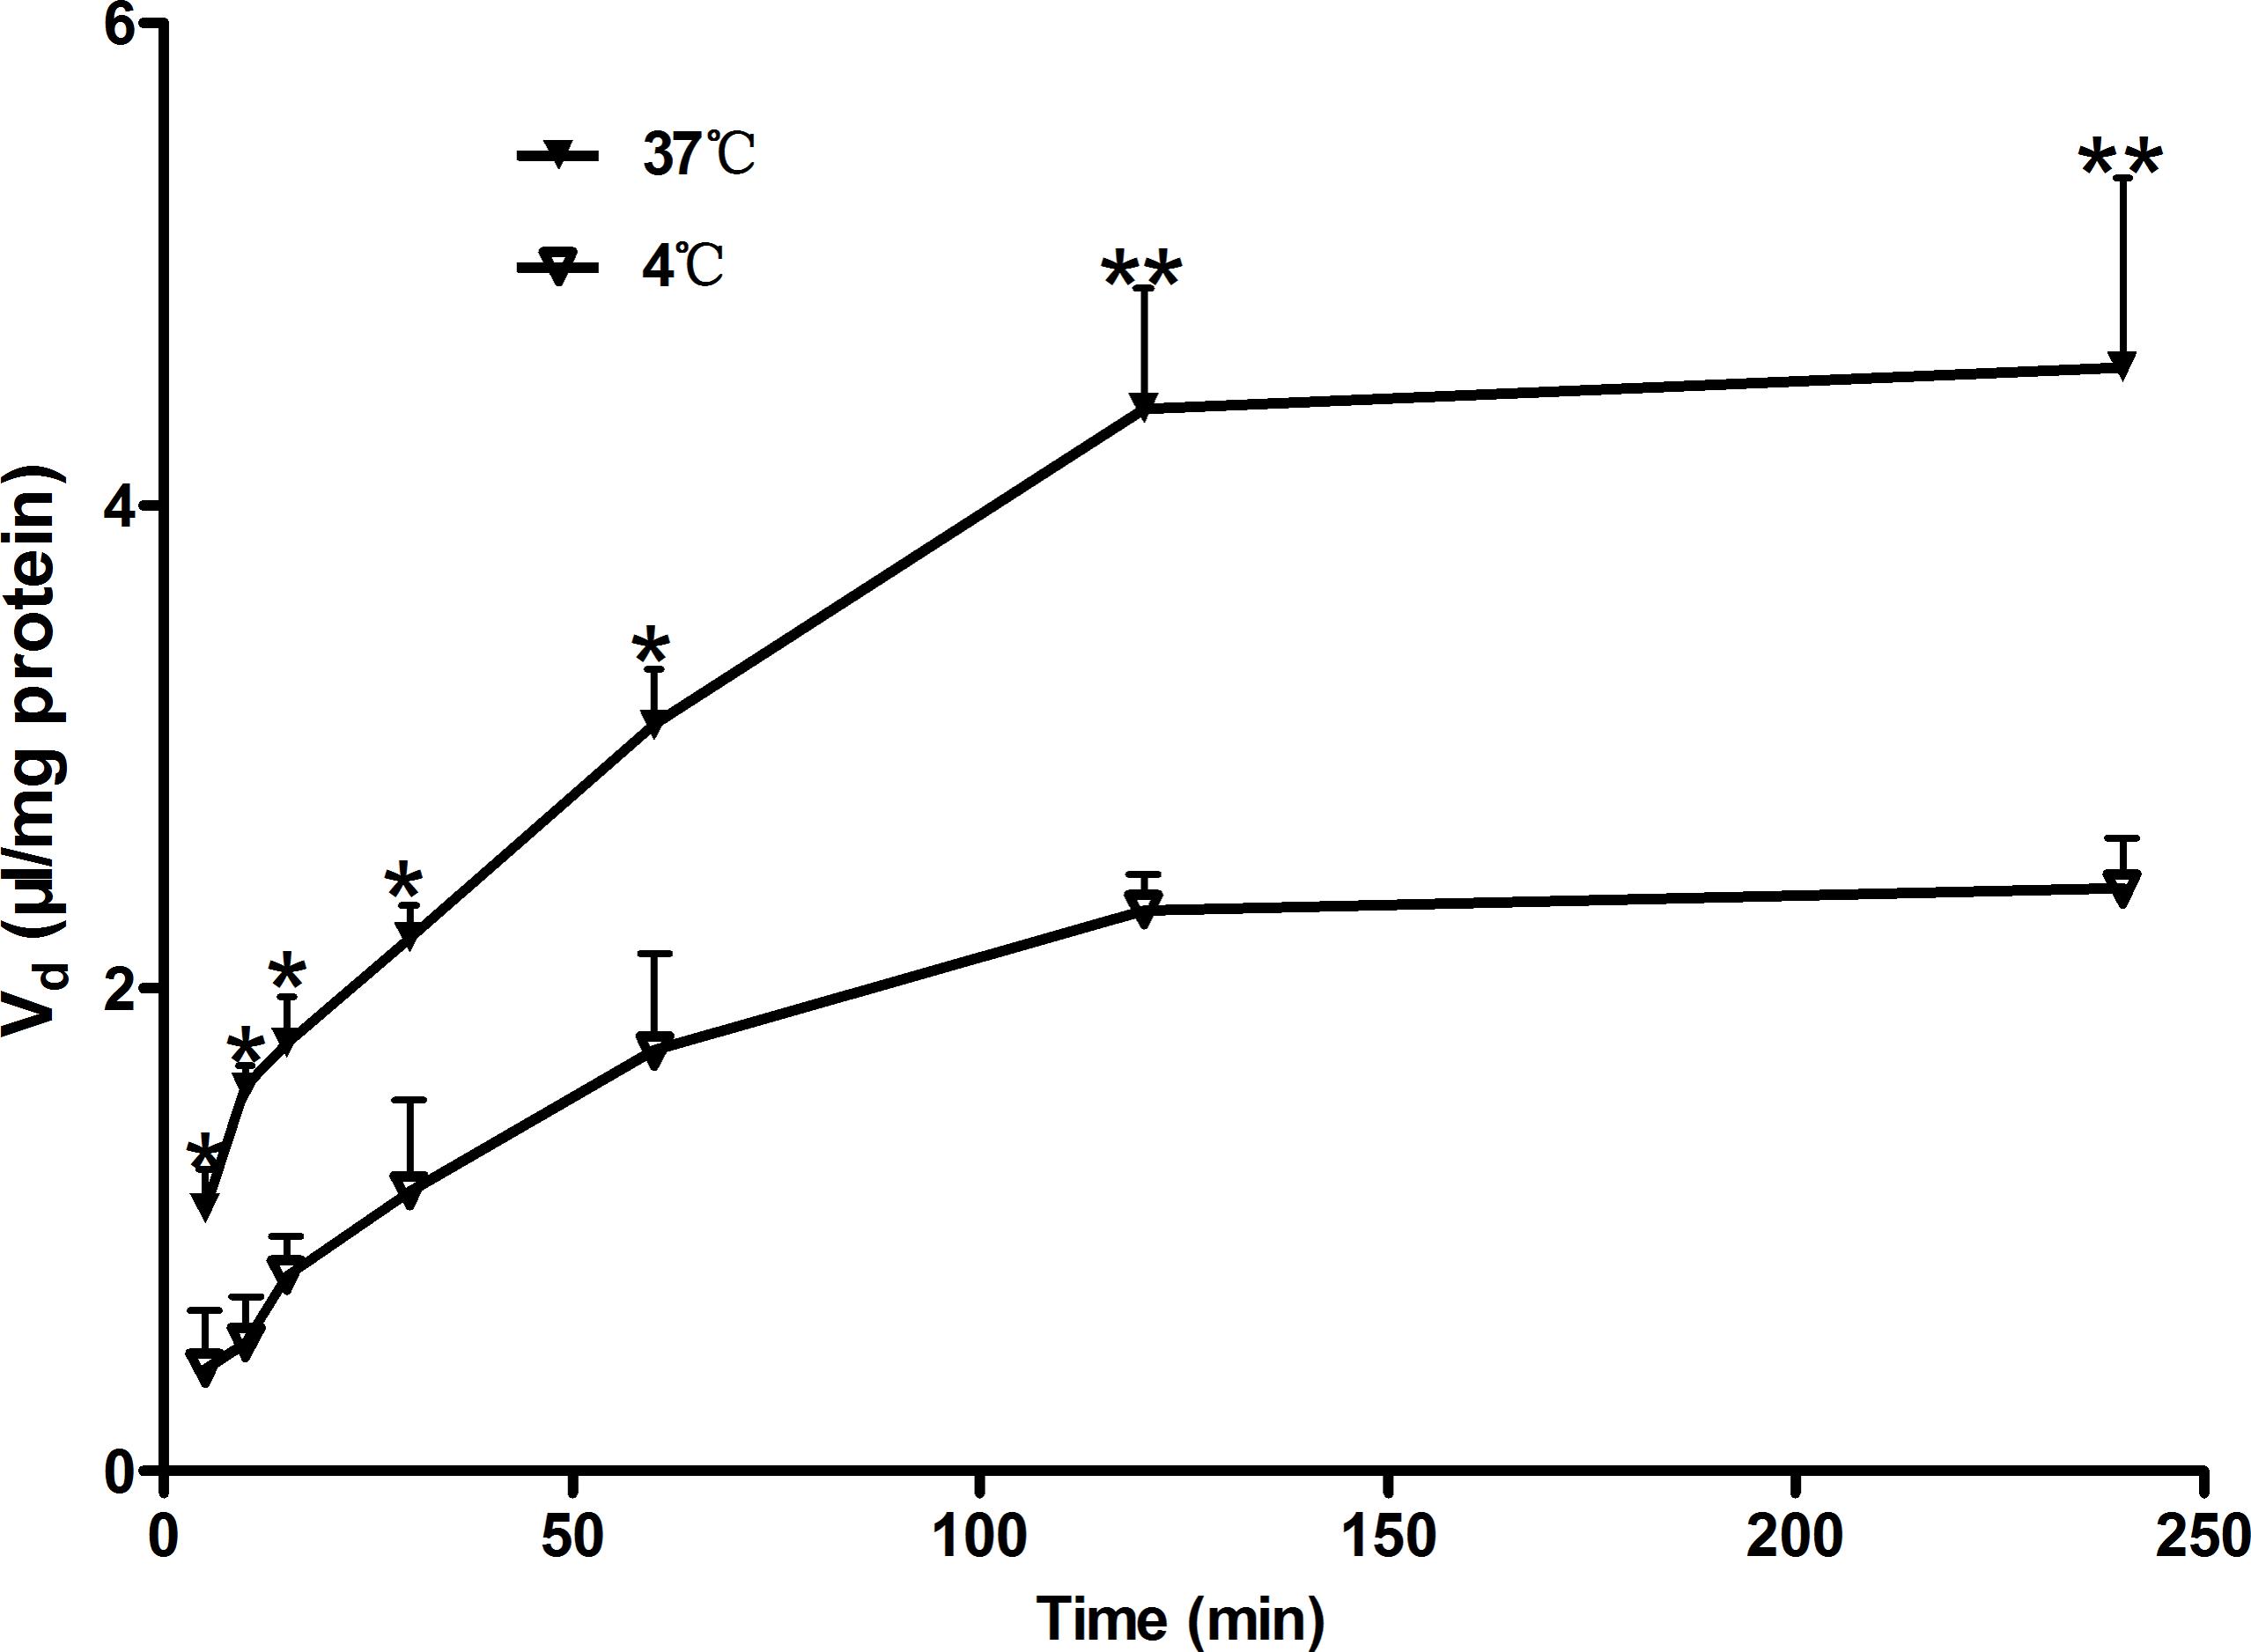
FIGURE 1. Time course of Rb1 uptake by rBMEC. Uptake of Rb1 (60 μg/mL) was measured at 37°C (black markers) and 4°C (white markers) with primary rBMEC cultured on 6-well plates for different times. Each point represents the mean ± SE (n = 3). Asterisks show a significant difference (∗P < 0.05 and ∗∗P < 0.01 versus white markers).
To study the mechanism of Rb1 transport, uptake of Rb1 by rBMEC was examined at various concentrations (7.5–960 μg/mL) at steady state and the kinetics parameters (Km and Vmax) were investigated by fitting the data to the Michaelis-Menten equation. As shown in Figure 2A, initial uptake of Rb1 showed concentration dependency. Kinetics analysis provided a Km value of 119.2 ± 15.6 μM and a Vmax of 0.0034 ± 0.0003 nmol/(mg protein ⋅ min). The Eadie–Hofsee plot for saturation uptake, fitted by subtraction of nonsaturable uptake from total uptake, approximately appeared a straight line (R2 = 0.9066), indicating involvement of a simple passive membrane diffusion (Figure 2B).
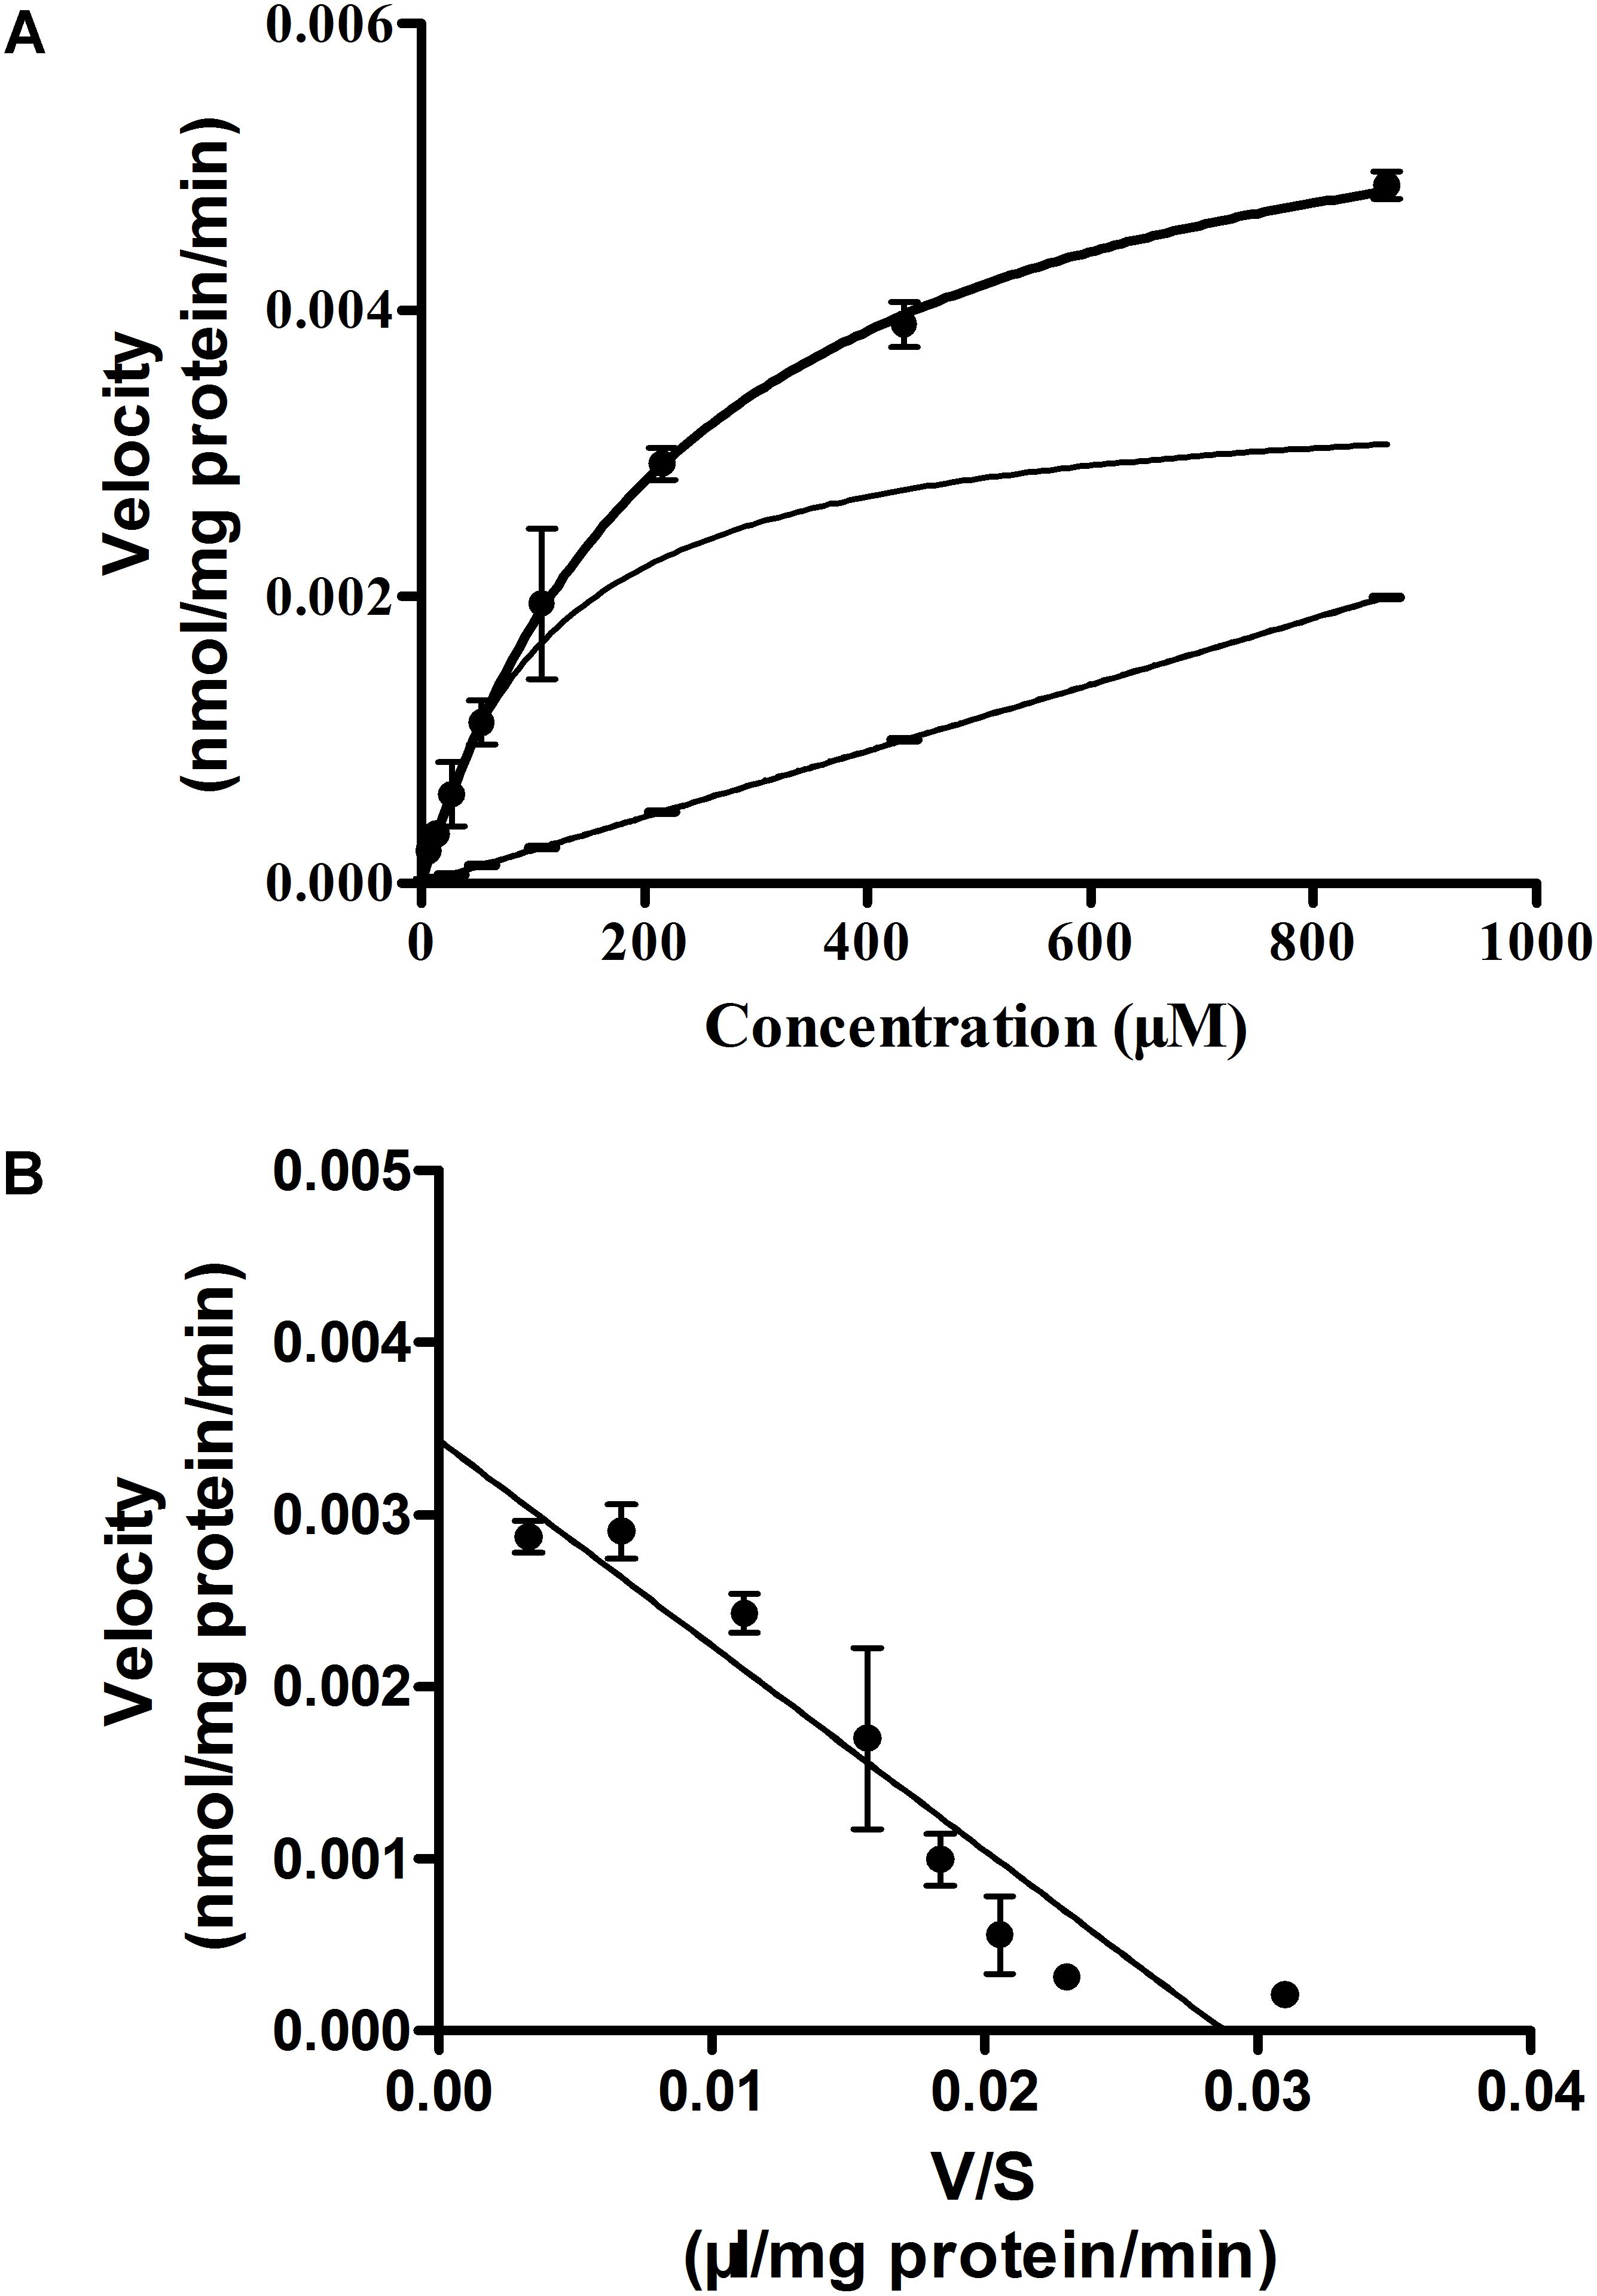
FIGURE 2. Concentration-dependence of Rb1 uptake (A) into rBMEC and the Eadie–Hofstee plot (B). rBMEC was incubated in Rb1 solution at different concentration (7.5, 15, 30, 60, 120, 240, 480, and 960 μg/mL) at 37°C for 120 min. Cells were lysed and the intracellular amount of Rb1 was evaluated by LC–MS/MS. Each point represents the mean ± SE (n = 3). The solid curve, solid line, and curve represent estimated total, nonsaturable, and saturable uptakes, respectively (A). V and S represent initial uptake velocity [nmol/(mg protein ⋅ min)] of the saturable component and concentration of Rb1 (B).
Inhibition of Rb1 Uptake
To clarify whether the accumulation of Rb1 in rBMEC was not only related to a simple passive diffusion, but to facilitated diffusion, we performed the effects of various inhibitors of transporters that facilitate the uptake of Rb1 into rBMEC. As shown in Figure 3, while no statistically significant differences were observed with inhibitors of the ABCB1 (P-gp, CsA) (Sun et al., 2006), organic anion-transporting polypeptides (OATPs, probenecid) (Jørgensen et al., 2007), and metabolic energy (NaN3) (Kitamura et al., 2014), a significant decrease (∗∗P < 0.01 versus the control) of Rb1 uptake into rBMEC was seen in the presence of the inhibitor phloretin that inhibits glucose transporters (GLUT1) (Carruthers et al., 2009). This result indicated that Rb1 uptake crossing rBMEC membranes was independent of ATP and was actively transported by GLUT1-mediated facilitated diffusion.
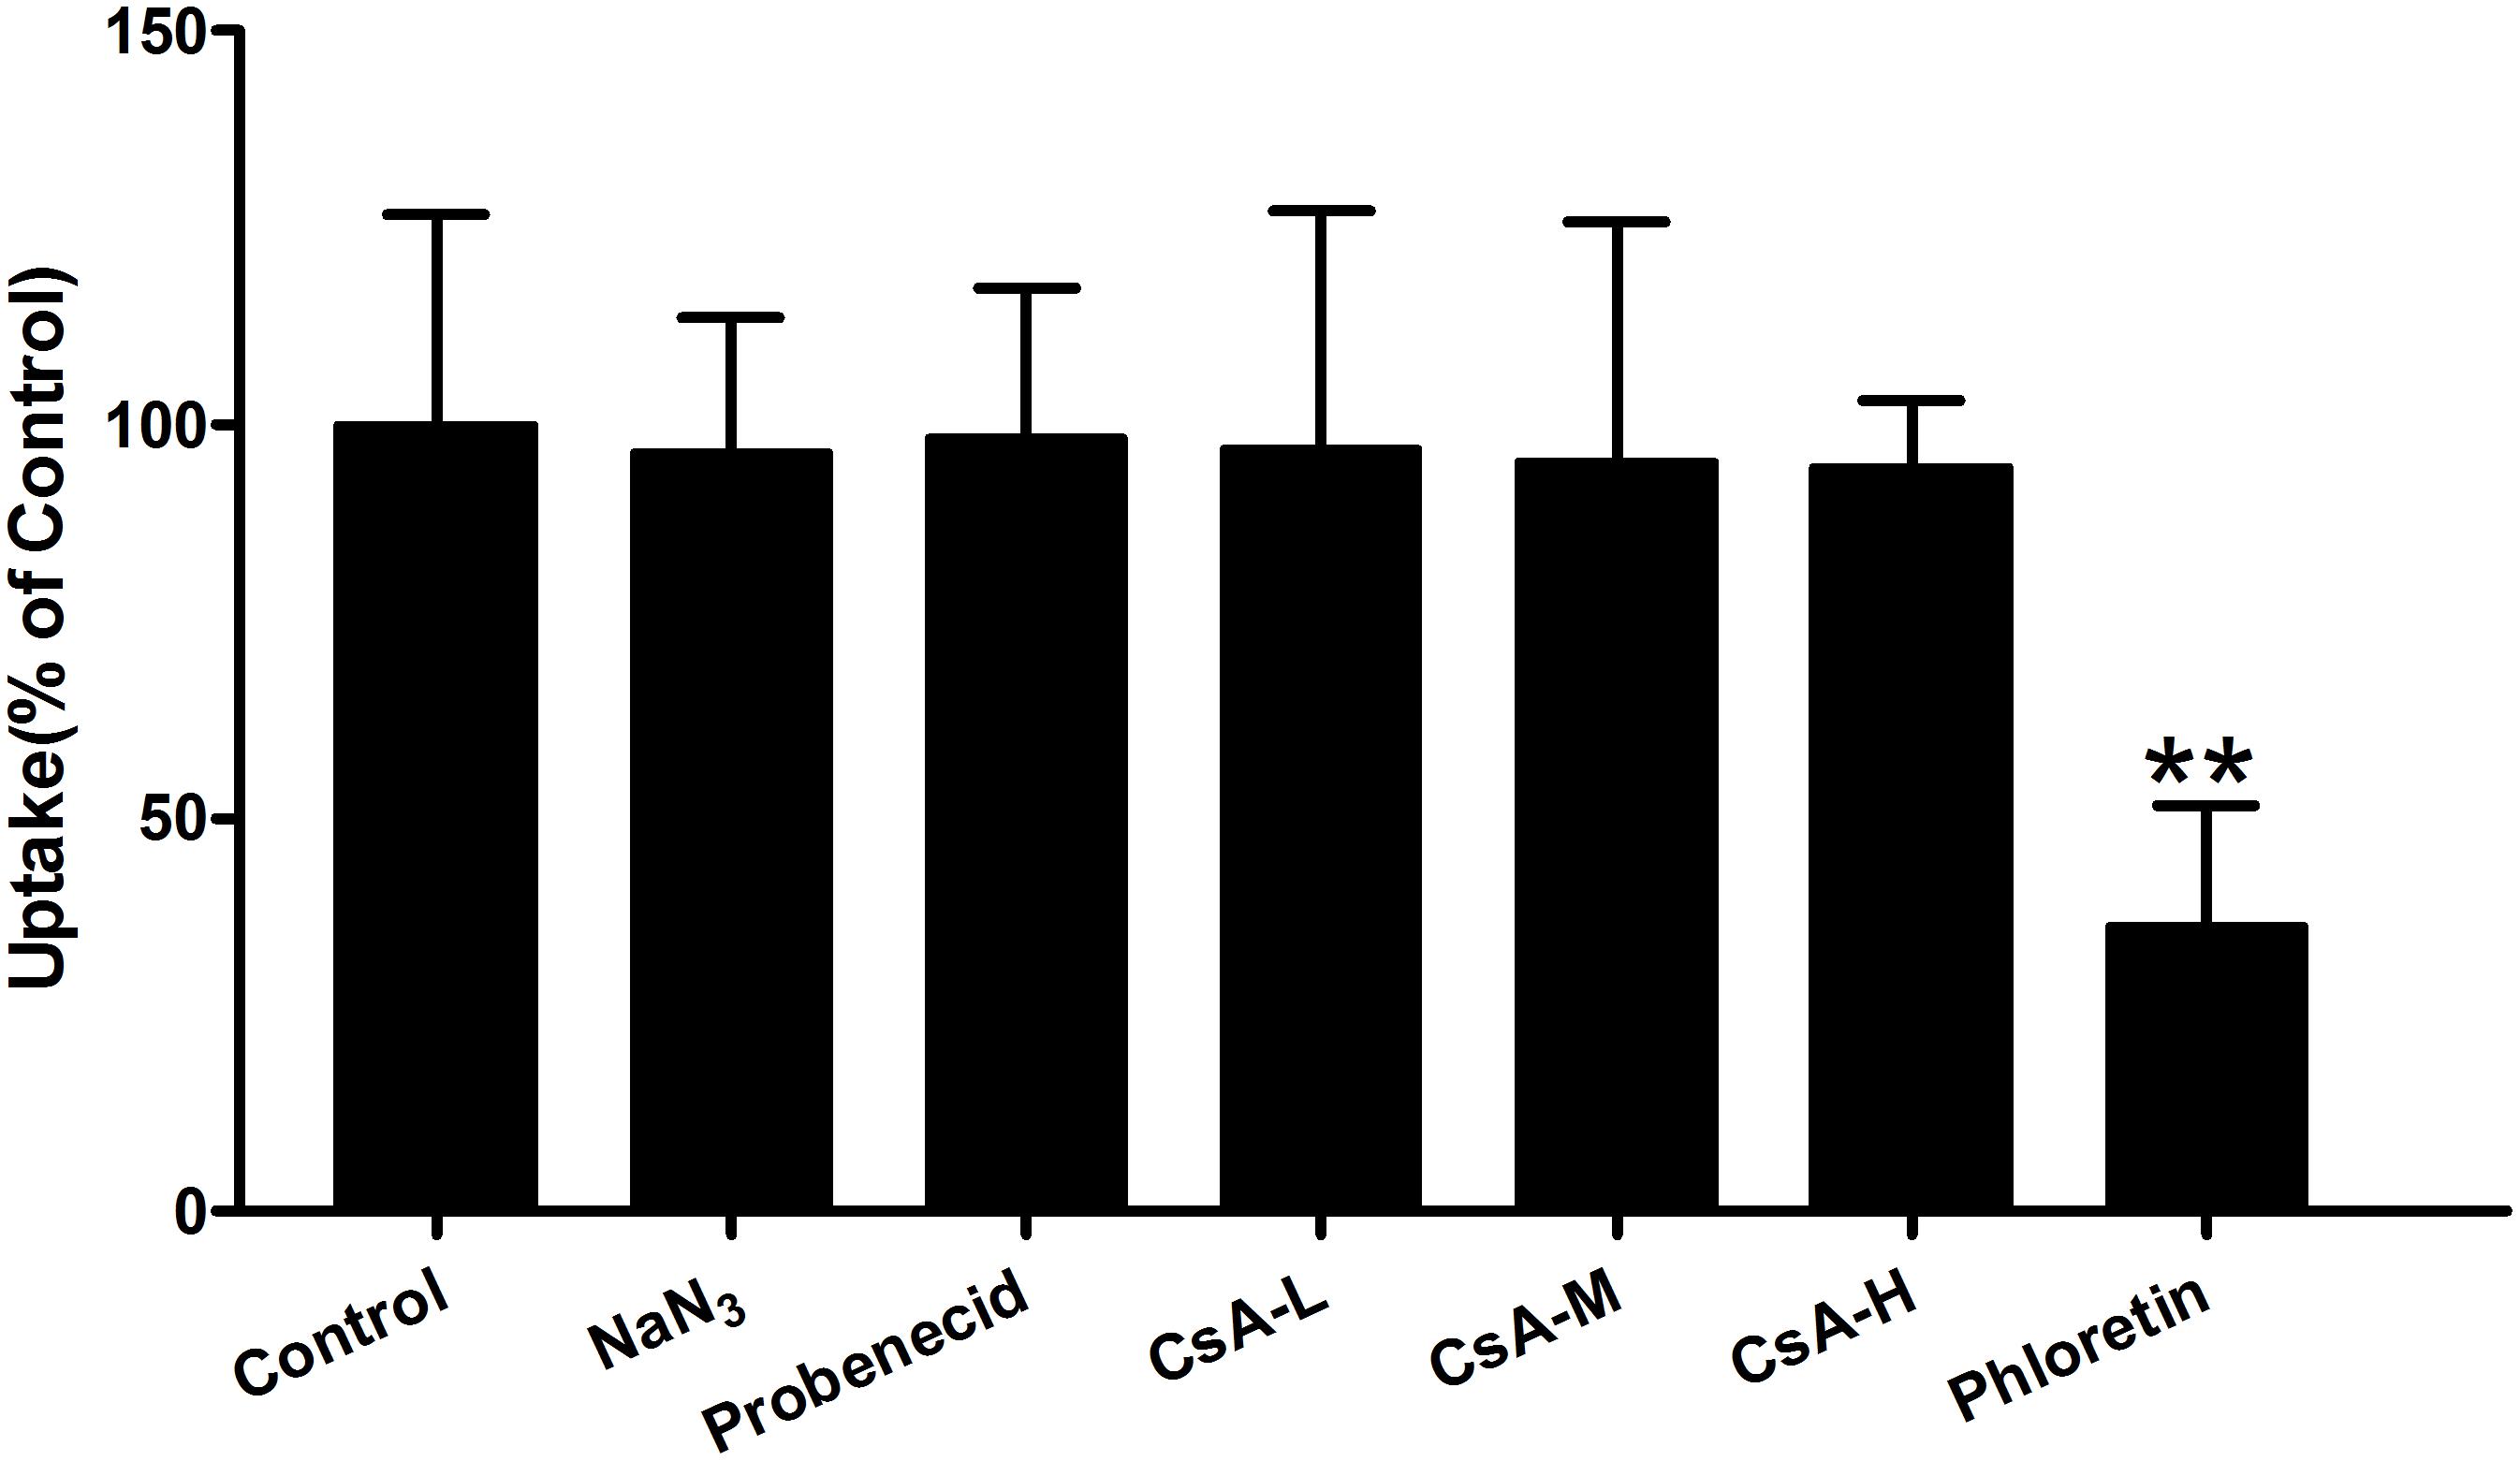
FIGURE 3. Effect of ATP-depletion and influx or efflux transporter inhibitors on Rb1 uptake into rBMEC. Rb1 uptake (60 μg/mL) was measured in the absence (control) or presence of sodium azide (NaN3, 500 μM), probenecid (100 μM), cytochalasin A (CsA, 25, 50, and 100 μM), and phloretin (5 μM) at 37°C for 120 min. Each column represents the mean ± SE (n = 3) with significant differences from control shown as ∗∗P < 0.01.
In order to investigate whether the changes in Rb1 uptake by rBMEC in presence of the tested agents resulted from cell damage caused by the agents used, cells were incubated in Hanks’ solution containing of 500 μM NaN3, 100 μM probenecid, 25, 50, and 100 μM CsA, or 5 μM phloretin at 37°C for 4 h. Proliferation of rBMEC exposure to the test agents used was measured by CCK-8 assay. Compared with the control, no statistically significant differences existed (P > 0.05 versus the control, Figure 4). Thus, we concluded that the agents used did not have cytotoxicity at the concentration used, and that changes in the uptake of Rb1 did not result from cell damage. Phloretin, which significantly inhibited the uptake of Rb1 by rBMEC, was selected for further study.
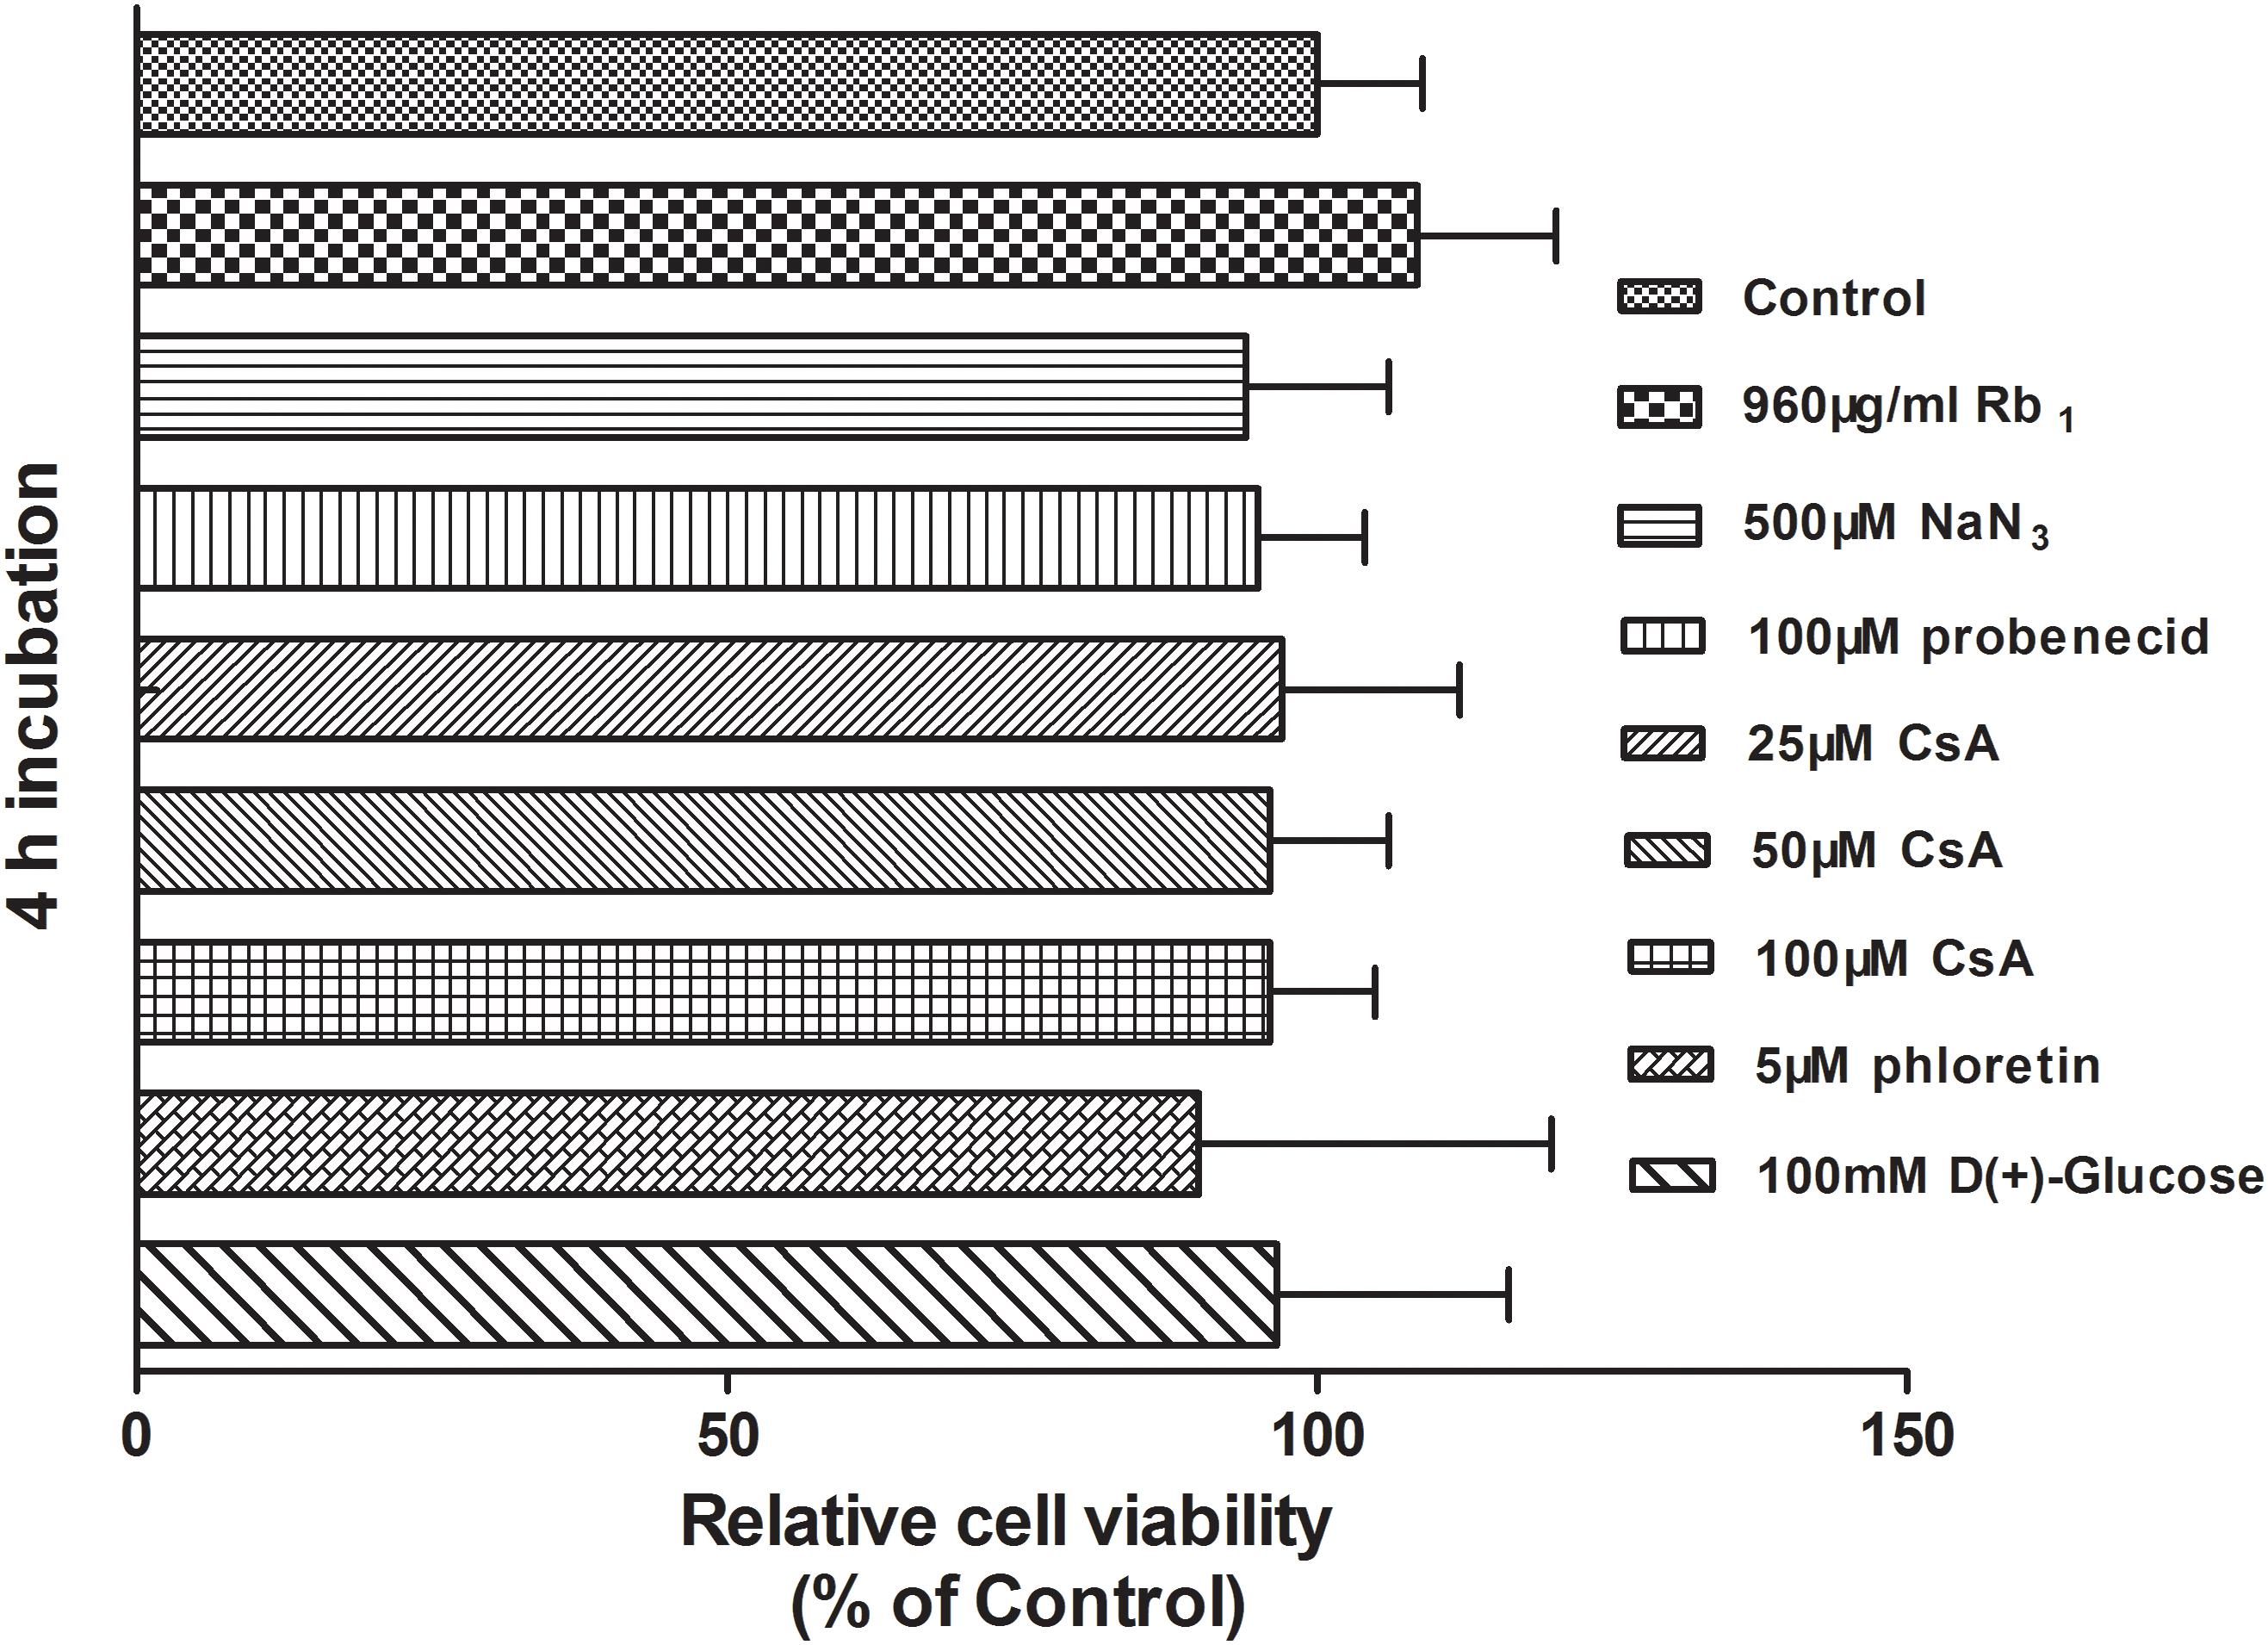
FIGURE 4. Cytotoxicity of test agents used in the study. The viability of rBMEC with a confluent monolayer exposure to the test agents used was examined by CCK-8 assay. Each column represents the mean ± SE of five replicates. Compared with the control, there was no statistically significant differences (P > 0.05).
Inhibition of Phloretin on Rb1 Uptake Into rBMEC
In order to further investigate the effect of phloretin on Rb1 uptake into rBMEC, the time course of Rb1 uptake in the absence or presence of 5 μM phloretin was evaluated at 37°C. As shown in Figure 5A, the cell-to-medium (C/M) ratio of Rb1 was increased with time, but it was found that phloretin significantly decreased the C/M ratio of Rb1, especially from min 30 to 120. GLUT1 and GLUT3, encoded by the SLC2A1 and SLC2A3 gene, respectively, are 2 of 14 facilitative GLUT transporter members and are mainly expressed in CNS. To see whether the decreased C/M ratio of Rb1 was correlated with the expression level of GLUT1 or GLUT3 in rBMEC, western blot assay was performed (Figure 5B). Statistical analysis showed that the expression levels of GLUT1 at 30, 60, and 120 min were significantly lower than that of control (Figure 5C, ∗P < 0.05 and ∗∗P < 0.01 versus the control). However, compared with the control, there was no significant difference in the expression level of GLUT3. These data indicated that the decreased C/M ratio of Rb1 was correlative well to the down-regulated function and level of GLUT1 in rBMEC.
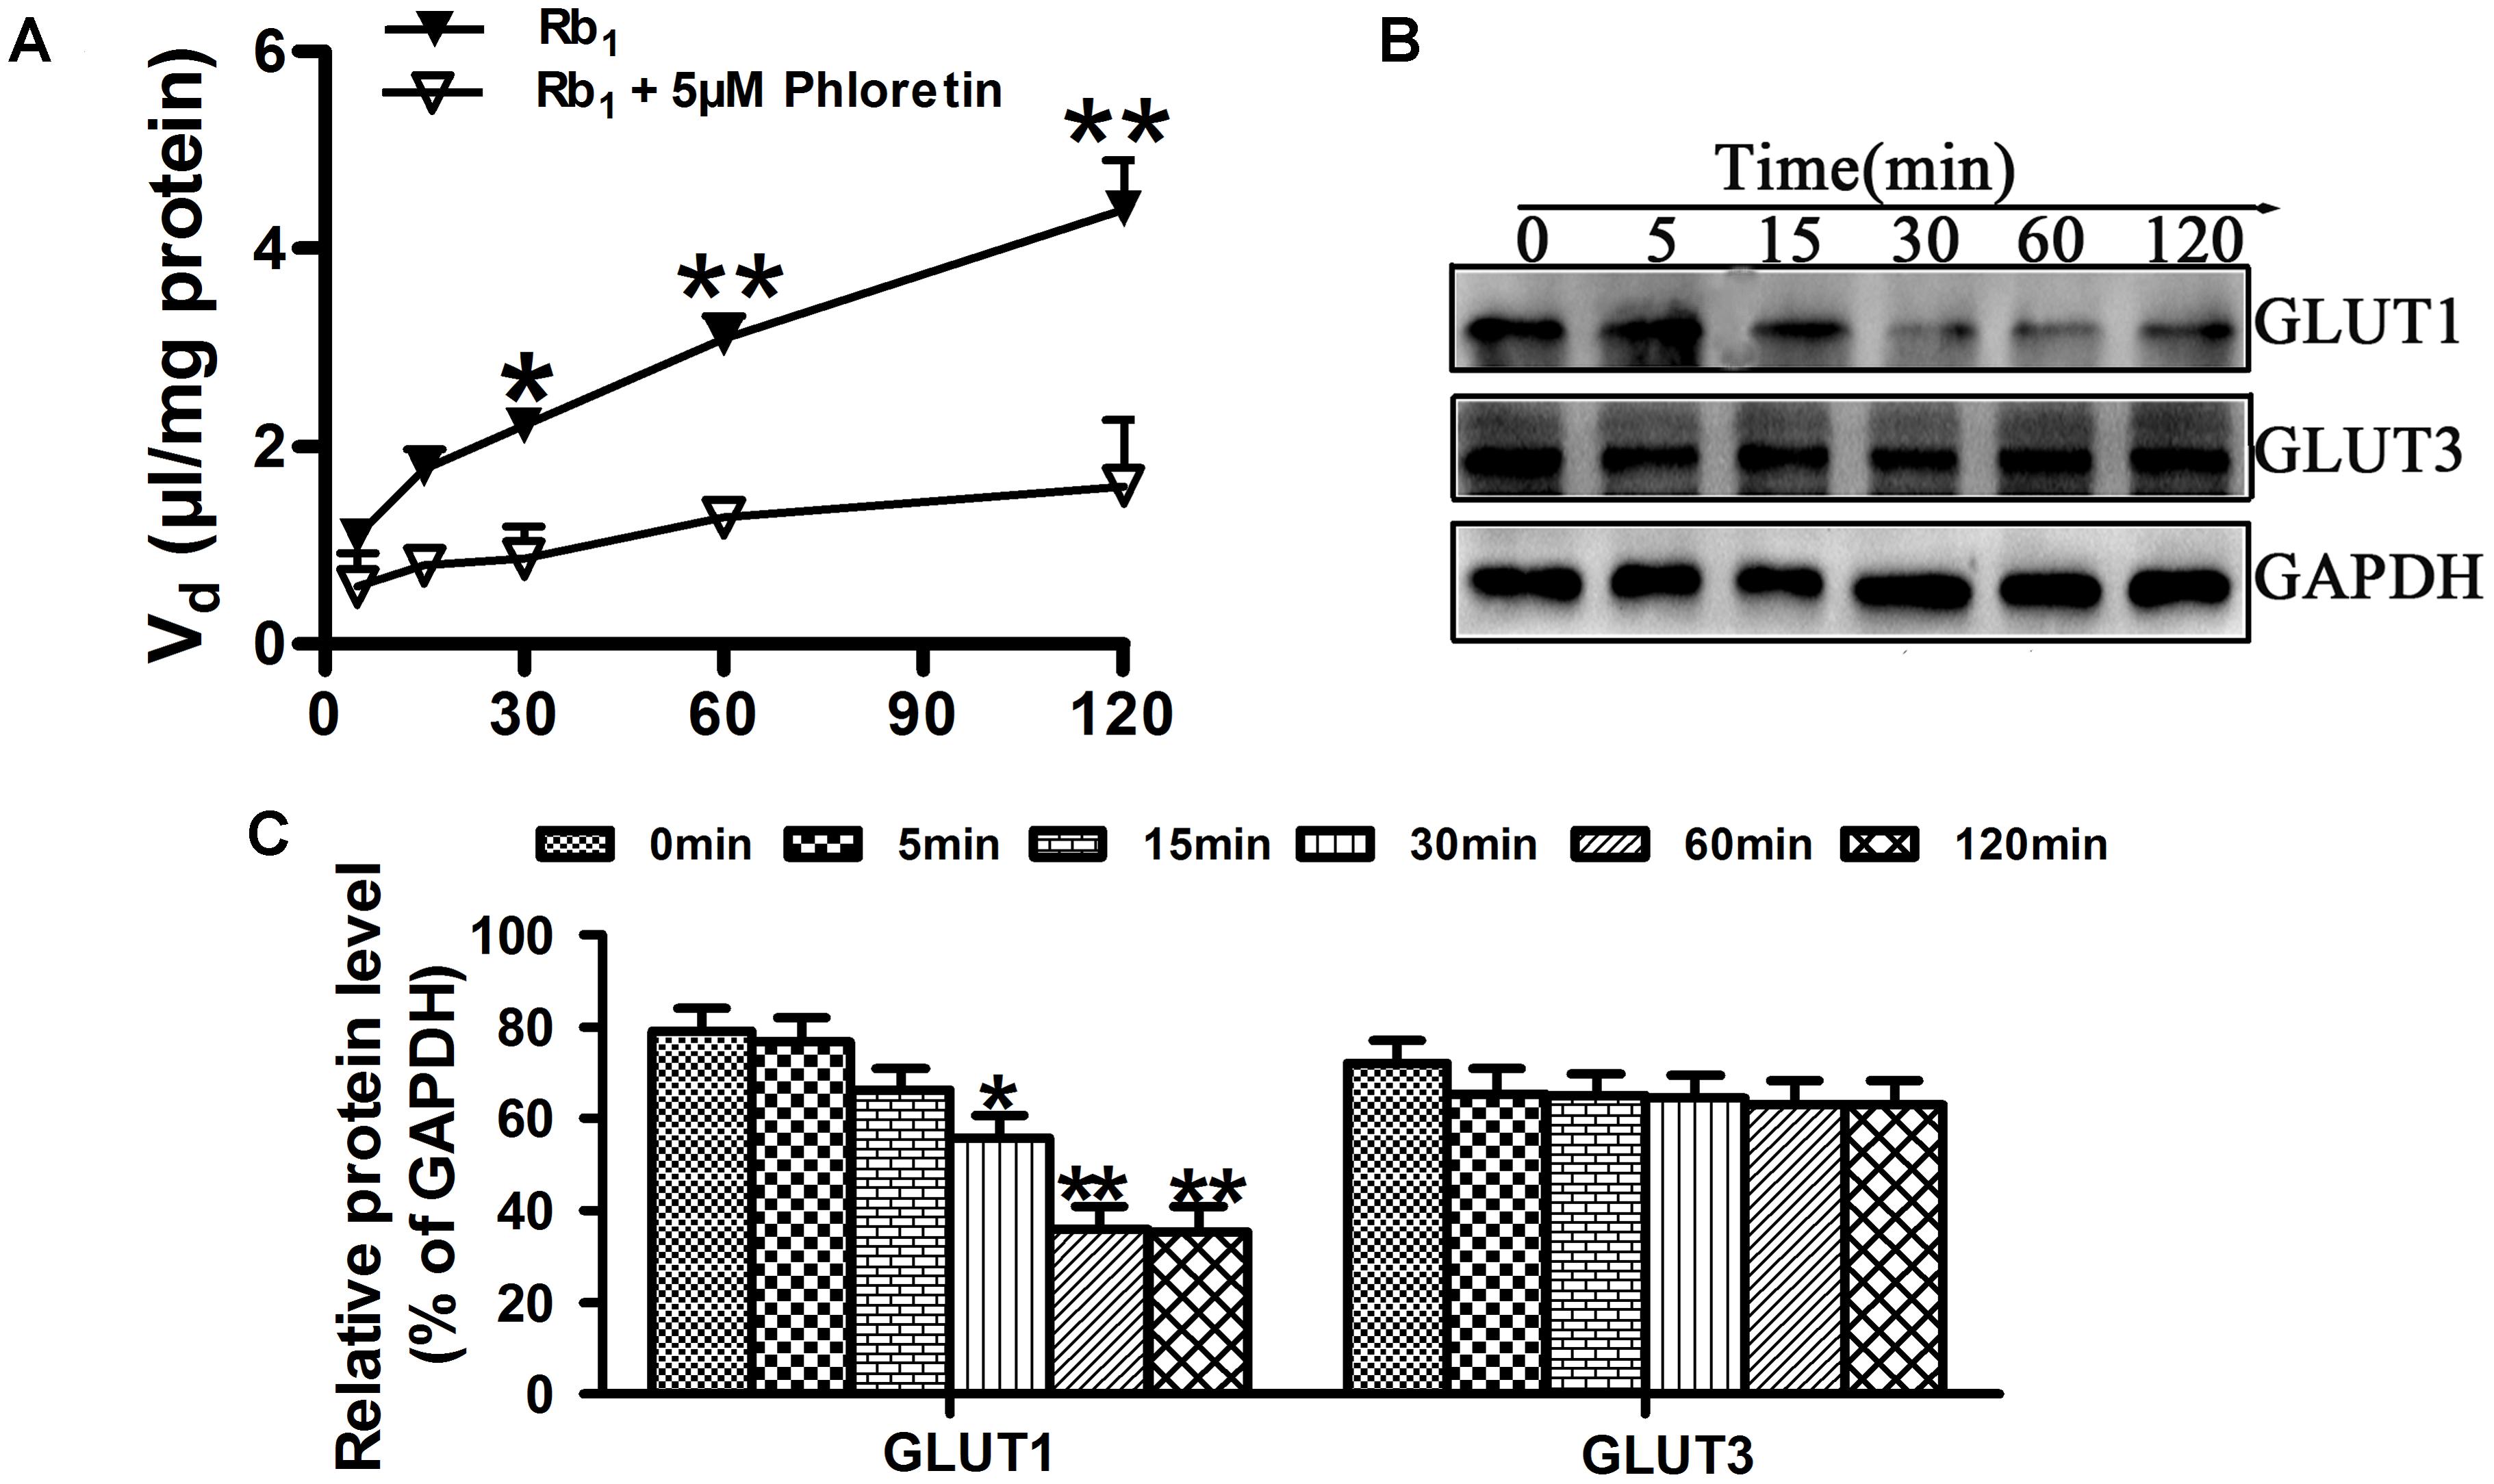
FIGURE 5. Effect of phloretin on Rb1 uptake into rBMEC. (A) To assess the roles played by GLUT1 in the transport of Rb1, the cellular uptake amount of Rb1 in confluent monolayers of rBMEC in 6-well plates was measured with 60 μg/mL Rb1 alone, or together with 5 μM phloretin at the designated time intervals at 37°C. Each point represents the mean ± SE (n = 3). Asterisks show a significant difference, ∗P < 0.05 and ∗∗P < 0.01 versus GLUT1 inhibitor groups. (B) Western blot assay was performed to evaluate the expression level of GLIUT1 and GLUT3 in rBMEC treated together with phloretin and Rb1 at the designated time intervals. (C) Relative protein level was quantitated using Image J. Each point represents as the mean ± SE (n = 3), with significant differences from control shown as ∗P < 0.05 and ∗∗P < 0.01, GLUT1 inhibitor groups versus control, using GAPDH as an internal control for protein loading.
Competitive Inhibition of D-Glucose on Rb1 Uptake by rBMEC
While GLUT1 is able to transport galactose, mannose, and glucosamine, its principal physiological substrate is glucose. Under normal physiological conditions, the brain is absolutely dependent on glucose as a fuel source. GLUT1, as the major GLUT isoform expressed in brain endothelial cells, plays an important role in glucose transport across the BBB (Yeh et al., 2008). In the initial experiments, we analyzed the uptake characteristics of Rb1 by rBMEC. When we added the inhibitor phloretin of GLUT1, we observed significantly reduced C/M ratio of Rb1 uptake into rBMEC. Likewise, in Lineweaver–Burk plot of the inhibitory effects on the uptake of Rb1, the plots of Rb1 uptake in the absence and presence of D-glucose intersected at the ordinate axis (Figure 6), indicating that D-glucose competitively inhibited Rb1 uptake with a Ki value of 885 μM.
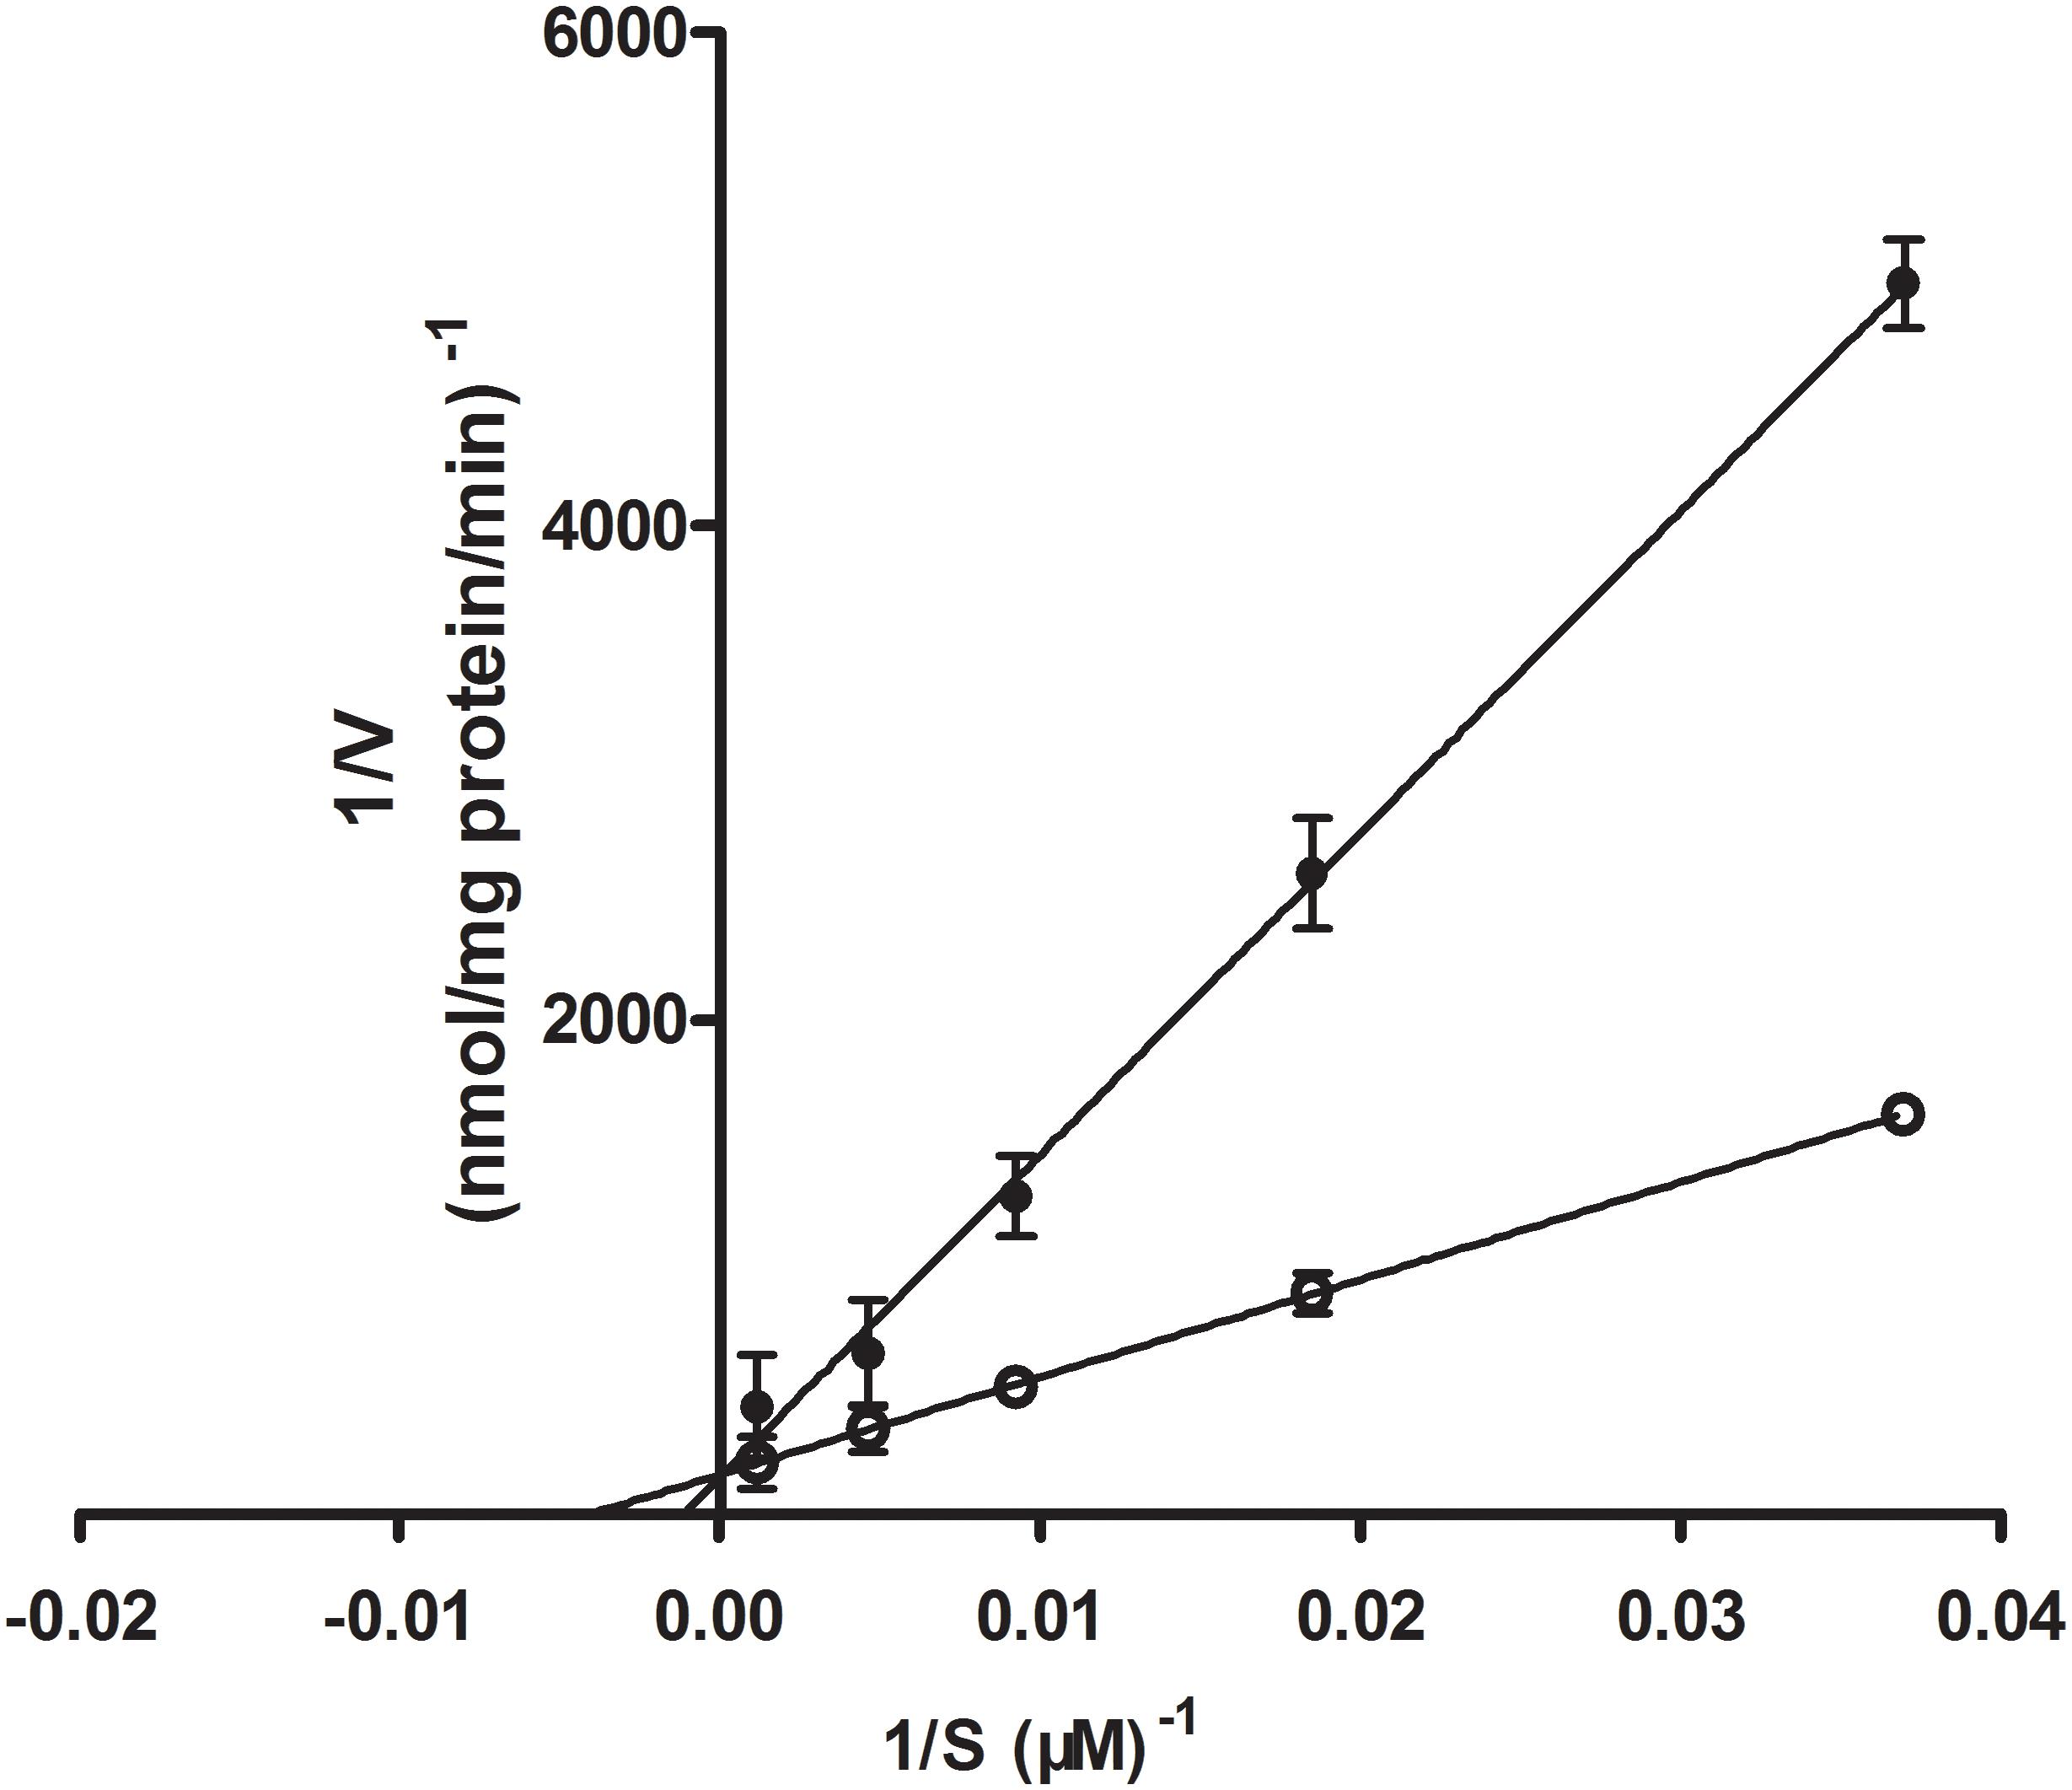
FIGURE 6. Lineweaver–Burk plot of the inhibitory effect of D-glucose on Rb1 uptake into rBMEC. Uptake profile of Rb1 (30–960 μg/mL) was measured in the absence (white marker) or presence of 100 mM D-glucose (black marker) at 37°C for 120 min. Each point represents the mean ± SE (n = 3).
Effects of Phloretin on Distribution of Rb1 in Plasma and Brain of Normal Rats
Except for the time point of 0.5 h after a single i.v. administration of Rb1 to the normal rats given phloretin for consecutive 1 week, plasma concentrations of Rb1 in the phloretin-treated normal rats at 2 h and 6 h were no statistically significant differences than those in the untreated normal rats. Whereas cerebral concentrations of Rb1 in the phloretin-treated normal rats were significantly lower than those in the untreated normal rats (Table 1). As a result, the brain-to-plasma concentration ratio of Rb1 in the phloretin-treated normal rats appeared to be significantly lower than that in the untreated normal rats, indicating that phloretin inhibits the transport of Rb1 across the BBB. To see whether the decreased brain–plasma concentration ratio of Rb1 was also related to the expression level change of GLUT1 or GLUT3 in the phloretin-treated normal rats, western blot assay was performed. The western blot results further showed that the expression levels of GLUT1 in the brain of normal rats given phloretin for 1 week were significantly decreased than those in the untreated normal rats (P < 0.05, Figure 7). Although phloretin also binds to the GLUT3, it potently inhibits the GLUT1-type glucose transporter (Martin et al., 2003). These results demonstrated that the decreased brain–plasma concentration ratio of Rb1 was correlated well with the decreased function and level of GLUT1 in the phloretin-treated normal rats, conforming the involvement of GLUT1 in Rb1 transport across the BBB into brain.
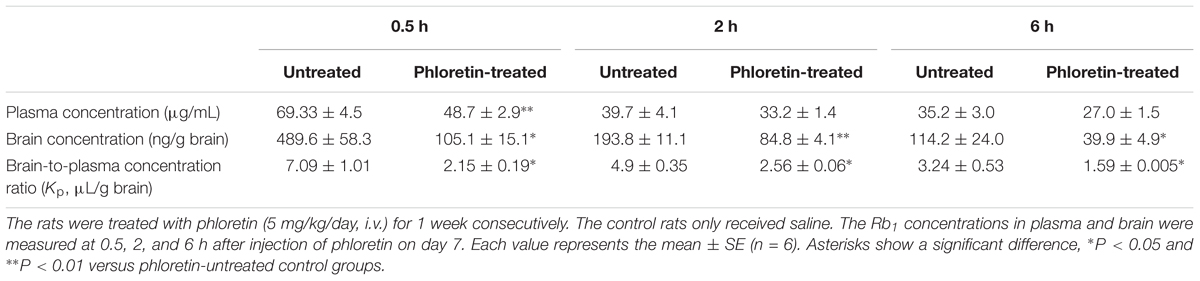
TABLE 1. Effect of phloretin on Rb1 distribution in plasma and brain of normal rats.
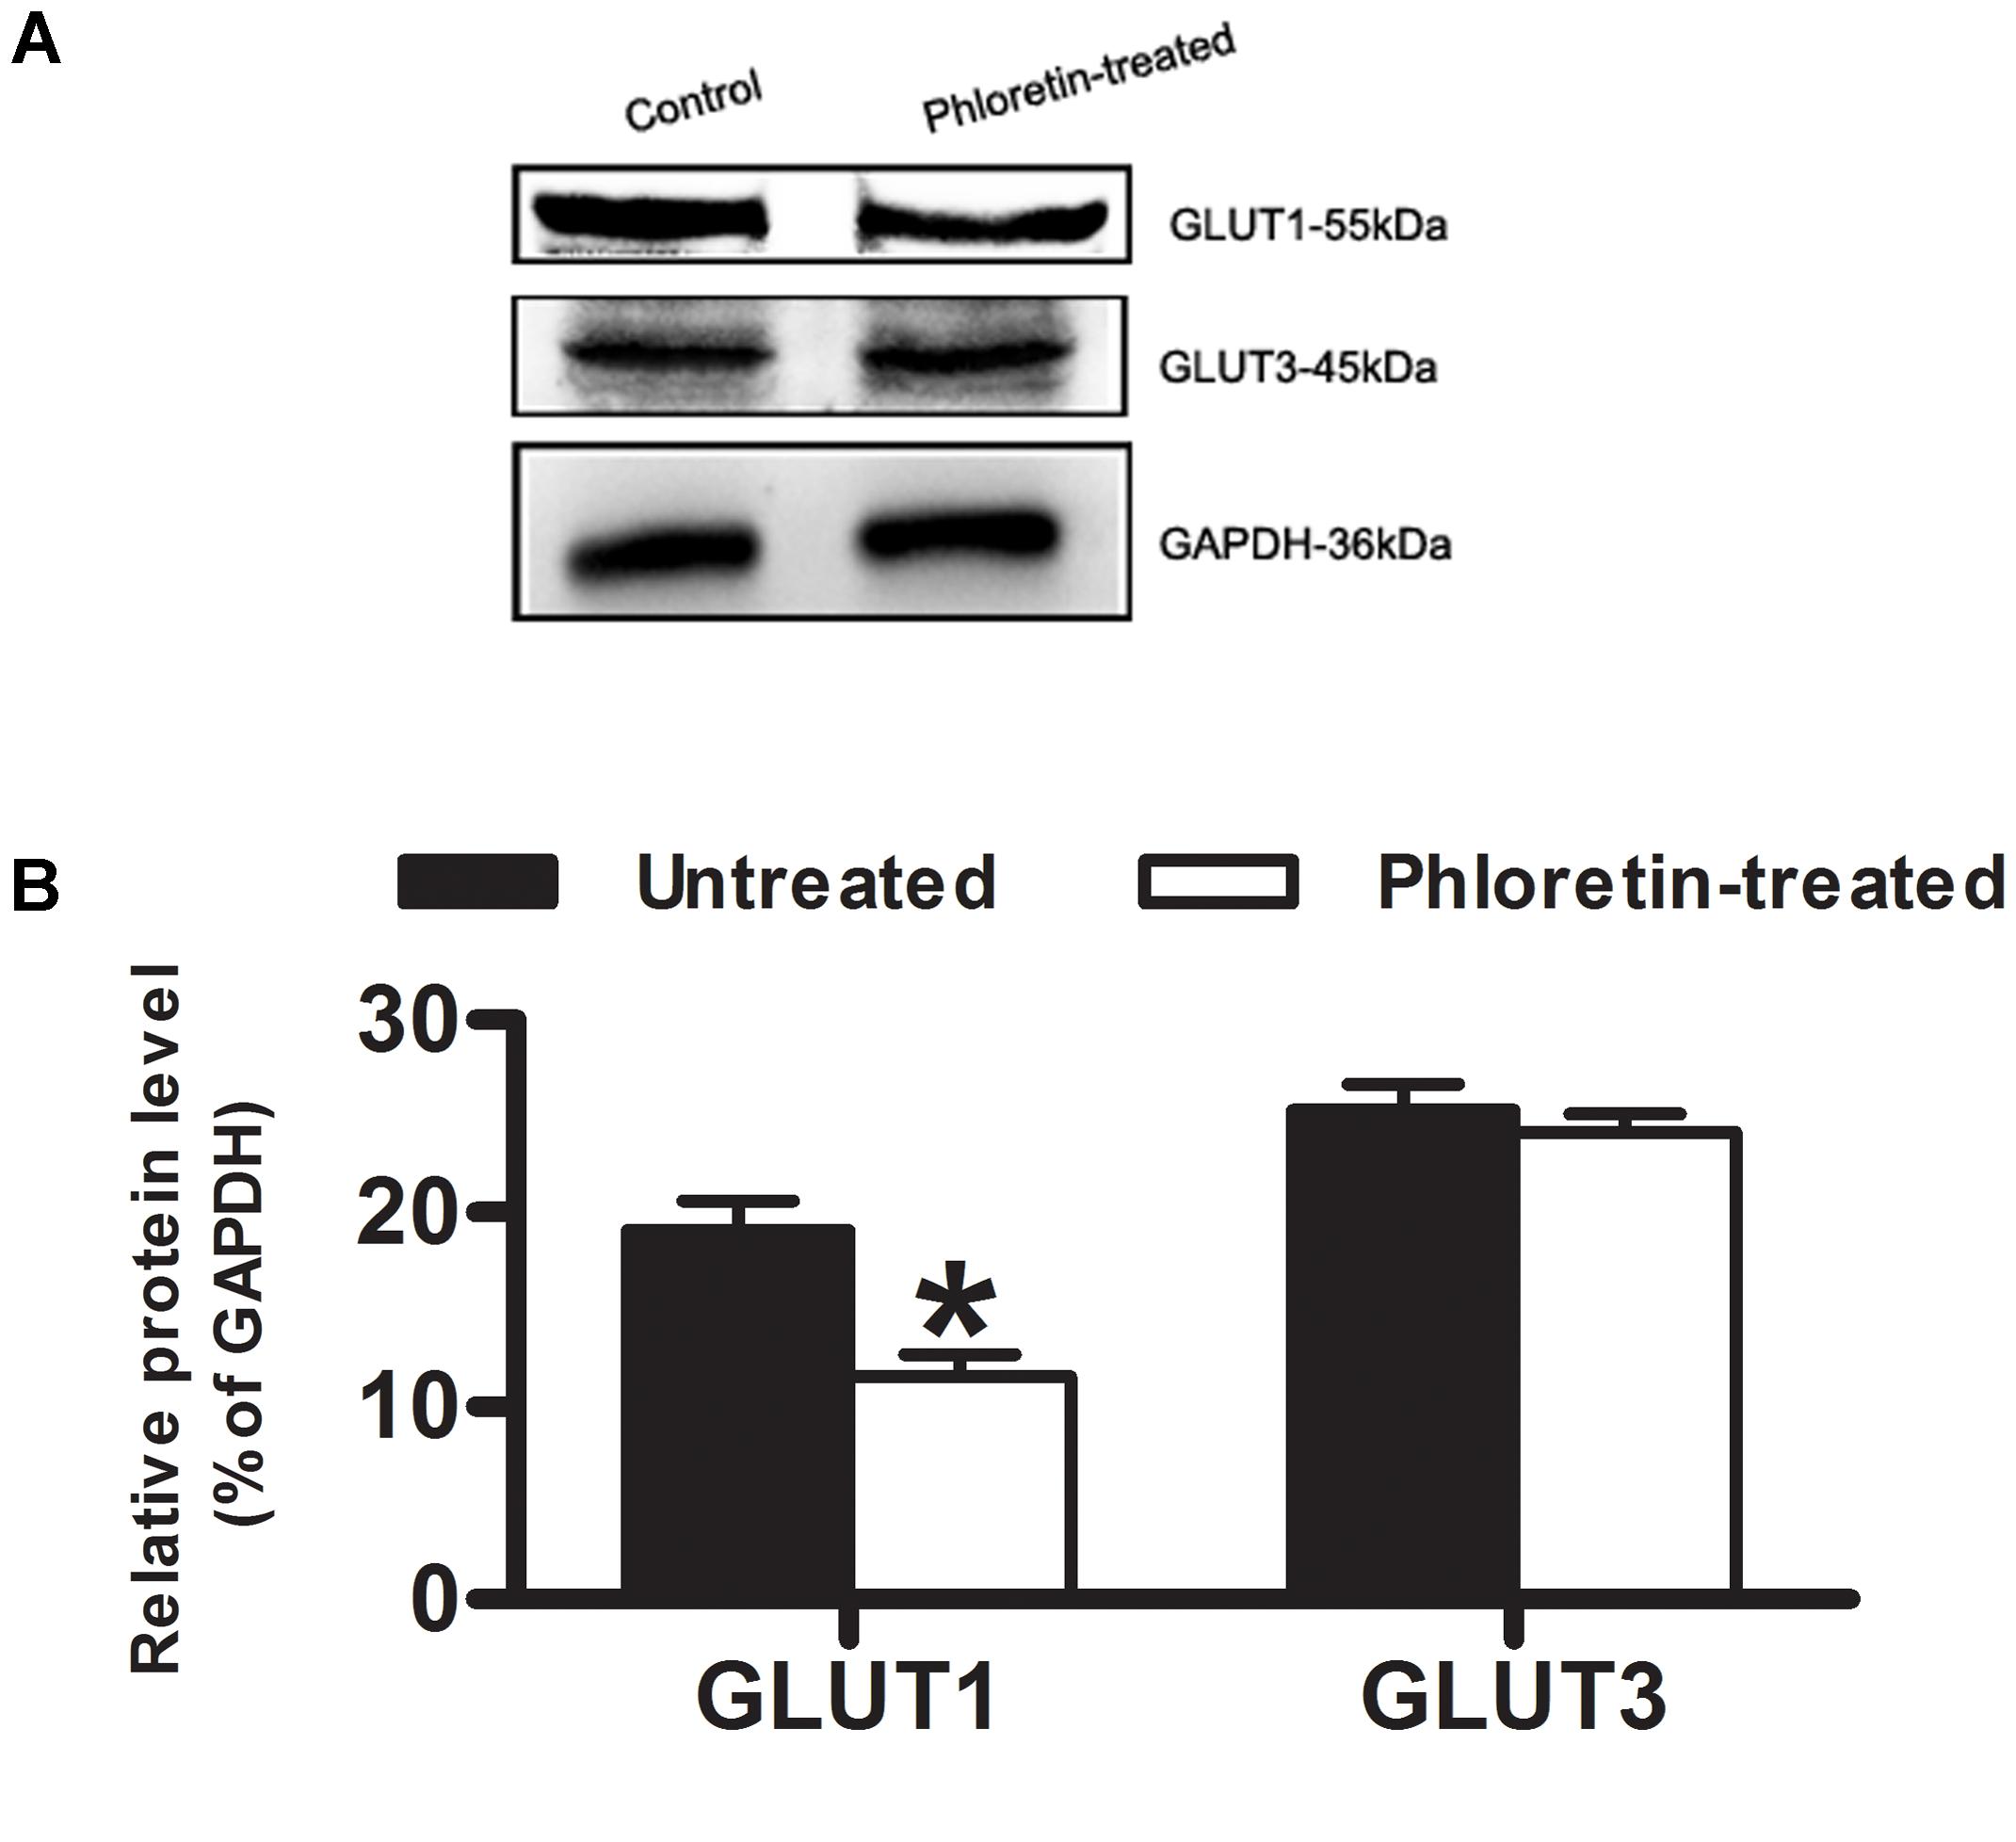
FIGURE 7. Expression of GLUT1 and GLUT3 in normal rat brain. (A) Western blot assay was to estimate whether the decreased brain–plasma concentration ratio of Rb1 was correlated with the expression level of GLUT1 or GLUT3 in normal rat brain. (B) Relative protein level was quantitated using Image J. GAPDH was stained as an internal control for protein loading. Each column represents the mean ± SE (n = 3), with significant differences from the phloretin-untreated control groups shown as ∗P < 0.05.
Discussion
In the present study, Rb1 transport across the BBB was characterized by means of both in vitro uptake studies using primary rBMEC and in vivo brain–plasma concentration ratio (Kp). Uptake of Rb1 by rBMEC was time- and temperature-dependent. The uptake of Rb1 increased linearly with time until 120 min, and a plateau of accumulation was observed at 120–240 min. However, the intracellular amounts of Rb1 at 4°C were lower than those at 37°C (Figure 1). Uptake of Rb1 was concentration-dependent, with Km and Vmax values of 119.2 μM and 0.0034 nmol/(mg protein ⋅ min), respectively. The saturable component (Vmax/Km) and the nonsaturable component (Pdiff) of Rb1 transport were calculated to be 0.03 and 0.0023 μL/(mg protein ⋅ min), respectively. Thus, 90% of the total Rb1 uptake is accounted for by the saturable component in the low concentration range. These results indicated that uptake of Rb1 into rBMEC was not solely driven by a simple passive diffusion process. In our in vivo study, the brain-to-plasma concentration ratios of ginsenoside Rb1 measured at 0.5, 2, and 6 h in untreated normal rats were significantly larger than that in phloretin-treated normal rats, suggesting carrier-mediated active uptake transport into brain across the BBB.
To further study the effects of transport systems with Rb1, other transporter inhibitors were used to evaluate transport activity of metabolic energy, Pgp, OATPs, and GLUT1. Pgp is one of the numbers of the ABC transporter superfamily, mediating the efflux from brain to blood and playing an import role in vivo to protect the brain from toxic compounds. OATPs play large roles in transporting endogenous molecules across cell membranes. GLUT1 is expressed in many cell types, but is at its highest level in the human erythrocyte membrane, through which glucose can freely keep in equilibrium between the serum and the red cell cytoplasm. And furthermore, GLUT1 is a major GLUT isoform expressed in cerebral endothelial cells, which plays an important role in cerebral glucose uptake. Cytochalasin B and phloretin would inhibit the GLUT1 activity (Koranyi et al., 1991; Simpson et al., 2001). Rb1 uptake by rBMEC was significantly decreased by phloretin, but was not inhibited by the inhibitors of metabolic energy (NaN3), P-gp (CsA), and OATPs (probenecid) (Figure 3). Although the GLUT1 can be capable of transporting galactose, mannose, and glucosamine, its principle physiological substrate is D-glucose. The Ki value for GLUT proteins is the concentration of blood glucose at which delivery into the cell, and GLUT1 is a high-affinity glucose transporter with a Ki for glucose of around 1 mM (Burant and Bell, 1992). In our study, the uptake of Rb1 was competitively inhibited by D-glucose with a Ki value of 885 μM. Therefore, the results indicate that the transport of Rb1 across BBB is mainly mediated by GLUT1, although we cannot deny the possibility that Rb1 is transported by any other transporter(s).
In the inhibition experiments when we determined the effect of phloretin on Rb1 uptake into rBMEC, we found a statistical decrease of the C/M ratio of Rb1 by phloretin after 30 min. Western blot assay showed that the decreased C/M ratio of Rb1 uptake into rBMEC was correlated well to the reduced level of GLUT1 in phloretin-treated rBMEC (Figure 5). These results are suggestive of a transporter-mediated uptake of Rb1 into rBMEC, possibly via GLUT1. This concept was further supported by evidence that the decreased brain-to-plasma concentration ratio of Rb1 was also correlative well with the down-regulated function and level of GLUT1 in phloretin-treated normal rats. The brain-to-plasma concentration ratio of a drug represents the degree of a drug’s penetration into brain across BBB. In the study, it was found that the brain–plasma concentration ratios of Rb1 in the phloretin-treated normal rats were significantly lower than those in the phloretin-untreated normal rats. And the expression level of GLUT1 in the phloretin-treated normal rats was down-regulated in comparison with the untreated control rats. However, we found the decreased level of GLUT3 in the phloretin-treated normal rats. Phloretin is the potent inhibitor of GLUT1-type glucose transporter although it is not highly selective and also binds to other GLUT isoforms (Martin et al., 2003). Thus, we may conclude that GLUT1 is involved in the Rb1 transport across the BBB into brain from circulating blood.
Due to a facilitated uptake of Rb1 into rBMEC, it can be inferred that Rb1 transport will be also observed in other cells that express GLUT1. GLUT1 is a 492-amino acid residues protein. It is expressed in most tissues at its highest level in fetal tissues (Zhao and Keating, 2007). The highest levels in adult humans are found in cerebral microvessels, colon, and kidney, but very low in skeletal muscle and liver (Gould and Bell, 1990). Some researchers have found that GLUT1 has a significant effect on the survival of the pre-implantation embryo (Moley, 2001). GLUT1 is also found in astrocytes, which has been considered to supply glycolytically derived lactate to neurons for a major energy source (Pellerin et al., 2002). The erythrocyte-type transporter protein GLUT1 has been also extensively investigated. And, this is possible that the transport in or on erythrocytes promotes an efficient compound exchange between the red cell and the capillary endothelium (Highley and De Bruijn, 1996). The meaning of uptake of drugs by erythrocytes has been specifically reported in the early stages (Highley and De Bruijn, 1996; Hinderling, 1997). The distribution of some molecules into erythrocytes can promote their storage, transport, and metabolism, and then may affect their activity (Kurlbaum et al., 2013). Because of erythrocytes consisting of a transport system with high capacity and low affinity compared to plasma proteins, the elimination of half-life of substances from different blood constituents might differ and the discharge from erythrocytes is often faster than the loss from plasma proteins (Schrijvers, 2003). Therefore, our future study will focus on the uptake of Rb1 by red blood cells, further confirming the involvement of GLUT1 in Rb1 transport across cell membranes.
Our study has a number of limitations. The inhibition experiments were done with Rb1 in the presence of various transporter inhibitors. Phloretin, an inhibitor of GLUT1, also interacts with other transporters such as the monocarboxylate transporter (Nagase et al., 2014), sodium glucose co-transporter SGLT-1 (Raja et al., 2003), volume-sensitive chloride channels (Fan et al., 2001), aquaporin water channels (Moshelion et al., 2004), or urea transporter (Konno et al., 2007). However, it reminds us that the significant decreased uptake of Rb1 by rBMEC in the presence of phloretin and D-glucose supports our point of view that uptake of Rb1 by rBMEC is an active transport process. Yet it cannot be excluded that additional transport processes play a major role as it was proposed by Sugano et al. (2010) that carrier-mediated and passive transport processes can coexist. Finally, we did not study whether the glucose influx in rBMEC was influenced by Rb1 or the precise type of interaction with the GLUT1 transporter. The type of interaction with the GLUT1 seems to be complicated as compounds can behave as competitive or noncompetitive inhibitors regarding glucose uptake or exit while the transporter has binding sites for phloretin (Kurlbaum et al., 2013). Although we have no further details on Rb1 transport, we discovered that it was the GLUT1 that involved in Rb1 transport across BBB.
To summarize, our present results indicate that the uptake of Rb1 into rBMEC is diminished in the presence of phloretin and D-glucose, suggesting that it is actively taken up into rBMEC, possibly via GLUT1. In vivo study using phloretin treatment suggests that GLUT1 plays a major role in active transport of Rb1 across BBB into brain from circulating blood.
Author Contributions
X-YL and Q-ZL conceived and designed the experiments. Y-ZW, YL, and YJ performed the experiments. Y-ZW, QX, and WW analyzed the data. Q-QC contributed reagents/materials/analysis tools. Y-ZW and X-YL wrote the paper.
Funding
This work was supported by grants from the Shanghai Natural Science Foundation of China (Program No. 10ZR142360) and Postdoctoral Scientific Fund Special Funding of China (Program No. 20090224).
Conflict of Interest Statement
The authors declare that the research was conducted in the absence of any commercial or financial relationships that could be construed as a potential conflict of interest.
References
Abbott, N. J., Patabendige, A. A., Dolman, D. E., Yusof, S. R., and Begley, D. J. (2010). Structure and function of the blood-brain barrier. Neurobiol. Dis. 37, 13–25.
Bradford, M. M. (1976). A rapid and sensitive method for the quantitation of microgram quantities of protein utilizing the principle of protein-dye binding. Anal. Biochem. 72, 248–254. doi: 10.1016/0003-2697(76)90527-3
Burant, C. F., and Bell, G. I. (1992). Mammalian facilitative glucose transporters: evidence for similar substrate recognition sites in functionally monomeric proteins. Biochemistry 31, 10414–10420.
Cardoso, F. L., Brites, D., and Brito, M. A. (2010). Looking at the blood-brain barrier: molecular anatomy and possible investigation approaches. Brain Res. Rev. 64, 328–363. doi: 10.1016/j.brainresrev.2010.05.003
Carruthers, A., DeZutter, J., Ganguly, A., and Devaskar, S. U. (2009). Will the original glucose transporter isoform please stand up. Am. J. Physiol. Endocrinol. Metab. 297, E836–E848. doi: 10.1152/ajpendo.00496.2009
Fan, H. T., Morishima, S., Kida, H., and Okada, Y. (2001). Phloretin differentially inhibits volume-sensitive and cyclic AMP-activated, but not Ca-activated, Cl(-) channels. Br. J. Pharmacol. 133, 1096–1106. doi: 10.1038/sj.bjp.0704159
Gao, X. Q., Yang, C. S., Chen, G. J., Wang, G. Y., Chen, B., Tan, S. K., et al. (2010). Ginsenoside Rb1 regulates the expressions of brain-derived neurotrophic factor and caspase-3 and induces neurogenesis in rats with experimental cerebral ischemia. J. Ethnopharmacol. 132, 393–399. doi: 10.1016/j.jep.2010.07.033
Gould, G. W., and Bell, G. I. (1990). Facilitative glucose transporters: an expanding family. Trends Biochem. Sci. 15, 18–23. doi: 10.1016/0968-0004(90)90125-U
Highley, M. S., and De Bruijn, E. A. (1996). Erythrocytes and the transport of drugs and endogenous compounds. Pharm. Res. 13, 186–195. doi: 10.1016/S0093-7754(01)90209-X
Hinderling, P. H. (1997). Red blood cells: a neglected compartment in pharmacokinetics and pharmacodynamics. Pharmacol. Rev. 49, 279–295.
Jiang, K. Y., and Qian, Z. N. (1995). Effects of Panax notoginseng saponins on posthypoxic cell damage of neurons in vitro. Zhongguo Yao Li Xue Bao 16, 399–402.
Jørgensen, L., Van Beek, J., Lund, S., Schousboe, A., and Badolo, L. (2007). Evidence of Oatp and Mdr1 in cryopreserved rat hepatocytes. Eur. J. Pharm. Sci. 30, 181–189. doi: 10.1016/j.ejps.2006.11.003
Kang, K. S., Kim, H. Y., Yamabe, N., Nagai, R., and Yokozawa, T. (2006). Protective effect of sun ginseng against diabetic renal damage. Biol. Pharm. Bull. 29, 1678–1684. doi: 10.1248/bpb.29.1678
Kitamura, A., Higuchi, K., Okura, T., and Deguchi, Y. (2014). Transport characteristics of tramadol in the blood-brain barrier. J. Pharm. Sci. 103, 3335–3341. doi: 10.1002/jps.24129
Konno, N., Hyodo, S., Matsuda, K., and Uchiyama, M. (2007). Arginine vasotocin promotes urea permeability through urea transporter expressed in the toad urinary bladder cells. Gen. Comp. Endocrinol. 152, 281–285. doi: 10.1016/j.ygcen.2006.12.007
Koranyi, L., Bourey, R. E., James, D., Mueckler, M., Fiedorek, F. T. Jr., Permutt, M. A., et al. (1991). Glucose transporter gene expression in rat brain: pretranslational changes associated with chronic insulin-induced hypoglycemia, fasting, and diabetes. Mol. Cell. Neurosci. 2, 244–252. doi: 10.1016/1044-7431(91)90051-O
Kurlbaum, M., Mulek, M., and Hogger, P. (2013). Facilitated uptake of a bioactive metabolite of maritime pine bark extract (pycnogenol) into human erythrocytes. PLoS One 8:e63197. doi: 10.1371/journal.pone.0063197
Li, X., Wang, G., Sun, J., Hao, H., Xiong, Y., Yan, B., et al. (2007). Pharmacokinetic and absolute bioavailability study of total panax notoginsenoside, a typical multiple constituent traditional chinese medicine (TCM) in rats. Biol. Pharm. Bull. 30, 847–851. doi: 10.1248/bpb.30.847
Lim, J. H., Wen, T. C., Matsuda, S., Tanaka, J., Maeda, N., Peng, H., et al. (1997). Protection of ischemic hippocampal neurons by ginsenoside Rb1, a main ingredient of ginseng root. Neurosci. Res. 28, 191–200. doi: 10.1016/S0168-0102(97)00041-2
Liu, H., Yang, J., Du, F., Gao, X., Ma, X., Huang, Y., et al. (2009). Absorption and disposition of after oral administration of Panax notoginseng extract to rats. Drug Metab. Dispos. 37, 2290–2298. doi: 10.1124/dmd.109.029819
Liu, Y., Xue, Q., Tang, Q., Hou, M., Qi, H., Chen, G., et al. (2013). A simple method for isolating and culturing the rat brain microvascular endothelial cells. Microvasc. Res. 90, 199–205. doi: 10.1016/j.mvr.2013.08.004
Lu, J. M., Yao, Q., and Chen, C. (2009). Ginseng compounds: an update on their molecular mechanisms and medical applications. Curr. Vasc. Pharmacol. 7, 293–302. doi: 10.2174/157016109788340767
Lu, T., Jiang, Y., Zhou, Z., Yue, X., Wei, N., Chen, Z., et al. (2011). Intranasal ginsenoside Rb1 targets the brain and ameliorates cerebral ischemia/reperfusion injury in rats. Biol. Pharm. Bull. 34, 1319–1324. doi: 10.1248/bpb.34.1319
Martin, H. J., Kornmann, F., and Fuhrmann, G. F. (2003). The inhibitory effects of flavonoids and antiestrogens on the Glut1 glucose transporter in human erythrocytes. Chem. Biol. Interact. 146, 225–235. doi: 10.1016/j.cbi.2003.06.001
Moley, K. H. (2001). Hyperglycemia and apoptosis: mechanisms for congenital malformations and pregnancy loss in diabetic women. Trends Endocrinol. Metab. 12, 78–82. doi: 10.1016/S1043-2760(00)00341-6
Moshelion, M., Moran, N., and Chaumont, F. (2004). Dynamic changes in the osmotic water permeability of protoplast plasma membrane. Plant Physiol. 135, 2301–2317. doi: 10.1104/pp.104.043000
Mueckler, M., and Thorens, B. (2013). The SLC2 (GLUT) family of membrane transporters. Mol. Aspects Med. 34, 121–138. doi: 10.1016/j.mam.2012.07.001
Nagase, M., Takahashi, Y., Watabe, A. M., Kubo, Y., and Kato, F. (2014). On-site energy supply at synapses through monocarboxylate transporters maintains excitatory synaptic transmission. J. Neurosci. 34, 2605–2617. doi: 10.1523/JNEUROSCI.4687-12.2014
Pellerin, L., Bonvento, G., Chatton, J. Y., Pierre, K., and Magistretti, P. J. (2002). Role of neuron–glia interaction in the regulation of brain glucose utilization. Diabetes Nutr. Metab. 15, 268–273.
Qi, L. W., Wang, C. Z., and Yuan, C. S. (2010). American ginseng: potential structure-function relationship in cancer chemoprevention. Biochem. Pharmacol. 80, 947–954. doi: 10.1016/j.bcp.2010.06.023
Raja, M. M., Tyagi, N. K., and Kinne, R. K. (2003). Phlorizin recognition in a C-terminal fragment of SGLT1 studied by tryptophan scanning and affinity labeling. J. Biol. Chem. 278, 49154–49163. doi: 10.1074/jbc.M306881200
Schrijvers, D. (2003). Role of red blood cells in pharmacokinetics of chemotherapeutic agents. Clin. Pharmacokinet. 42, 779–791. doi: 10.1097/00001813-199902000-00002
Shibuya, K., Okada, M., Suzuki, S., Seino, M., Seino, S., Takeda, H., et al. (2014). Targeting the facilitative glucose transporter GLUT1 inhibits the self-renewal and tumor-initiating capacity of cancer stem cells. Oncotarget 6, 651–661. doi: 10.18632/oncotarget.2892
Simpson, I. A., Vannucci, S. J., DeJoseph, M. R., and Hawkins, R. A. (2001). Glucose transporter asymmetries in the bovine blood-brain barrier. J. Biol. Chem. 276, 12725–12729. doi: 10.1074/jbc.M010897200
Sugano, K., Kansy, M., Artursson, P., Avdeef, A., Bendels, S., Di, L., et al. (2010). Coexistence of passive and carrier-mediated processes in drug transport. Nat. Rev. Drug Discov. 9, 597–614. doi: 10.1038/nrd3187
Sun, J. J., Xie, L., and Liu, X. D. (2006). Transport of carbamazepine and drug interactions at blood-brain barrier. Acta Pharmacol. Sin. 27, 249–253. doi: 10.1111/j.1745-7254.2006.00246.x
Yeh, W. L., Lin, C. J., and Fu, W. M. (2008). Enhancement of glucose transporter expression of brain endothelial cells by vascular endothelial growth factor derived from glioma exposed to hypoxia. Mol. Pharmacol. 73, 170–177. doi: 10.1124/mol.107.038851
Zhang, B., Hata, R., Zhu, P., Sato, K., Wen, T. C., Yang, L., et al. (2006). Prevention of ischemic neuronal death by intravenous infusion of a ginseng saponin, ginsenoside Rb(1), that upregulates Bcl-x(L) expression. J. Cereb. Blood Flow Metab. 26, 708–721. doi: 10.1038/sj.jcbfm.9600225
Keywords: carrier-mediated transporter, drug transport, blood–brain barrier, glucose transporter 1, ginsenoside Rb1
Citation: Wang Y-Z, Xu Q, Wu W, Liu Y, Jiang Y, Cai Q-Q, Lv Q-Z and Li X-Y (2018) Brain Transport Profiles of Ginsenoside Rb1 by Glucose Transporter 1: In Vitro and in Vivo. Front. Pharmacol. 9:398. doi: 10.3389/fphar.2018.00398
Received: 21 December 2017; Accepted: 06 April 2018;
Published: 19 April 2018.
Edited by:
Momir Mikov, University of Novi Sad, SerbiaReviewed by:
Peng Hsiao, Ferring Research Institute, Inc., United StatesStanislav Yanev, Institute of Neurobiology (BAS), Bulgaria
Copyright © 2018 Wang, Xu, Wu, Liu, Jiang, Cai, Lv and Li. This is an open-access article distributed under the terms of the Creative Commons Attribution License (CC BY). The use, distribution or reproduction in other forums is permitted, provided the original author(s) and the copyright owner are credited and that the original publication in this journal is cited, in accordance with accepted academic practice. No use, distribution or reproduction is permitted which does not comply with these terms.
*Correspondence: Qian-Zhou Lv, lv.qianzhou@zs-hospital.sh.cn Xiao-Yu Li, lixiaoyulxb@sina.com