Quantitative preclinical PET imaging: opportunities and challenges
 Claudia Kuntner
 David Stout
- 1Biomedical Systems, Health and Environment Department, AIT Austrian Institute of Technology GmbH, Seibersdorf, Austria
- 2Department of Molecular and Medical Pharmacology, David Geffen School of Medicine at University of California Los Angeles, Los Angeles, CA, USA
PET imaging of metabolism involves many choices, from hardware settings, software options to animal handling considerations. How to decide what settings or conditions to use is not straightforward, as the experimental design is dependent on the particular science being investigated. There is no single answer, yet there are factors that are common to all experiments that are the subject of this review. From physics to physiology, there are many factors to consider, each of which can have a significant impact upon measurements of metabolism in vivo. This review examines the most common factors related to all types of quantitative PET imaging.
Introduction
Biological discovery has moved at an accelerated pace in recent years, with a significant focus on the transition from in vitro to in vivo models. With animal models widely used in the basic and preclinical sciences, finding ways to conduct animal experiments more accurately and efficiently becomes a key factor in the success and timeliness of research. As a result, there has been a considerable increase in the need to adapt clinical imaging methods, as well as for novel preclinical molecular imaging technologies for biomedical research. Molecular imaging technologies use molecular probes or interactions to visualize in vivo processes. Many of the traditional clinical medical imaging technologies, such as ultrasound, computed tomography (CT), magnetic resonance imaging (MRI), single-photon emission computed tomography (SPECT), and positron emission tomography (PET) have been adapted for imaging small laboratory animal models [1].
Animal models of human disease are an important research tool in understanding disease processes and developing novel treatment strategies. Imaging technologies offer the possibility to study biochemical processes in a non-invasive manner in vivo. The biggest advantage of in vivo imaging is that it provides a bridge from preclinical research to human application in the clinic, enabling similar and sometimes identical experiments to be carried out across species. In preclinical research, most often the mouse is the experimental model of choice, due to many factors, including fast breeding cycle and decreased housing and maintenance costs. A great advantage of mice is the relatively high genetic homology with man and highly developed methodology for genetic manipulation. This has led to the development of wide range of transgenic laboratory animals with customized genetic expression. The most efficient way of utilizing such models is through longitudinal studies of the same animals over an extended period of time. Non-invasive imaging technologies have proven to be extremely valuable tools in performing such studies and have created the recent surge in small animal imaging [2]. Moreover, the possibility to use nude or severe combined immunodeficiency (SCID) mice with xenografts of human tissue make the immunodeficient mouse model particularly attractive for oncology research. In some disciplines, primarily in neuroscience, rats are more favorable as animal models. The larger brain size means greater stereotactic accuracy in models involving surgical or other invasive procedures directed toward specific brain regions (e.g., Parkinson rat model) and better identification of structures in images that have limited resolution.
Small animal PET is increasingly used to assess efficacy of therapeutic interventions and to validate the application of both current and novel radiotracers for translation to humans [3]. The strength of PET imaging is that it offers quantifiable measures of the underlying biology. The quantitative units given in either percent injected dose per gram tissue (%ID/g) or in standardized uptake values (SUV) are usually extracted from defined regions (or volumes) of interest drawn around an organ. Another more sophisticated method is the use of kinetic modeling to quantify the kinetics of the radiotracer in tissue [4, 5]. All these analytical methods rely on the fact that PET delivers quantitative and reproducible images. This review will look at all the factors that influence the accuracy of quantitative small animal PET imaging.
Scanner Specific Factors
A variety of dedicated small animal PET scanners have been developed starting from the 1997 and are now commercially available from different vendors. The requirements on a PET detector are (a) high detection efficiency, (b) high spatial resolution, (c) low dead time, (d) good timing resolution, and (e) good energy resolution. These requirements led to the development of new scintillation materials such as LSO or LYSO crystals [6, 7], which are now widely used in preclinical systems because of their high and fast light output. Most of the commercial preclinical scanners are based on small individual scintillators coupled to photomultipliers such as the microPET R4 and P4 scanners [8, 9], the microPET Focus family [10, 11], the Inveon scanner [12], the nanoPET/CT scanner [13], the Triumph® II –PET/SPECT/CT system [14], the Super Argus PET/CT [15], the ClearPET scanner [16] or the Genisys4 system [17, 18]. In contrast to these scanners, which are based on individual small scintillator pixels, the ALBIRA scanner is made of larger monolithic scintillators, where the point of interaction is estimated from the scintillation light spread into the position sensitive photomultiplier [19, 20]. This scanner offers the advantage of reduced dead areas (higher packing fraction), due to the missing edges between the crystals. A completely different scanner design was realized in the quadHIDAC small animal PET [21], where the detectors are formed by multiwire proportial chambers and lead converter plates.
In the following sections, several scanner specific factors that have an influence on quantitative accuracy are described.
Spatial Resolution
In PET, spatial resolution is defined as the distance where two infinitely small point sources can still be distinguished from each other. Typical preclinical PET scanners exhibit a spatial resolution in the order of 1.5–2.5 mm measured at full-width at half maximum (FWHM) of the point spread function in the central field of view (cFOV). Spatial resolution is critically dependent on the radial offset, which was recently demonstrated in a study where the performance evaluation of several preclinical scanners was performed according to the NEMA NU 4-2008 standards using a 22Na point source [22]. At a radial offset of 5 mm the radial spatial resolution for most of the studied scanners was around 1.6 mm FWHM whereas this value increased to around 2.5 mm FWHM at 25 mm radial offset. It was also demonstrated that scanners with a larger bore size suffer less from this radial elongation effect. In Table 1 commercially available small animal PET scanners and the respective spatial resolution values are given.
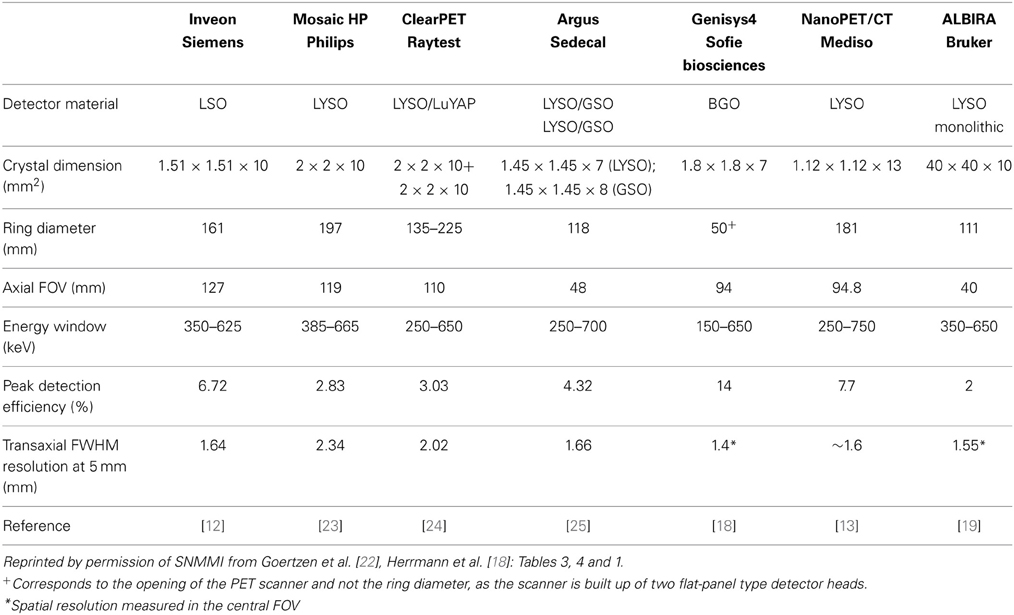
Table 1. Characteristics of preclinical PET scanners.
By reducing the scintillator size from 5 mm (human scanners) to around 1.5 mm, the spatial resolution significantly improved. Still, when looking at the size difference between mice and humans, which is about 2000, a three-fold decrease in the spatial resolution is insufficient to create an equal sampling in mice as in humans. Thus, it still remains difficult to image small structure sizes of areas such as the mouse brain. This led to the development of scanners with even smaller scintillator sizes of only 0.975 mm [26, 27]. Smaller crystals means fewer counts per crystal, thus noise and signal strength become significant factors with this approach. Another issue in PET is that the scanner detects the point of annihilation and not the point of positron emission. The positron range in tissue is a function of the kinetic energy with which it is emitted from the nucleus, which is dependent on the specific isotope [28]. Any residual kinetic energy at the time of annihilation creates gamma radiation emitted at less than 180 degrees, resulting in non-collinearity and loss of accurate placement, which is also related to the size of the field of view. These factors create a fundamental limitation of PET spatial resolution; however there is still room to improve upon the current PET system designs. Different resolution modeling approaches have been proposed to account for these physical effects [29, 30] yet they are only available in their respective academic institutions and are not commercially available. An example of how the positron range affects image quality is given in Figure 1. Here, a mini-Derenzo phantom consisting of hollow rods with 2.5, 2.0, 1.5, 1.25, 1.0, and 0.8 mm diameter are arranged in six segments, where the center-to-center distance is equal to two-times the diameter. The phantom was filled with either a 18F-solution or a 68Ga-solution. The kinetic energies of the emitted positrons are 633 keV (18F) and 1.89 MeV (68Ga), leading to a clear difference in mean positron range of around 0.5 mm and 3.1 mm and therefore different spatial resolutions [31].
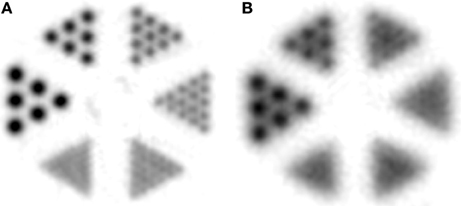
Figure 1. Emission image of a mini-Derenzo phantom. The phantom consists of fillable rods with diameters of 0.8, 1.0, 1.25, 1.5, 1.0, and 2.5 mm, respectively. Center-to-center distance between adjacent rods was 2 times the rod diameter. The phantom was filled with (A) 18F-solution or a (B) 68Ga-solution. Images were reconstructed by FORE followed by 2D-FBP.
Sensitivity
The sensitivity in PET is usually defined as the percentage between emitted and measured annihilation photons. The sensitivity of a PET scanner is influenced by the detector material, the dead space or packing fraction, the crystal length and the solid-angel coverage of the detector ring. Scanners with longer axial FOVs and smaller bore diameters usually exhibit the highest sensitivity. This can also be seen in Table 1, where the Inveon scanner with the rather long axial FOV of 127 mm (161 mm ring diameter) has a reported sensitivity of 6.72%, whereas the Genisys4 scanner with the smaller opening of 50 mm combined with a 94 mm axial FOV exhibits an even higher sensitivity of 14%.
The sensitivity plays an important role when imaging receptor binding probes, where low numbers of receptors are present and low occupancy rates are needed to avoid pharmacological effects, thus a low injectable mass of the tracer is required. Depending on the specific activity and the radiochemical yield, this can lead to rather low radioactivity concentrations in the injectable volume of 100 μL (some kBq/mL) and thus a high sensitivity is needed.
There is also a tradeoff between sensitivity and resolution. Smaller crystals enable better resolution; however this means there are fewer detected events in each individual crystal, which leads to noisy data and loss of image contrast.
Scatter
In human PET scans, scatter is a dominant factor with scatter fractions of up to 36% in septaless full 3D-mode scanners [32]. In small animal PET scanners, the scatter fraction is usually in the range of ~8% for a mouse and ~20% for a rat scan [22]. One way to increase the throughput of small animal imaging facilities and also to optimize utilization of a radiochemical synthesis batch (especially for C-11) is to image multiple animals at once [33]. Several centers are now imaging 2 or up to 8 mice in one scan [34, 35]. In a recent simulation study [36] it was demonstrated that the scatter fraction increased by 25% or 64%, when imaging three or five subjects (MOBY phantom) simultaneously in comparison to one subject, respectively. This clearly demonstrates that scatter correction in preclinical imaging is important when imaging multiple subjects at the same time.
Scatter and also attenuation correction algorithms rely on the availability of structural information, which can be obtained from transmission scans using positron (68Ge/68Ga) or single photon (57Co) emitters or from MR or CT scans. The noise level in MR and CT scans is considerably lower than nuclear medicine based methods, leading to more accurate estimations of scatter and attenuation corrections.
Attenuation Correction
Attenuation of photons absorbed when passing through the subject and surrounding material (e.g., imaging chamber, bed) is usually measured using a transmission scan. In small animals, the amount of tissue through which the 511 keV photons pass is much smaller as compared to humans, but nevertheless there is a certain percentage that is lost. For example, photons passing through the rat's torso are attenuated by ~40% [37]. A common method is to perform a transmission scan before or after the emission scan using an external source, which is rotating around the subject (rod or point source) [38]. A conventional approach is to use a 68Ge/68Ga source working in coincidence mode, where the detection of the two annihilation photons and the location of the source form a line of response (LOR). For small animal PET systems, the use of a single photon emitter source such as 57Co, that emits photons at a lower energy (122 keV) as compared to the annihilation radiation has shown to be better suited for attenuation correction (in the absence of a CT). Here the LOR is defined by the known source location and the photons detected on the opposing detectors. The advantage of a singles-based approach is the higher detected photon flux and hence better signal-to-noise ratio, however this method requires accurate knowledge of the moving source location. As the energy of the emitted 57Co photons is lower than 511 keV, the attenuation sinogram values are scaled up to 511 keV for correction [37]. When using a CT for attenuation correction, a similar energy scaling approach is required [38].
Another method for attenuation correction is based on the segmentation of the PET data, the so called transmissionless attenuation correction [39]. Here a manual or automatic delineation defines the body edges directly on the emission image, and by assuming a uniform distribution of attenuation coefficients inside the subject an attenuation map is created [40, 41]. The advantages are that less time is required and no additional dose is given to the animals (from the CT or transmission scan). The disadvantages are that they are less accurate in delineating the subject (especially for radiotracers that are not distributed uniformly in the body), provide a less detailed attenuation map and they do not include the surrounding material like the imaging chamber. Similar to the rapid switch to PET/CT in clinical systems, most preclinical systems now utilize both metabolic (PET or SPECT) and anatomical (MR or CT) multimodality imaging as the standard protocol, using the anatomical information to provide scatter and attenuation corrections.
Partial Volume Effect
Due to the limited spatial resolution of currently available preclinical PET scanners in comparison to the actual size of structures from rodents (e.g., regions in the brain), partial volume effects (PVE) are present in the acquired image data. PVE leads to an underestimation of the activity concentration in the PET images and spillover into surrounding tissues that is observed in objects smaller than three times the spatial resolution. In addition, image sampling where different types of tissue and thus radiotracer concentrations are included in one voxel also contributes to PVE [42–44]. There are several methods for partial volume correction based either on the count recovery models such as the recovery coefficient [45, 46] or the contrast recovery coefficient method [47–49] or they are based on anatomical data (derived from MR imaging) such as the geometric transfer matrix method [50].
Partial volume correction is an active area of research as most of the approaches are either not applicable for irregular structures (hippocampus region in the brain) or they have not been validated against the true activity values. It has also been shown that the recovery coefficient is strongly dependent on the count statistics, which is a problem for dynamic studies, where the count rate changes from time frame to time frame [51]. Together with the fact that the spatial resolution of the scanner and thus the PVE is not uniform in the field of view and that PVE is dependent on the radionuclide and reconstruction algorithm, this make PVE correction an interesting but complex field of research.
Reconstruction Algorithm
For PET image reconstruction, several rebinning and reconstruction algorithms are available. In commonly used preclinical PET systems, the measured coincidences are stored in list mode format. Then the “raw data” is either converted into 2D sinograms by applying single-slice rebinning [52], multi-slice rebinning [53, 54] or Fourier rebinning [55] or into 3D sinograms. The depth of interaction (DOI) in which an annihilation event occurs inside the crystals can have a significant impact on image resolution, particularly for small ring systems, thus the positioning of oblique angle events is important. In single-slice rebinning (SSRB) the oblique coincidence lines are assigned to a particular 2D sinogram associated with the transaxial slice lying midway axially between the detectors. In multi-slice rebinning (MSRB) a more sophisticated rebinning algorithm is applied, where an oblique coincidence line contributes to the sinogram of all slices which it traverses. MSRB is more accurate than SSRB, but is less stable in the presence of noise [55]. In Fourier rebinning (FORE) the oblique coincidences are binned to a transaxial slice using the frequency-distance relationship of the data in Fourier space. The reconstruction of the stack of sinograms is then performed using conventional 2D algorithms. The advantage of rebinning and further 2D reconstruction is that it speeds up reconstruction time.
The conventional 2D image reconstruction algorithms are filtered-backprojection (FBP) or 2D ordered-subsets expectation-maximization (OSEM). Apart from the 2D algorithms, fully 3D algorithms such as 3D-OSEM or 3D maximum a posteriori (MAP) [56, 57] or a combination of both can also be applied. The 3D reconstruction algorithms can either work iterative or non-iterative and process oblique coincidence lines without making geometrical approximations. The advantages of the 3D algorithms are that they provide images with better spatial resolution and thus an improved recovery rate as compared to FBP [58, 59], with the assumption that the noise level is the same. Iterative methods can also take into account the geometric and spatial characteristics of the scanner to improve resolution (P matrix). Iterative reconstruction also avoids mispositioning of activity outside the animals, creating images without streaking artifacts commonly seen around the bladder with F-18 labeled probes. Iterative reconstruction can create noise and artifacts from insufficient or to many iterations, thus knowing when to stop becomes a problem, one that is often specific to the imaging probe and scanner settings used to collect the data. Another example is for MAP reconstruction, where the spatial resolution is dependent on the choice of the β hyperparameter (parameter which controls the weight of the penalty term). By choosing a small β, one can obtain better spatial resolution at the cost of image noise and artifacts.
The advantage of FBP over MAP or OSEM is the possibility to define offsets in the x- and y-direction during reconstruction. Thus when imaging multiple animals, small voxel sizes can still be achieved just by using a high zoom and the respective offset values equivalent to the midpoint-position of the animals in the field of view. During MAP and OSEM reconstruction, an offset definition is not feasible and therefore an individual image generation for each animal cannot be achieved. The multiple animals can only be constructed using a rather low zoom thus leading to a larger voxel size. To exemplify this for the Inveon PET scanner (Siemens), for a single mouse scan the usual method for reconstruction is the use of an 128 × 128 × 159 matrix combined with a zoom of 2 leading to a reduced radial field of view of 4.8 cm and a voxel size of 0.38 × 0.38 × 0.80 mm3. For a multiple mouse scan (4 mice) the whole field of view is needed and therefore a zoom of 1 can be used with the 128 × 128 × 159 matrix yielding a voxel size of 0.86 × 0.86 × 0.80 mm3 [35]. This increased voxel size will lead to a lower spatial resolution and therefore a higher partial volume effect.
Animal Specific Factors
As the animal is our “measurement system” in preclinical imaging, several animal specific factors that affect image quantification are discussed below. Overall, the biological variability even in the same strains of animals with the same sex and age is by far larger (~15–20%) than all the scanner related factors. Therefore, great care should be undertaken to optimize all factors that lead to large standard deviations in animal research such as temperature, diet, anesthesia, injectable volumes and many others [60, 61].
Anesthesia
In small animal PET, anesthesia is usually necessary to render the subjects motionless for imaging and to minimize the stress and discomfort associated with restraining procedures. In addition, invasive surgical procedures are often required to allow administration of pharmacological agents or sampling of blood. As a result, a large number of PET imaging studies in rodents are performed under general anesthesia. For all studies it is assumed that anesthesia-induced perturbation must be minimized by using as low doses of anesthetic as possible. The anesthetic method is thus adjusted to the procedure to ensure the necessary level of anesthesia and also compatibility with the purpose of the research. In most cases, the method of anesthesia that was chosen needs to be reversible such that the subject recovers to normal activity for future studies. The most common anesthesia method in PET is the use of an inhalant anesthetic such as isoflurane mixed in oxygen or air. By constantly adapting the isoflurane level to the depth of anesthesia and using a humidifier, it is possible to achieve quite long anesthesia periods of up to several hours without adverse complications. Another method well suited for short imaging protocols is the use of injectable anesthetics such as ketamine or xylazine.
Yet, one has to be aware of the fact that by using anesthesia one is changing the “measurement system” which is the physiology of the animal. A recent study investigated the effects of anesthesia in brain PET research [62]. They showed that depending on the used anesthetics and animal, radiotracer uptake in brain was either lower (as for [18F]FDG) or binding potentials were higher during isoflurane anesthesia (as for [11C]Raclopride). As isoflurane alters myocardial glucose metabolism it also affects cardiology studies using [18F]FDG [63–66]. Also in oncology, the anesthetic method has a pronounced effect on [18F]FDG or [18F]FLT uptake in tumors [67–69].
In addition to the anesthetic agent, the carrier gas can also have a profound effect on the outcome of a study. Typically, the carrier gas for isoflurane anesthesia is oxygen. For hypoxia studies, where the hypoxic regions are identified and quantified by using hypoxia radiotracer, the breathing conditions have a strong effect on radiotracer retention as shown by Maier et al. [70]. They demonstrated that during the first hour of [18F]FAZA uptake the breathing conditions (air or oxygen) had an effect on tumor uptake. When the mice breathed air, the tumor-to-muscle-ratios were significantly higher as compared to the oxygen breathing protocols.
These factors have led to the development of systems that are capable of imaging conscious animals. One system for conscious rodent imaging is the RatCAP [71, 72], where a miniaturized PET camera is mounted directly on the head of rats. Other solutions for conscious PET imaging are the use of marker-based [73] and also marker-less head motion tracking systems [74]. The marker-less system simplifies motion-compensated imaging by avoiding irritation caused by the attachment of the markers, and also the need to familiarize animals to the markers. Both systems require a certain period of time in animal handling for successful motion tracking imaging experiments (10 days handling, 12 days training phase using a food reward system to acclimatize the animals to the burrow and scanner environment). Another option is to inject conscious animals and wait until uptake and clearance are essentially complete, then anesthetize and image the animals.
Temperature
The most important factor when putting an animal under anesthesia is temperature control. Mice and rats quickly equilibrate their internal body temperature to the temperature of whatever surface they are placed upon when under anesthesia [75]. Therefore the animals become hypothermic and can easily die within minutes. Almost every metabolic process is altered by temperature changes, including enzymatic activity, blood flow, and muscle activity. Since the goal is usually to measure normal metabolism, not metabolism under hypothermic conditions, animals need to have sufficient heat support at all stages of the experiment. Thus rodents must be warmed throughout the whole imaging procedure starting around 30 min before induction of the anesthesia till the time when they have fully recovered.
Housing Conditions
Often overlooked, the housing conditions for animals can have a significant impact upon physiology and therefore molecular imaging results. Since animals spend nearly all of their time in the vivarium, the conditions are the primary factors that influence the biology under investigation. The bedding amount, type, cage changing frequency, light/dark cycle, room temperature and humidity can affect physiology. In the past several years, caging system use has been shifting from static filter top to individually ventilated cages (IVC). These IVC cages allow for multiple health status and mouse types to be housed adjacent to each other, however they also impose a new source of cold stress upon the animals [76]. These are not small effects, as it was shown that the size of xenograft tumors and FDG uptake can be altered by over 300% based on caging type and ambient temperature [77]. At a minimum, the husbandry conditions need to be reported to enable reproduction of experimental results [78].
Fasting State
Because PET images metabolism, measurements can be dependent on the fasting state of the animals. This is particularly true for [18F]FDG studies, where the fasting state has an influence on the study outcome as the endogenous available glucose competes with [18F]FDG and can therefore reduce uptake into the cells [66–68]. The duration of the fast, type of food (high fat, special formulations, etc.) can alter factors such as glucose and amino acid levels, which in turn can alter PET metabolic signals.
Posture
The position of the animals inside the scanner is usually determined by the investigators and can affect the image results. Several different imaging chambers are available or provided by vendors that offer the possibility of a defined environment that includes anesthesia supply, heating and some fixation devices such as tooth bars or ear plugs [75]. Apart from using corner posts, where the limbs can be fixated for a reproducible position, the use of an immobilization bed has also been proposed [79]. The posture of the animal (prone or supine) can have an effect on the outcome of the imaging study has been demonstrated by Richter et al. [80], where they studied regional pulmonary blood flow in rats. As mentioned previously, the position of the animal with respect to the imaging field of view can also change the data, due to factors such as DOI and resolution.
Monitoring
Animal Monitoring and supportive care aims to maintain the animal's physiological status as near to normal as possible. The goal is to minimize animal pain and distress by adjusting the depth of anesthesia and to anticipate any impending complication. Supportive care includes monitoring of physiological parameters and analgesia during anesthetic and surgical procedures. Monitoring of vital signs and potential signs of pain should be done throughout the whole animal handling procedure. Monitoring can either be performed visual, manually or by using electronic monitoring systems.
Visual and manual monitoring
Visual monitoring means watching the animal carefully while under anesthesia. By watching the respiration one can note gross change in rate and can classify the character of breathing. The color of mucous membrane and skin is related to the oxygenation state—blue (poor oxygenation), pale (poor blood perfusion). The general behavior of the animal is also monitored visually. Manually one can test the jaw tone just by moving the jaw down. Using palpation, one can feel the heart rate, respiration rate, and body temperature. By pressing mucous membrane or skin, blood flow status can be visually assessed by looking for resumption of color in the skin. Yet, in most preclinical scanners visual and/or manual monitoring is not possible due to the small bore sizes and restricted space inside the scanners.
Electronic monitoring
Nowadays, nearly all the equipment available for human monitoring is also available for small animal monitoring. These include:
- ECG: small electrodes glued to the paws and tail or invasive with needles
- Respiration rate: small pneumatic pillow placed under the abdomen of the animal
- Blood pressure: tail cuff sensor (non-invasive) or positioning of electrode into major artery (invasive)
- Pulse oxymetry: The clip-on-sensors are typically attached to the rat foot or the shaved mouse thigh. Other useful locations include the ankle, paw, wrist, or tail.
- Temperature: rectal probe
Using electronic monitoring is a very reliable tool and also enables monitoring the animals during scans. Some scanners (e.g., μPET/CT combined systems) have a very long but narrow bore and therefore visual or manual monitoring is not possible. Acceptable limits for all the monitored parameters need to be established and constant monitoring of the anesthetic state over time is essential. Some monitoring systems have alarm functions that help identify when problems arise, which is helpful during experiments where many demands are present for the investigator's time.
Administration Routes
As PET is based on the administration of a radioligand into a subject, the administration itself has to be performed reliably. Animals may be conscious or under anesthesia during the injection, which can influence the measurement as discussed in section Anesthesia. Table 2 presents administration volumes for the commonly employed routes in the most frequently used species [81]. They are consensus figures based on published literature and internal guidelines. Two sets of values are shown in each column: values on the left are intended as a guide to “good practice” dose volumes for single or multiple dosing; values on the right define the recommended needle size for each administration route in the different animals.
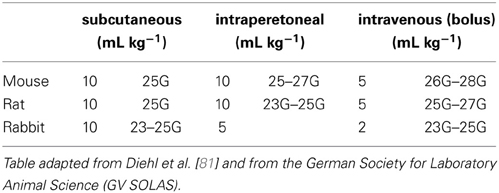
Table 2. Administration routes, volumes and needle sizes considered good practice.
When performing intravenous injections, highly trained personnel are required in order to deliver all the radioactivity reproducibly from the syringe into the blood stream. Otherwise, the error rate would be very high as shown by a recent study by Vines et al, where they evaluated mouse tail vein injections in a qualitative and quantitative approach [82]. They showed that the overall rate of successful intravenous injection was 92% (46 out of 50). If one is only interested in a static image at ~45 min post injection, then this error is not as dramatic as the residual activity will be slowly absorbed and transported into the blood stream. For a dynamic study where one is interested in the kinetics of the radiotracer, a paravenous injection severely confounds the results.
The issue with reliable tail vein injection in mice has also led to the development of automatic injection systems, such as the vascular access system (VAS) [83]. In this system, near infrared light, image processing techniques, computer controlled motors and a pressure feedback system was used to insert the needle and to validate the proper location within the tail vein. A study in mice showed that the residual activity inside the vein was around 3%, which was better than the manual injections.
For some tracers (such as FDG), the use of an intraperitoneal injection might be an alternative to avoid cannulation of the tail vein [84]. Especially when performing short static scans at around 45–60 min post injections, the activity concentrations in brain, myocardium, plasma, muscle, liver and also tumors are comparable [68, 85]. Still, care has to be taken not to inject the substance into the bowel.
In preclinical imaging another important point is the total mass of the injected radioligand. This is usually not a concern in human studies, but is much more important in mice. The injection of too much mass can alter the binding kinetics and therefore the results of the study. For in vivo binding studies in rodents, the maximal receptor occupancy to fulfill the tracer kinetic modeling principles should be 10% or even less [86, 87]. It is therefore important to work with high specific radioactivity (i.e., the amount of radioactive molecules vs. unlabeled molecules). A good example of the effect of specific radioactivity was given by Maeda et al. [88], who performed a study with high specific radioactivity of [11C]PIB (~200 GBq/μmol) in transgenic Alzheimer mice (APP23). Reducing the specific activity to around 20 GBq/μmol by addition of cold ligand resulted in profound loss of signal-to-noise ratio and reduction in binding potential in the hippocampus and neocortex, along with insensitivity for detection of amyloid plaques.
Last, the residual activity in the syringe also can contribute to errors in quantitation. Due to the small volume (100 μL) and especially with lipophilic radiotracers that stick to the walls, a considerable amount of radioactivity might be present in the syringe and needle—even after a complete injection of the tracer. Therefore, the syringe (and any catheters) should be measured after injection to obtain the accurate amount of injected radioactivity.
Blood Sampling
In preclinical PET imaging blood sampling can be performed to generate an arterial input function for kinetic modeling, to measure the free fraction of radioligand in plasma and to check for radioactive metabolites. The amount of blood that can be sampled depends on the circulating blood volume present in each species. Table 3 gives the circulating blood volumes and the recommended maximum blood samples volumes for the most commonly used species. The recommendations are based on published work [81, 89] and on information from “in-house” standard operating procedures. Animal welfare is a prime consideration when blood sampling is approaching limits, however the scientific impact of an animal's physiological response also must be considered because this may affect data interpretation and validity [90].
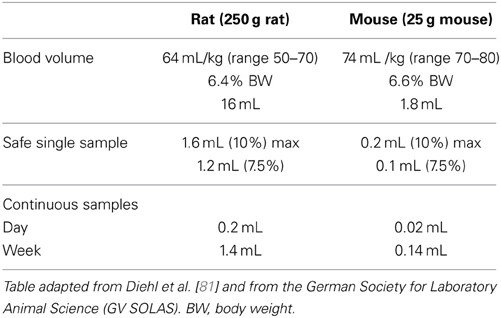
Table 3. Circulating blood volume and recommended maximum blood sample volume.
There are several sampling sites that can be used to obtain blood samples (mostly at a single time), such as the lateral tarsal (saphenous) vein, the sublingual vein, the lateral tail vein, the retrobulbar plexus or directly by cardiac puncture from the heart. All these sampling methods should be carried out under general anesthesia.
For repeated blood sampling a catheterization of a major artery (e.g., carotid or femoral artery) is recommended [91]. Temporary catheters such as butterfly needles and over-the-needle cannulae can be used in the short term (working day), whereas for long-term use surgical implantation of a biocompatible catheter is required. These methods allow repeated blood sampling with minimal distress and discomfort for the animal.
One confound for blood sampling is the time it takes to get a sufficient sample and the dispersion that occurs between the sampling site and the area of the animal being investigated. As the sampling site is typically distant from the investigation site, the blood activity may not match well with respect to concentration and time for the target region.
PET Data Quantification
The first steps for obtaining quantitative PET images are to apply the corrections factors that are usually implemented in the reconstruction procedure. In most of the scanners, deadtime and decay correction is already performed during data acquisition. Normalization, attenuation and scatter correction are done in sinogram space. To ensure reproducible data (even after long periods of time) a regular quality control of all these correction factors together with a calibration procedure to convert counts into kBq/cc using appropriate phantoms is advisable [78].
Semi-Quantitative Values
There are two commonly used semi-quantitative methods used in preclinical PET. The first method is the ratio of the activity in a tissue (given in kBq/cc or mCi/cc) divided by the decay-corrected activity injected into the animal (given in kBq or mCi). This ratio is defined as the percent injected dose per cubic centimeter (or milliliter) in tissue (%ID/cc or %ID/mL). Commonly, a density of 1 g/cc in tissue is assumed and therefore the uptake is often defined as %ID/g. Another method which also includes the weight of the animal is the standardized uptake value (SUV) calculated as the %ID/cc multiplied by the weight (given in g). The resultant number is almost unitless (actually g/cc or g/mL) and is a crude measure of radiotracer uptake into tissue. There are numerous problems with the use of SUV, such as the dependency on body composition (fat vs. muscle), varying radiotracer uptake and imaging durations, endogenous competition and definition of the volume or region of interest (ROI), which are discussed in detail elsewhere [92, 93]. Often substantial residual activity may be present at the injection site and therefore not available for biodistribution, leading to inaccuracies in the injected dose and SUV values. This is particularly true if the site is the tail and outside of the imaging FOV. Several correction schemes, involving blood glucose level, body surface area, and lean body mass have been proposed in clinical studies to try to improve the accuracy of the SUV method and are now being used at some clinical PET centers [94, 95].
In preclinical PET there are also several methods for the extraction of the SUV from the volume of interest (VOIs). The most commonly used method is the extraction of the mean SUV over a ROI or a VOI. When imaging tumors with necrotic cores, another way of quantification is the definition of a lower threshold such as the mean plus 1 SD [96] or the inclusion of voxels exhibiting >75% of maximum radioactivity [97, 98], as a way to exclude areas with low tracer uptake. Sometimes, the use of the max SUV or the “5 hottest voxel” is also reported. The problem in defining the VOI and extracting the SUV is that this value should be a reliable representative measure of radiotracer uptake and thus underlying biology of this specific region.
Kinetic Modeling
Tracer kinetic modeling that describes mathematically the mechanism of transport and biochemical reactions of the tracer in tissue is a method to extract transfer rate constants, volumes of distribution or binding potentials from the radiotracer to the target [99]. Most of the modeling approaches require taking a series of blood samples from the animal to provide the time course of the tracer delivery (called the input function) which is matched to the PET image of the dynamics of the radiotracer concentration in local tissue over time. By applying model fitting or regression analysis the desired biological information can be obtained. In compartment modeling, the model describes the behavior of the tracer mathematically using a number of compartments, each of which represents distinct anatomic, physiologic, or biochemical stage of the behavior of the tracer. Typically the model can be described using a set of linear first order differential equations.
Several methods for PET tracer kinetic modeling have been introduced and are now applied in clinical and preclinical research. Generally speaking they can be divided into model-driven methods [99–104] and data-driven methods [105–110]. The model-driven methods include compartmental models that require the radioactivity concentration in arterial blood or plasma, the so-called “input function,” and reference tissue models, where the target tissue time-activity curve is expressed as a function of the reference tissue time-activity curve. In contrast to the compartmental models based on the input function, which can be applied to all areas of research, reference tissue models are primarily used in neuroimaging [111]. The requirement for using a reference tissue model is that there must be a region in the brain that is devoid of receptors and representative of the blood time activity values. This region is then used as an indirect input function to the target region. The data-driven methods include graphical analysis or spectral analysis. Graphical analysis methods such as Logan and Patlak plots [105–108, 110] use a transformation of the data such that a linear regression of the transformed data yields the desired parameters. These methods are simple and elegant, yet they may be biased by statistical noise [112], the definition of the starting point for the linear regression is variable and they also fail to provide information about the underlying compartmental structure. A more detailed description together with the mathematical background can be found elsewhere [113–115].
Guidance on Imaging Studies
A good description on the methods used in preclinical studies is given by Stout et al. [78]. This paper focuses on the methods descriptions in manuscripts, however it can also be used as a “how to do imaging” guide as well. Quantitative preclinical PET is highly dependent on scanner and animal related parameters. Therefore, it is difficult to define parameters required to perform an adequate small animal PET imaging study that are valid for all studies, as each study design must be optimized based on the biological target, species used, radiopharmaceutical and scanner performance.
As an example, for a mouse [18F]FDG oncology study the following parameter settings seem to be optimal [68]:
- Static scan after 50–60 min
- 6-8 h fasting before [18F]FDG injection
- Warm animals before [18F]FDG injection and during the uptake period
- Isoflurane anesthesia during the injection and uptake period (optional) and during imaging (required)
The details on how the imaging study was performed are extremely important when it comes to replication or expanding on existing work from other laboratories. Standardization of the imaging procedure is particularly essential when pooling data acquired in different labs.
Opportunities
Molecular imaging can help in understanding of biological processes behind a particular disease. In central nervous system (CNS) drug development, the use of translational imaging is essential for successful clinical proof-of-concept testing [116]. The potential of CNS PET imaging to translate the finding allows the assessment of target occupancy in preclinical species, before first-in-human safety and tolerability studies, to refine dose ranges for exploration in humans. Hargreaves et al. pointed out that PET imaging has been an important tool for investigating drug–target interactions and the pathophysiology of many diseases such as monoaminergic dysfunction in schizophrenia and depression. Especially studies in non-human primates allow a prediction of the behavior of a drug in humans due to the high genetic homology [117].
Another area of research where PET has a pivotal role is the application of molecular imaging to oncology. Using a variety of radiotracers, different diagnostic targets such as proliferation, hypoxia, cell surface molecules, tumor vasculature and oxygenation can be assessed [118]. An interesting research area is the use of imaging for the assessment of early drug response in “mouse avatars,” where sectioned patient tumor samples are implanted in immundeficient mice for subsequent use in drug efficacy studies [119]. The avatars allow for each patient to have their own tumor grow in an in vivo system, thereby enabling the identification of a personalized therapeutic concept. This avatar approach is a promising concept and has been shown in a murine lung cancer study that mirrored an ongoing human clinical trial in patients with KRAS-mutant lung cancers [120]. Using FDG-PET in mice and patients, they were able to predict antitumor efficacy of docetaxel, selumetinib or combined selumetinib-docetaxel in treating Kras-mutant lung cancers.
Conclusion
PET imaging of metabolism is an excellent research tool that requires careful consideration of both physical and metabolic factors in order to obtain meaningful and reproducible information. There are many different hardware and software options that require appropriate selection of options in order to obtain useful images. The use of animals needs to be carefully considered with respect to their physiological environmental support to obtain meaningful metabolic measurements. With proper attention to the many details involved with PET imaging, reproducible measurement that have translational potential can be obtained.
Conflict of Interest Statement
The authors declare that the research was conducted in the absence of any commercial or financial relationships that could be construed as a potential conflict of interest.
References
1. Lewis JS, Achilefu S, Garbow JR, Laforest R, Welch MJ. Small animal imaging. Current technology and perspectives for oncological imaging. Eur. J. Cancer (2002) 38:2173–88. doi: 10.1016/S0959-8049(02)00394-5
2. Budinger TF, Benaron DA, Koretsky AP. Imaging transgenic animals. Annu Rev Biomed Eng. (1999) 1:611–48. doi: 10.1146/annurev.bioeng.1.1.611
3. Cherry SR, Gambhir SS. Use of positron emission tomography in animal research. ILAR J. (2001) 42:219–32. doi: 10.1093/ilar.42.3.219
4. Dupont P, Warwick J. Kinetic modelling in small animal imaging with PET. Methods (2009) 48:98–103. doi: 10.1016/j.ymeth.2009.03.008
5. Shoghi KI. Quantitative small animal PET. Q J Nucl Med Mol Imaging (2009) 53:365–73. doi: 10.1016/j.nucmedbio.2007.07.010
6. Melcher CL, Manente RA, Peterson CA, Schweitzer JS. Czochralski growth of rare earth oxyorthosilicate single crystals. J Crystal Growth (1993) 128:1001–5. doi: 10.1016/S0022-0248(07)80086-8
7. Liyuan Z, Rihua M, Ren-Yuan Z. Emission spectra of LSO and LYSO crystals excited by UV light, x-ray and gamma-ray. In: 2007 IEEE Nuclear Science Symposium Conference Record; Oct 26–Nov 3; Honolulu, HI (2007). p. 4574–80. doi: 10.1109/nssmic.2007.4437128
8. Tai C, Chatziioannou A, Siegel S, Young J, Newport D, Goble RN, et al. Performance evaluation of the microPET P4: a PET system dedicated to animal imaging. Phys Med Biol. (2001) 46:1845–62. doi: 10.1088/0031-9155/46/7/308
9. Knoess C, Siegel S, Smith A, Newport D, Richerzhagen N, Winkeler A, et al. Performance evaluation of the microPET R4 PET scanner for rodents. Eur J Nucl Med Mol Imaging (2003) 30:737–47. doi: 10.1007/s00259-002-1052-6
10. Tai YC, Ruangma A, Rowland D, Siegel S, Newport DF, Chow PL, et al. Performance evaluation of the microPET focus: a third-generation microPET scanner dedicated to animal imaging. J Nucl Med. (2005) 46:455–63.
11. Kim JS, Lee JS, Im KC, Kim SJ, Kim SY, Lee DS, et al. Performance measurement of the microPET focus 120 scanner. J Nucl Med. (2007) 48:1527–35. doi: 10.2967/jnumed.107.040550
12. Visser EP, Disselhorst JA, Brom M, Laverman P, Gotthardt M, Oyen WJ, et al. Spatial resolution and sensitivity of the Inveon small-animal PET scanner. J Nucl Med. (2009) 50:139–47. doi: 10.2967/jnumed.108.055152
13. Szanda I, Mackewn J, Patay G, Major P, Sunassee K, Mullen GE, et al. National electrical manufacturers association NU-4 performance evaluation of the PET component of the NanoPET/CT preclinical PET/CT scanner. J Nucl Med. (2011) 52:1741–7. doi: 10.2967/jnumed.111.088260
14. Prasad R, Ratib O, Zaidi H. Performance evaluation of the FLEX triumph X-PET scanner using the national electrical manufacturers association NU-4 standards. J Nucl Med. (2010) 51:1608–15. doi: 10.2967/jnumed.110.076125
15. Zagni F, D'Ambrosio D, Spinelli AE, Cicoria G, Fanti S, Marengo M. Accurate modeling of a DOI capable small animal PET scanner using GATE. Appl Radiat Isot. (2013) 75:105–14. doi: 10.1016/j.apradiso.2013.02.003
16. Ziemons K, Auffray E, Barbier R, Brandenburg G, Bruyndonckx P, Choi Y, et al. The ClearPET (TM) LSO/LuYAP phoswich scanner: a high performance small animal PET system. In: 2003 IEEE Nuclear Science Symposium Conference Record, Vol. 1–5. Portland, OR (2004). p. 1728–32.
17. Zhang H, Bao Q, Vu NT, Silverman RW, Taschereau R, Berry-Pusey BN, et al. Performance evaluation of PETbox: a low cost bench top preclinical PET scanner. Mol Imaging Biol. (2011) 13:949–61. doi: 10.1007/s11307-010-0413-y
18. Herrmann K, Dahlbom M, Nathanson D, Wei L, Radu C, Chatziioannou A, et al. Evaluation of the Genisys4, a bench-top preclinical PET scanner. J Nucl Med. (2013) 54:1162–67. doi: 10.2967/jnumed.112.114926
19. Sanchez F, Moliner L, Correcher C, Gonzalez A, Orero A, Carles M, et al. Small animal PET scanner based on monolithic LYSO crystals: performance evaluation. Med Phys. (2012) 39:643–53. doi: 10.1118/1.3673771
20. Sanchez F, Orero A, Soriano A, Correcher C, Conde P, Gonzalez A, et al. ALBIRA: a small animal PETSPECTCT imaging system. Med Phys. (2013) 40:051906. doi: 10.1118/1.4800798
21. Jeavons AP, Chandler RA, Dettmar CAR. A 3D HIDAC-PET camera with sub-millimetre resolution for imaging small animals. In: 1998 IEEE Nuclear Science Symposium Conference Record. Toronto, ON (1998). p. 1067–72.
22. Goertzen AL, Bao Q, Bergeron M, Blankemeyer E, Blinder S, Canadas M, et al. NEMA NU 4-2008 comparison of preclinical PET imaging systems. J Nucl Med. (2012) 53:1300–9. doi: 10.2967/jnumed.111.099382
23. Surti S, Karp JS, Perkins AE, Cardi CA, Daube-Witherspoon ME, Kuhn A, et al. Imaging performance of A-PET: a small animal PET camera. IEEE Trans Med Imaging (2005) 24:844–52. doi: 10.1109/TMI.2005.844078
24. Ziemons K, Auffray E, Barbier R, Brandenburg G, Bruyndonckx P, Choi Y, et al. The ClearPET (TM) project: development of a 2nd generation high-performance small animal PET scanner. Nucl Instrum Meth A (2005) 537:307–11. doi: 10.1016/j.nima.2004.08.032
25. Wang Y, Seidel J, Tsui BM, Vaquero JJ, Pomper MG. Performance evaluation of the GE healthcare eXplore VISTA dual-ring small-animal PET scanner. J Nucl Med. (2006) 47:1891–1900.
26. Chatziioannou A, Tai YC, Doshi N, Cherry SR. Detector development for microPET II: a 1 microl resolution PET scanner for small animal imaging. Phys Med Biol. (2001) 46:2899–910. doi: 10.1088/0031-9155/46/11/310
27. Yang Y, Tai YC, Siegel S, Newport DF, Bai B, Li Q, et al. Optimization and performance evaluation of the microPET II scanner for in vivo small-animal imaging. Phys Med Biol. (2004) 49:2527–45. doi: 10.1088/0031-9155/49/12/005
28. Levin CS, Hoffman EJ. Calculation of positron range and its effect on the fundamental limit of positron emission tomography system spatial resolution. Phys Med Biol. (1999) 44:781–99. doi: 10.1088/0031-9155/44/3/019
29. Fu L, Qi J. A residual correction method for high-resolution PET reconstruction with application to on-the-fly Monte Carlo based model of positron range. Med Phys. (2010) 37:704–13. doi: 10.1118/1.3284980
30. Rahmim A, Qi J, Sossi V. Resolution modeling in PET imaging: theory, practice, benefits, and pitfalls. Med Phys. (2013) 40:064301. doi: 10.1118/1.4800806
31. De Jong HWAM, Perk L, Visser GWM, Boellaard R, van Dongen GAMS, Lammertsma AA. High resolution PET imaging characteristics of /sup 68/Ga, /sup 124/I and /sup 89/Zr compared to /sup 18/F. In: 2005 IEEE Nuclear Science Symposium Conference Record; Oct 23–29; San Juan (2005). p. 1624–27. doi: 10.1109/nssmic.2005.1596630
32. Tarantola G, Zito F, Gerundini P. PET instrumentation and reconstruction algorithms in whole-body applications. J Nucl Med. (2003) 44:756–69.
33. Habte F, Ren G, Doyle TC, Liu H, Cheng Z, Paik DS. Impact of a multiple mice holder on quantitation of high-throughput MicroPET imaging with and without Ct attenuation correction. Mol Imaging Biol. (2013) 15:569–75. doi: 10.1007/s11307-012-0602-y
34. Aide N, Desmonts C, Briand M, Meryet-Figuiere M, Poulain, L. High-throughput small animal PET imaging in cancer research: evaluation of the capability of the Inveon scanner to image four mice simultaneously. Nucl Med Commun. (2010) 31:851–58. doi: 10.1097/MNM.0b013e32833dc61d
35. Rominger A, Mille E, Zhang S, Boning G, Forster S, Nowak S, et al. Validation of the octamouse for simultaneous 18F-fallypride small-animal PET recordings from 8 mice. J Nucl Med. (2010) 51:1576–83. doi: 10.2967/jnumed.110.078451
36. Prasad R, Zaidi H. Scatter characterization and correction for simultaneous multiple small-animal PET imaging. Mol Imaging Biol. (2013). doi: 10.1007/s11307-013-0683-2. [Epub ahead of print].
37. Lehnert W, Meikle SR, Siegel S, Newport D, Banati RB, Rosenfeld AB. Evaluation of transmission methodology and attenuation correction for the microPET Focus 220 animal scanner. Phys Med Biol. (2006) 51:4003–16. doi: 10.1088/0031-9155/51/16/008
38. Chow PL, Rannou FR, Chatziioannou AF. Attenuation correction for small animal PET tomographs. Phys Med Biol. (2005) 50:1837–50. doi: 10.1088/0031-9155/50/8/014
39. D'Ambrosio D, Zagni F, Spinelli AE, Marengo M. Attenuation correction for small animal PET images: a comparison of two methods. Comput Math Methods Med. (2013) 2013:103476. doi: 10.1155/2013/103476
40. Xu EZ, Mullani NA, Gould KL, Anderson WL. A segmented attenuation correction for PET. J Nucl Med. (1991) 32:161–5.
41. Nuyts J, Dupont P, Stroobants S, Benninck R, Mortelmans L, Suetens, P. Simultaneous maximum a posteriori reconstruction of attenuation and activity distributions from emission sinograms. IEEE Trans Med Imaging (1999) 18:393–403. doi: 10.1109/42.774167
42. Hoffman EJ, Huang SC, Phelps ME. Quantitation in positron emission computed tomography: 1. Effect of object size. J Comput Assist Tomogr. (1979) 3:299–308. doi: 10.1097/00004728-197906000-00001
43. Phelps ME. PET: Molecular Imaging and Its Biological Applications. Berlin: Springer (2004). doi: 10.1007/978-0-387-22529-6
44. Soret M, Bacharach SL, Buvat I. Partial-volume effect in PET tumor imaging. J Nucl Med. (2007) 48:932–45. doi: 10.2967/jnumed.106.035774
45. Disselhorst JA, Brom M, Laverman P, Slump CH, Boerman OC, Oyen WJ, et al. Image-quality assessment for several positron emitters using the NEMA NU 4-2008 standards in the Siemens Inveon small-animal PET scanner. J Nucl Med. (2010) 51:610–7. doi: 10.2967/jnumed.109.068858
46. Prieto E, Marti-Climent JM, Arbizu J, Garrastachu P, Dominguez I, Quincoces G, et al. Evaluation of spatial resolution of a PET scanner through the simulation and experimental measurement of the recovery coefficient. Comput Biol Med. (2010) 40:75–80. doi: 10.1016/j.compbiomed.2009.11.002
47. Kessler RM, Ellis JR Jr, Eden, M. Analysis of emission tomographic scan data: limitations imposed by resolution and background. J Comput Assist Tomogr. (1984) 8:514–22. doi: 10.1097/00004728-198406000-00028
48. Chen CH, Muzic RF Jr, Nelson AD, Adler LP. Simultaneous recovery of size and radioactivity concentration of small spheroids with PET data. J Nucl Med. (1999) 40:118–30.
49. Boellaard R, Krak NC, Hoekstra OS, Lammertsma AA. Effects of noise, image resolution, and ROI definition on the accuracy of standard uptake values: a simulation study. J Nucl Med. (2004) 45:1519–27.
50. Rousset OG, Ma Y, Evans AC. Correction for partial volume effects in PET: principle and validation. J Nucl Med. (1998) 39:904–11.
51. Mannheim JG, Judenhofer MS, Schmid A, Tillmanns J, Stiller D, Sossi V, et al. Quantification accuracy and partial volume effect in dependence of the attenuation correction of a state-of-the-art small animal PET scanner. Phys Med Biol. (2012) 57:3981–93. doi: 10.1088/0031-9155/57/12/3981
52. Daube-Witherspoon ME, Muehllehner, G. Treatment of axial data in three-dimensional PET. J Nucl Med. (1987) 28:1717–24.
53. Lewitt RM, Muehllehner G, Karp JS. 3D image reconstruction for PET by multi-slice rebinning and axial filtering. In: 1991 IEEE Nuclear Science Symposium Conference Record; Nov 2–9; Santa Fe, NM (1991). p. 2054–61. doi: 10.1109/nssmic.1991.259277
54. Lewitt RM, Muehllehner G, Karpt JS. Three-dimensional image reconstruction for PET by multi-slice rebinning and axial image filtering. Phys Med Biol. (1994) 39:321–39. doi: 10.1088/0031-9155/39/3/002
55. Defrise M, Kinahan PE, Townsend DW, Michel C, Sibomana M, Newport DF. Exact and approximate rebinning algorithms for 3-D PET data. IEEE Trans Med Imaging (1997) 16:145–58. doi: 10.1109/42.563660
56. Johnson CA, Seidel J, Carson RE, Gandler WR, Sofer A, Green MV, et al. Evaluation of 3D reconstruction algorithms for a small animal PET camera. Nucl Sci IEEE Trans. (1997) 44:1303–8. doi: 10.1109/23.597005
57. Qi J, Leahy RM., Cherry SR, Chatziioannou A, Farquhar TH. High-resolution 3D Bayesian image reconstruction using the microPET small-animal scanner. Phys Med Biol. (1998) 43:1001–13. doi: 10.1088/0031-9155/43/4/027
58. Chatziioannou A, Qi J, Moore A, Annala A, Nguyen K, Leahy R, et al. Comparison of 3-D maximum a posteriori and filtered backprojection algorithms for high-resolution animal imaging with microPET. IEEE Trans Med Imaging (2000) 19:507–12. doi: 10.1109/42.870260
59. Cheng JC, Shoghi K, Laforest R. Quantitative accuracy of MAP reconstruction for dynamic PET imaging in small animals. Med Phys. (2012) 39:1029–41. doi: 10.1118/1.3678489
60. Hussey D, Dasilva JN, Greenwald E, Cheung K, Kapur S, Wilson AA, et al. Chapter 41—statistical power analysis of in vivo studies in rat brain using PET Radiotracers. In: Carson RE, Daube-Witherspoon ME, Herscovitch P, eds. Quantitative Functional Brain Imaging with Positron Emission Tomography. San Diego, CA: Academic Press (1998). p. 273–7.
61. Eckelman WC, Kilboum MR, Joyal JL, Labiris R, Valliant JF. Justifying the number of animals for each experiment. Nucl Med Biol. (2007) 34:229–32. doi: 10.1016/j.nucmedbio.2007.01.005
62. Alstrup AK, Smith DF. Anaesthesia for positron emission tomography scanning of animal brains. Lab Anim. (2013) 47:12–8. doi: 10.1258/la.2012.011173
63. Finegan BA, Gandhi M, Cohen MR, Legatt D, Clanachan AS. Isoflurane alters energy substrate metabolism to preserve mechanical function in isolated rat hearts following prolonged no-flow hypothermic storage. Anesthesiology (2003) 98:379–86. doi: 10.1097/00000542-200302000-00018
64. Toyama H, Ichise M, Liow JS, Vines DC, Seneca NM, Modell KJ, et al. Evaluation of anesthesia effects on [18F]FDG uptake in mouse brain and heart using small animal PET. Nucl Med Biol. (2004) 31:251–6. doi: 10.1016/S0969-8051(03)00124-0
65. Flores JE, McFarland LM, Vanderbilt A, Ogasawara AK, Williams SP. The effects of anesthetic agent and carrier gas on blood glucose and tissue uptake in mice undergoing dynamic FDG-PET imaging: sevoflurane and isoflurane compared in air and in oxygen. Mol Imaging Biol. (2008) 10:192–200. doi: 10.1007/s11307-008-0137-4
66. Kreissl MC, Stout DB, Wong KP, Wu HM, Caglayan E, Ladno W, et al. Influence of dietary state and insulin on myocardial, skeletal muscle and brain [F]-fluorodeoxyglucose kinetics in mice. EJNMMI Res. (2011) 1:8. doi: 10.1186/2191-219X-1-8
67. Lee KH, Ko BH, Paik JY, Jung KH, Choe YS, Choi Y, et al. Effects of anesthetic agents and fasting duration on 18F-FDG biodistribution and insulin levels in tumor-bearing mice. J Nucl Med. (2005) 46:1531–6.
68. Fueger BJ, Czernin J, Hildebrandt I, Tran C, Halpern BS, Stout D, et al. Impact of animal handling on the results of 18F-FDG PET studies in mice. J Nucl Med. (2006) 47:999–1006.
69. Fuchs K, Kukuk D, Mahling M, Quintanilla-Martinez L, Reischl G, Reutershan J, et al. Impact of Anesthetics On 3'-[18F]Fluoro-3'-Deoxythymidine ([18F]FLT) uptake in animal models of cancer and inflammation. Mol Imaging (2013) 12:277–87.
70. Maier FC, Kneilling M, Reischl G, Cay F, Bukala D, Schmid A, et al. Significant impact of different oxygen breathing conditions on noninvasive in vivo tumor-hypoxia imaging using [(1)(8)F]-fluoro-azomycinarabino-furanoside ([(1)(8)F]FAZA). Radiat Oncol. (2011) 6:165. doi: 10.1186/1748-717X-6-165
71. Vaska P, Woody CL, Schlyer DJ, Shokouhi S, Stoll SP, Pratte JF, et al. RatCAP: miniaturized head-mounted PET for conscious rodent brain imaging. IEEE Trans Nucl Sci. (2004) 51:2718–22. doi: 10.1109/TNS.2004.835740
72. Shokouhi S, Vaska P, Schlyer DJ, Stoll SP, Villanueva A, Kriplani A, et al. System performance Simulations of the RatCAP awake rat brain scanner. IEEE Trans Nucl Sci. (2005) 52:1305–10. doi: 10.1109/TNS.2005.858236
73. Kyme A, Zhou V, Meikle S, Popovic K, Man WNP, Akhtar M, et al. Motion tracking of fully conscious small animals in PET. In: 2009 IEEE Nuclear Science Symposium Conference Record; Oct 24–Nov 1; Orlando, FL (2009). p. 2561–66. doi: 10.1109/nssmic.2009.5402025
74. Kyme A, Se S, Meikle S, Ryder W, Popovic K, Fulton R. Markerless motion tracking enabling motion-compensated PET in awake rats. In: Nuclear Science Symposium and Medical Imaging Conference (NSS/MIC), 2012 IEEE (2012). p. 3825–8.
75. Suckow C, Kuntner C, Chow P, Silverman R, Chatziioannou A, Stout D. Multimodality rodent imaging chambers for use under barrier conditions with gas anesthesia. Mol Imaging Biol. (2009) 11:100–6. doi: 10.1007/s11307-008-0165-0
76. David JM, Knowles S, Lamkin DM, Stout DB. Individually ventilated cages impose cold stress on laboratory mice: a source of systemic experimental variability. J Am Assoc Lab Anim Sci. (2013) 52:738–44.
77. Kokolus KM, Capitano ML, Lee CT, Eng JW, Waight JD, Hylander BL, et al. Baseline tumor growth and immune control in laboratory mice are significantly influenced by subthermoneutral housing temperature. Proc Natl Acad Sci USA. (2013) 110:20176–181. doi: 10.1073/pnas.1304291110
78. Stout D, Berr SS, Leblanc A, Kalen JD, Osborne D, Price J, et al. Guidance for methods descriptions used in preclinical imaging papers. Mol Imaging (2013) 12:1–15.
79. Nelson GS, Perez J, Colomer MV, Ali R, Graves, E. Facilitating multimodal preclinical imaging studies in mice by using an immobilization bed. Comp Med. (2011) 61:499–504.
80. Richter T, Bergmann R, Pietzsch J, Kozle I, Hofheinz F, Schiller E, et al. Effects of posture on regional pulmonary blood flow in rats as measured by PET. J Appl Physiol. (2010) 108:422–9. doi: 10.1152/japplphysiol.91257.2008
81. Diehl KH, Hull R, Morton D, Pfister R, Rabemampianina Y, Smith D, et al. A good practice guide to the administration of substances and removal of blood, including routes and volumes. J Appl Toxicol. (2001) 21:15–23. doi: 10.1002/jat.727
82. Vines DC, Green DE, Kudo G, Keller H. Evaluation of mouse tail-vein injections both qualitatively and quantitatively on small-animal PET tail scans. J Nucl Med Technol. (2011) 39:264–70. doi: 10.2967/jnmt.111.090951
83. Berry-Pusey BN, Chang YC, Prince SW, Chu K, David J, Taschereau R, et al. A semi-automated vascular access system for preclinical models. Phys Med Biol (2013) 58:5351–62. doi: 10.1088/0031-9155/58/16/5351
84. Schiffer WK, Mirrione MM, Dewey SL. Optimizing experimental protocols for quantitative behavioral imaging with 18F-FDG in rodents. J Nucl Med. (2007) 48:277–87.
85. Wong KP, Sha W, Zhang X, Huang SC. Effects of administration route, dietary condition, and blood glucose level on kinetics and uptake of 18F-FDG in mice. J Nucl Med. (2011) 52:800–7. doi: 10.2967/jnumed.110.085092
86. Hume SP, Gunn RN, Jones T. Pharmacological constraints associated with positron emission tomographic scanning of small laboratory animals. Eur J Nucl Med. (1998) 25:173–76. doi: 10.1007/s002590050211
87. Fischer K, Sossi V, Schmid A, Thunemann M, Maier FC, Judenhofer MS, et al. Noninvasive nuclear imaging enables the in vivo quantification of striatal dopamine receptor expression and raclopride affinity in mice. J Nucl Med. (2011) 52:1133–41. doi: 10.2967/jnumed.110.086942
88. Maeda J, Ji B, Irie T, Tomiyama T, Maruyama M, Okauchi T, et al. Longitudinal, quantitative assessment of amyloid, neuroinflammation, and anti-amyloid treatment in a living mouse model of Alzheimer's disease enabled by positron emission tomography. J Neurosci. (2007) 27:10957–68. doi: 10.1523/JNEUROSCI.0673-07.2007
90. Besch EL, Chou BJ, Cornelius CE. Physiological responses to blood collection methods in rats. Proc Soc Exp Biol Med. (1971) 138:1019–21. doi: 10.3181/00379727-138-36041
91. Yang R, Tan X, Kenney RJ Jr, Thomas A, Landis M, Qureshi N, et al. Hemorrhagic shock in the rat: comparison of carotid and femoral cannulation. J Surg Res. (2008) 144:124–6. doi: 10.1016/j.jss.2007.04.010
93. Huang SC. Anatomy of SUV. Standardized uptake value. Nucl Med Biol. (2000) 27:643–6. doi: 10.1016/S0969-8051(00)00155-4
94. Kim CK, Gupta NC, Chandramouli B, Alavi A. Standardized uptake values of FDG: body surface area correction is preferable to body weight correction. J Nucl Med. (1994) 35:164–7.
95. Graham MM, Peterson LM, Hayward RM. Comparison of simplified quantitative analyses of FDG uptake. Nucl Med Biol. (2000) 27:647–55. doi: 10.1016/S0969-8051(00)00143-8
96. Beck R, Roper B, Carlsen JM, Huisman MC, Lebschi JA, Andratschke N, et al. Pretreatment 18F-FAZA PET predicts success of hypoxia-directed radiochemotherapy using tirapazamine. J Nucl Med. (2007) 48:973–80. doi: 10.2967/jnumed.106.038570
97. Cejka D, Kuntner C, Preusser M, Fritzer-Szekeres M, Fueger BJ, Strommer S, et al. FDG uptake is a surrogate marker for defining the optimal biological dose of the mTOR inhibitor everolimus in vivo. Br J Cancer (2009) 100:1739–45. doi: 10.1038/sj.bjc.6605076
98. Fuereder T, Wanek T, Pflegerl P, Jaeger-Lansky A, Hoeflmayer D, Strommer S, et al. Gastric cancer growth control by BEZ235 in vivo does not correlate with PI3K/mTOR target inhibition but with [18F]FLT uptake. Clin Cancer Res. (2011) 17:5322–32. doi: 10.1158/1078-0432.CCR-10-1659
99. Gunn RN, Gunn SR, Cunningham VJ. Positron emission tomography compartmental models. J Cereb Blood Flow Metab. (2001) 21:635–52. doi: 10.1097/00004647-200106000-00002
100. Kety SS. The theory and applications of the exchange of inert gas at the lungs and tissues. Pharmacol Rev. (1951) 3:1–41.
101. Sokoloff L, Reivich M, Kennedy C, Des Rosiers MH, Patlak CS, Pettigrew KD, et al. The [14C]deoxyglucose method for the measurement of local cerebral glucose utilization: theory, procedure, and normal values in the conscious and anesthetized albino rat. J Neurochem. (1977) 28:897–16. doi: 10.1111/j.1471-4159.1977.tb10649.x
102. Phelps ME, Huang SC, Hoffman EJ, Selin C, Sokoloff L, Kuhl DE. Tomographic measurement of local cerebral glucose metabolic rate in humans with (F-18)2-fluoro-2-deoxy-D-glucose: validation of method. Ann Neurol. (1979) 6:371–88. doi: 10.1002/ana.410060502
103. Mintun MA, Raichle ME, Kilbourn MR, Wooten GF, Welch MJ. A quantitative model for the in vivo assessment of drug binding sites with positron emission tomography. Ann Neurol. (1984) 15:217–27. doi: 10.1002/ana.410150302
104. Huang SC, Feng DG, Phelps ME. Model dependency and estimation reliability in measurement of cerebral oxygen utilization rate with oxygen-15 and dynamic positron emission tomography. J Cereb Blood Flow Metab. (1986) 6:105–19. doi: 10.1038/jcbfm.1986.13
105. Gjedde A. Calculation of cerebral glucose phosphorylation from brain uptake of glucose analogs in vivo: a re-examination. Brain Res. (1982) 257:237–74. doi: 10.1016/0165-0173(82)90018-2
106. Patlak CS, Blasberg RG, Fenstermacher JD. Graphical evaluation of blood-to-brain transfer constants from multiple-time uptake data. J Cereb Blood Flow Metab. (1983) 3:1–7. doi: 10.1038/jcbfm.1983.1
107. Patlak CS, Blasberg RG. Graphical evaluation of blood-to-brain transfer constants from multiple-time uptake data. Gen. J Cereb Blood Flow Metab. (1985) 5:584–90. doi: 10.1038/jcbfm.1985.87
108. Logan J, Fowler JS, Volkow ND, Wolf AP, Dewey SL, Schlyer DJ, et al. Graphical analysis of reversible radioligand binding from time-activity measurements applied to [N-11C-methyl]-(-)-cocaine PET studies in human subjects. J Cereb Blood Flow Metab. (1990) 10:740–747. doi: 10.1038/jcbfm.1990.127
109. Cunningham VJ, Jones T. Spectral analysis of dynamic PET studies. J Cereb Blood Flow Metab. (1993) 13:15–23. doi: 10.1038/jcbfm.1993.5
110. Logan J, Fowler JS, Volkow ND, Wang GJ, Ding YS, Alexoff DL. Distribution volume ratios without blood sampling from graphical analysis of PET data. J Cereb Blood Flow Metab. (1996) 16:834–40. doi: 10.1097/00004647-199609000-00008
111. Lammertsma AA, Bench CJ, Hume SP, Osman S, Gunn K, Brooks DJ, et al. Comparison of methods for analysis of clinical [11C]raclopride studies. J Cereb Blood Flow Metab. (1996) 16:42–52. doi: 10.1097/00004647-199601000-00005
112. Slifstein M, Laruelle M. Effects of statistical noise on graphic analysis of PET neuroreceptor studies. J Nucl Med. (2000) 41:2083–88.
113. Gunn RN, Gunn SR, Turkheimer FE, Aston JAD, Cunningham TJ. Positron emission tomography compartmental models: a basis pursuit strategy for kinetic modeling. J Cerebral Blood Flow Metab. (2002) 22:1425–39. doi: 10.1097/00004647-200212000-00003
114. Carson R. Tracer kinetic modeling PET. In: Bailey D, Townsend D, Valk P, Maisey M, eds. Positron Emission Tomography. London: Springer (2005). p. 127–159. doi: 10.1007/1-84628-007-9_6
115. Müller-Schauenburg W, Reimold M. PET Pharmacokinetic Modelling. In: Lemoigne Y, Caner A, editors. Molecular Imaging: Computer Reconstruction and Practice. NATO science for peace and security series B: physics and biophysics. Archamps: Springer (2008). p. 189–210. doi: 10.1007/978-1-4020-8752-3_11
116. Hargreaves RJ, Rabiner EA. Translational PET imaging research. Neurobiol Dis. (2013). 61:32–8. doi:10.1016/j.nbd.2013.08.017
117. Nader MA, Czoty PW. Brain imaging in nonhuman primates: insights into drug addiction. ILAR J. (2008) 49:89–102. doi: 10.1093/ilar.49.1.89
118. Stahl A, Wieder H, Piert M, Wester HJ, Senekowitsch-Schmidtke R, Schwaiger M. Positron emission tomography as a tool for translational research in oncology. Mol Imaging Biol. (2004) 6:214–24. doi: 10.1016/j.mibio.2004.04.003
119. Malaney P, Nicosia SV, Dave V. One mouse, one patient paradigm: new avatars of personalized cancer therapy. Cancer Lett. (2014) 344:1–12. doi: 10.1016/j.canlet.2013.10.010
Keywords: positron emission tomography (PET), quantification, sensitivity, resolution, SUV, small animal, preclinical, animal handling
Citation: Kuntner C and Stout D (2014) Quantitative preclinical PET imaging: opportunities and challenges. Front. Physics 2:12. doi: 10.3389/fphy.2014.00012
Received: 27 November 2013; Paper pending published: 20 December 2013;
Accepted: 11 February 2014; Published online: 28 February 2014.
Edited by:
Zhen Cheng, Stanford University, USAReviewed by:
Otto Muzik, Wayne State University, USAAdam T. Eggebrecht, Washington University School of Medicine, USA
Aditya Bansal, Mayo Clinic, USA
Copyright © 2014 Kuntner and Stout. This is an open-access article distributed under the terms of the Creative Commons Attribution License (CC BY). The use, distribution or reproduction in other forums is permitted, provided the original author(s) or licensor are credited and that the original publication in this journal is cited, in accordance with accepted academic practice. No use, distribution or reproduction is permitted which does not comply with these terms.
*Correspondence: Claudia Kuntner, Biomedical Systems, Health and Environment Department, AIT Austrian Institute of Technology GmbH, 2444 Seibersdorf, Austria e-mail: claudia.kuntner@ait.ac.at