Spatial structure of ion-scale plasma turbulence
 Yasuhito Narita
 Horia Comişel3,4
 - 1Space Research Institute, Austrian Academy of Sciences, Graz, Austria
- 2Institut für Geophysik und extraterrestrische Physik, Technische Universität Braunschweig, Braunschweig, Germany
- 3Institut für Theoretische Physik, Technische Universität Braunschweig, Braunschweig, Germany
- 4Institute for Space Sciences, Bucharest-Măgurele, Romania
- 5Institut für Planetenforschung, Deutsches Zentrum für Luft- und Raumfahrt, Berlin, Germany
Spatial structure of small-scale plasma turbulence is studied under different conditions of plasma parameter beta directly in the three-dimensional wave vector domain. Two independent approaches are taken: observations of turbulent magnetic field fluctuations in the solar wind measured by four Cluster spacecraft, and direct numerical simulations of plasma turbulence using the hybrid code AIKEF, both resolving turbulence on the ion kinetic scales. The two methods provide independently evidence of wave vector anisotropy as a function of beta. Wave vector anisotropy is characterized primarily by an extension of the energy spectrum in the direction perpendicular to the large-scale magnetic field. The spectrum is strongly anisotropic at lower values of beta, and is more isotropic at higher values of beta. Cluster magnetic field data analysis also provides evidence of axial asymmetry of the spectrum in the directions around the large-scale field. Anisotropy is interpreted as filament formation as plasma evolves into turbulence. Axial asymmetry is interpreted as the effect of radial expansion of the solar wind from the corona.
Introduction
Plasmas in astrophysical systems often evolve into turbulence. Random and stochastic motions of plasmas and magnetic fields can be found, for example, in the solar atmosphere, interplanetary space, interstellar space, and accretion disks. Earlier spacecraft measurements in situ in space have revealed that fluctuations of the interplanetary magnetic field exhibit a power-law spectrum in the frequency domain and that the spectral curve is close to that of Kolmogorov's inertial-range spectrum with the index −5/3 [1, 2] in various places of the heliosphere [3–7]. Understanding physical mechanisms of plasma turbulence has immediate implications on the coronal heating problem, the acceleration and transport of galactic cosmic ray, and the onset of magnetic reconnection process.
While astrophysical plasma turbulence inherits some physical properties from fluid turbulence, the collisionless nature and the coupling with electromagnetic field introduce a larger degree of freedom in physical processes and make the picture of turbulence considerably different from that of hydrodynamic one. Binary collision of particles is so rare that the energy dissipation of turbulence must proceed without the viscous process in fluid. Dissipation of the fluctuation energy must be mediated by wave-particle interactions such as cyclotron and Landau resonance. Plasmas accommodate various kinds of electromagnetic waves in addition to eddies, both possibly contributing to the energy cascade mechanism from larger scales to smaller ones. The presence of the large-scale magnetic field imposes a special direction, and physical processes of field fluctuations and particles must be treated separately in the direction parallel and perpendicular to the large-scale field.
Anisotropy of plasma turbulence has been long discussed in various astrophysical plasma systems. Unlike fluid turbulence, the vortex axis cannot be oriented randomly in space due to the large-scale magnetic field. Furthermore, electromagnetic waves have preferred propagation directions, depending on their modes and the excitation mechanisms. Evidence of anisotropy in plasma turbulence has been presented in numerous studies of solar wind turbulence [8–10], cosmic ray transport [11, 12], and numerical simulations using different schemes for plasma dynamics such as magnetohydrodynamic treatment [13, 14], ion kinetic or hybrid treatment [15–17], gyrokinetic treatment [18], and full-particle treatment [19–21]. Spacecraft measurements in situ in the solar wind have revealed that the fluctuations are markedly anisotropic such that the fluctuation energy is primarily associated with the wave vector perpendicular with respect to the large-scale magnetic field. This property was discovered by studying spatial correlation of fluctuations using multi-spacecraft data [9, 10, 22, 23] (assuming Taylor's frozen-in flow hypothesis [24] and axi-symmetry are valid). Also, coherent waves in the solar wind propagate in highly oblique directions (at angle about 88° from the magnetic field) [25]. Furthermore, axial symmetry is found to be broken in the solar wind in the directions around the large-scale magnetic field both from single spacecraft method (assuming Taylor's hypothesis) [26, 27] and multi-spacecraft data analysis [28, 29].
Here we study small-scale structure of plasma turbulence under different conditions of plasma parameter beta directly in the wave vector domain. The motivation of the study lies in the fact that the value of beta plays an important role in waves and instabilities in plasmas, so it is natural to anticipate a certain type of beta dependence in plasma turbulence. It is not known if beta dependence exists concerning the wave vector anisotropy observationally. Only recently, numerical simulation on the electron gyro-scale has provided evidence of beta dependence of anisotropy [19] such that turbulence tends to restore the isotropic energy spectrum as the value of beta is increased. We postulate that anisotropy is different between low-beta and high-beta plasmas, and that there is a transition in anisotropy connecting the two regimes.
We take two independent approaches to this goal. One is spacecraft observations and the other is direct numerical simulations (DNS). The observational approach is the main focus of this study. We use multi-spacecraft measurements of magnetic field fluctuations in the solar wind as provided by the Cluster mission [30], and interpret the data directly in the three dimensional wave vector domain by the high-resolution analysis technique MSR (Multi-point Signal Resonator) [31]. Anisotropy and axial asymmetry of the energy spectrum are evaluated under different conditions of beta in the range from 0.5 to 2.5. The MSR technique only assumes that the fluctuations represent a set of plane waves, and no additional assumption is needed, e.g., identification of dispersion relations [25], Taylor's frozen-in flow hypothesis [24], or axi-symmetry [22, 23]. The simulation approach is an independent, complementary method in this work. Due to the computational load, our DNS is limited to a two-dimensional spatial setting (but the vectors are treated as three dimensional). Therefore, eddies around the large-scale magnetic field cannot be produced, and furthermore, one cannot resolve fluctuations on the electron gyro-scale. The combination of the two methods serves as a unique tool to study the spatial structure of plasma turbulence at the ion gyroradius or smaller. We find studying small-scale structures of plasma turbulence particularly interesting for the reasons that there is a larger degree of freedom in the Fourier domain when spatial scales are small (i.e., more variety of anisotropy and axial asymmetry in the wave vector domain) and that physical processes are diverse as dissipation of fluctuation energy and dispersion of wave packets may co-exist on the small scales (i.e., more variety of wave-particle interactions and wave-wave couplings).
Methods
Multi-Spacecraft Measurements in the Solar Wind
In the observational approach, we use four-point magnetic field data sampled by fluxgate magnetometer on board Cluster spacecraft [32] to determine the energy spectra. Four time intervals of the solar wind are used in the analysis. The intervals are selected under the following criteria.
1. Cluster is located in the solar wind, and is least affected by back-streaming particles (ions and electrons) from Earth's bow shock. The magnetic field data, ion data [33], and high-frequency wave data [34] from Cluster are used for identification of the solar wind.
2. Local mean of the flow velocity and the magnetic field may be regarded as nearly constant or only slowly varying. Fluctuations may also be regarded as quasi-stationary.
3. Different conditions of the plasma parameter beta are chosen, two representing the low-beta plasmas (beta below unity), and two other the high-beta plasmas (above unity).
4. Four spacecraft form a nearly regular tetrahedron.
5. Spacecraft separation is as small as possible, at about 100 km.
The conditions 1–3. are set for selecting representative solar wind intervals at different values of beta, while those 4, 5. are set to maximize the range of the wave numbers in the measurements, suppressing the artificial effect of anisotropy caused by an irregular shape of the tetrahedron [35, 36]. The identified intervals are 15-min to 30-min long, and are representative for the low-beta plasmas (March 23, 2002, 1700-1730 UT, ion beta about 0.58; February 20, 2002, 1913-1928 UT, ion beta about 0.76) and for the high-beta plasmas (March 7, 2002, 0315–0345 UT, ion beta about 1.66; April 2, 2002, 0525-0555 UT, ion beta about 2.53). Figure 1 displays the time series plots of the magnetic field magnitude measured by Cluster-1. Average values of the magnetic field magnitude, the ion number density, the ion bulk speed, and the values of ion beta are listed in Table 1.
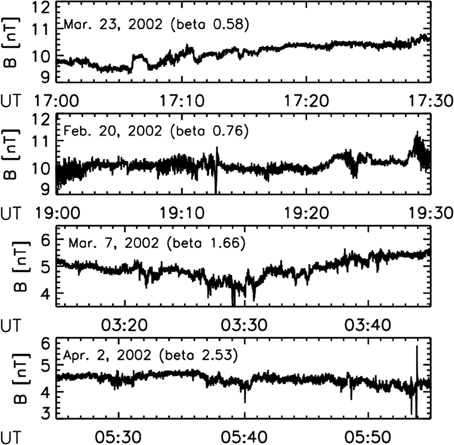
Figure 1. Time series of magnetic field fluctuations (field magnitude) measured by Cluster-1 spacecraft in the solar wind ahead of Earth's bow shock.
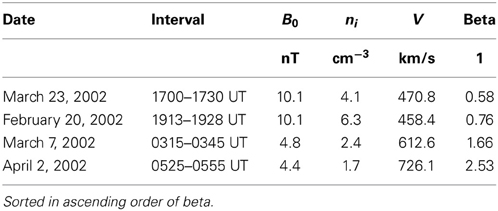
Table 1. Interval parameters (magnetic field magnitude B0, the ion number density ni, the flow speed V, and the plasma parameter beta for ions).
Sampling rate of the magnetometer is either 22 Hz (normal mode) or 67 Hz (burst mode). The data were re-calibrated and down-sampled to 5 Hz by averaging. Only the low-frequency part (up to 1.5 Hz) was used in the spectral analysis, above which the instrument noise becomes more serious and affects the evaluation of the spectra. The time length is 15–30 min. It was determined for the following reasons. The Fourier transform is used to interpret the measurement in the frequency domain, and 15 min are the shortet interval for this task. On the other hand, 30 min are the longest in the data analysis for the reliability and the stability of the wave vector analysis. Tetrahedron must be nearly regular and the spacecraft configuration should not change much during the measurement. Spin tone is avoided in the analysis. Noise is avoided, too, by limiting the frequency range in the analysis. The motion of spacecraft and the change of tetrahedral shape are minimized by setting the time length of the measurement to 15 or 30 min. The tetrahedral configuration parameter QG is larger than 2.5. In spring 2002, the Cluster tetrahedral formation was set to regular around the position of bow shock crossing. Around the apogee, when the spacecraft are located in the solar wind and have enough distance away from the bow shock, the spacecraft configuration is more planar (two-dimensional array) than tetrahedral (three-dimensional array) and the spectral distortion induced by the irregular tetrahedral shape is not negligible in the analysis.
Detailed procedure of the spectral analysis is as follows. First, the time series of four-point magnetic field data are transformed into frequencies using the Fast Fourier Transform algorithm, and the cross spectral density matrix is constructed as a function of the frequencies in the spacecraft frame. The matrix is composed of a vector with 12 elements, representing three components of the magnetic field and four points of measurement. Second, the cross spectral density matrix is transformed from the spatial coordinate into wave vectors by projecting the matrix into a three-by-three correlation matrix as a function of the frequencies and the three-dimensional wave vectors using the MSR technique [31]. The matrix projection in the MSR technique was developed particularly for studying waves and turbulence using four-point magnetic field data, and make use of two different projections. The first type of projection is the least-square projection, known conventionally as Capon's method, the wave telescope, or the k-filtering technique [37–40]. This projection has the advantage that the fluctuation amplitude can be obtained for the coherent part of waves (assuming the set of both coherent and incoherent waves) at various frequencies and wave vectors. The second type is the generalized eigenvalue analysis of the matrix. It is based on the MUSIC algorithm (Multiple Signal Classification) [41], which can distinguish between coherent and incoherent waves at a high resolution in the wave vector domain by decomposing the cross spectral density matrix into two orthogonal systems, one signal sub-space and the other the noise sub-space. On the other hand, the MUSIC algorithm can only determine the fluctuation amplitudes relative to the coherent waves. In addition, the MUSIC algorithm requires that the number of coherent waves must be known a priori. MSR overcomes this weakness by incorporating an additional eigenvalue analysis [42] such that the MUSIC algorithm can be used even without knowing the number of coherent waves. The two projection methods (Capon and generalized MUSIC) are used one after another, and finally, the trace of the projected matrix is used as the estimate of the fluctuation energy in the four-dimensional Fourier domain.
The MSR technique achieves the highest resolution in the wave vector domain known so far in multi-spacecraft data analysis, and assumes only a set of plane waves. No additional assumption is needed such as identification of dispersion relations [25], Taylor's frozen-in flow hypothesis [24], or axi-symmetry [22, 23]. Of course, the MSR technique has limitations. The method inherits the conventional wave vector analysis method (Capon's method), and requires the nearly regular tetrahedron of the spacecraft formation to avoid the spectral distortion effect originating in the different spatial sampling scales [35, 36]. Also, the range of accessible wave numbers is not arbitrarily wide but is limited to the Nyquist wave number for spacecraft separation (at about 100 km).
The energy spectrum is evaluated in the four-dimensional Fourier domain for each time interval. In order to study the wave vector dependence of turbulence, the spectrum is integrated over the frequencies up to 1.5 Hz in the spacecraft frame, above which the instrumental noise becomes more serious. The range is extended to negative values of frequencies. Extension to the negative frequencies is necessary to guarantee the frame-invariance of the wave vector dependence after the frequency integration, making a symmetric spectrum in the four dimensions with respect to the synchronous reversal of frequency and wave vector. The wave vector range is up to the Nyquist wave number for the spacecraft separation, 0.03 rad/km (about 2.5–3 ion inertial wave numbers, kVA/Ωp = 2.5 to kVA/Ωp = 3.0, where VA and Ωp denote the the Alfvén speed and the ion gyro-frequency, respectively, depending on the mean values of magnetic field and the ion number density). After the frequency integration, the spectrum is further integrated in two different ways to reduce the energy spectrum into two dimensions spanned by the parallel and the perpendicular components of the wave vectors in a cylindrical geometry, and that by the two components of the wave vectors in the plane perpendicular to the large-scale magnetic field. The former spectrum is obtained by integrating the three-dimensional spectrum over the azimuthal angles around the large-scale magnetic field, and then is summed over positive and negative components of the parallel wave numbers. As a result, we obtain the energy spectrum in two dimensions, E(k⊥, k‖), where k⊥ and k‖ are the the perpendicular and the parallel components of the wave vectors (in absolute values), respectively. The spectra E(k⊥, k‖) are displayed in Figure 2. The latter spectrum E(k⊥, k‖) is obtained by integrating the three-dimensional spectrum over the parallel components of the wave vector for the analysis of axial asymmetry (shown in Figure 5).
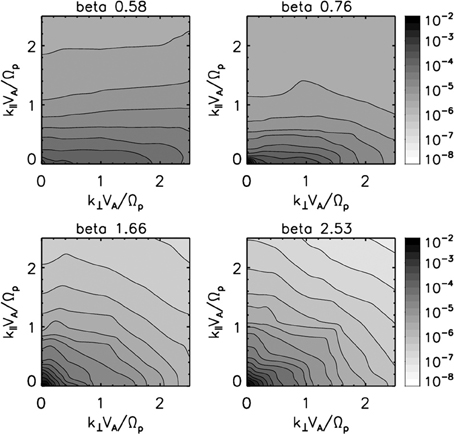
Figure 2. Energy spectra of magnetic field fluctuations in the solar wind in the reduced two-dimensional wave vector domain spanned by the parallel and perpendicular components of the wave vector to the large-scale magnetic field.
The wave vector anisotropy is measured in the reduced spectrum in the parallel-perpendicular plane. We use the large-scale magnetic field which is the average over the measured time length and over different spacecraft to establish a global coordinate system during the measurement. This is conceptually different from the local mean field which depends on scales both in the temporal and the spatial senses. Quantitative measure of wave vector anisotropy makes use of the index (anisotropy index) that compares two covariance quantities, one between the energy spectrum and the parallel components of the wave vector and the other between the spectrum and the perpendicular components of the wave vector. Thus, one may define the anisotropy index A, adapted from Shebalin et al. [43], as
Summation is taken over the wave vector domain of interest. A large value of A (larger than unity) means that the fluctuation energy is associated with the perpendicular wave vectors, and a small value of A (smaller than unity) with the parallel wave vectors. The anisotropy index A is evaluated for the spectra on the four analyzed intervals.
The wave vector dependence is also evaluated in the plane perpendicular to the large-scale magnetic field by integrating the MSR spectrum over the frequencies and then over the parallel components of the wave vectors (results are shown in Figure 5). The orientation in the perpendicular plane is set in the direction of the convective electric field, , the product of the flow velocity and the large-scale magnetic field . The perpendicular-1 direction is orthogonal to both the electric field and the large-scale magnetic field, and the perpendicular-2 direction is in the direction to the electric field.
Direct Numerical Simulation
In the simulation approach, plasma turbulence is generated numerically and the anisotropy is evaluated at different values of beta. The hybrid plasma code AIKEF (Adaptive Ion-Kinetic Electron-Fluid) [44] is used. This code treats ions as individual charged particles and electrons as a massless, charge-neutralizing fluid, and solves the set of equations for the plasma (ion equation of motion) and electromagnetic field (Maxwell equation) in a self-consistent fashion. The use of the code is optimal for the numerical study of anisotropy in that it can resolve the spatial structure of plasma and electromagnetic field on sufficiently small scales at the ion gyroradius and smaller.
Implementation of the code for generating plasma turbulence follows the earlier works in Comişel et al. [15], Verscharen et al. [17]. Namely, DNS are set in the two-dimensional spatial configuration spanned by the parallel and the perpendicular directions to the large-scale magnetic field. Vectorial quantities (fields and particle velocities) are treated in three dimensions. Three different values of beta are used in DNS, 0.1, 1.0, and 2.0. We choose those values as follows. The upper limit of beta is determined by the computational load. Time integration in solving particle and field equations is a demanding task in the computation, since increasingly more particles need to be put into the simulation cells at higher values of beta to ensure the integrability and the stability of the simulation run. Otherwise the simulation is numerically unstable due to the formation of the so-called “vacuum cell” in which no ion is stored incidentally due to high mobility of ions at a higher temperature. The lower limit of beta is set to 0.1 in order to cover a sufficiently wide range of beta by about one order of magnitude in the anisotropy study. The boundary condition is periodic in the both parallel and perpendicular directions. The ion species is protons. The ion velocity distribution is set to Maxwellian at the initial time for the three values of beta. The box size and the mesh size are 500 ion inertial lengths and 2048 grids in each direction, respectively. Each simulation cell contains 400 super-particles (clusters of ions) at beta 0.1 and 1.0, and 800 super-particles at beta 2.0. One thousand discrete Alfvén waves are launched in the low wave number range (up to 20 % of the ion inertial wave number) with an isotropic energy distribution. The initial fluctuation energy follows the power-law spectrum |k|−5/3. Time step of integration is 0.5 ion gyroperiods. No additional fluctuation energy is set during the simulation run.
The spatial mesh is spanned with the regular grid spacing, and the Fast Fourier Transform is used to obtain the energy spectrum directly in the wave vector domain as a function of time. By the time 1000 ion gyroperiods the fluctuations become quasi-stationary, as is judged in the energy spectrum that it does not evolve substantially any more. Figure 3 displays the energy spectrum in the wave vector domain at the three values of beta. The anisotropy index is evaluated at the time 1000 ion gyroperiods and the results are compared with that from the observational approach. The accessible ranges of frequencies and wave vectors are 6 ion gyro-frequencies and 6 ion inertial wave numbers in direct numerical simulation, respectively. These ranges cover sufficiently that in the observational approach (the frequency range is up to about 0.5–1 ion gyro-frequencies and the wave vector is up to about 2.5–3 ion inertial wave numbers).
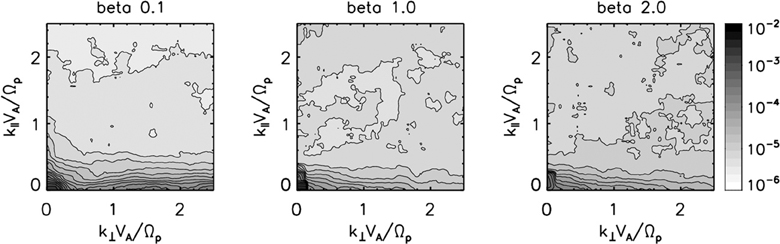
Figure 3. Energy spectra of magnetic field fluctuations in the reduced two-dimensional wave vector domain, obtained by direct numerical simulation using hybrid plasma code AIKEF at the time 1000 ion gyroperiods.
Results
Anisotropy
Figure 2 displays the reduced two-dimensional energy spectra derived from the Cluster data in the solar wind as a function of the parallel and perpendicular components (in absolute values) of the wave vectors. Normalization to the ion inertial scale using the Alfvén speed VA and ion gyro-frequency Ωp is used. Wave vector anisotropy is the strongest in the low-beta plasmas (at beta 0.58 or 0.76). The spectra exhibit primarily an extension in the perpendicular direction to the large-scale magnetic field. The fluctuation energy decays only moderately along the perpendicular wave vector axis, while the decay is steeper along the parallel wave vector axis. Anisotropy is moderate in the high-beta plasmas (at beta 1.66 or 2.53). The primary extension is still in the perpendicular direction, and in addition, the secondary extension appears in the parallel direction. In all cases, the overall structure of the spectral contour lines can be represented by a set of self-similar ellipses (though only a quadrant is used in the analysis) with the primary axis perpendicular to the large-scale field with detailed structures as deviation from the elliptical shape. There is a transition in anisotropy from the low-beta to the high-beta plasmas, that is, the decay of the fluctuation energy along the perpendicular wave vectors becomes steeper and the decay along the parallel wave vectors becomes flatter when the value of beta is higher. In other words, a tendency is discovered that the energy spectrum restores isotropy gradually toward higher values of beta.
Wave vector dependence of the energy spectra obtained by the numerical simulations also exhibits the extension in the perpendicular direction, but the sense of anisotropy is different from that in solar wind turbulence. Figure 3 displays the energy spectra of turbulent magnetic field fluctuations obtained by the three different simulation runs at beta 0.1, 1, and 2 at the time 1000 ion gyroperiods. The same wave vector range as that from the Cluster measurements is used for the sake of direct comparison (up to 2.5 ion inertial wave numbers). All the three simulation runs show that the fluctuation energy is associated with the perpendicular wave vectors, and decays only moderately along this axis. In contrast, the energy decays more steeply in the parallel direction, and furthermore, the slope of the parallel decay is different between the low-beta and the high-beta cases. The parallel decay is steeper in the low-beta plasma (at beta 0.1), while the decay is moderate in the high-beta plasma (at beta 1.0 and 2.0). In all cases, the energy spectrum is nearly flat with only minor variations at the parallel wave number k‖VA/Ωp = 0.3 or higher. The spectral contour lines represent a set of highly-eccentric ellipses (i.e., clear extension of the spectrum in the perpendicular direction). The transition of wave vector anisotropy from low-beta to high-beta plasmas appears in the slope of the energy decay in the parallel direction, and the sense of anisotropy and its beta dependence are different from solar wind turbulence.
The anisotropy index is evaluated for the energy spectra obtained by the both approaches, and its beta dependence is studied quantitatively. The index for the observational spectra varies from A = 5.5 to A = 3.2, A = 2.4, and to A = 2.3 at beta 0.58, 0.76, 1.66, and 2.53, respectively. The beta dependence is visualized graphically in Figure 4. Errors in the observationally determined anisotropy originate in the spacecraft motion and the change in relative spacecraft distance during the measurements, the degree of freedom (or the number of sub-intervals) used in the Fourier transform, and the wave vector range for the index computation (the minimum and maximum wave numbers are set to kVA/Ωp = 0.3 and kVA/Ωp = 2.5, and then these wave numbers are varied by 10 %). The anisotropy index from the numerical simulations varies from A = 5.5 to A = 1.7, and to A = 1.5 at beta 0.1, 1, and 2, respectively. Errors in the numerically determined anisotropy originate in the time evolution effect (which is a minor source) and in the selection of wave vector range for computation of the anisotropy index (Simulation has the spatial resolution up to 6 ion inertial wave numbers). Both observational and numerical approaches show the tendency that the anisotropy index becomes diminished as the value of beta increases.
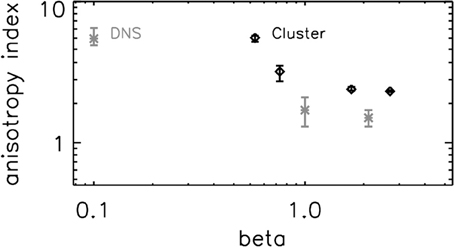
Figure 4. Anisotropy index as a function of the plasma parameter beta.
Axial Asymmetry
The spectra obtained by the Cluster data analysis show a diversity of axial asymmetry. Figure 5 displays the spectra in the perpendicular plane to the large-scale magnetic field (integrated over the parallel components of the wave vectors). The spectra are flatter in the perpendicular plane in the low-beta plasmas (beta 0.58 and 0.76). Moderate extensions appear in the oblique directions from the convective electric field (in the direction to k⊥2) at beta 0.58 or with the secondary peaks of the fluctuation energy at about the ion inertial wave number along the perpendicular-1 axis ((k⊥1VA/Ωp, k⊥2VA/Ωp) ≃ (1, 0)) at beta 0.76 (in addition to the primary energy peak around the origin of the wave vector domain). In the high-beta plasmas the spectra are more axi-symmetric and exhibit extensions in two distinct directions. One extension is associated with the direction to the convective electric field or close to that with the offset angles about 10° away from or toward the flow direction at beta 1.66 and 2.53, respectively. The other extension is highly oblique from the electric field (and more aligned with the flow direction) about 60° from the electric field away from the flow direction at beta 1.66, and about 80° from the electric field toward and the flow direction at beta 2.53. The fluctuation energy decays more steeply in various directions in the high-beta plasmas than in the low-beta plasmas.
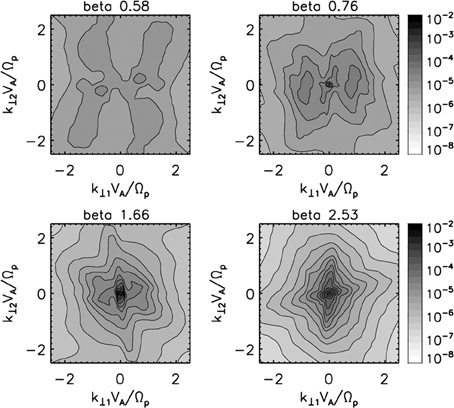
Figure 5. Energy spectra of magnetic field fluctuations in the wave vector domain perpendicular to the large-scale magnetic field. Data are taken from Cluster measurements in the solar wind.
Discussion and Conclusion
Ion-scale structure of magnetic field fluctuations in plasma turbulence is characterized by anisotropy and axial asymmetry with respect to the large-scale field. Anisotropy represents primarily an extension of the energy spectrum perpendicular to the large-scale field. Our hypothesis of beta dependence of anisotropy appears to be valid, judging from the fact that both in situ observations in the solar wind and DNS support the tendency that anisotropy is stronger in low-beta plasmas, and it is moderate in high-beta plasmas. A possible explanation of more isotropic spectra might be the effect of excitation of parallel or obliquely propagating waves in high-beta plasmas such as the whistler mode. Of course, such a scenario implicitly assumes that turbulence represents a set of both linear and non-linear waves and this needs to be evaluated in a different method from our study. The Cluster measurements provide evidence of axial asymmetry in solar wind turbulence in a wider range of beta. There are two significant findings in our study. First, wave vector anisotropy can be classified systematically to the values of beta, i.e., beta plays an important role in characterizing anisotropy. Second, in constast to the anisotropy, the axial asymmetry cannot be classified to beta uniquely. The axial asymmetry is found to be diverse. The spectrum is rather flat in the perpendicular plane in the low-beta plasmas, and the decay of the spectral energy becomes steeper toward higher wave numbers in various directions in the high-beta plasmas. Some of the spectral extensions in the perpendicular plane may be associated with the direction of the convective electric field in the high-beta plasmas, but no systematic trend was found in the present analysis. These conclusions are drawn only from case studies, though taking both observational and numerical approaches, and therefore, need to be verified by statistical analysis in spirit of searching for more detailed dependence on beta. Analysis of fluctuation sense (e.g., incompressible or compressible, right-handed or left-handed field rotation), study of associated velocity distribution functions, and identification of wave dispersion relation would be complementary methods to verify our results.
The development of spectral extension in the perpendicular direction naturally explains filament structures often found in the solar atmosphere and interstellar medium. We interpret that the cause of anisotropy is the effect of wave-wave coupling, that is the resonance condition in both frequencies and wave vectors is constrained by dispersion relation, as studied extensively using the linear Vlasov theory [45]. However, other possibilities such as coherent structures, current sheet originating in corona, and eddies are also likely candidates. In contrast to the anisotropy, the axial asymmetry cannot be explained by wave-wave coupling alone nor be treated in the linear Vlasov theory. We interpret that the asymmetry reflects different spatial expansion rates of the flow components as the solar wind plasma expands radially away from the sun, i.e., the asymmetry is not an intrinsic property of plasma turbulence. We speculate that the convective electric field might play an important role such that the radial component of the expanding flow might suppress or even compensate the energy transport to higher wave numbers. This scenario suggests that large-scale, radial evolution of the plasma and the magnetic field from the corona to the heliosphere is actively interacting with the development of small-scale spatial structure.
Uncertainties of our findings are on the detailed process of filament formation, in particular, on the existence and the influence of eddies in the perpendicular plane (which cannot be generated in the numerical simulations in the two-dimensional setup), and on the existence of the scaling law (the anisotropy index as a function of beta). DNS in the three-dimensional spatial setup have a potential to clarify these issues and the axial asymmetry in a systematic way.
Author Contributions
This study is a team effort. Yasuhito Narita contributes to the data analysis and the interpretation of the results. Horia Comişel to the simulations. Uwe Motschmann to the simulations and the coordination of the work.
Funding
The research leading to the results has received funding from the European Community's Seventh Framework Programme under grant agreement 313038/STORM. The work conducted in Braunschweig received funding from Collaborative Research Center 963, Astrophysical Flow, Instabilities, and Turbulence - AstroFIT of the German Science Foundation.
Conflict of Interest Statement
The authors declare that the research was conducted in the absence of any commercial or financial relationships that could be construed as a potential conflict of interest.
Acknowledgments
We acknowledge scientific teams and organizations that enabled this work: the Cluster magnetometer (FGM), ion experiment (CIS), and high-frequency experiment (WHISPER) teams for their kind permission to use the observational data, Cluster Active Archive for arranging the Cluster data set, and North-German Supercomputing Alliance (Norddeutscher Verbund zur Förderung des Hoch- und Höchstleistungsrechnens - HLRN) for direct numerical simulation.
References
1. Kolmogorov AN. The local structure of turbulence in incompressible viscous fluid for very large reynolds numbers. Dok Akad Nauk SSSR (1941) 30:301–5.
2. Kolmogorov AN. The local structure of turbulence in incompressible viscous fluid for very large reynolds numbers. R Soc Proc A (1991) 434:9–13.
3. Coleman PJJr. Turbulence, viscosity, and dissipation in the solar-wind plasma. Astrophys J. (1968) 153:371–88. doi: 10.1086/149674
4. Marsch E, Tu CY. On the radial evolution of MHD turbulence in the inner heliosphere. J Geophys Res. (1990) 95:8211–29. doi: 10.1029/JA095iA06p08211
5. Matthaeus WH, Goldstein ML. Measurement of the rugged invariants of magnetohydrodynamic turbulence in the solar wind. J Geophys Res. (1982) 87:6011–28. doi: 10.1029/JA087iA08p06011
6. Petrosyan A, Balogh A, Goldstein ML, Léorat J, Marsch E, Petrovay K, et al. Turbulence in the solar atmosphere and solar wind. Space Sci Rev. (2010) 156:135–238. doi: 10.1007/s11214-010-9694-3
7. Podesta JJ, Roberts DA, Goldstein ML. Spectral exponents of kinetic and magnetic energy spectra in solar wind turbulence. Astrophys J. (2007) 664:543–8. doi: 10.1086/519211
8. Chen CHK, Mallet A, Schekochihin AA, Horbury TS, Wicks RT, and Bale SD. Three-dimensional structure of solar wind turbulence. Astrophys J. (2012) 758:120. doi: 10.1088/0004-637X/758/2/120
9. Dasso S, Milano LJ, Matthaeus WH, Smith CW. Anisotropy in fast and slow solar wind fluctuations. Astrophys J. (2005) 635:L181–4. doi: 10.1086/499559
10. Matthaeus WH, Goldstein ML, Roberts DA. Evidence for the presence of quasi-two-dimensional nearly incompressible fluctuations in the solar wind. J Geophys Res. (1990) 95:20673–83. doi: 10.1029/JA095iA12p20673
11. Bieber JW, Matthaeus WH, Smith CW, Wanner W, Kallenrode MB, Wibberenz G. Proton and electron mean free paths: the Palmer consensus revisited. Astrophys J. (1994) 420:294–306. doi: 10.1086/173559
12. Bieber JW, Wanner W, Matthaeus WH. Dominant two-dimensional solar wind turbulence with implications for cosmic ray transport. J Geophys Res. (1996) 101:2511–22. doi: 10.1029/95JA02588
13. Matthaeus WH, Ghosh S, Oughton S, Roberts DA. Anisotropic three-dimensional MHD turbulence. J Geophys Res. (1996) 101:7619–30. doi: 10.1029/95JA03830
14. Matthaeus WH. Ghosh S. Spectral decomposition of solar wind turbulence: three-component model. AIP Conf Proc solar Wind Nine Conf. (1999) 471:519–22.
15. Comişel H, Verscharen D, Narita Y, Motschmann U. Spectral evolution of two-dimensional kinetic plasma turbulence in the wavenumber-frequency domain. Phys Plasmas (2013) 20:090701. doi: 10.1063/1.4820936
16. Valentini F, Califano F, Veltri P. Two-dimensional kinetic turbulence in the solar wind. Phys Rev Lett. (2010) 104:205002. doi: 10.1103/PhysRevLett.104.205002
17. Verscharen D, Marsch E, Motschmann U, Müller J. Kinetic cascade beyond magnetohydrodynamics of solar wind turbulence in two-dimensional hybrid simulations. Phys Plasmas (2012) 19:022305. doi: 10.1063/1.3682960
18. Howes GG, Tenbarge JM, Dorland W, Quataert E, Schekochihin AA, Numata R, et al. Gyrokinetic simulations of solar wind turbulence from ion to electron scales. Phys Rev Lett. (2011) 107:035004. doi: 10.1103/PhysRevLett.107.035004
19. Chang O, Gary SP, Wang, J. Whistler turbulence at variable electron beta: Three-dimensional particle-in-cell simulations. J Geophys Res Space Phys. (2013) 118:2824–33. doi: 10.1002/jgra.50365
20. Gary SP, Chang O, Wang J. Forward cascade of whistler turbulence: Three-dimensional particle-in-cell simulations. Astrophys J. (2012) 755:142. doi: 10.1088/0004-637X/755/2/142
21. Saito S, Gary SP, Li H, Narita Y. Whisler turbulence: Particle-in-cell simulations. Phys Plasmas (2008) 15:02305. doi: 10.1063/1.2997339
22. Chen CHK, Horbury TS, Schekochihin AA, Wicks RT, Alexandrova O, Mitchell J. Anisotropy of solar wind turbulence between ion and electron scales. Phys Rev Lett (2010) 104:255002. doi: 10.1103/PhysRevLett.104.255002
23. Osman KT, Horbury TS. Multispacecraft measurement of anisotropic correlation functions in solar wind turbulence. Astrophys J. (2007) 654:L103–6. doi: 10.1086/510906
24. Taylor GI. The spectrum of turbulence. Proc R Soc Lond. A (1938) 164:476–90. doi: 10.1098/rspa.1938.0032
25. Sahraoui F, Goldstein ML, Belmont G, Canu P, Rezeau L. Three dimensional anisotropic k spectra of turbulence at subproton scales in the solar wind. Phys Rev Lett. (2010) 105:131101. doi: 10.1103/PhysRevLett.105.131101
26. Turner AJ, Gogoberidze G, Chapman SC. Nonaxisymmetric anisotropy of solar wind turbulence as a direct test for models of magnetohydrodynamic turbulence. Phys Rev Lett. (2012) 108:085001. doi: 10.1103/PhysRevLett.108.085001
27. Turner AJ, Gogoberidze G, Chapman SC, Hnat B, Müller WC. Nonaxisymmetric anisotropy of solar wind turbulence. Phys Rev Lett. (2011) 107:095002. doi: 10.1103/PhysRevLett.107.095002
28. Narita Y, Glassmeier KH, Goldstein ML, Motschmann U, Sahraoui F. Three-dimensional spatial structures of solar wind turbulence from 10 000-km to 100-km scales. Ann Geophys. (2011b) 29:1731–8. doi: 10.5194/angeo-29-1731-2011
29. Narita Y, Glassmeier KH, Goldstein ML, Sahraoui F. Wave-vector dependence of magnetic-turbulence spectra in the solar wind. Phys Rev Lett. (2010) 104:171101. doi: 10.1103/PhysRevLett.104.171101
30. Escoubet CP, Fehringer M, Goldstein M. The Cluster mission. Ann Geophys. (2001) 19:1197–200. doi: 10.5194/angeo-19-1197-2001
31. Narita Y, Glassmeier KH, Motschmann U. High-resolution wave number spectrum using multi-point measurements in space - the multi-point signal resonator (MSR) technique. Ann Geophys. (2011a) 29:351–60. doi: 10.5194/angeo-29-351-2011
32. Balogh A, Carr CM, Acuña MH, Dunlop MW, Beek TJ, Brown P, et al. The Cluster magnetic field investigation: overview of in-flight performance and initial results. Ann Geophys. (2001) 19:1207–17. doi: 10.5194/angeo-19-1207-2001
33. Rème H, Aoustin C, Bosqued MM, Dandouras I, Lavraud B, Sauvaud JA, et al. First multispacecraft ion measurements in and near the earth's magnetosphere with the identical cluster ion spectrometry (CIS) experiment. Ann Geophys. (2001) 19:1303–54. doi: 10.5194/angeo-19-1303-2001
34. Décréau PME, Fergeau P, Krasnoselskikh V, Guirriec EL, Lévêque M, Martin P, et al. Early results from the whistper instrument on Cluster: an overview. Ann Geophys. (2001) 19:1241–58. doi: 10.5194/angeo-19-1241-2001
35. Narita Y, Glassmeier KH. Spatial aliasing and distortion of energy distribution in the wave vector domain under multi-spacecraft measurements. Ann Geophys. (2009) 27:3031–42. doi: 10.5194/angeo-27-3031-2009
36. Sahraoui F, Belmont G, Goldstein M, Rezeau L. Limitations of multi-spacecraft data techniques in measuring wavenumber spectra of space plasma turbulence. J Geophys Res. (2010) 115:A04206. doi: 10.1029/2009JA014724
37. Glassmeier KH, Motschmann U, Dunlop M, Balogh A, Acuna MH, Carr C, et al. Cluster as a wave telescope - first results from the fluxgate magnetometer. Ann Geophys. (2001) 19:1439–47. doi: 10.5194/angeo-19-1439-2001
38. Motschmann U, Woodward TI, Glassmeier KH, Southwood DJ, Pinçon JL. Wavelength and direction filtering by magnetic measurements at satellite arrays: generalized minimum variance analysis. J Geophys Res. (1996) 101:4961–66. doi: 10.1029/95JA03471
39. Neubauer FM, Glassmeier KH. Use of an array of satellites as a wave telescope. J Geophys Res. (1990) 95:19115–22. doi: 10.1029/JA095iA11p19115
40. Pinçon JL, Lefeuvre F. Local characterization of homogeneous turbulence in a space plasma from simultaneous measurements of field components at several points in space. J Geophys Res. (1991) 96:1789–802.
41. Schmidt RO. Multiple emitter location and signal parameter estimation. IEEE Trans Ant Prop. (1986) AP-34:276–80. doi: 10.1109/TAP.1986.1143830
42. Choi J, Song I, Kim HM. On estimating the direction of arrival when the number of signal sources is unknown. Signal Process. (1993) 34:193–205. doi: 10.1016/0165-1684(93)90162-4
43. Shebalin JV, Matthaeus WH, Montgomery D. Anisotropy in MHD turbulence due to a mean magnetic field. J Plasma Phys. (1983) 29:525–47. doi: 10.1017/S0022377800000933
44. Müller J, Simon S, Motschmann U, Schüle J, Glassmeier KH, Pringle GJ. A.I.K.E.F.: Adaptive hybrid model for space plasma simulations. Comp Phys Commun. (2011) 182:946–66. doi: 10.1016/j.cpc.2010.12.033
Keywords: wave vector anisotropy, axial asymmetry, plasma turbulence, ion kinetic scale, observations and numerical simulations
Citation: Narita Y, Comişel H and Motschmann U (2014) Spatial structure of ion-scale plasma turbulence. Front. Physics 2:13. doi: 10.3389/fphy.2014.00013
Received: 13 January 2014; Paper pending published: 30 January 2014;
Accepted: 14 February 2014; Published online: 05 March 2014.
Edited by:
Rudolf A. Treumann, Munich University, GermanyReviewed by:
Joachim Vogt, Jacobs University Bremen, GermanyEmiliya Yordanova, Swedish Institute of Space Physics, Sweden
Copyright © 2014 Narita, Comişel and Motschmann. This is an open-access article distributed under the terms of the Creative Commons Attribution License (CC BY). The use, distribution or reproduction in other forums is permitted, provided the original author(s) or licensor are credited and that the original publication in this journal is cited, in accordance with accepted academic practice. No use, distribution or reproduction is permitted which does not comply with these terms.
*Correspondence: Yasuhito Narita, Space Research Institute, Austrian Academy of Sciences, Schmiedlstr. 6, A-8042 Graz, Austria e-mail: yasuhito.narita@oeaw.ac.at