Electron energy probability function and L-p similarity in low pressure inductively coupled bounded plasma
- 1Waves and Beams Laboratory, Department of Physics, Indian Institute of Technology, Kanpur, Kanpur, India
- 2Space Plasma, Power and Propulsion Laboratory, Research School of Physics and Engineering, The Australian National University, Canberra, ACT, Australia
Particle-In-Cell (PIC) simulations are carried out to investigate the effect of discharge length (L) and pressure (p) on Electron Energy Probability Function (EEPF) in a low pressure radio frequency (rf) inductively coupled plasma (ICP) at 13.56 MHz. It is found that for both cases of varying L (0.1–0.5 m) and p (1–10 mTorr), the EEPF is a bi-Maxwellian with a step in the bounded direction (x) and non-Maxwellian with a hot tail in the symmetric unbounded directions (y, z). The plasma space potential decreases with increase in both L and p, the trapped electrons having energies in the range 0–20 eV. In a conventional discharge bounded in all directions, we infer that L and p are similarity parameters for low energy electrons trapped in the bulk plasma that have energies below the plasma space potential (eVp). The simulation results are consistent with a particle balance model.
Introduction
The form of electron energy probability function (EEPF) in low pressure radio frequency (RF) bounded plasma has been a subject of considerable interest [1–7]. Godyak et al. [8] looked at EEPF of inductively coupled plasma (ICP) in Argon over a wide range of pressure and power combinations. Meige and Boswell [9] looked at EEPF in an ICP to investigate the origin of the break energy at the plasma space potential. Bhattacharjee et al. [10] looked at the effect of excitation frequency. In this article we investigate the effect of varying the length and pressure of the discharge. Our aim is to see the effect of these important parameters on the EEPF, which dictates the overall discharge properties such as ionization and other rate constants.
The present research is based on an earlier work by Bhattacharjee et al. [10], where the effect of the excitation frequency on EEPF was investigated. Here we investigate the effect of the axial length (L) and the pressure (p) on EEPF of the same system, and show that any change in one of these parameters while keeping the other fixed, produces quantitatively close changes in the discharge parameters—implying that these two parameters are “self-similar” for low energy electrons.
The motivation further arises from the fact that, normally in most wave assisted plasma devices, the heating frequency is maintained constant (e.g., 13.56 MHz for rf discharges and 2.45 GHz in microwave discharges [11–13]), and two important parameters that may be varied are the system length (size) and the pressure, which can determine the dynamics of the particles (electrons and ions) present in the discharge. In many actual experiments, it may be inconvenient and quite cumbersome to vary the length of the system. In particular, it is desirable to know whether instead of varying the length of the discharge, is it possible to achieve nearly equivalent effect (such as in the nature of EEPF) by varying the pressure of the discharge? This would be quite helpful in applications such as plasma processing or plasma sources for ion beam extraction which require optimization of discharge conditions [14, 15] to achieve a certain profile of the EEPFs.
On another viewpoint, Paschen's law shows that the discharge length and pressure are critical parameters (actually the product pL) that determine the breakdown threshold of a gas in a dc discharge. Lisovskiy et al. [16] derived a similar law for RF discharges. The interplay between the parameters L and p is important to determine the breakdown threshold for RF discharges. Therefore, the effect of L and p on the discharge, particularly on the dynamics of the electrons is the subject of the research presented in this article. The RF heating frequency is kept fixed at 13.56 MHz and the length and pressure has been varied over a wide range i.e., 0.1–0.5 m and 1–10 mTorr, respectively.
The article is organized as follows. In section II, the PIC simulation scheme is presented. The simulation results from the PIC code are presented in section III. The simulation results are compared with an analytical model in section IV. Finally, the results are summarized and conclusions from the research drawn in section V.
Simulation Scheme
In the following, we discuss the PIC simulation scheme. The plasma is confined between two infinite parallel plates separated by a distance L along the spatial x direction, which is the discharge length. L is varied to investigate its effect on EEPF. Initially the neutral gas pressure is maintained at 1 mTorr, this is varied later to see its effects on EEPF. Argon has been used as the test gas. The simulation is based upon a well-known PIC scheme [17–20] with Monte Carlo Collisions [21]. The simulation is one dimension (1D) in space (x) and three dimensional (3D) in velocities (vx, vy, and vz). Accurate electron-neutral and ion-neutral collision cross sections are employed to ensure realistic simulations; data can be found in References Tachibana [22] and Pack et al. [23] for electron neutral collisions (elastic, exciting, and ionizing) and in Reference Phelps [24] for ion-neutral collisions (elastic and charge exchange). Coulomb collisions are not included in the present case as their effect would be negligible in the present low density condition.
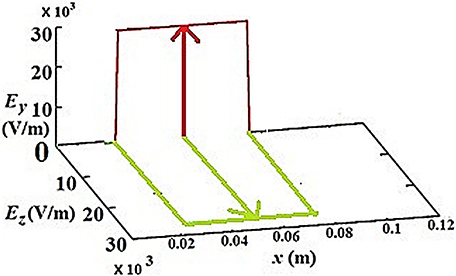
For the present investigation, the electrons are heated with a scheme intended to model “inductive” excitation similar to that described by Turner [25]. Here, the RF heating field is localized at the center of the discharge over a length 0.05 m for all situations of different L and p. The shape of the RF electric field along the x axis is a top hat and the amplitude is typically ~2.8 × 10⁴ V/m in each direction y and z, which corresponds to a heating current density of 5 A/m2. The RF electric field is applied in the y and z directions perpendicular to the spatial x direction where the boundaries are located. This allows us to heat the electrons both in y and z directions, momentum and energy being transferred to the other directions via electron-neutral collisions. The amplitude of the RF electric field is taken as uniform over the length of the heating region and localized within it. In the present investigation, the heating scheme is very much similar to the previous work by Bhattacharjee et al. [10]. The schematic of the heating field has been shown in Figure 1.
The simulation is allowed to run for several thousands of RF cycles in order for the system to reach equilibrium. The initial temperatures of the ions and electrons are taken as 0.026 eV (room temperature) and 3 eV, respectively. It is found that the typical time required to reach equilibrium is ~40 μs after the initiation of the discharge. Each simulation particle is a “macroparticle” representing 2 × 10⁸ actual particles. The number of cells along the x axis is 250 and the time step is ~1 × 10⁻¹⁰ s, which satisfies the stability and accuracy criteria for PIC scheme Δt ≪ 0.2/ωp and Δx ≪ λD where Δt and Δx are the temporal and spatial increments used in the simulation and ω p and λD are the plasma frequency and the Debye length respectively. The typical parameter values are plasma density ~2.5 × 10¹⁴ m−3, electron temperature Te ~ 5 eV, λD ~ 10−3 m, and ωp ~ 8.94 × 10⁸ rad/s.
The EEPFs are presented for three different velocity components vx, vy, and vz and obtained at the center of the discharge. The EEPFs are measured along the abscissa and ordinate is in natural log scale so that a Maxwellian distribution yields a straight line [26]. The electron energies have a resolution 2 × 10⁻³ eV and these have been acquired after the system is well deep into the equilibrium (typically 100 μs) and run for additional number of ~5 × 10⁵ time steps (~50 μs) and averaged. The system is finite in the x direction and infinite in y and z directions.
Results
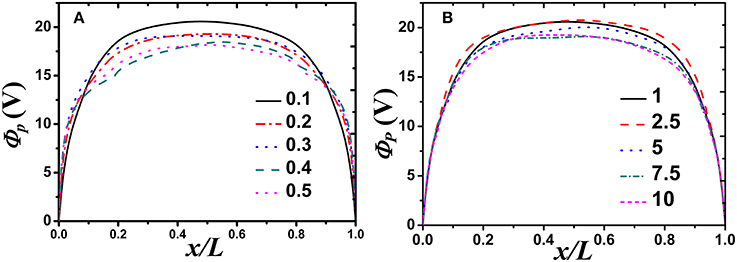
Keeping the heating frequency and the discharge pressure fixed at 13.56 MHz and 1 mTorr, respectively, the length of the one dimensional plasma system has been varied from 0.1 to 0.5 m. For varying pressure, the length of the system has been fixed at 0.1 m and the pressure varied in the range 1–10 mTorr. The plasma space potential ϕp has been first looked at for different L and p within the above range. Figures 2A,B represent ϕp under the above conditions.
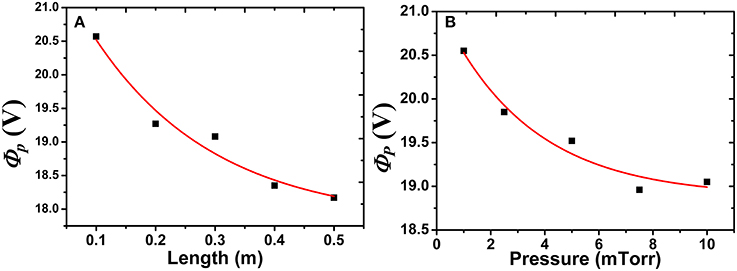
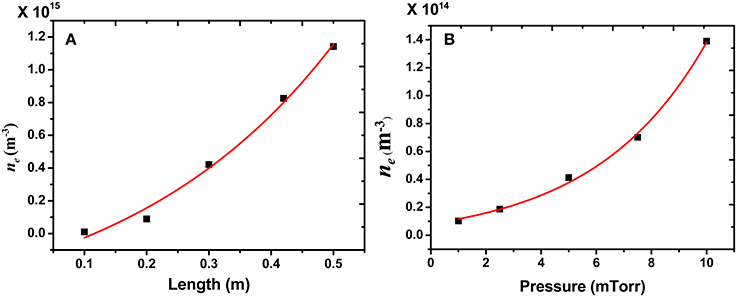
The formation of sheath near the boundaries can be clearly seen from the profile of ϕp (Figures 2A,B). The values of ϕp at the center (x/L = 0.5) have been plotted against L and p in Figures 3A,B, respectively.
We note a decreasing trend of ϕp at the center of the discharge with increase in both L and p.
Next we investigate the variation of EEPF in the x (bounded) direction at different L and p at the center of the discharge which are presented in Figure 4.
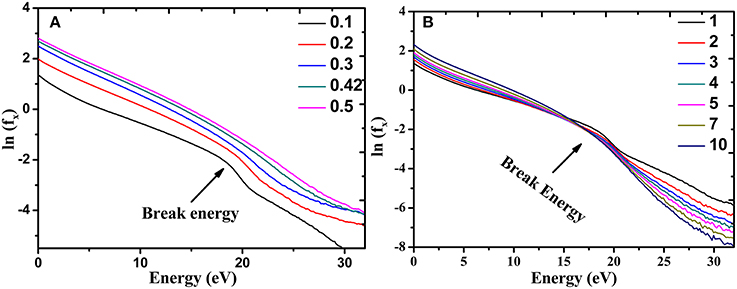
Figure 4. EEPF in x direction at the center for (A) different lengths (in m) (B) different pressure (in mTorr).
It is observed from Figure 4 that the typical structure of the EEPFs in the x direction is two Maxwellian with a step and this feature is common for all L and p [10]. The break energy tracks the value of ϕp at the center of the plasma [9]. The EEPFs comprise of low energy trapped electrons whose energies are below the break energy (i.e., below ϕp) and high energy escaping electrons whose energies are above the break energy (i.e., above ϕp). The break energy is shown by arrows in both the figures. With increase in L, the population of low energy trapped electrons as well as high energy escaping electrons increase (cf. Figure 4A). With increase in p, the population of low energy trapped electrons also increases as was observed with increasing length, but the population of the high energy escaping electrons decrease. This is expected, because increase in pressure increases the collisionality of the plasma and the high energy electrons lose energy by transferring energy to the neutral atoms. From the slope of the curves, the “temperature” of the two types of electron populations have been evaluated. It has been found that the “temperature” of the low energy trapped electrons is higher than the “temperature” of the escaping high energy electrons as plotted against L and p in Figure 5. This typical structure of the EEPF has also been reported in experiments by Godyak et al. [8].
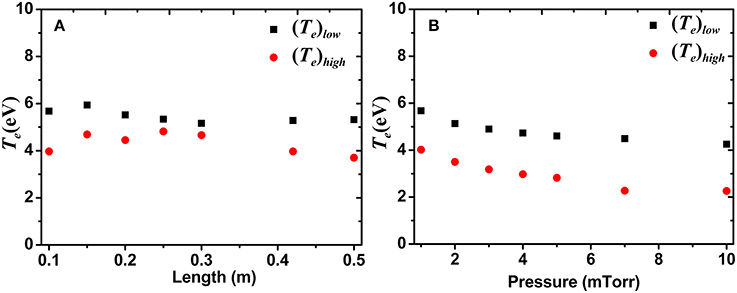
Figure 5. Variation of electron temperature of trapped and escaping electrons with (A) length, for constant 1 mTorr pressure and (B) pressure, for constant 0.1 m length.
The variation of Te of both trapped and escaping electrons in a magnetically expanding current free double layer (DL) plasma was also investigated by Takahashi et al. [27] The same structure of EEPF and the same behavior of Te has been reported in that article too (Figure 3 of reference 27).
Next we will discuss the variation of EEPF in y and z (unbounded, where there is no sheath) directions for different values of L. All the measurements have been taken at the center of the discharge.
We present a comparative study of EEPF's in y direction only (Figure 6) as it has the same shape as that of the z direction [10]. From Figure 6, it is observed that for all L and p under consideration, the nature of the EEPF is more linear (in the energy range 0–30 eV) compared to that of the EEPF in the x direction where the EEPFs are a two Maxwellian with a step. However, a tail region populated by high energy (“hot”) electrons (with energies above 30 eV) is observed which from now on will be referred to as a “hot tail.” The break energy is not as demarcated as in x direction.
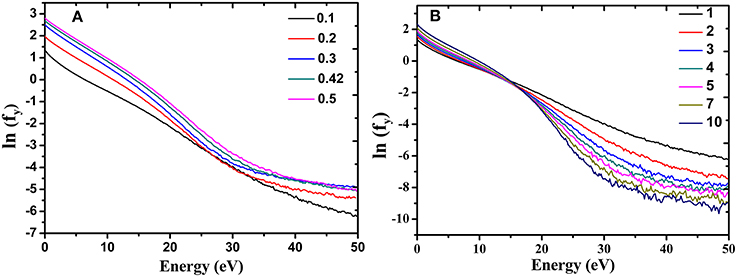
Figure 6. EEPF in y direction at the center for different (A) lengths (in m) and (B) pressure (in mTorr).
From Figure 6A, it can be observed that, with an increase in L, the population of both low energy bulk electrons and the high energy tail electrons increases indicating that the heating effect is greater at larger lengths. From Figure 6B, we observe that with increase in pressure p, the population of the low energy electrons increase in a similar manner with varying length, however, the hot tail diminishes with increase in pressure as was seen earlier for the case of EEPF in the x direction. The electron temperature in the two parts of the distribution (low energy electrons and the hot tail) has been found from the slope of the curve and is plotted in Figure 7.
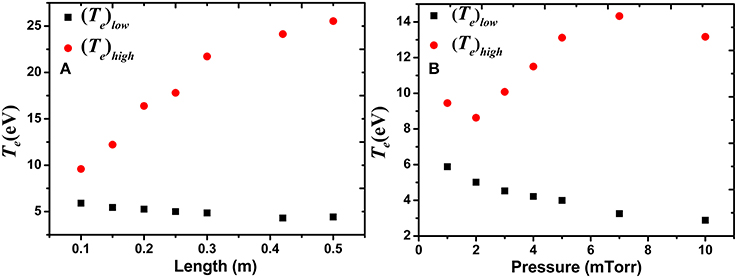
Figure 7. Variation of electron temperature of low and high energy electrons with (A) length, for constant 1 mTorr pressure and (B) pressure, for constant 0.1 m length.
We observe that with increase in L and p, the temperature of the high energy electrons in the tail region [labeled as (Te)high in Figure 7] increases quite rapidly. But the temperature of the low energy electrons [labeled as (Te)low in Figure 7] shows a slight decrease with increase in both L and p. (Te)high tends toward (Te)low at smaller lengths and pressure, indicating that the distribution becomes more and more Maxwellian with diminished hot tail at smaller L and p.
L-p Similarity: Comparison with an Analytic Model
The discharge parameters behave in equivalent manner with changes in L and p. ϕp is less for both higher length and pressure (Figures 1, 2). This is evident because with increase in both L and p, the temperature of high and low energy electrons decreases. The observed effects on the EEPFs for both varying L and p have been verified by writing the particle balance equation for cylindrical plasmas [28] for our one dimensional (1-D) plasma system. As there is no radial loss, we neglect the radial terms.
For our 1-D system, we equate the total surface particle loss to total volume ionization as follows:
where Kiz, ng, L, and uB are ionization rate constant, gas density, plasma length and Bohm velocity respectively. hL is the axial edge to center density ratio [28] with
where, λi = ion mean free path given by , σi is the ion-atom scattering cross section ~10−14 cm2 (for low energy ions, 0.026 eV). The ideal gas equation is:
where p is the neutral gas pressure, ng is the neutral gas density, T is the temperature of the gas taken to be 25°C or 298 K in the simulations.
Using this, cm, where p is in Torr.
From Equation (1) we obtain,
The Bohm velocity
Te is the electron temperature, M is the ionic mass: 39.948 a.u. for Argon. Equation (4) can be rewritten as,
where is the effective plasma size.
For ionization, Kiz(Te) = < σiz (v) v >v, where σiz is the ionization cross section. The average is done over the distribution found from the PIC simulations. Hence,
where f(v) is normalized as,
For ionization, we expand the Thomson cross section [σiz (v)] around the ionization threshold energy Eiz to obtain,
where σ0 = (e/4πϵ0Eiz)2 and . With e and m being the elctron charge and mass respectively.
Using the form of ionization cross section of Equation (9), Kiz has been evaluated from Equation (7) in terms of energy. For calculating uB from Equation (5), we have used the weighted average of the electron temperature Te of the two population (trapped and escaping) of electrons, found from the PIC EEPFs. After calculating Kiz and uB, the quantity ngdeff has been evaluated from Equation (6).
For analytical calculations, the variation with pressure of the neutral gas density ng has been found from the ideal gas equation (Equation 3). We can obtain deff from the equation, where hL can be found from Equation (2). For both varying L and p, we have calculated the product . The analytical value of ngdeff is plotted with the values obtained from the simulations (Equation 6) (calculated from Kiz and uB) against L and p in Figures 8A,B, respectively for varying L and p.
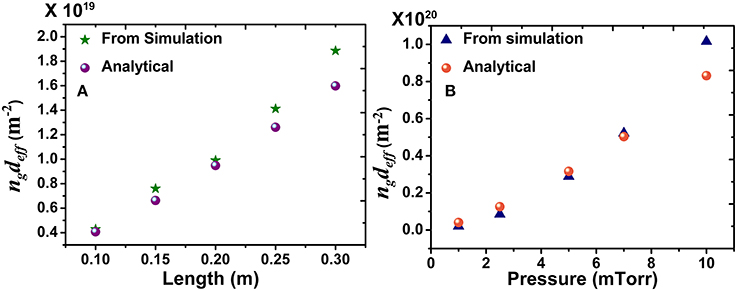
Figure 8. Comparison of the simulated results with the particle balance model with varying (A) length and (B) pressure.
It is therefore seen that the simulated and the analytical results are nearly the same for both varying L and p.
Figure 8 shows an agreement of the simulated results with a global analytical model. Equation (4), obtained from the particle balance Equation (1) may be further explored for combining data obtained at different L and p. We rewrite Equation (4) as follows:
where hL been taken from Equation (2) and ng from the ideal gas equation (Equation 3) and cm m.
We look at the behavior of the left hand side of Equation (10) with the product pL for different p's and L's under consideration. Figure 9 presents the behavior. In Figure 9, in Equation (10) has been plotted against where pLmax is the maximum value of pL for the either work conditions. The product pL is thus normalized to match the range of pL values for varying p and L.
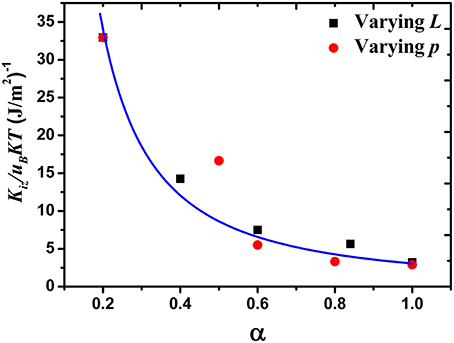
Figure 9. Variation of the left hand side of Equation (10) with α for different length (black squares) and different pressures (red circles).
From Figure 9, we note that the behavior of in Equation (10) follows the same trend with varying L and p. The data sets for varying p and varying L while keeping the other parameter fixed, have been indicated by red circles and black squares respectively in Figure 9. Thus, even if we have used the same sets of values of the product pL while varying L and p keeping other fixed, the absolute value of the quantity is different for the two data sets because it has been obtained from the simulated EEPFs that differs for the two data sets. But both the variations can be fitted with a single universal curve (shown by blue curve in Figure 9) obtained from the right hand side of Equation 10. Thus, it behaves in a qualitatively similar manner with the product pL.
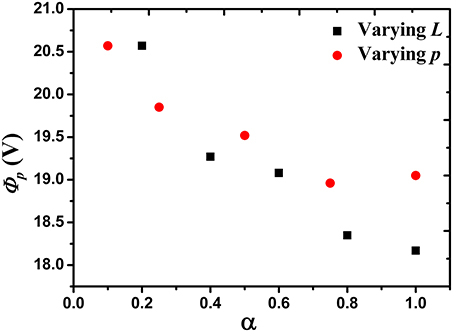
In the light of the above, we now look at the variation of the plasma parameters i.e., the space potential, and the electron temperature as a function of α (normalized pL).
Figure 10 shows such variation of ϕP.
We observe a qualitative agreement of the two variations as predicted by Equation 10 through Figure 9. Now we look at the variation of Te for both low energy electrons found from EEPF in x and y direction.
From Figure 11 we note that the temperatures of low energy electrons (found both from EEPF in the x and y direction) behave in a qualitatively similar manner with varying L and p. However, we recall our observations from Figures 4, 6 that with increasing L and p, the high energy part of the EEPFs (population of high energy escaping electrons in EEPFx and the hot tail in EEPFy) do not behave in a similar manner. So by observation, we can say that the parameters p and L are approximately similarity parameters for the low energy electrons trapped in between the sheaths.
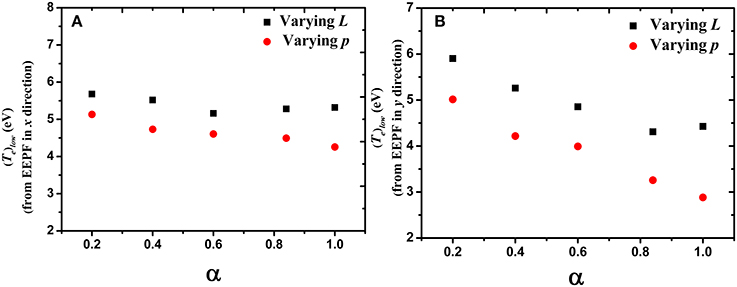
Figure 11. Variation of temperature of low energy trapped electrons found from (A) EEPFx and (B) EEPFy as a function of α with varying length and pressure.
Finally, we have looked at the plasma electron density obtained by integrating the EEPFs over all velocities or energies. Figure 12 shows the results.
Both the results follow the same trend and is consistent with the behavior of electron temperature.
The similarity in the variation of Te with both L and p essentially arises from the collisionality of the electrons with the neutral particles.
The changes in the electron temperature with L and p, determine the modification of the electron energy distributions with L and p as presented in the manuscript. It is seen directly from Figures 5, 11, and indirectly from Figures 9, 10 that the electron temperature increases as the system gets shortened or the pressure is decreased. This can be explained by the ratio of mean free path to the system length (λ /L: λ being the mean free path and L be the system length). λ is inversely proportional to ng, the neutral gas density. From the ideal gas equation (Equation 3), we see that for a system with lower pressure, ng is lower and this implies a larger λ. So with decrease in pressure, λ approaches the system length L and the ratio λ /L approaches one. This decreases the probability of collisions, and the electrons suffer less number of collisions and less energy loss happens. Therefore, the electron temperature is higher at a lower pressure. In a similar manner, if the pressure is kept fixed and the system is shortened, λ approaches L, and similarly, the electrons suffer fewer collisions leading to lesser loss of energy. A consequence of this is rise in electron temperature. This further confirms the role of similarity of the two parameters L and p. In summary in both cases, the ratio λ /L changes in a similar manner and thus changes the electron temperature which causes modification in the EEPFs.
The shape of the distributions in the two directions [bounded: x, and unbounded: y (or z)] may be understood as follows. The results indicate that for different L and p under consideration, the EEPFs in the x direction has a shape of a bi-Maxwellian with a step and that in the y (or z) direction it is a non-Maxwellian with a hot tail. The sheaths are formed only in the x direction. So, along the x direction, the EEPFs comprise primarily of two parts: the first part corresponds to electrons having energies less than the plasma potential which remains trapped in the bulk plasma. And the second part consists of electrons having energies higher than ϕp, most of which escapes. As the EEPFs have been obtained at the center of the discharge, the population of the electrons corresponding to the second part are quite small compared to the trapped ones of the first part. In the y and z directions, the system is unbounded. No sheaths are formed and therefore ϕp has no role in electron trapping and no break energy is observed. Therefore, the nature of the distribution changes.
Summary and Conclusions
We summarize the results obtained from the PIC simulations as follows.
With Varying Length
The EEPFs in the x direction is a bi-Maxwellian with a step for all lengths and the EEPFs in y direction are more linear with a hot tail, which becomes more prominent with increasing length. The shape of the EEPFs in the unbounded y and z directions are the same. For EEPF in the y direction the temperature of the high energy tail electrons increases rapidly with length whereas the temperature of the cold electrons decreases slightly. The behavior of the low energy trapped electrons in the x direction and the low energy electrons in the y direction have been analyzed with a particle balance model and the overall trend seems to match rather well.
With Varying Pressure
The EEPFs in the x direction is a bi-Maxwellian with a step. The EEPFs in the y direction are more linear with a hot tail. However, the hot tail diminishes as the pressure is increased. The temperature of the low energy trapped electrons decreases slightly with increase in pressure. This has been analyzed with the same particle balance model and an agreement is seen.
The electron temperature of the low energy trapped electrons behaves in a qualitatively similar manner with varying L and p, however, this agreement is not so pronounced for high energy escaping electrons.
The results indicate that the low energy electrons that are trapped in between the sheaths, behave in the same manner with varying discharge length and pressure. Both effects obey the same particle balance model of a 1-dimensional plasma. Since a normal discharge will be bounded in all sides we can safely conclude that L and p are similarity parameters for all the low energy electrons trapped in between the sheaths. In the analytical model, we represent the discharge L and p in terms of effective length (deff) and neutral density (ng) and we have shown that the product is an important parameter in determining the dynamics of the discharge. In other words, the behavior of the EEPFs of different systems will be the same as long as the product ngdeff remains intact.
The similarity between the discharge length (L) and pressure (p) is of fundamental importance. It will be helpful for research and applications in plasma physics as mentioned in the introduction section.
Conflict of Interest Statement
The authors declare that the research was conducted in the absence of any commercial or financial relationships that could be construed as a potential conflict of interest.
Acknowledgments
SC is grateful to Debapasad Sahu and Shail Pandey, senior research scholars, waves and beams laboratory, IIT Kanpur, for valuable discussions. We thank the staff of Computer Centre, IIT Kanpur for their kind help which could make this work possible. In this work, we have used a modified version of the PHOENIX 1D code developed by T. Lafleur. We acknowledge fruitful discussions with T. Lafleur and A. Meige.
References
1. Singh H, Coburn JW, Graves DB. Measurements of neutral and ion composition, neutral temperature, and electron energy distribution function in a CF4 inductively coupled plasma. J Vac Sci Technol A (2001) 19:718. doi: 10.1116/1.1354603
2. Hopwood J, Reinhard DK, Asmussen J. Charged particle densities and energy distributions in a multipolar electron cyclotron resonant plasma etching source. J Vac Sci Technol A (1990) 8:3103. doi: 10.1116/1.576592
3. Malyshev MV, Donnelly VM. Diagnostics of chlorine inductively coupled plasmas. Measurement of electron temperatures and electron energy distribution functions. J Appl Phys. (2000) 87:1642. doi: 10.1063/1.372072
4. Takahashi K, Charles C, Boswell RW, Kaneko T, Hatakeyama R. Measurement of the energy distribution of trapped and free electrons in a current-free double layer. Phys Plasmas (2007) 14:114503. doi: 10.1063/1.2803763
5. Takahashi K, Charles C, Boswell R, Hatakeyama R. Radial characterization of the electron energy distribution in a helicon source terminated by a double layer. Phys Plasmas (2008) 15:074505. doi: 10.1063/1.2959137
6. Takahashi K, Charles C, Boswell R, Cox W, Hatakeyama R. Transport of energetic electrons in a magnetically expanding helicon double layer plasma. Appl Phys Lett. (2009) 94:191503. doi: 10.1063/1.3136721
7. Baalrud SD, Lafleur T, Boswell RW, Charles C. Particle-in-cell simulations of a current-free double layer. Phys Plasmas (2011) 18:063502. doi: 10.1063/1.3594565
8. Godyak VA, Piejak RB, Alexandrovich BM. Electron energy distribution function measurements and plasma parameters in inductively coupled argon plasma. Plasma Sources Sci Technol. (2002) 11:525. doi: 10.1088/0963-0252/11/4/320
9. Meige A, Boswell RW. Electron energy distribution functions in low-pressure inductively coupled bounded plasmas. Phys Plasmas (2006) 13:092104. doi: 10.1063/1.2339024
10. Bhattacharjee S, Lafleur T, Charles C, Boswell R. Investigation of effect of excitation frequency on electron energy distribution functions in low pressure radio frequency bounded plasmas. Phys Plasmas (2011) 18:072102. doi: 10.1063/1.3605021
11. Dey I, Bhattacharjee S. Anisotropy induced wave birefringence in bounded supercritical plasma confined in a multicusp magnetic field. Appl Phys Lett. (2011) 98:151501. doi: 10.1063/1.3577610
12. Dey I, Bhattacharjee S. Penetration and screening of perpendicularly launched electromagnetic waves through bounded supercritical plasma confined in multicusp magnetic field. Phys Plasmas (2011) 18:022101. doi: 10.1063/1.3551696
13. Dey I, Bhattacharjee S. Experimental investigation of standing wave interactions with a magnetized plasma in a minimum-B field. Phys Plasmas (2008) 15:123502. doi: 10.1063/1.3033752
14. Mathew JV, Chowdhury A, Bhattacharjee S. Subcutoff microwave driven plasma ion sources for multielemental focused ion beam systems. Rev Sci Instrum. (2008) 79:63504. doi: 10.1063/1.2943341
Pubmed Abstract | Pubmed Full Text | CrossRef Full Text | Google Scholar
15. Chowdhury A, Bhattacharjee S. Micron-focused ion beamlets. J Appl Phys. (2010) 107:093307. doi: 10.1063/1.3371688
16. Lisovskiy V, Booth J-P, Landry K, Douai D, Cassagne V, Yegorenkov V. Similarity law for rf breakdown. EPL (2008) 82:15001. doi: 10.1209/0295-5075/82/15001
17. Birdsall CK, Fuss D. Clouds-in-clouds, clouds-in-cells physics for many-body plasma simulation. J Comput Phys. (1969) 3:494. doi: 10.1016/0021-9991(69)90058-8
18. Langdon AB, Birdsall CK. Theory of plasma simulation using finite−size particles. Phys Fluids (1970) 13:2115. doi: 10.1063/1.1693209
21. Vahedi V, Surendra M. A Monte Carlo collision model for the particle-in-cell methods: applications to Argon and Oxygen discharges. Comput Phys Commun. (1990) 87:179. doi: 10.1016/0010-4655(94)00171-W
22. Tachibana K. Excitation of the ls5, ls4, 1s3, and 1s2 levels of argon by low-energy electrons. Phys Rev A (1986) 34:1007.
23. Pack JL, Voshall RE, Phelps AV, Kline LE. Longitudinal electron diffusion coefficients in gases: noble gases. J Appl Phys. (1992) 71:5363. doi: 10.1063/1.350555
24. Phelps AV. The application of scattering cross sections to ion flux models in discharge sheaths. J Appl Phys. (1994) 76:747. doi: 10.1063/1.357820
25. Turner MM. Collisionless electron heating in an inductively coupled discharge. Phys Rev Lett. (1993) 71:1844.
26. Seo S-H, In J-H, Chang H-Y. Effects of a sheath boundary on electron energy distribution in Ar/He dc magnetron discharges. J Appl Phys. (2004) 96:57. doi: 10.1063/1.1755850
Keywords: particle-in-cell (PIC) simulations, electron energy probability function (EEPF), inductively coupled plasma (ICP), Maxwellian distribution, particle balance, L-p similarity
Citation: Chatterjee S, Bhattacharjee S, Charles C and Boswell R (2015) Electron energy probability function and L-p similarity in low pressure inductively coupled bounded plasma. Front. Phys. 3:7. doi: 10.3389/fphy.2015.00007
Received: 16 October 2014; Accepted: 06 February 2015;
Published online: 24 February 2015.
Edited by:
Ashild Fredriksen, The Arctic University of Norway/University of Tromso, NorwayReviewed by:
Dmytro Sydorenko, University of Alberta, CanadaLuís L. Alves, Instituto de Plasmas e Fusão Nuclear/Instituto Superior Técnico, Portugal
Copyright © 2015 Chatterjee, Bhattacharjee, Charles and Boswell. This is an open-access article distributed under the terms of the Creative Commons Attribution License (CC BY). The use, distribution or reproduction in other forums is permitted, provided the original author(s) or licensor are credited and that the original publication in this journal is cited, in accordance with accepted academic practice. No use, distribution or reproduction is permitted which does not comply with these terms.
*Correspondence: Sudeep Bhattacharjee, Waves and Beams Laboratory, Department of Physics, Indian Institute of Technology Kanpur, Grand Trunk Road, Kalyanpur, Kanpur 208016, UP, India e-mail: sudeepb@iitk.ac.in
 Sanghamitro Chatterjee
 Sudeep Bhattacharjee
 Christine Charles
 Rod Boswell