Micro-focused Brillouin light scattering: imaging spin waves at the nanoscale
 Thomas Sebastian1*
  Björn Obry
- 1Institute of Ion Beam Physics and Materials Research, Helmholtz-Zentrum Dresden - Rossendorf, Dresden, Germany
- 2Fachbereich Physik und Forschungszentrum OPTIMAS, Technische Universität Kaiserslautern, Kaiserslautern, Germany
Spin waves are the elementary excitations of the spin system in a magnetically ordered material state and magnons are their quasi particles. In the following article, we will discuss Brillouin light scattering (BLS) spectroscopy which is now a well-established tool for the characterization of spin waves. BLS is the inelastic scattering of light from spin waves and confers several benefits: the ability to map the spin-wave intensity with spatial resolution and high sensitivity as well as the potential for the simultaneous detection of frequency and wave vector. For several decades, the field of spin waves gained huge interest by the scientific community due to its relevance regarding fundamental issues in spin dynamics. Recently, the ongoing research in the field of magnonics has put particular emphasis on the high potential of spin waves regarding information technology. Opposed to charge-based schemes in conventional electronics and spintronics, magnons are charge-free currents of angular momentum, and, therefore, less subject to dissipative scattering processes. These ideas have propelled the quest for concepts to guide and manipulate spin-wave transport as well as for the miniaturization of spin-wave conduits towards sub-micrometer dimensions. For the further development of potential spin-wave-based devices, the ability to directly observe spin-wave propagation with spatial resolution is crucial. As an optical technique, BLS allows for a sub-micron space resolution by the implementation of a microscope objective in the optical setup. Over the last decade, this micro-focus BLS technique has become an established method for the investigation of spin waves in microstructured magnetic elements and proved its value in particular regarding magnonics. In this article, we will discuss the basic principles of BLS and illustrate the experimental optical setup. Particular emphasis will be put on the implementation of the high spatial resolution of BLS microscopes as well as on their computer based operation and automated sample positioning. Owing to these improvements in ease of use as well as experimental applicability, the BLS technique has maintained its relevance for investigations on spin waves in miniaturized magnetic structures as will be illustrated by a selection of experiments.
1. Introduction
This article is devoted to the imaging of spin waves at the nanoscale via Brillouin light scattering (BLS) spectroscopy with emphasis on the development of a BLS microscope. Thus, a major part of this article is used to introduce the physical background of the BLS process and the experimental realization of a BLS microscope providing the most relevant technical data. We also discuss several additional developments such as time- and phase-resolved BLS microscopy. These developments in BLS spectroscopy are based on earlier achievements in the field reported by B. Hillebrands in [1]. In order to illustrate the performance of the experimental setup, several recent studies on spin dynamics at the nanoscale will be discussed.
A major motivation that drives the further development of BLS microscopy is the field of magnonics [2–7]. The idea behind magnonics is the realization of an alternative spin-wave based information technology. This goal and the potential for future devices immediately demands a thorough understanding of spin-wave propagation in magnetic nanostructures and schemes to manipulate and control the propagation characteristics in magnonic waveguides. For this purpose, space-resolved techniques with a resolution better than a micrometer are a crucial necessity. As will be discussed in this introductory section—also in comparison to competing techniques—there are several reasons why nowadays BLS microscopy is a standard technique for the observation of spin-wave transport on the nanoscale.
Starting in the 1950s, the field of magnetization dynamics has been subject to intense research efforts. Following the observation of the ferromagnetic resonance (FMR) by electrical detection [8, 9], a variety of detection methods for spin waves have been developed and optimized, thereby manifesting the importance of spin-wave research. Starting with microwave absorption measurements [9–11], spin-wave research soon extended to optical detection methods based on Brillouin light scattering [12–15] and the magneto-optical Kerr effect [16–18] as well as inelastic scattering with neutrons [19, 20], and electrons [21]. Furthermore, thermography [22] and magneto-mechanical systems [23–25] are possible detection schemes. Owing to current achievements in the field of spintronics, an electrical detection of spin waves utilizing a combination of spin pumping and the inverse spin Hall effect has also been reported [26–33].
One general advantage of BLS over all competing techniques is its remarkable sensitivity which, in particular, allows for the detection of thermally activated, incoherent spin waves in systems without external excitation even down to monolayers of magnetic material [14, 34–36]. This independence of the BLS technique from antenna structures for the external excitation enables the flexible realization of different measurement geometries to probe spin dynamics in a wide wave-vector as well as spectral range.
Opposite to microwave absorption experiments as well as a detection based on spin pumping and the inverse spin Hall effect, that are restricted to a local study of spin waves at the position of antenna structures, BLS spectroscopy allows for a space- and wave-vector-resolved mapping of the spin-wave intensity in magnetic structures. Recent developments regarding microwave cavities and microresonators pushed the field of microwave absorption techniques toward the detection of spin dynamics in individual nanoscale magnetic structures [37]. However, in all cases the dynamic magnetic response is averaged over the entire investigated structure or even arrays of magnetic elements. Thus, electrical detection techniques do not allow for the direct observation of spin-wave propagation or a space-resolved mapping of the intensity distributions of standing spin-wave modes. Therefore, this lack of space-resolution hinders a direct identification of the character of the detected spin waves and their propagation characteristics. In addition, typical measurements based on resonators or broadband FMR are also limited regarding the simultaneous detection of different spin-wave frequencies. This is of particular interest in the field of nonlinear spin dynamics where, e.g., the occurrence of higher harmonics cannot be directly detected. Most experimental efforts utilizing the combination of spin pumping and inverse spin Hall effect for the detection of spin dynamics typically rely on the dc spin Hall voltage and, thus, even lack any frequency information. Therefore, an additional advantage of BLS in comparison to the widely used electrical detection techniques is the simultaneous detection of various frequencies in a wide frequency range.
Regarding alternative space-resolved detection schemes based on magneto-optical techniques, a major advantage of BLS is the frequency range offered by its detection via interferometry. While the mentioned alternative techniques work in the time domain—which restricts the available frequency range for technical reasons—BLS directly operates in the frequency domain and is restricted only by the used interferometer which enables the detection of frequencies even up to hundreds of gigahertz. In addition, the frequency analysis of the investigated spin-wave modes requires post-processing in the case of time-resolved measurement techniques which hinders the reliable characterization of weak spin-wave signals. Here, it is worth mentioning again, that BLS not only offers a direct detection of the spin-wave frequency but also a superior sensitivity for the detection of weak signals based on the counting of single photons.
With respect to techniques that require large-scale facilities like electron or neutron scattering with superior space resolution, BLS spectroscopy and even microscopy can be set up and used in a typical laboratory environment. This ensures maximum versatility regarding the combination with external devices for the control of experimental parameters or regarding the demands in sample preparation.
This great versatility of the BLS technique is a result of the ongoing development regarding the automated control of the interferometer as well as of the measurement process itself. Due to this efforts—which started already several years ago—BLS spectrometers based on the tandem Fabry-Pérot interferometer (TFPI) developed by J. R. Sandercock1 can be operated by any researcher after a short training in the operation. To realize the aim of an easy to use, automated BLS setup, the following tasks can be identified:
1. Automatic alignment of the interferometer before measurements.
2. Automatic stabilization of the interferometer during measurements.
3. Automated control of peripheral devices.
4. Data acquisition for complex measurement sequences.
The systematic realization and implementation of these tasks started with the development of the software package Tandem Fabry-Pérot Data Acquisition System (TFPDAS) [1] in 1999. This software package and the corresponding data acquisition hardware is constantly updated2. In particular, the recent versions of TFPDAS not only allows for space-, phase- and wave-vector-resolved BLS spectroscopy but also enables the time-resolved mapping of the spin-wave intensity.
The flexibility offered by the software solution TFPDAS—in particular, regarding the control of peripheral devices and the data acquisition—is a major achievement for the BLS technique which enables the automated execution of rather complex sequences of measurements. The automated control of experimental parameters— like magnetic field or the frequency and power of external microwave signals—as well as the automated control and stabilization of the probing position via peripheral devices enables a thorough study of various aspects of spin-wave propagation in a wide parameter space. The four points of the above list will be picked up in the following sections to illustrate the corresponding implementations and capabilities offered by TFPDAS.
The outline of the article is as follows. Section 2 provides a brief introduction into the physics of spin waves needed for the discussion of both the BLS process as well as the presented studies. The physical background of the BLS process as well as the experimental realization of energy and momentum analysis in BLS spectroscopy will be discussed in Section 3. Section 4 describes the implementation of a microscopic resolution as well as its consequences for BLS microscopy. In addition, the concept of phase-resolved BLS microscopy will be introduced. Finally, the performance of a BLS microscope will be illustrated on the basis of several recent studies on spin dynamics at the nanoscale. The extension of BLS spectroscopy and microscopy by time resolution will be discussed and illustrated in Section 5.
2. Spin Waves
Before we discuss the experimental technique of BLS, we give a brief introduction into the physics of spin waves, the subject of our research. This section will also serve to specify the experimental requirements for the observation of spin dynamics in general as well as the requirements for the further developments of concepts proposed in the field of magnonics. However, since spin waves have been discussed very thoroughly over the past decades, we will focus on the basics and refer to the literature for more details on this subject [6, 38–42].
Spin waves are the collective oscillations of the spin system in a magnetically ordered material. In a classical picture, spin waves are considered as the phase propagation of the precessing magnetic moments. The mutual coupling of the single magnetic moments is mediated by dipolar and exchange interaction. In a quantum mechanical picture, a magnon represents the quasi-particle of an elementary spin-wave excitation in a magnet. This particle description yields the important result that a magnon carries spin angular momentum. For this reason, the transport of magnons, i.e., the propagation of spin waves can be understood as a spin current without involving any charge currents and, thus, information can be encoded via the electron spin without the flow of charge.
Spin-wave frequencies are typically observed in the gigahertz range but can also reach the terahertz regime. Their wavelengths range from the millimeter down to the nanometer length scale. This scalability of spin waves immediately illustrates their potential regarding future technical applications. Their frequency range ensures compatibility to contemporary devices—gigahertz in, e.g., telecommunication—as well as opens the perspective for higher clock speed. At the same time, their dispersion allows for a rapid downscaling of the typical device size to the nanometer scale when approaching the high-frequency region.
Of particular interest regarding basic physics as well as the realization of potential magnonic devices is the characteristic dispersion relation of spin waves. Due to the dipolar interaction, this dispersion is anisotropic in in-plane magnetized structures with respect to the angle between the static magnetization and the wave vector of the corresponding spin-wave mode. To study the peculiarity of the spin-wave dispersion requires frequency and wave-vector resolution as well as a sensitivity allowing for the detection of thermally activated spin waves—requirements that are fulfilled by BLS spectroscopy [43–45]. The anisotropy of the spin-wave dispersion has far reaching consequences regarding spin-wave transport in two dimensions. One consequence is the preferred propagation direction in the spin system that can be used to actively steer spin-waves in two-dimensional systems [46, 47]. In addition, the anisotropy can lead to the formation of non-diffractive spin-wave beams with a well-defined propagation direction, so-called spin-wave caustics [48–51]. These phenomena are not only interesting from the fundamental point of view but also of major relevance regarding future spin-wave based devices. For the observation and a thorough understanding of these effects space resolution—offered, e.g., by BLS spectroscopy and, in particular, BLS microscopy—is crucial.
A derivation of the spin-wave dispersion in multilayered structures including both, dipolar and exchange interaction, can be found in [52]. Based on this model, the full dispersion can be calculated numerically. However, in many cases, it is sufficient to use an approximative analytical dispersion relation for spin waves in thin magnetic films derived by Kalinikos and Slavin [53]. This model with the additional introduction of boundary conditions due to the finite lateral sample dimensions proved to be very successful for the qualitative as well as quantitative description of experimental findings. Figure 1 shows the calculated spin-wave dispersion in a magnetic thin film. The dispersion surface depending on the wave-vector components parallel k|| and perpendicular k⊥ to the magnetization M clearly illustrates the anisotropic character, see Figure 1A. The extreme cases k|| and k⊥ are displayed in Figure 1B. The high group velocity—given by the slope of the corresponding dispersion—and, thus, the small spatial decay for spin waves with k⊥ defines the preferred propagation direction. In fact, most studies on spin-wave propagation in microstructures, therefore, use the k ⊥ M geometry.
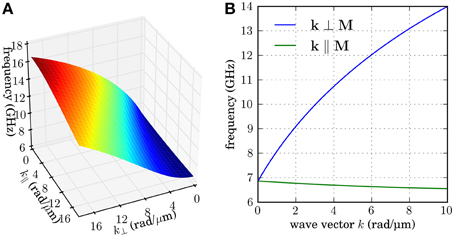
Figure 1. (A) Two-dimensional, anisotropic dispersion surface for an in-plane magnetized magnetic thin film depending on the wave-vector components parallel k|| and perpendicular k⊥ to the static magnetization based on the analytical model by Kalinikos and Slavin [53]. (B) The comparison of the dispersion lines for k|| and k⊥ puts emphasis on the different character of the corresponding spin-wave modes. In particular, the group velocities defined by the slope of the dispersion lines and, thus, the spatial decay of these two spin-wave modes strongly differ leading to a preferred propagation direction with k ⊥ M.
It should be noted that the model by Kalinikos and Slavin is restricted to small spin-wave amplitudes and, thus, to the linear response of the dynamic magnetization m. However, the spin system is an intrinsically nonlinear system and various nonlinear phenomena can be observed for high spin-wave amplitudes. In fact, it is no problem to reach this nonlinear regime by the external excitation of spin waves even for moderate powers that are easily available by conventional microwave signal generators [51, 54–60]. Thus, the spin-wave system is a great model system to probe nonlinear wave physics. Among the numerous nonlinear effects, prominent examples are the formation of self-localized bullet modes or solitons and the nonlinear generation of higher harmonics. As will be discussed in more detail later in this article, nonlinear effects can have a huge impact on the propagation characteristics of spin waves. Therefore, only space-resolved techniques allow for a thorough understanding of these phenomena. The simultaneous occurrence of directly and nonlinearly excited spin-wave modes—like higher harmonics—requires the simultaneous detection of different frequencies. Electrical detection techniques—like FMR using cavities or network analyzers—are, therefore, limited in the observation of nonlinear phenomena. Space-resolved BLS is not only capable of mapping the propagation characteristics of linear and nonlinear spin-wave modes but also of the simultaneous detection of frequencies in a wide spectral range. Thus, BLS is a great tool, in particular, regarding the study of nonlinear spin-wave phenomena.
3. Brillouin Light Scattering Spectroscopy
This Section is devoted to the introduction of the basic physics behind the BLS process itself (Section 3.1) as well as the experimental realization of frequency and wave-vector resolution in a BLS spectroscope (see Sections 3.2, 3.3).
3.1. BLS Process
The BLS process can be understood as the inelastic scattering of laser light from the space- and time-dependent potential described by the dielectric tensor of a solid state body. In the case of a nonmagnetic material acoustic waves are responsible for the temporal as well as spatial variation of the dielectricity whereas it can be also caused by spin waves in a magnetic solid state via magneto-optic interaction. A detailed discussion of this quasi-classical description of magneto-optics in general and regarding BLS in particular can be found in Fleury et al. [12], Demokritov et al. [61], Shen and Bloembergen [62], Wettling and Sandercock [63], Cochran and Dutcher [64].
In a quantum mechanical picture, where the light quanta are represented by photons and where a magnon denotes the quasi-particle of a spin-wave excitation, the BLS process can be described by the inelastic scattering of photons with magnons. A scheme of this scattering process is depicted in Figure 2, where a magnon is created (Stokes process). Correspondingly, the annihilation of a magnon upon scattering with a photon is denoted as Anti-Stokes process. Since in both cases energy and momentum are conserved, the scattered light (out) carries information about the probed spin wave (sw). This is described by
where (in) denotes the incident light and where the negative sign on the right hand side of both equations represents a Stokes process. Thus, the analysis of the frequency shift |νout − νin| of the scattered photon yields information about the spin-wave frequency while the momentum of the detected spin wave can be determined from the experimental settings, i.e., the incidence and detection angle of the light, as will be explained in more detail below.
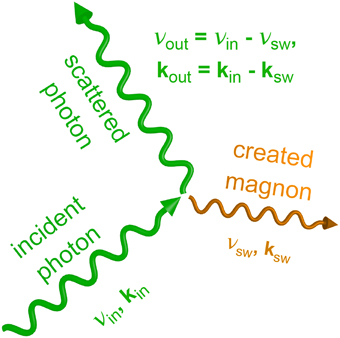
Figure 2. Sketch of the BLS process. The incident light with wave vector kin and frequency νin generates a spin wave (ksw, νsw) in the Stokes process. Energy and momentum conservation lead to a reduced wave vector kout and a smaller frequency νout of the scattered light.
In addition to the energy and momentum of the spin wave, the BLS process yields further information about the investigated spin-wave modes that have direct consequences for the experimental realization of BLS setups. The intensity of the scattered light is proportional to the intensity of the corresponding spin wave. Moreover, emphasis has to be put on the fact, that BLS is a phase-sensitive process. Thus, the scattered photon does not only carry information about the spin-wave energy and momentum but also its phase information. This will be of particular importance regarding the phase- and wave-vector resolution in BLS microscopy that will be discussed in Section 4.4.
Furthermore, BLS of photons and magnons affects the polarization of the inelastically scattered photons: the polarization of photons is rotated by 90° in the BLS process with magnons. As will be described in Section 4.1, this polarization dependence can be used to separate undesirable signals like longitudinal laser modes or photons that scattered inelastically from phonons from the actual spin-wave signal.
After this brief introduction to the BLS process, the following two subsections are devoted to the frequency- and wave-vector analysis of the spin-wave signal based on Equations (1) and (2). For a more detailed description of BLS, we refer the reader to the literature cited in the beginning of this section.
3.2. Energy Analysis
The energy analysis of the spin-wave signal is the basis for all measurements that rely on BLS. Because of the energy conservation in the BLS process—as described by Equation (1) in the previous subsection—the frequency shift of the scattered light directly corresponds to the frequency of the investigated spin-wave modes. Therefore, the analysis of the scattered light allows to measure the spin-wave energies. Thus, two components are indispensable for building a BLS spectroscope: a monochromatic light source and a high-contrast frequency analysis tool, both of which will be discussed in more detail below.
The light that undergoes the inelastic scattering is provided by a continuous-wave laser. Diode-pumped solid state lasers with a wavelength of 532 nm are commonly used. In general, the intensity of the BLS signal is directly proportional to the applied laser power. However, especially in BLS microscopy the maximum laser power is limited. Due to the focusing of the laser light down to a sub-micrometer spot size, the local heating of the sample surface can affect the investigated magnetization dynamics, e.g., via a reduction of the saturation magnetization, or even lead to a destruction of the magnetic structures if the thermal conductivity of the sample is low. Typically, lasers with an output power up to 200 mW are sufficient for a micro-focus BLS setup even though the laser power is drastically reduced on the way toward the sample, in particular, by the beam splitters in the light path. In fact, the threshold for damaging the sample by the diffraction limited laser spot is on the order of 10 mW.
A key specification for a potential laser is its ability for single-frequency operation accompanied by a narrow spectral linewidth below 10 MHz. These two aspects are a consequence of the small frequency shift of the scattered light and are not easy to meet. Usually, higher order longitudinal modes of the laser resonator are not sufficiently suppressed. They appear as additional signals in the measured spectrum and might not be mistaken for signals originating from spin waves. There are measures in the optical setup how the appearance of higher order laser modes in the BLS spectrum can be subdued, which will be described in Section 4.1.
The second major component for performing a BLS experiment is the frequency analysis tool. Typically, spin-wave frequencies are in the range of a few Gigahertz. This requires a spectrometer with a resolution of better than 0.05 cm−1 and makes the frequency analysis a challenging task compared to other spectroscopic techniques. In addition, the small scattering cross-section of the BLS process leads to a weak signal intensity compared to the fraction of light that is elastically scattered from the sample surface. For several decades high-contrast tandem Fabry-Pérot interferometers (TFPI) have been installed and used to analyze weak light signals generated by the inelastic scattering of photons with phonons as well as spin waves. The TFPI is nowadays the standard tool for the detection of BLS spectra because of its outstanding performance in terms of its high contrast and dynamic spectral range. A sketch of a TFPI can be found in Figure 3A.
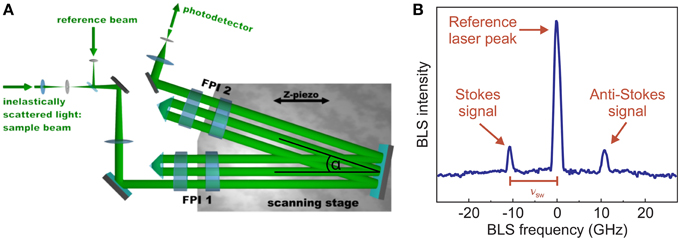
Figure 3. (A) Principle scheme of a tandem Fabry-Pérot interferometer. (B) BLS spectrum showing the central reference laser peak as well as the Stokes and Anti-Stokes signal.
The TFPI was developed by J. R. Sandercock and consists of a set of two Fabry-Pérot interferometers (FPI)—i.e., etalons consisting of two highly reflective, parallel mirrors—as schematically depicted by FPI 1 and FPI 2 in Figure 3A, respectively. Light is transmitted through an etalon only if the mirror spacing is a multiple of half its wavelength λ, whereas transmission is strongly suppressed for other mirror spacings. This also means that the transmission of a FPI, which can be described by the Airy function, is periodic with respect to the mirror distance. In frequency space, this periodicity is typically defined in terms of the free spectral range (FSR). Thus, the FSR is the maximum frequency range accessible by the interferometer before higher transmission orders appear in the spectrum.
In the measurement process, the wavelength (and, thus, the frequency) of light is analyzed by detecting the transmitted light intensity upon scanning the distance of the interferometer mirrors. In this scanning process, one mirror of each FPI is fixed while the other mirror is placed on a common scanning stage. Since the transmission function of a single FPI is periodic, the two interferometers are arranged under an angle α. Hence, a mode discrimination, i.e., an unambiguous identification of the spin-wave signals in the detected BLS spectrum is possible. The absolute value of the frequency shift is determined by comparing the mirror spacing corresponding to light that is scattered from the sample with the position of a reference beam that directly enters the interferometer (reference beam in Figure 3A). The position of this reference beams, therefore, marks the zero position in a BLS spectrum.
As can be seen in Figure 3A, the inelastically scattered light passes each etalon three times before it is finally detected by a photodetector. This (3+3)-arrangement allows for a high contrast better than 1010, which is needed for the detection of the small BLS signal intensities.
The FSR—the frequency range that is accessible by the TFPI—as well as its frequency resolution are coupled and given by the offset mirror distance that defines the zero position for the scanning process in each measurement. In general, the FSR of a TFPI can be of the order of several hundred gigahertz. However, the frequency resolution decreases for increasing FSR. In most experiments, the spin-wave frequencies will be on the order of 10 GHz and the FSR should be adjusted to these frequencies in order to work with a maximum resolution. Typical frequency resolutions (defined as the full width at half maximum), that can be achieved in this range, are Δf = 273 MHz for an FSR of 30 GHz and Δf = 45 MHz for an FSR of 5 GHz.
The result of a typical BLS measurement is illustrated in Figure 3B. The spectrum exhibits three different peaks. The zero position of the spectrum is marked by the signal corresponding to the reference beam as already discussed above. In addition, the resulting BLS spectrum yields one Stokes peak with a negative frequency shift with respect to the reference beam and one Anti-Stokes peak with positive frequency shift. Since the BLS cross-section is proportional to the square of the amplitude of the dynamic magnetization [36, 65], the peak height in a BLS spectrum indicates the spin-wave intensity.
As already discussed in the introductory Section 1, it has to be mentioned, that the TFPI is a rather complex device and its maintenance a time-consuming task. The mirrors of each FPI are not only placed on a scanning stage but their relative orientation and stability can also be controlled by piezoelectric actuators. Thus, before a measurement can be started, the instrument needs to be aligned. During each measurement process, the system has to be tuned to ensure stability. The TFPI as sold by J. R. Sandercock is a turn-key system and allows for the handling of these tasks as well as the recording of single spectra. However, these tasks have to be performed by trained personnel and the setup does not allow for the automated execution of complex sequences of measurements including the control of peripheral devices.
As already discussed in the introductory part in Section 1, the software package TFPDAS has automated routines for the alignment and the stabilization of the TFPI before and during measurements. Several parameters enable the adjustment of the stabilization routines to the actual working conditions—like different laser powers—to ensure optimized stability of the system. Regarding the scanning process itself, TFPDAS allows for the definition of special regions of interest (ROI) in each spectrum. Via the definition of these spectral ROIs with different weighting, the operator can put particular emphasis on individual signals in the spectrum and, thus, achieve both, a reduction of the required measurement time and an increased signal strength.
As will be illustrated in Section 4.3, typical BLS measurements require not only the control of the actual scanning process but also the variation of several external parameters like the bias magnetic field, frequency as well as power of the external excitation of spin waves, or the probing position in spatially resolved measurements. TFPDAS allows for the control of up to three peripheral devices and the corresponding data acquisition even for complex sequences of measurements. Thus, while the high performance of the TFPI itself is the crucial precondition for the observation of spin waves via BLS in general, the wide-spread application of this technique is based on the flexibility of easy to use and automated BLS spectrometers controlled by a sophisticated software solution.
3.3. Wave-Vector Analysis
As already mentioned before, many experiments based on electrical techniques only allow for the detection of the FMR, the uniform precession of all magnetic moments, or they average over all wave vectors in the spin-wave system. However, a crucial aspect for the investigation of spin waves is the capability of measuring their dispersion. As will be explained in the following section, this task can be addressed using BLS spectroscopy.
According to Equation (2), the conservation of momentum in the BLS process allows for a wave-vector-selective detection of spin waves. However, since a single laser with a constant wavelength is used, the modulus of the wave vector of the incident light |kin| is fixed. Therefore, in order to control the momentum that can be transferred between photon and magnon—and, thus, to obtain wave-vector resolution—the remaining parameter is the direction of the beam with respect to the sample surface. A sketch of the experimental backscattering geometry—i.e., if a single objective is used for both, focusing the incident light as well as collecting the scattered light—with all relevant wave-vector components can be found in Figure 4A.
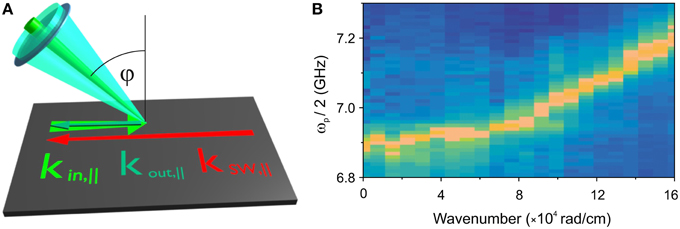
Figure 4. (A) Scheme of the backscattering geometry. By changing the angle of incidence ϕ, the in-plane component of the spin-wave wave vector ksw,|| can be determined. (B) BLS measurement of the spin-wave intensity as a function of the spin-wave wave vector of parametrically excited magnons [66]. The detected intensity is color-coded where yellow (blue) represents maximum (minimum) signal. The measurement was performed on a 5 μm thick yttrium iron garnet film.
To analyze the momentum transfer between photon and magnon, the break of the translation symmetry at the sample surface has to be taken into account. According to Noether's theorem, this implies that wave-vector conservation is given for the in-plane components only but not for the out-of-plane components. Therefore, the relevant momentum transfer is defined by the projection of the photon wave vector to the sample surface. For objectives with large working distances, a change of this in-plane component of the incident laser light can easily be obtained by varying the angle of incidence ϕ as illustrated in Figure 4A. Experimentally, this is realized by rotating the sample about the axis perpendicular to the plane of incidence while the optical axis of the impinging laser remains fixed.
The accessible wave-vector range depends on the scattering geometry. The maximum wave vector can be observed in the case of backward scattering geometry discussed here. In this case, according to Equation (2), spin waves with a wave vector of
will be probed, where λL is the laser wavelength and ϕ denotes the angle of incidence. For a laser wavelength of λL = 532 nm, the maximum wave vector that can be detected is kmaxsw,|| = 23.6 which corresponds to a minimum spin-wave wavelength λminsw = λL/2 = 266 nm.
Figure 4B shows a measurement of the spin-wave intensity using a wave-vector-resolved BLS spectroscope in backscattering geometry [66]. Each column represents a BLS spectrum detected for a fixed wave-vector where the signal intensity is color-coded. Yellow (blue) indicates maximum (minimum) intensity, respectively. The measurement was performed on a 5 μm thick yttrium iron garnet film.
As already, discussed in Section 2, the spin-wave dispersion of an in-plane magnetized film is anisotropic with respect to the angle between spin-wave wave vector kSW and magnetization M. To access the full, two-dimensional dispersion surface of the spin-wave system, it is, therefore, not sufficient to change the measurement geometry only by rotating the sample about an axis normal to the plane of incidence as described above. Instead, a rotation about a second axis has to be realized to individually change the wave-vector components parallel and perpendicular to the magnetization direction. The realization of this approach to probe the entire dispersion surface requires to rotate the magnet along with the sample and is described in Sandweg et al. [45].
Finally, it should be mentioned that once a model for the spin-wave dispersion is established, wave-vector resolved BLS spectroscopy is a great tool for the determination of all material parameters, that affect the spin-wave dispersion [52, 67–69]. While the frequency resolution of competing techniques like FMR might be superior, the wave-vector resolved detection of thermally activated spin waves allows for a flexible variation of the measurement geometry. Therefore, material parameters that are closely connected in FMR measurements—and, thus, hard to determine individually—can be partially disentangled by the proper choice of different measurement conditions. Finally, very recent studies of the interfacial Dzyaloshinskii-Moriya-exchange in Pt/Ni80Fe20 bilayer systems illustrate the potential of wave-vector-resolved BLS in rather new, emerging research fields [70].
4. Brillouin Light Scattering Microscopy
The advances in electron beam lithography and sample patterning as well as the urge for miniaturization drastically reduced the feature sizes of magnetic structures reaching toward the nanometer scale. However, the laser focus of a conventional BLS spectroscope covers an area of several tens of micrometers. In order to obtain a sufficient signal from micro- or even nanometer-sized elements, it is, therefore, necessary to arrange several tens or even hundreds of them in an array and investigate all of them at the same time. As a result, the measured signal gives insight only in the averaged properties of all elements. In particular, any detailed information about the nature of different spin-wave modes within the same individual magnetic element—such as the spatial profile—is missing. Investigations of spin-wave propagation on the nanometer scale are not possible at all.
Thus, in order to reach beyond the micrometer length scale, the experimental realization of conventional BLS spectroscopy has to be optimized with respect to the beam path to implement a microscopic spatial resolution. As we will see, these changes have a significant impact on the design of the experimental setup. In the following sections, we will introduce the properties and advantages of a BLS microscope. Section 4.1 describes the beam path of the probing laser as well as the illumination of the sample. As already discussed in previous Sections of this article, the complexity of BLS spectrometers in general and BLS microscopy in particular require flexible and easy to use software solutions. This topic will be picked up again in Section 4.2 which is devoted to the implementation of the sample positioning system and the long-term stability of the experimental setup. After the discussion of these technical aspects of BLS microscopy, Section 4.3 illustrates the working principle based on several recent studies on spin waves in nanostructures.
4.1. Optical Setup
The main components in a BLS microscope do not differ much from the ones in a conventional BLS spectroscope: the magnetic properties are probed via the light of a single mode laser that is focused and subsequently scattered on the sample and then analyzed in a TFPI that was already discussed in Section 3.2. However, the aim of investigating magnetization dynamics in single magnetic elements on the micro- and nanometer scale implies a far more complex experimental setup than the one of a BLS spectroscope. Besides the integration of the microscope objective for focusing the laser light onto the sample surface, additional care has to be taken of the illumination and observation of the sample structure in order to precisely control the probing position of the laser focus. In this section, we will describe the beam path of the probing laser and the illumination of the sample.
Figure 5A illustrates the beam path of the probing laser toward the sample. In order to reach the maximum spatial resolution with a given microscope objective, it is necessary to fully illuminate the entrance aperture of the objective. Therefore, a telescope (lenses L1 and L2 in the sketch) is used to expand the parallel laser beam to, in our case, a diameter of about 3 mm. The laser light passes a set of mirrors and conventional beam splitters, before the polarizing beam splitter cube BS3 deflects it into the microscope objective that is mounted above the sample. The purpose of the beam splitters BS1 and BS2 will be explained in the following sections and is not relevant at this stage of the discussion.
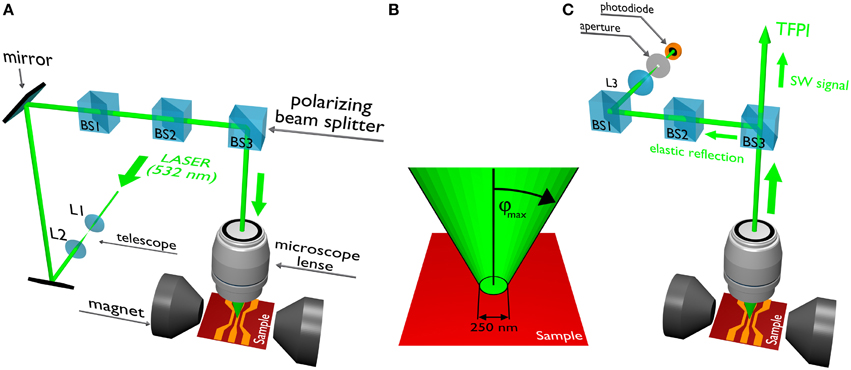
Figure 5. Optical path of (A) the incident beam, (B) laser focus on the sample, and (C) optical path of the reflected beam.
Because of the polarizing beam splitter BS3, the light intensity that is coupled into the objective is given by the polarization direction of the incident laser and can, therefore, be controlled by means of a λ/2 wave plate that is positioned at the beginning of the light path. As was already mentioned before, the control of the laser power in a BLS microscope is crucial: high intensities of the focused laser beam result in local heating at the probing position and might, therefore, affect the investigated spin dynamics, via, e.g., a reduction of the saturation magnetization, or even destroy the magnetic structure under investigation.
The chosen objective (100x HD-DIC) has a numerical aperture of NA = 0.75 and a working distance of 4 mm to obtain a high spatial resolution and yet leave enough space between sample and objective. The latter point is crucial to allow for the study of samples that are contacted with bonding wires or for the use of high frequency probes for contacting coplanar waveguides. Typically, these connections to external microwave circuitry are used for the excitation of spin waves in magnetic microstructures. For the combination of the chosen objective and the laser wavelength of λL = 532 nm, the spatial resolution of the scanning BLS microscope is around 250 nm.
Magnetic microstructures are commonly fabricated from metallic materials due to their better applicability in lithographic processes. Hence, BLS microscopy is mostly applied to opaque samples that make it necessary to detect the scattered light in the backward scattering geometry that was already discussed in the previous Section 3.3. Therefore, as illustrated in Figure 5B, the scattered light is collected by the same objective that also focuses the light onto the sample. Due to the high numerical aperture, the objective can collect and collimate all the light reflected and scattered at the sample within a cone angle of ϕmax = 49° with respect to normal incidence (see Figure 5B). Using this angle ϕmax in Equation (3) from the previous section yields a maximum wave vector kmaxsw, || = 17.8 that can be detected in the BLS microscope for the given microscope lens and which corresponds to a spin-wave wavelength of λsw = 350 nm. This limitation regarding the maximum wave vector can be pushed toward smaller wavelength, however, this requires lenses with a higher numerical aperture, i.e., a shorter working distance. In addition, one should keep in mind that the above considerations are purely based on geometrical optics which does not fully apply to the actual case of the diffraction limited laser spot in the BLS microscope. In this case of high spatial resolution Δx, the corresponding wave vectors are subject to the Heisenberg uncertainty Δk. As a result, maximum wave vector and minimum wavelength as calculated above are not rigid constraints and even spin waves beyond these limits can be detected. However, the detection efficiency for spin waves with wave vectors (wavelengths) approaching these limits rapidly decreases.
The inelastically scattered light is collimated by the same microscope lens used for focusing the incident laser and reaches the beam splitter cube BS3 for the second time (see Figure 5C to follow the beam path of the scattered and reflected light). At this stage, the beam splitter BS3 serves to separate the reflected (elastically scattered) light from the inelastically scattered photons that carry the information about the investigated spin-wave modes. This is especially important if one considers the small scattering cross-section of light and spin waves. Most of the light is reflected at the sample and does not undergo any scattering with spin waves. The demands of most experiments concerning the required contrast are very high. Therefore, a crucial point in BLS microscopy is the separation of the inelastically scattered light from the light that is merely reflected from the sample (Rayleigh peak). This separation is based on the polarization dependence of the inelastically scattered photons, that was already mentioned in Section 3.1: during the BLS process, the polarization direction of the light scattered on spin waves is rotated by 90°. In the actual setup, the polarizing beam splitter cube BS3 works as a polarization analyzer. The elastically scattered light is deflected, while the inelastically scattered light is transmitted toward the TFPI. This optical arrangement, thus, increases the contrast of the experiment because only the light containing the spin-wave information will be focused onto the pinhole of the TFPI for frequency analysis.
The separation of the elastically scattered part of the laser light from the spin-wave signal has an additional advantage. Other sources of photons that are subject to a frequency shift in the GHz range are also excluded from the measurement process. Possible sources for such a frequency shift are BLS events of photons with phonons (which do not result in rotation of the polarization) or higher order modes of the probing laser itself. Even the emission of single frequency lasers still contains small fractions of higher longitudinal modes of the laser resonator, i.e., additional laser lines appearing at frequency distances of typically 0.1–5.0 GHz with respect to the central laser line. The contrast of the interferometer is high enough to detect these weak longitudinal modes so that they would appear as additional peaks in the BLS spectrum if no filtering took place. But since the light originating from the longitudinal modes has the same polarization as the elastically scattered light, it is also filtered by the beam splitter cube BS3 and does not appear in the BLS spectrum or it is at least strongly attenuated.
As already mentioned above, and due to its high numerical aperture, the microscope objective that focuses the probing beam onto the sample collects and collimates light from a cone with an opening angle of ϕmax = 49°. Thus, in the limit of geometrical optics, the BLS signal detected in the TFPI can originate from any spin-wave mode in the wave-vector range between ksw, || = 0 and kmaxsw, || = 17.8 (see Section 3.3 for details about the wave-vector resolution).
Of course, this is a major difference between BLS spectroscopy using objectives with a large working distance and BLS microscopy with an objective with high numerical aperture. The large working distance in conventional BLS spectroscopy results in a well-defined direction of the incident probing laser beam as well as of the backscattered light and, thus, ensures wave-vector selectivity in the measurement process. In contrast, a high spatial resolution requires a fully illuminated microscope objective with high numerical aperture. Therefore, measurements with high spatial resolution do not allow for the simultaneous detection of discrete wave vectors. Instead, they immediately lead to the loss of well-defined wave vectors and toward detection in a certain wave-vector range. As discussed above, even the limits of these wave-vector range itself must also not be regarded as strict constraints of the measurement process but are also subject to an uncertainty. This loss of wave-vector selectivity for the benefit of a microscopic spatial resolution is a general physical phenomenon that can be understood by the Heisenberg uncertainty principle and, therefore, is a general limitation of microscopic techniques.
However, even though the wave-vector information is not directly accessible any more in BLS microscopy, it is still possible to extract it from a series of measurements based on the phase-sensitivity of the BLS process that was mentioned above in Section 3.1. The implementation of phase-sensitive BLS microscopy will be described in Section 4.4.
Finally, it should be mentioned that the maximal spatial resolution of BLS microscopy is defined by the fundamental diffraction limit of light. Thus, new approaches have to be realized to achieve a further, substantial increase of the spatial resolution in BLS spectroscopy. A possible way was presented by Jersch and co-workers who combined near-field optics with BLS spectroscopy and, thus, obtained a spatial resolution of about 55 nm enabling the characterization of nanoscale spin-wave edge modes [71]. Unfortunately, this benefit comes at the cost of a strongly decreased signal strength and, as a result, very time-consuming measurements. Therefore, only few BLS studies are based on near-field optics. In perspective, another possible approach could be—in analog to Raman scattering—plasmon enhanced BLS.
The investigation of microscopic structures also requires a microscopic imaging of the sample in order to control its relative position to the laser focus. For this purpose, a light source, e.g., a LED, is integrated via the beam splitter cube BS2. The image of the sample is monitored via a CCD camera through the beam splitter cube BS2 at the same time while BLS measurements are taken. As will be discussed in the following Section, the software package TFPDAS-Micro extends the already mentioned TFPDAS by several aspects of BLS microscopy—like sample monitoring and active stabilization to compensate for drifts in the sample position.
4.2. Sample Positioning and Long-Term Stability
BLS microscopy is based on scanning a focused laser spot over the sample. A high resolution positioning system is essential to position the sample with respect to the laser focus. The most convenient solution is to mount the sample on a three dimensional translation stage that should provide a resolution of at least 10 nm over a range of 100 μm. The intensity distribution of the spin-wave signal is then measured by moving the sample and keeping the optics fixed.
It is useful to distinguish between the sample movement in lateral and focal direction, where the latter will be referred to as the z-axis. The accuracy of the sample positioning in the xy-plane critically determines the quality of the spin-wave measurement. Hence, in addition to a high accuracy, good reproducibility as well as temporal stability of the positioning system are required. These can be realized by using, e.g., piezo-driven linear stages, stepper motors, or high resolution electromotors controlled by software which makes use of the CCD camera image. The movement of the sample in z-direction is less demanding since the variation in the topography of the sample is typically much smaller than the focal length. Thus, the application of a manual sample stage in z-direction is feasible. Nevertheless, an active stabilization of the focal position is practical in the case of long-term measurements over several hours.
Since drifts of the sample are unavoidable if the measurement times exceed the range of minutes, an active stabilization of the sample position is needed. Drifts are detected via pattern recognition of a reference image. This reference image is marked by the experimentalist directly on the real-time CCD image. The software continuously identifies the position of the reference image via pattern recognition. In a feed-back loop the detected drifts are translated into a movement of the positioning system in order to bring the reference image and, thus, the entire sample back to its original position with nanometer precision over arbitrary periods of time.
The active stabilization algorithm does not only maintain a fixed position of the laser focus with respect to the sample. It can also be used to define scan arrays of various shapes directly on the real-time CCD image and, thus, allows for fully automated measurements of large areas on the sample.
The software provides the possibility to define scan arrays with different geometries. This functionality is essential for BLS microscopy as a scanning technique. The stabilization of the sample position during the measurement of a spectrum enables the precise detection of any frequency information at one single probing position. However, the space-resolved mapping of different spin-wave modes also requires the precise relative orientation of the sample for the different probing positions. For this purpose, an automated software solution like TFPDAS-Micro is inevitable.
4.3. Examples
In the following section, the performance of the BLS microscope described above will be illustrated on the basis of several different experimental scenarios. As will be discussed, the use of the described experimental setup in combination with the easy-to-use software package allows for very comfortable and, yet, highly complex and versatile measurements of spin-wave properties on the micro- or even nanometer scale. In addition, this section not only provides a rough overview on which kind of experiments can be performed but also illustrates the experimental demands of the field of magnonics with respect to BLS microscopy.
As described in detail in Section 4.2, a crucial point regarding BLS microscopy is the precise positioning of the probing laser focus with respect to the investigated structures and the long-term stability of this position. Obviously, the requirement of long-term stability is particularly challenging for small structures combined with low spin-wave intensities where even small lateral drifts on the timescale of hours can distort the experimental results. The possibilities regarding sample positioning and stability of the fully-automized and actively-stabilized BLS microscope described above are illustrated in Schultheiss et al. [72].
In this study, the authors for the first time detected the spatial profile of thermally activated, quantized spin waves in micron-sized rings with widths of only 400 nm. The results of these measurements on rings with different diameter are shown in Figures 6A–F together with micromagnetic simulations of the same structures. As can be seen, the high sensitivity of the BLS microscope allowed not only for the detection of different modes of the discrete spin-wave spectrum, but the positioning system also allowed for the mapping of the spatial positions of these modes along the ring's perimeter. The existence of different spin-wave modes in the ring structures is a result of the varying effective field along the azimuthal position on the rings. Each column of the illustrated intensity distributions (Figures 6A–C) resembles a BLS spectrum as shown in Figures 6D–F. Figure 6G shows the simulated mode profiles for several spin-wave modes in a ring with a diameter of 1 μm. As a result of the small scattering cross-section of thermally activated spin waves in a BLS experiment each spectrum is accumulated for 15 min at a particular position on the ring structure. These long accumulation times clearly demand for an active stabilization of the BLS microscope in order to minimize lateral drifts of the magnetic elements with respect to the incident laser.
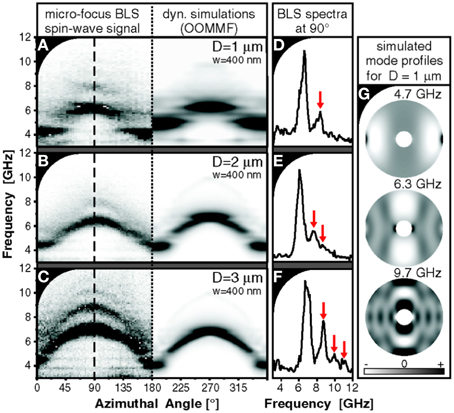
Figure 6. Spin waves in Ni81Fe19 rings with diameters ranging from 1–3 μm and a width of 400 nm. Taken from Schultheiss et al. [72]. (A–C) Experimentally observed (left side) as well as simulated (right side) intensity profiles of the spin-wave modes. The azimuthal angle indicates the position along the ring's perimeter. (D–F) Individual BLS spectra for fixed position. (G) Simulated mode profiles for different spin-wave modes at a ring with diameter D = 1 μm.
A major result of this study are the different properties of the observed spin-wave modes with respect to their coherence. In particular, the measurement showed the transition from a fully coherent to a partially decoherent eigenmode system for increasing ring diameters. The partial decoherence for the larger rings (D = 3 μm) resulted in a continuous change of the spin-wave frequency when moving along the ring perimeter and, thus, as a function of the varying effective field (see Figure 6C). In contrast, the spin-wave frequency stays constant for a large angular range in the case of the smallest ring diameter D = 1 μm indicating the spatial coherence of the corresponding spin-wave modes (see Figure 6A).
The coherence of spin waves illustrated by the results above is a crucial precondition for many concepts that have been suggested with respect to a potential spin-wave-based logic in the field of magnonics. These concepts rely on the interaction of spin waves and, thus, make use of their wave nature [73–81]. The authors Pirro et al. [82], therefore, picked up this idea and realized a sample structure to investigate the interference of externally driven, counter-propagating spin-wave modes. The external excitation of spin waves requires antenna structures that can be connected to external microwave circuitry. Significant progress in the sample preparation for spin-wave transport on the micrometer length scale was made by using miniaturized coplanar waveguides (CPW) for exciting spin waves. Using these CPWs, it is possible to guide microwave currents in the GHz range into small antenna structures for the local excitation of propagating spin-wave beams in magnetic stripes with widths of only a few micrometers—as illustrated by the actual study.
Figure 7A shows an example where spin waves were launched from two antennas separated by a distance of 15 μm. Technically, the measurements performed in this study required additional functionalities of the BLS microscope. While the only measurement parameter that was changed in the above example with the ring structures was the sample position, the actual experimental scenario also required the automated control of a microwave signal generator. In total, the software package TFPDAS allows for the simultaneous and automated control of three different external devices in one measurement. Typical parameters that require an automated control are the external magnetic field, the sample position, and excitation power as well as excitation frequency.
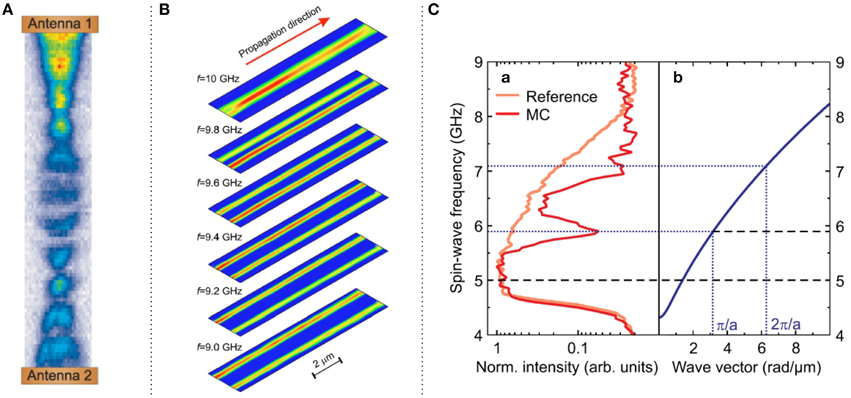
Figure 7. (A) BLS microscopy image of the interference of two colliding spin waves in a Ni81Fe19 stripe, taken from Pirro et al. [82]. (B) Spin-wave intensity distributions of propagating spin waves measured for different excitation frequencies in a perpendicularly magnetized Ni81Fe19 waveguide. From Demidov et al. [83]. (C) Band gaps in the spin-wave spectrum of a nano-structured magnonic crystal as a function of the magnetic field, taken from Obry et al. [84].
Figure 7A shows the spin-wave intensity mapped over the entire region of the spin-wave waveguide between the antennas. The detected intensity is governed by the interference of the two different spin-wave modes. Remarkably, this interference pattern of the spin waves shows a very high contrast even though the amplitudes of the spin waves show significant decay. This demonstrates that the coherence of spin waves driven by a microwave current is conserved over distances even larger than their decay length. Thus, this space-resolved study directly confirms, that concepts based on the interference of spin waves can really be used in potential information processing devices.
To allow for the realization of more complex sample structures with respect to spin-wave based information transport, it is essential to find ways how to manipulate spin-wave propagation. For the observation of spin-wave propagation in microstructures spatial resolution as offered by BLS microscopy is essential. In fact, most studies in the field of magnonics that deal with the guided propagation of spin waves in waveguide structures and, in particular, with possible ways to manipulate and control spin-wave transport are performed using BLS microscopy.
In [83], Demidov and co-workers used a BLS microscope to illustrate the control of spin-wave propagation by utilizing the inhomogeneity of the effective field in magnetic microstructures. The BLS microscope images in Figure 7B show the propagation of spin waves with different frequencies. At the frequency of f = 10 GHz, spin waves propagate as a wide beam centered with respect to the stripe's axis. With decreasing excitation frequency, this beam splits into two much narrower beams shifted from the center of the stripe toward its edges. This transition is related to the magnetization pointing along the width of the waveguide that results in a unique trend of the effective magnetic field across the width of the waveguide. Due to dipolar magnetic fields caused by the magnetization pointing perpendicular to the spin-wave waveguide, the effective field is strongly reduced at the waveguide edges. This inhomogeneous field distribution leads to a strong confinement of spin waves similar to the localization of electrons in quantum wells. As a result, two narrow waveguide channels are formed allowing for the control of spin-wave propagation.
Another promising approach for the manipulation of spin-wave transport is the periodic variation of one or more parameters along the direction of spin-wave propagation. These variations can be induced via either the material parameters—like the saturation magnetization—or via the geometry of the spin-wave waveguide. Analog to photonic crystals, the resulting structures are referred to as magnonic crystals [84–88]. The periodic variations in a magnonic crystal leads to the formation of band gaps in the spin-wave transmission spectrum caused by Bragg reflection. The concept of a magnonic crystal, therefore, also relies on the coherence of spin waves that has already been discussed above.
One example of a magnonic crystal based on the variation of the saturation magnetization in a spin-wave waveguide is illustrated in Figure 7C taken from Obry et al. [84]. In this study the implantation of Cr+ ions was used to achieve a periodic modulation of the saturation magnetization in a Ni81Fe19 stripe without actually changing the topography, i.e., without altering the thickness of the magnetic material [89, 90]. In a magnonic crystal the chosen periodicity—1 μm in the actual case—defines the Bragg condition and, thus, the position of the resulting band gaps in terms of the wave vector. The frequency of these band gaps depends on the actual dispersion relation, which can be tuned by the external field. Figure 7C (left panel) shows the transmission spectra of a reference waveguide and the magnonic crystal (MC) measured locally with BLS while driving the spin waves with a microwave generator. The band gaps are clearly visible in the transmission spectrum of the magnonic crystal. Quantitative agreement was observed between the experimentally observed frequency positions of these band gaps and the theoretical expectations based on the calculation of the spin-wave dispersion (see right part of Figure 7C).
A next step toward the realization of potential logic devices based on spin-wave propagation, is to control spin-wave transport not only in straight waveguides but also in two-dimensional structures. Thus, several experiments have been performed to transfer the knowledge about spin-wave transport in straight conduits to more complicated structures with broken translational symmetry. Such conduits that allow for a directional change of the propagation direction are crucial for fostering spin waves as information carriers in fundamental logic applications.
However, modifications in the shape of a magnetic waveguide often result in inhomogeneous magnetic fields and non-uniform magnetization distributions. Based on this, it is, in particular, the anisotropy of the spin-wave dispersion with respect to the magnetization direction that makes the control of two-dimensional spin-wave transport challenging. One way to compensate this problem is given by the use of local magnetic fields to control the propagation characteristics. However, before this approach of local magnetic fields will be presented, we will discuss and illustrate the consequences of a broken translational symmetry on spin-wave transport on the basis of Clausen et al. [91].
To understand the challenges of two-dimensional spin-wave transport we have to remember that—due to the anisotropic dispersion—there is a preferred propagation direction in in-plane magnetized magnetic elements. This preferred direction is given for spin-wave modes with the wave vector perpendicular to the magnetization. The reason for this preference is the higher group velocity—and, thus, the small spatial decay—that can be realized in this geometry. Therefore, almost all experiments on spin-wave propagation in microstructures are performed using spin-wave waveguides that are magnetized perpendicular to the propagation direction (to be seen also in Figure 8A). In addition to the small decay length, even the excitation of spin waves in a longitudinally magnetized stripe itself is a challenging task [92].
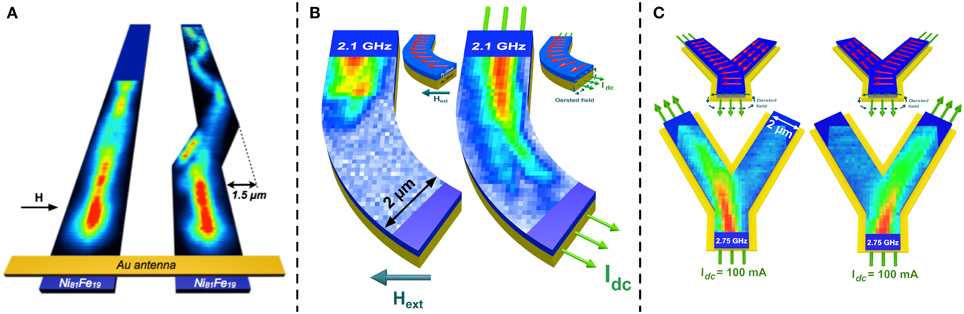
Figure 8. (A) Distortion of a propagating spin-wave beam in a 2.5−μm wide permalloy stripe due to a skew section [91]. (B) Spin-wave propagation in global (left) and local magnetic fields (right) [46]. (C) Controlled switching of spin-wave propagation by means of local magnetic fields. Spin waves follow the path where the magnetization is perpendicular to the propagation path [47].
In Clausen et al. [91], spin-wave transport was investigated in a waveguide that is shifted transverse to the spin-wave propagation direction resulting in a parallel offset of the waveguide axis behind the skew section as is depicted in Figure 8A. Despite being only a rather small deviation from a straight stripe, it was shown that this skew has a profound impact on the spin-wave modes propagating in the waveguide. This is illustrated by the measured spin-wave intensity in the straight reference waveguide on the left side of the graph and for the case of the waveguide with the kink on the right side. Clearly, the intensity pattern strongly changes after the kink. This changing intensity pattern is mainly caused by the partial conversion from symmetric to asymmetric waveguide modes—characterized by an odd or even number of anti-nodes across the width of the waveguide, respectively. This conversion is a result of the strong concentration of the spin-wave amplitude at the boundary of the waveguide inside the skew, which is clearly asymmetric. This concentration of the spin-wave amplitude is caused by the preferred propagation direction perpendicular to the magnetization. Therefore, spin waves cannot be fully controlled in curved structures by the geometric confinement as given by the waveguide structure in the actual experiment.
The observed change of the intensity pattern is not only an eminent chance to excite spin-wave modes in microstructures which cannot be excited by antennas alone due to their vanishing net magnetic moment (modes with an even number of antinodes). The study of spin-wave propagation and mode conversion in such structures may also shed light on the propagation characteristics of spin waves in overall inhomogeneously magnetized conduits.
However, even though this conversion of spin-wave modes is interesting from a fundamental point of view, it impedes experiments in which the mode profile of the spin waves needs to be conserved. In particular, a distortion of the mode profile in two-dimensional structures might prohibit the realization of logic devices based on the interference of two or more spin-wave modes. Therefore, many concepts in the field of magnonics require sophisticated approaches to steer spin-wave transport in 2D.
This challenge was addressed by the utilization of local magnetic fields for guiding spin waves in curved conduits [46]. The underlying mechanism of this approach and the results are shown in Figure 8B. The left side shows spin-wave propagation in a conduit that is magnetized by an externally applied and, thus, global magnetic field. In this case, the magnetization in the waveguide has the same direction in the entire structure: along the external field. Thus, the preferred propagation direction with the wave vector perpendicular to the magnetization can only be realized at the top of the structure in front of the bend where the spin waves are launched. Due to the anisotropy of the spin-wave dispersion, the change of the angle between the spin-wave wave vector and the magnetization direction leads to a rapid decay of the spin-wave amplitude for waves propagating in the bend. Consequently, spin-wave transport is prohibited in the curved section of the conduit where the external field forces the magnetization to change from a perpendicular to a parallel alignment with respect to the conduits' boundary.
The situation changes drastically in the right part of Figure 8B. In this case, it can be clearly seen that spin waves can enter and follow the curve. The major difference between these two scenarios is the way to create the magnetic fields to magnetize the waveguide in the desired direction. While a global external field is used in the first case, local magnetic fields are used in the second case. These local magnetic fields are generated by an electric current flowing in a gold conductor below the spin-wave waveguide and substitute the global magnetic field. This Oersted field is always oriented perpendicular to the current direction and, thus, keeps the magnetization aligned perpendicular to the spin-wave wave vector if the spin-wave propagation follows the geometric confinement. As a result, the spin wave propagates along the preferred direction of kSW ⊥ M even in the curved area. Thus, local magnetic fields are a possible way to control spin-wave transport in 2D enabling even more complex experimental scenarios.
In fact, making spin waves turning around a corner by using locally generated magnetic fields is just the beginning. In Figure 8C, we demonstrate the realization of a microstructured spin-wave multiplexer as the first step toward an all-spin-wave-based technology [47]. In this case, the electric current that generates the local magnetic field does not flow along a predefined direction any more. Instead it can be switched to either the left or to the right arm of a Y-structure. In this approach, the local magnetic fields alter the magnetization direction solely in designated regions of the spin-wave multiplexer and, thus, allow us to tailor the dispersion relation in different areas of the structure to our needs. In particular, the magnetization can be aligned perpendicular to the spin-wave waveguide by the Oersted field, whereas demagnetizing fields cause a parallel alignment in the arm without current flow. As can be seen in Figure 8C, this enables not only to steer spin-wave transport along the current path but also hinders spin-wave propagation in the other arm. Thus, in the spin-wave multiplexer the concept of local Oersted fields exploits the unique feature of the anisotropic dispersion relation of spin waves to even switch their propagation direction.
The examples discussed above are based on spin-wave propagation in the linear regime. However, as already discussed in Section 2, the spin-wave system is an intrinsically nonlinear system. Thus, in sample structures that allow for the external excitation of spin dynamics via a microwave signal, nonlinear phenomena can be observed even for moderate powers typically available in laboratories. The clear advantage of BLS microscopy for the investigation of nonlinear systems is that the entire spin-wave spectrum is measured for each excitation frequency. This is giving direct access to higher harmonics or secondary spin waves generated in multi-magnon scattering events. An example for the nonlinear generation of the second harmonic from a propagating spin-wave mode in a microstructured Ni81Fe19 waveguide is presented in Demidov et al. [93]. The upper panel of Figure 9A shows the spatial intensity profile of a spin-wave mode excited directly by the coherent microwave signal applied to an antenna structure. For the observation of the directly excited mode the excitation frequency fe was equal to the detection frequency of fd = 5.5 GHz. The observed intensity profile corresponds to the propagation of the fundamental waveguide mode with one antinode across the width of the waveguide.
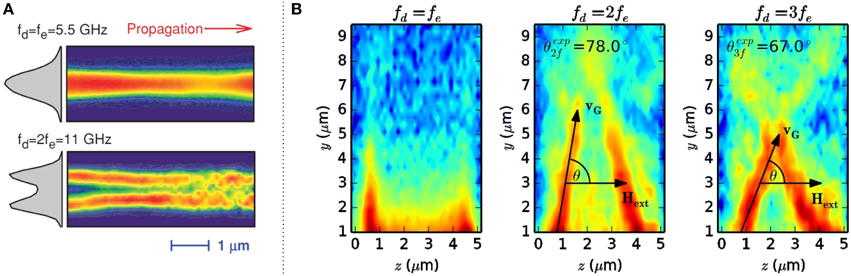
Figure 9. (A) Top: Intensity profile of the spin-wave mode directly excited by an external microwave signal. Bottom: Spin-wave mode at twice the excitation frequency excited by the nonlinear generation of higher harmonics. Taken from Demidov et al. [93]. (B) Intensity profiles of a localized edge mode as well as of the higher harmonics at twice and three times the excitation frequency [51]. The latter form spin-wave beams with a well-defined propagation direction enabling the control of spin-wave transport in two-dimensional structures.
For a sufficiently high microwave power, the BLS spectrum exhibits a second peak at fd = 2fe = 11 GHz. The intensity profile of this second harmonic is illustrated in the lower panel of Figure 9A. In addition to the mere observation of the higher harmonic itself, the detected intensity profile of this spin-wave mode draws attention. It exhibits two antinodes across the width of the waveguide corresponding to the second waveguide mode with an asymmetric amplitude profile. As already mentioned above, asymmetric modes cannot be excited by microwave antennas due to their vanishing net dynamic magnetization components across the waveguide. Thus, the actual example not only illustrates the generation of higher harmonics but also the potential to control the propagation characteristics of spin waves by nonlinear phenomena.
This potential becomes even more evident in the following study of the nonlinear emission of propagating spin-wave beams from a localized mode [51]. As was already illustrated in Figure 7B, the excitation frequency in a spin-wave waveguide has a strong influence on the characteristics of the excited spin-wave mode. For a magnetic stripe magnetized perpendicular to its long axis, decreasing frequencies will lead to the excitation of modes closer to the edges of the waveguide. If the excitation frequency is low enough, this can also lead to the formation of localized spin-wave modes trapped in a well formed by the effective field [94, 95]. The localization of these low-frequency modes is a result of the lower cut-off frequency in the dispersion relation for propagating waveguide mode. Such a localized edge mode sitting close to the antenna is illustrated in Figure 9B with the detection frequency equal to the excitation frequency fd = fe. By increasing the applied microwave power in this scenario, it was possible to observe higher harmonics at twice and three times the excitation frequency. This pronounced occurrence of nonlinear phenomena can be attributed to the low-damping Heusler compound Co2Mn0.6Fe0.4Si that is used as the carrier material in this study [60, 96–99]. However, even more interesting than the occurrence of higher harmonics are their propagation characteristics illustrated in Figure 9B. The higher harmonics are radiated from the position of the edge mode in the form of strongly directed spin-wave beams. The formation of so-called spin-wave caustics relies on the simultaneous excitation of various spin-wave modes with different wave vectors at the same frequency via a point-like source like the localized edge mode. Once this precondition is fulfilled, the anisotropic dispersion of spin waves leads to a concentration of the energy flow (defined by the group velocity vG) along certain directions due to collinear group velocities for the majority of spin-wave modes. The resulting propagation directions can be predicted by theoretical calculations with remarkable accuracy and they can even be controlled via external parameters [48–50]. This scenario of strongly directed and frequency-dependent transport, thus, opens the perspective for novel approaches to realize magnonic devices based on two-dimensional spin-wave transport. It, therefore, illustrates very well the additional functionalities offered by nonlinear spin-wave phenomena.
A possible way to promote the occurrence of nonlinear phenomena is to reduce the effective damping in the spin-wave system. This can be realized via spin-polarized electric currents that exert the so-called spin-transfer torque (STT) on a magnetic layer during transmission [100, 101]. Depending on the polarity of the current, this STT can increase or decrease the damping in the system. As we will see below, STT can even be used to overcompensate the damping and, thus, as an alternative excitation mechanism for spin waves. Tremendous research efforts have been spent regarding the realization of spin-torque nano-oscillators (STNO) for the dc-driven excitation of spin dynamics [102–105].
In [106], Schultheiss et al. reported on the dc-control of the nonlinear mode conversion originating from three-magnon scattering processes in the vicinity of a STNO. The advances in sample fabrication allowed for the design of STNOs based on an extended spin-valve trilayer on top of which a nano-contact allowed for local current injection. The triangular top-electrode gave optical access to the magnetic layers and, therefore, enabled measurements of spin waves radiated from the STNO using BLS microscopy, as is shown on the top of Figure 10A. Above a certain excitation power, nonlinear phenomena could be observed in the BLS spectra in a wide frequency range, which can be seen on the bottom of Figure 10A. While the direct, linear excitation of spin waves was controlled by the applied microwave signal, the occurrence of the nonlinearly excited spin-waves modes depends on the effective damping of the system and, thus, on the STT exerted by the direct current.
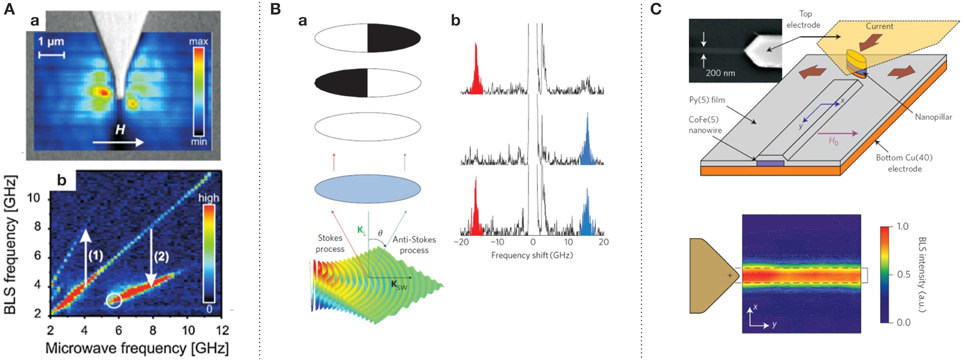
Figure 10. (A) Top: BLS microscope image of the spatial spin-wave profile radiated from a point contact when driven with a microwave current. Bottom: Non-linear spin-wave processes at large excitation powers showing frequency doubling and splitting, taken from Schultheiss et al. [106]. (B) Detection scheme to prove the propagating character of the spin-wave mode generated by the STNO (a) and resulting spin-wave spectra detected with a partially closed and fully opened shutter in the beam path toward the interferometer (b). Taken from Madami et al. [107]. (C) Microscopy image as well as sketch of the sample structure (top) and radiation from the STNO along an embedded CoFe/NiFe waveguide (bottom) [108].
One major goal of today's spintronics is the development of STT-driven oscillators with sufficiently high power for technological applications in, e.g., telecommunications. Toward this end, it is envisioned that the phase-locked coupling of arrays of such STNOs via spin waves could be crucial to generate high power output [109, 110]. Furthermore, there are concepts using spin-wave interference patterns created by spin-torque nano-oscillators for memory and computation [111]. Thus, a purely electrical characterization of isolated STNOs is not sufficient to understand their potential coupling via spin waves. Instead a space-resolved detection technique like BLS microscopy is required to allow for a deeper understanding of the underlying physics.
The direct detection of a propagating spin-wave mode from a STNO driven by a pure direct current was first reported by Madami et al. [107]. In this case, the direct current not only decreased the effective damping in the system but overcompensated the losses enabling the excitation of spin dynamics. In this context, particular emphasis needs to be put on the propagating character of the excited spin-wave mode. In previous theoretical as well as experimental studies on STNOs it had been shown that for an in-plane magnetized film the excitation via STT leads to a bullet mode that is self-localized due to its intrinsic nonlinearity [105, 112, 113]. Thus, the utilization of this non-propagating bullet mode for the coupling of different STNOs or in potential magnonic devices is strongly limited. However, according to theory, the situation changes for out-of-plane magnetization as used in the experiment by Madami and co-workers. The key result of the study was to prove the propagating character of the dc-driven excitation. Since in BLS microscopy a direct detection of the wave vector and, thus, the propagation characteristics is not possible, the following detection scheme was used to show that the excited spin-wave modes propagate away from the STNO. Figure 10B (left side, bottom) illustrates the wave vectors of the probing laser beam kL and the investigated spin wave kSW. Based on the momentum conservation discussed in Section 3.3, Equation (2), the wave vector of the backscattered light has a different direction for the Stokes- and anti-Stokes process. Thus, by partially blocking one side of the backscattered light on its way to the interferometer either the Stokes line or the anti-Stokes line can be blocked, whereas both lines are visible if the full beam enters the TFPI (Figure 10B, left side, upper part). The BLS spectra detected for the different measurement geometries are shown in Figure 10B on the right side. The data clearly confirms the assumption of spin-wave propagation away from the STNO.
Further insights regarding the utilization of STNOs were provided by Urazhdin et al. [108]. They realized a possible scheme to overcome the challenges related to the non-propagating character of the dc-driven excitation even in the case of in-plane magnetized films. The reason for the localization of the resulting bullet mode is its spectral position below the cut-off frequency of the surrounding magnetic film. Therefore, a local lowering of the dispersion in the vicinity of the STNO has to be realized to enable the coupling of the localized bullet mode to a propagating spin-wave mode. As illustrated in the sketch of the sample layout in the upper part of Figure 10C, this lowering was achieved by embedding a CoFe layer in the otherwise homogeneous Py film surrounding the STNO. The demagnetizing fields lower the effective field at the position of the embedded CoFe layer and, thus, also the local dispersion relation. As a result, the frequency of the bullet mode matches the frequency of a particular propagating spin-wave mode in the embedded waveguide. Indeed, the detected BLS intensity map shown in the lower part of Figure 10C clearly illustrates spin-wave propagation along the direction of the CoFe stripe.
In addition to the studies discussed here in detail, recent progress in the research related to spin-Hall effects enabled even new types of STT-driven spin-wave excitation by pure spin currents [114–117] with increased efficiency.
4.4. Phase Analysis
In order to achieve the high spatial resolution of a BLS microscope one needs to sacrifice wave-vector resolution. The reason for this loss of wave-vector sensitivity is the Heisenberg uncertainty principle. Due to its high numerical aperture—that enables the microscopic resolution—the microscope objective collects all the light that is reflected and scattered at the sample in a broad cone angle. Thus, it is not possible to retrieve the wave vector of the investigated spin waves from the measurement geometry as is done in BLS spectroscopy and has been explained in Section 3.3. However, it is still possible to retrieve the phase information of externally excited spin waves even with a BLS microscope. The principle of this phase-resolved BLS, that can be applied to both conventional spectroscopy and microscopy, will be explained in this section. To understand this approach, it is important to remember that BLS is a phase-sensitive process, i.e., the scattered photon carries the phase information of the corresponding spin-wave mode.
To extract this phase information, an approach based on two-beam interference—analog to Mach-Zehnder interferometry—is used. For this purpose, the interference of the inelastically scattered light with a reference beam of constant phase is observed. Thus, this interference signal only depends on the phase of the spin waves that was transferred to the scattered photons in the BLS process [118, 119]. In order to allow for the observation of the interference signal, the reference light needs to have the same frequency as the inelastically scattered photons to ensure temporal coherence. As depicted in Figure 11, this is achieved by sending the probing laser beam through an electro-optical modulator (EOM) driven by the same microwave source as the coplanar waveguide that generates the spin waves. As a result, the light beam that passed the EOM contains a certain number of photons that were subject to a frequency shift according to the chosen microwave frequency. Thus, the effect of the EOM on these photons is the same as induced to the scattered photons by the BLS process. To match the intensity of reference beam and the light inelastically scattered from spin waves a phase-stable, tunable attenuator placed in the microwave branch feeding the EOM is used. The phase of the reference light can be adjusted by a tunable phase shifter.
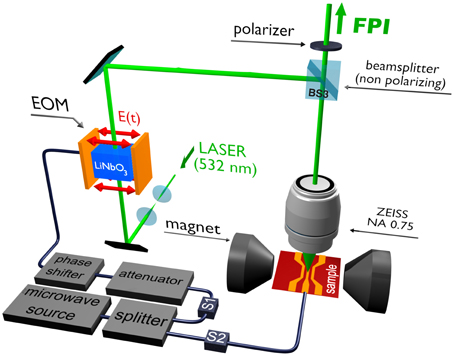
Figure 11. Scheme of the experimental setup for realizing phase-resolved BLS microscopy. The signal generated by a microwave source is split. One branch is guided to the sample where the associated dynamic magnetic field excites spin waves, the second branch drives an electro-optical modulator generating a reference light of constant phase. The interference of the light inelastically scattered on spin waves and the light generated by the electro-optical modulator is used to retrieve the phase information of the excited spin waves.
To allow for a propagation of the reference beam (generated by the EOM) toward the interferometer, it is essential to replace the polarizing beam splitter BS3 in Figure 5 just above the microscope objective by a non-polarizing beam splitter as indicated in Figure 11. In contrast to the inelastically scattered photons, the reference beam does not change its polarization since it is merely reflected on the sample surface and, therefore, would be blocked by a polarizing beam splitter BS3. Furthermore, in order to allow interference of the two signals, they must have the same polarization direction. Since the polarization of the light scattered on spin waves and the polarization of the reference beam are rotated by 90° with respect to each other, it is essential to place an additional polarizer under 45° in front of the interferometer.
To illustrate the working principle of phase-resolved BLS microscopy, we discuss measurements of propagating as well as standing spin waves. First, we consider a spin-wave waveguide made from a 40-nm thick Ni81Fe19 film that is magnetized perpendicularly to its long axis, as depicted by the sketch in Figure 12A. In this geometry, magnetostatic surface spin waves are locally excited by an rf current running through a gold antenna. The phase of propagating spin waves changes continuously with increasing distance to the exciting antenna. Thus, the phase of the inelastically scattered photons also changes for different probing positions relative to the antenna. In contrast, the phase of the reference beam, that is generated by the EOM at the same frequency as the inelastically scattered photons, remains fixed for all measurement positions along the waveguide. As a result, the interference of both signals depends only on the phase of the detected spin-wave mode and we can observe a modulated BLS signal like it is shown in Figure 12A [120]. At positions where the light scattered from spin waves and the reference signal are in phase, they interfere constructively and a high BLS signal is observed. When moving half a spin-wave wavelength farther along the waveguide away from the antenna, the phase of the spin wave changes by π whereas the phase of the reference signal remains the same. As a result, the interference is now destructive leading to a small BLS signal. Thus, the distance between two maxima or two minima in this modulated signal determines the wavelength of the spin waves. Thus, using this approach of phase-sensitive BLS, we can regain wave-vector resolution even for a microscopic spatial resolution.
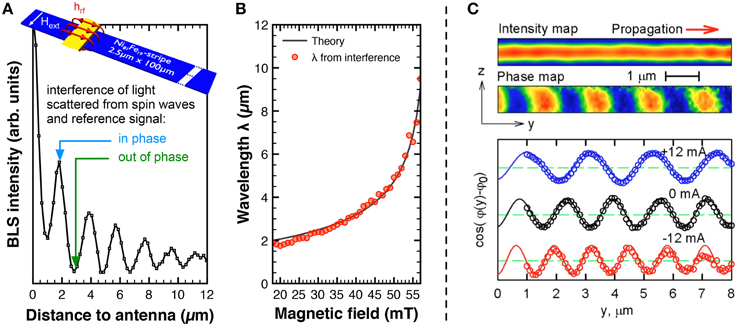
Figure 12. Examples of phase-resolved BLS measurements. (A) Interference signal of light scattered on spin waves in a spin-wave waveguide and the reference beam. The distance between two maxima (minima) yields the wavelength of the propagating spin wave. From Vogt et al. [120]. (B) Spin-wave wavelengths measured for different applied magnetic fields (circles) in comparison with theoretical calculation from the dispersion relation. Taken from Vogt et al. [120]. (C) Top: BLS microscope images of the spin-wave intensity distribution and the phase map in a Cu/Ni81Fe19-waveguide. Bottom: Interference signal measured for different applied currents in the bilayered waveguide. Taken from Demidov et al. [121].
Figure 12B summarizes several phase-resolved BLS measurements and the extracted spin-wave wavelengths depending on external magnetic fields between 18 and 57 mT [120]. If the externally applied magnetic field is increased, the spin-wave dispersion shifts to higher frequencies. For a fixed excitation frequency, this means that the wave vector of the spin wave decreases whereas its wavelength increases. While these qualitative arguments are valid, also a quantitative agreement can be found by a comparison of the experimental data to theoretical calculations. This is illustrated in Figure 12B where not only the experimental data can be found but also the results of calculations based on the model by Kalinikos and Slavin [53] that has already been discussed in Section 2.
Instead of varying the external magnetic field, it is also possible to utilize the previously discussed locally generated Oersted fields in order to change the spin-wave wavelength. In [121], Demidov et al. patterned a 800 nm wide waveguide from a Cu/Ni81Fe19 bilayer to which they applied a direct current. Measurements of the interference signal of the light scattered from spin waves and the reference beam for different applied currents are shown on the bottom of Figure 12C. The Oersted field associated with the direct current either points in the same or in the opposite direction as the externally applied magnetic field, thus, increasing or decreasing the effective field, respectively. This change in the effective field leads to a shift of the dispersion relation resulting in a varying spin-wave wavelength, as can be seen from the different modulation lengths in Figure 12C.
Using the approach of phase-resolved BLS microscopy, it is not only possible to extract spin-wave wavelengths from measuring the interference signal. In addition, it is also possible to determine the actual phase profile of the corresponding spin-wave mode. As explained in full detail in Serga et al. [118], the phase profile of the spin wave can be determined by conducting a set of four separate measurements for each position on the waveguide: (i) interference signal, (ii) interference signal with additional π/2 phase shift of the reference light, (iii) only the light generated by the electro-optical modulator and (iv) only the light scattered inelastically from spin waves. In order to perform these measurements, switches S1 and S2 as well as the phase shifter in Figure 11 need to be adjusted accordingly. Following the algorithm described in Serga et al. [118], the phase accumulation can be calculated as a function of the position. For a propagating spin wave, this yields a linear line where the slope resembles the wave vector.
However, in the case of a standing spin-wave mode, the phase profile is a bit more interesting. Since all moments oscillate in phase between two nodes of a standing wave, the phase profile is constant for one antinode but changes by π for the neighboring antinode. Figure 13A shows the two-dimensional intensity profile of a standing spin wave in a 5-μm long and 2.5-μm wide Ni81Fe19 waveguide. Extracting the intensity in the center of the waveguide along the dashed line, yields the BLS signal given by the circles in Figure 13B. Four distinct antinodes are clearly visible. The squares in Figure 13B represent the phase profile of this standing spin wave that shows the expected characteristics. Every time the BLS intensity (circles) reaches a minimum, which corresponds to a node of the standing spin wave itself, a phase shift of π is detected (red squares). In the regions between two nodes, the phase has a constant value leading to an overall step-like behavior of the spin-wave phase profile. This demonstrates that phase-resolved BLS microscopy is a reliable tool to analyze even complex spin-wave systems regarding their phase.
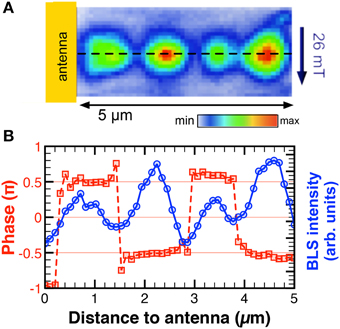
Figure 13. (A) BLS microscope image of a standing spin wave. (B) Intensity (circles) and phase profile (squares) of a standing spin wave.
5. Temporal Analysis
In order to analyze the propagation characteristics of spin-wave pulses or the relaxation of spin-wave eigenmodes, one needs to perform time-resolved BLS experiments. The following approach to realize time-resolved BLS can be applied to both, conventional BLS spectroscopy as well as BLS microscopy [122, 123]. BLS already works in the frequency domain and, thus, there is no need for a direct observation of the spin precession in the time domain. In contrast, the major goal of time-resolved BLS is to observe the temporal evolution of the spin-wave intensity. The idea of this technique relies on the external excitation of spin waves at a well defined point in time t0 and the measurement of the relative arrival time ti of the inelastically scattered photons with high accuracy. Of course, measuring the temporal evolution of a propagating spin-wave pulse requires also spatial resolution, i.e., the possibility to move the laser focus with respect to the point of excitation as has already been discussed in the previous section. Here, we will, therefore, only focus on the principles of time-resolved BLS measurements and show two examples.
The typical setup of a time-resolved BLS experiment is shown in Figure 14A. An inevitable prerequisite for investigating temporal evolution of any kind is a method for locally exciting spin waves on the sample that is under investigation. Commonly, this is realized by conventional strip-line antennas or coplanar waveguides that are directly patterned onto the sample and connected to a microwave generator. Due to the small scattering cross-section in the BLS process, it is not possible to evaluate the temporal evolution from just one single spin-wave pulse. Instead, it is necessary to accumulate the signal over several thousand events and, thus, perform a repetitive measurement. In the experiment, this is realized by exciting the magnetization with microwave pulses with a well defined duration Δt and repetition rate 1/T. It is essential that the time interval T between two subsequent pulses is chosen long enough in order to allow for a full relaxation of the magnetization into its equilibrium state before the next pulse arrives. In this way, the starting conditions for the individual repetitive measurements are always the same.
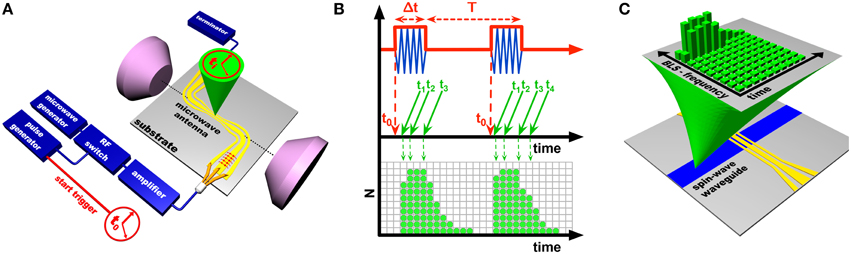
Figure 14. (A) Typical setup for a time-resolved BLS experiment and (B) measurement scheme. Microwave pulses generate a dynamic magnetic field that excites spin waves. A fast rf switch forms a continuous microwave signal into pulses with a repetition rate 1/T and a pulse length Δt. The fast switch is operated by a pulse generator whose trigger output defines the starting time t0 for the measurement. The times ti at which inelastically scattered photons reach the detector are stored in a matrix. (C) Synchronization of the time-of-flight data acquisition card to the scanning stage inside the interferometer not only allows for the detection of the arrival time ti of each individual photon but also their frequency. Overall, this leads to a spin-wave intensity as a function of the four dimensional data set of time, frequency, and space.
The duration as well as the repetition rate of the microwave pulses is set via a pulse generator that also triggers a time-of-flight data acquisition card in the computer which controls the measurement. Thus, the pulse generator also defines the starting time t0 of the experiment. During the measurement process, the data acquisition card detects the times ti at which inelastically scattered photons reach the detector inside the interferometer. Thus, each detected photon and the associated time ti are stored in a matrix as can be seen in Figure 14B. The counts of subsequent pulses are added up so that long accumulation times allow for the observation of the temporal evolution.
By synchronizing the time-of-flight data acquisition card to the scanning stage inside the interferometer, it is possible to not only detect the time of arrival ti of the individual photons but also their frequencies. This means that the time-resolved signal is not integrated over the entire measured frequency range, but that each frequency channel in the spin-wave spectrum is measured with time resolution as is illustrated in Figure 14C. For a spatially resolved measurement, this leads to an intensity depending on a four dimensional data set (time, frequency, and space) and, accordingly, to a very large number of detected BLS spectra. This implies, that one has to consider carefully what information should be acquired with a certain measurement and how to define its parameters. The control of all components needed for this time-resolved BLS setup as well as the data acquisition are fully embedded in the software package TFPDAS to allow for automated, complex measurements with additional peripheral devices as described in the previous sections.
To illustrate the working principle of time-resolved BLS, we discuss the temporal evolution of a two-dimensional spin-wave packet in a 7-μm thick yttrium iron garnet film propagating along the direction of the externally applied magnetic field [56]. This example not only illustrates time-resolved BLS but also the nonlinear self-focusing of a spin-wave packet. The results of the space- and time-resolved investigation are summarized in Figure 15A. Upon scanning two-dimensional intensity maps of a spin-wave pulse excited at a fixed frequency for different delays, it is possible to map the spatial and temporal evolution of a self-generated wave packet propagating in z-direction. As can be seen, the intrinsic nonlinearity of the system leads to the self-focusing of the excited spin-wave packet in both in-plane directions with the smallest spread observed at t = 63 ns. After t = 63 ns, the weak linear dissipation in the medium stops the ongoing self-focusing and the potential collapse of the so-called bullet. From now on, the reduction in the spin-wave amplitude and, thus, the decreased nonlinear self-focusing is overcompensated by diffraction which results in the spread of the spatial profile.
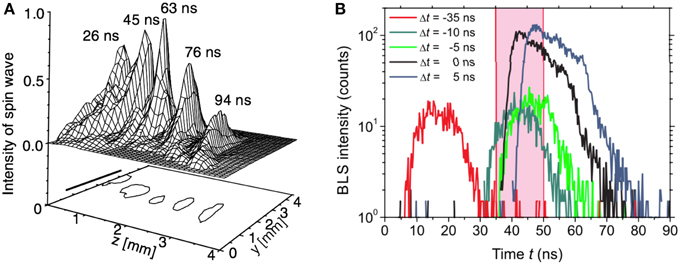
Figure 15. (A) Temporal evolution of the self-focusing of a two-dimensional spin-wave bullet in an yttrium iron garnet film [56]. (B) Time-resolved BLS measurement of spin-wave pulses amplified via parametric pumping in a microstructured Ni81Fe19 waveguide [124].
An example for time-resolved BLS microscopy can be found in Brächer et al. [124]. In this experiment, Brächer et al. demonstrated the active amplification of propagating spin waves in a Ni81Fe19 waveguide using parametric pumping. In most metallic ferromagnets, the rather large Gilbert damping limits the propagation distance of spin-wave modes. Even though recent developments aiming at the utilization of novel or optimized materials in the field of magnonics show great potential [51, 125–128], spin-wave damping remains a major challenge.
Thus, the active amplification of spin waves is an interesting research field. Possible ways to amplify spin waves are the STT effect in layered structures consisting of magnetic materials and metals with a large spin-Hall-angle or the parametric amplification of spin waves via dynamic magnetic pumping fields. A thorough discussion of the parametric amplification is beyond the scope of this article. Therefore, we refer to additional literature that discusses this phenomenon in detail [29, 129–131].
In the actual experimental scenario, spin-wave pulses are generated by a strip-line antenna and propagate along the waveguide that is magnetized perpendicularly to its long axis. At a distance of 10 μm from the antenna, this spin-wave pulse enters an area where spin waves are parametrically amplified by the application of a local pumping field. Brächer and co-workers studied how the intensity of the spin-wave pulse evolves in time at a position behind the pumping area for different delays Δt between the excitation of the spin-wave pulse and the application of the pumping field. The results are presented in Figure 15B. As long as the pumping field is applied before the initial spin-wave pulse enters the pumping region (Δt < 0), only a parasitic spin-wave pulse can be observed. This signal originates from the amplification of thermally activated spin waves within the pumping area. No active amplification of the propagating spin-wave pulse takes place. However, if the initial spin-wave pulse enters the pumping area just when the pumping starts (Δt = 0), its intensity is increased by one order of magnitude. Thus, amplification can only be achieved for delays Δt ⩾ 0, i.e., if the pumping field is switched on just when or after the spin-wave pulse enters the pumping region.
These two examples nicely show the potential of time-resolved BLS experiments for mapping the temporal evolution of spin-wave pulses in complex systems.
Conflict of Interest Statement
The authors declare that the research was conducted in the absence of any commercial or financial relationships that could be construed as a potential conflict of interest.
Acknowledgments
We would like to acknowledge the following persons for their support and contributions in the realization and the development of state-of-the-art BLS spectroscopy and microscopy: J. R. Sandercock, M. Bauer, J. Jorzick, C. E. Patton, M. Madami and G. Gubbiotti.
Footnotes
2. ^www.tfpdas.de.
References
1. Hillebrands B. Progress in multipass tandem Fabry – Perot interferometry: I. A fully automated, easy to use, self-aligning spectrometer with increased stability and flexibility. Rev Sci Instrum. (1999) 70:1589. doi: 10.1063/1.1149637
2. Kruglyak VV, Demokritov SO, Grundler D. Magnonics. J Phys. (2010) 43:264001. doi: 10.1088/0022-3727/43/26/264001
3. Serga AA, Chumak AV, Hillebrands B. YIG magnonics. J Phys. (2010) 43:264002. doi: 10.1088/0022-3727/43/26/264002
4. Neusser S, Grundler D. Magnonics: spin waves on the nanoscale. Adv Mater. (2009) 21:2927–32. doi: 10.1002/adma.200900809
5. Lenk B, Ulrichs H, Garbs F, Münzenberg M. The building blocks of magnonics. Phys Rep. (2011) 507:107–36. doi: 10.1016/j.physrep.2011.06.003
6. Demokritov SO, Slavin AN. Magnonics: From Fundamentals to Applications. Berlin; Heidelberg: Springer-Verlag (2012).
7. Hoffmann A, Schultheiss H. Mesoscale magnetism. Curr Opin Solid State Mater Sci. (2014) 1–11. doi: 10.1016/j.cossms.2014.11.004
8. Griffiths J. Anomalous high-frequency resistance of ferromagnetic metals. Nature (1946) 158:670–671. doi: 10.1038/158670a0
9. Kittel C. On the theory of ferromagnetic resonance absorption. Phys Rev. (1948) 73:155. doi: 10.1103/PhysRev.73.155
10. Farle M. Ferromagnetic resonance of ultrathin metallic layers. Rep Prog Phys. (1998) 61:755–826. doi: 10.1088/0034-4885/61/7/001
11. Kalarickal SS, Krivosik P, Wu M, Patton CE, Schneider ML, Kabos P, et al. Ferromagnetic resonance linewidth in metallic thin films: comparison of measurement methods. J Appl Phys. (2006) 99:093909. doi: 10.1063/1.2197087
12. Fleury P, Porto S, Cheesman L, Guggenheim H. Light Scattering by Spin Waves in FeF2. Phys Rev Lett. (1966) 17:84–7. doi: 10.1103/PhysRevLett.17.84
13. Sandercock JR. Brillouin scattering of SbSi using a double-passed stabilized scanning interferometer. Opt Commun. (1970) 2:73. doi: 10.1016/0030-4018(70)90047-7
14. Sandercock J, Wettling W. Light scattering from thermal Magnons in Fe and Ni. IEEE Trans Magn. (1978) 14:442–4. doi: 10.1109/TMAG.1978.1059895
15. Grimsditch M, Malozemoff A, Brunsch A. Standing spin waves observed by Brillouin scattering in amorphous metallic Fe80B20 films. Phys Rev Lett. (1979) 43:711–4. doi: 10.1103/PhysRevLett.43.711
16. van Kampen M, Jozsa C, Kohlhepp J, LeClair P, Lagae L, de Jonge W, et al. All-optical probe of coherent spin waves. Phys Rev Lett. (2002) 88:227201. doi: 10.1103/PhysRevLett.88.227201
17. Acremann Y, Back C, Buess M, Portmann O, Vaterlaus A, Pescia D, et al. Imaging precessional motion of the magnetization vector. Science (2000) 290:492–5. doi: 10.1126/science.290.5491.492
18. Buess M, Hollinger R, Haug T, Perzlmaier K, Krey U, Pescia D, et al. Fourier transform imaging of spin vortex eigenmodes. Phys Rev Lett. (2004) 93:077207. doi: 10.1103/PhysRevLett.93.077207
19. Wegener W, Scheerlinck D, Legrand E, Hautecler S, Brabers V. Inelastic neutron scattering study of acoustical magnons in MnFe2O4. Solid State Commun. (1974) 15:345–9. doi: 10.1016/0038-1098(74)90773-X
20. Wolfram T, Ellialtioglu S. Neutron scattering by magnons of an antiferromagnet with modulated spin amplitudes. Phys Rev Lett. (1980) 44:1295–8. doi: 10.1103/PhysRevLett.44.1295
21. Zhang Y, Buczek P, Sandratskii L, Tang W, Prokop J, Tudosa I, et al. Nonmonotonic thickness dependence of spin wave energy in ultrathin Fe films: experiment and theory. Phys Rev B (2010) 81:094438. doi: 10.1103/PhysRevB.81.094438
22. Schultheiss H, Pearson JE, Bader SD, Hoffmann A. Thermoelectric detection of spin waves. Phys Rev Lett. (2012) 109:237204. doi: 10.1103/PhysRevLett.109.237204
23. Zhang Z, Hammel P, Wigen P. Observation of ferromagnetic resonance in a microscopic sample using magnetic resonance force microscopy. Appl Phys Lett. (1996) 68:2005–7. doi: 10.1063/1.115619
24. Adur R, Du C, Wang H, Manuilov SA, Bhallamudi VP, Zhang C, et al. Damping of confined modes in a ferromagnetic thin insulating film: angular momentum transfer across a nanoscale field-defined interface. Phys Rev Lett. (2014) 113:176601. doi: 10.1103/PhysRevLett.113.176601
25. Mewes T, Kim J, Pelekhov D, Kakazei G, Wigen P, Batra S, et al. Ferromagnetic resonance force microscopy studies of arrays of micron size permalloy dots. Phys Rev B (2006) 74:144424–26. doi: 10.1103/PhysRevB.74.144424
26. Tserkovnyak Y, Brataas A, Bauer G. Spin pumping and magnetization dynamics in metallic multilayers. Phys Rev B (2002) 66:224403. doi: 10.1103/PhysRevB.66.224403
28. Ando K, kajiwara Y, Takahashi S, Maekawa S, Takemoto K, Takatsu M, et al. Angular dependence of inverse spin–Hall effect induced by spin pumping investigated in a Ni[sub 81]Fe[sub 19]/Pt thin film. Phys Rev B (2008) 78:014413–16. doi: 10.1103/PhysRevB.78.014413
29. Sandweg CW, Kajiwara Y, Chumak AV, Serga AA, Vasyuchka VI, Jungfleisch MB, et al. Spin pumping by parametrically excited exchange magnons. Phys Rev Lett. (2011) 106:216601. doi: 10.1103/PhysRevLett.106.216601
30. Jungfleisch MB, Chumak AV, vasyuchka VI, Serga AA, Obry B, Schultheiss H, et al. Temporal evolution of inverse spin hall effect voltage in a magnetic insulator-nonmagnetic metal structure. Appl Phys Lett. (2011) 99:182512. doi: 10.1063/1.3658398
31. Mosendz O, Pearson J, Fradin F, Bauer G, Bader S, Hoffmann A. Quantifying spin hall angles from spin pumping: experiments and theory. Phys Rev Lett. (2010) 104:046601. doi: 10.1103/PhysRevLett.104.046601
32. Weiler M, Althammer M, Schreier M, Lotze J, Pernpeintner M, Meyer S, et al. Experimental test of the spin mixing interface conductivity concept. Phys Rev Lett. (2013) 111:176601. doi: 10.1103/PhysRevLett.111.176601
33. Hoffmann A. Spin hall effects in metals. IEEE Trans Magn. (2013) 49:5172–93. doi: 10.1109/TMAG.2013.2262947
34. Hillebrands B, Baumgart P, Güntherodt G. In situ Brillouin scattering from surface-anisotropy-dominated damon–eshbach modes in ultrathin epitaxial Fe (110) layers. Phys Rev B (1987) 36:2450.
35. Cochran J, Dutcher J. Light scattering from thermal magnons in thin metallic ferromagnetic films. J Appl Phys. (1988) 63:3814–16. doi: 10.1063/1.340623
36. Cochran J. Ultrathin Magnetic Structures II: Light Scattering from Ultrathin Magnetic Layers and Bilayers. Berlin; Heidelberg: Springer-Verlag (1994).
37. Banholzer A, Narkowicz R, Hassel C, Meckenstock R, Stienen S, Posth O, et al. Visualization of spin dynamics in single nanosized magnetic elements. Nanotechnology (2011) 22:295713. doi: 10.1088/0957-4484/22/29/295713
38. Gurevich A, Melkov G. Magnetization Oscillations and Waves. CRC Press (1996). Available online at: http://books.google.com/books?hl=en&lr=&id=YgQtSvFIvFQC&oi=fnd&pg=PR9&dq=Magnetization+Oscillations+Waves&ots=Ptq5EAvcP4&sig=GGWX2__uxp4FDmBwB51MzWBwo3o
40. Hillebrands B, Ounadjela K. Spin Dynamics in Confined Magnetic Structures I. Berlin; Heidelberg: Springer-Verlag (2002).
41. Hillebrands B, Ounadjela K. Spin Dynamics in Confined Magnetic Structures II. Berlin; Heidelberg: Springer-Verlag (2003).
42. Hillebrands B, Thiaville A. Spin Dynamics in Confined Magnetic Structures III. Berlin; Heidelberg: Springer-Verlag (2006).
43. Jorzick J, Demokritov SO, Mathieu C, Hillebrands B, Bartenlian B, Chappert C, et al. Brillouin light scattering from quantized spin waves in micron-size magnetic wires. Phys Rev B (1999) 60:15194. doi: 10.1103/PhysRevB.60.15194
44. Mathieu C, Jorzick J, Frank A, Demokritov SO, Slavin A, Hillebrands B, et al. Lateral quantization of spin waves in micron size magnetic wires. Phys Rev Lett. (1998) 81:3968–71. doi: 10.1103/PhysRevLett.81.3968
45. Sandweg CW, Jungfleisch MB, Vasyuchka VI, Serga AA, Clausen P, Schultheiss H, et al. Wide-range wavevector selectivity of magnon gases in Brillouin light scattering spectroscopy. Rev Sci Instrum. (2010) 81:073902. doi: 10.1063/1.3454918
46. Vogt K, Schultheiss H, Jain S, Pearson JE, Hoffmann A, Bader SD, et al. Spin waves turning a corner. Appl Phys Lett. (2012) 101:042410. doi: 10.1063/1.4738887
47. Vogt K, Fradin F, Pearson J, Sebastian T, Bader S, Hillebrands B, et al. Realization of a spin-wave multiplexer. Nat Commun. (2014) 5:3727. doi: 10.1038/ncomms4727
48. Veerakumar V, Camley R. Magnon focusing in thin ferromagnetic films. Phys Rev B (2006) 74:214401. doi: 10.1103/PhysRevB.74.214401
49. Demidov VE, Demokritov SO, Birt D, O'Gorman B, Tsoi M, Li X. Radiation of spin waves from the open end of a microscopic magnetic-film waveguide. Phys Rev B. (2009) 80:014429. doi: 10.1103/PhysRevB.80.014429
50. Schneider T, Serga AA, Chumak AV, Sandweg CW, Trudel S, Wolff S, et al. Nondiffractive subwavelength wave beams in a medium with externally controlled anisotropy. Phys Rev Lett. (2010) 104:197203. doi: 10.1103/PhysRevLett.104.197203
51. Sebastian T, Brächer T, Pirro P, Serga A, Hillebrands B, Kubota T, et al. Nonlinear emission of spin-wave caustics from an edge mode of a microstructured Co2Mn0.6Fe0.4Si waveguide. Phys Rev Lett. (2013) 110:067201. doi: 10.1103/PhysRevLett.110.067201
52. Hillebrands B. Spin-wave calculations for multilayered structures. Phys Rev B. (1990) 41:530–40. doi: 10.1103/PhysRevB.41.530
53. Kalinikos B, Slavin A. Theory of dipole-exchange spin wave spectrum for ferromagnetic films with mixed exchange boundary conditions. J Phys C (1986) 19:7013. doi: 10.1088/0022-3719/19/35/014
54. Demokritov SO, Serga AA, Demidov VE, Hillebrands B, Kostylev M, Kalinikos B. Experimental observation of symmetry-breaking nonlinear modes in an active ring. Nature (2003) 426:159–62. doi: 10.1038/nature02042
55. Demokritov SO, Demidov VE, Dzyapko O, Melkov GA, Serga AA, Hillebrands B, et al. Bose–einstein condensation of quasi-equilibrium magnons at room temperature under pumping. Nature (2006) 443:430–3. doi: 10.1038/nature05117
56. Serga AA, Demokritov SO, Hillebrands B, Slavin AN. Self-generation of two-dimensional spin-wave bullets. Phys Rev Lett. (2004) 92:117203. doi: 10.1103/PhysRevLett.92.117203
57. Kostylev M, Serga AA, Hillebrands B. Radiation of caustic beams from a collapsing bullet. Phys Rev Lett. (2011) 106:134101. doi: 10.1103/PhysRevLett.106.134101
58. Schultheiss H, Vogt K, Hillebrands B. Direct observation of nonlinear four-magnon scattering in spin-wave microconduits. Phys Rev B (2012) 86:054414. doi: 10.1103/PhysRevB.86.054414
59. Serga AA, Tiberkevich VS, Sandweg CW, Vasyuchka VI, Bozhko DA, Chumak AV, et al. Bose–einstein condensation in an ultra-hot gas of pumped magnons. Nat Commun. (2014) 5:3452. doi: 10.1038/ncomms4452
60. Pirro P, Sebastian T, Brächer T, Serga AA, Kubota T, Naganuma H, et al. Non-gilbert-damping mechanism in a ferromagnetic heusler compound probed by nonlinear spin dynamics. Phys Rev Lett. (2014) 113:227601. doi: 10.1103/PhysRevLett.113.227601
61. Demokritov SO, Hillebrands B, Slavin A. Brillouin light scattering studies of confined spin waves: linear and nonlinear confinement. Phys Rep. (2001) 348:441–89. doi: 10.1016/S0370-1573(00)00116-2
62. Shen Y, Bloembergen N. Interaction between Light waves and spin waves. Phys Rev. (1966) 143:372–84. doi: 10.1103/PhysRev.143.372
63. Wettling MGC, Sandercock JR. The relation between one-magnon light scattering and the complex magneto-optic effects in YIG. J Phys C (1975) 8:211–28.
64. Cochran J, Dutcher J. Calculation of the intensity of light scattered from magnons in thin films. J Magn Magn Mater. (1988) 73:299–310. doi: 10.1016/0304-8853(88)90095-9
65. Cochran J. Brillouin light scattering intensities for patterned magnetic thin films. J Magn Magn Mater. (2000) 212:40–52. doi: 10.1016/S0304-8853(99)00816-1
66. Serga AA, Sandweg CW, Vasyuchka VI, Jungfleisch MB, Hillebrands B, Kreisel A, et al. Brillouin light scattering spectroscopy of parametrically excited dipole-exchange magnons. Phys Rev B (2012) 86:134403. doi: 10.1103/PhysRevB.86.134403
67. Hillebrands B. Calculation of spin waves in multilayered structures including interface anisotropies and exchange contributions. Phys Rev B (1988) 37:9885–8. doi: 10.1103/PhysRevB.37.9885
68. Kubota T, Hamrle J, Sakuraba Y, Gaier O, Oogane M, Sakuma A, et al. Structure, exchange stiffness, and magnetic anisotropy of Co2MnAlxSi1−x Heusler compounds. J Appl Phys. (2009) 106:113907. doi: 10.1063/1.3265428
69. Hamrle J, Gaier O, Min SG, Hillebrands B, Sakuraba Y, Ando Y. Determination of exchange constants of Heusler compounds by Brillouin light scattering spectroscopy: application to Co2MnSi. J Phys. (2009) 42:084005. doi: 10.1088/0022-3727/42/8/084005
70. Nembach HT, Shaw JM, Weiler M, Jué E, Silva TJ. Spectroscopic confirmation of linear relation between Heisenberg- and interfacial Dzyaloshinskii – Moriya – exchange in polycrystalline metal films. (2014) arXiv:1410.6243v1.
71. Jersch J, Demidov VE, Fuchs H, Rott K, Krzysteczko P, Münchenberger J, et al. Mapping of localized spin-wave excitations by near-field Brillouin light scattering. Appl Phys Lett. (2010) 97:152502. doi: 10.1063/1.3502599
72. Schultheiss H, Schäfer S, Candeloro P, Leven B, Hillebrands B, Slavin A. Observation of coherence and partial decoherence of quantized spin waves in nanoscaled magnetic ring structures. Phys Rev Lett. (2008) 100:047204. doi: 10.1103/PhysRevLett.100.047204
73. Hertel R, Wulfhekel W, Kirschner J. Domain-wall induced phase shifts in spin waves. Phys Rev Lett. (2004) 93:257202. doi: 10.1103/PhysRevLett.93.257202
74. Kostylev M, Serga AA, Schneider T, Leven B, Hillebrands B. Spin-wave logical gates. Appl Phys Lett. (2005) 87:153501. doi: 10.1063/1.2089147
75. Schneider T, Serga A, leven B, Hillebrands B, Stamps RL, Kostylev M. Realization of spin-wave logic gates. Appl Phys Lett. (2008) 92:022505–3. doi: 10.1063/1.2834714
76. Lee KS, Kim SK. Conceptual design of spin wave logic gates based on a Mach–Zehnder-type spin wave interferometer for universal logic functions. J Appl Phys. (2008) 104:053909. doi: 10.1063/1.2975235
77. Schneider T, Serga AA, Hillebrands B, Kostylev M. Spin-wave ferromagnetic film combiner as a NOT logic gate. J Nanoelectron Optoe. (2008) 3:69–71. doi: 10.1166/jno.2008.010
78. Khitun A, Bao M, Wang KL. Spin wave magnetic NanoFabric: a new approach to spin-based logic circuitry. IEEE Trans Magn. (2008) 44:2141–52. doi: 10.1109/TMAG.2008.2000812
79. Hansen UH, Demidov VE, Demokritov SO. Dual-function phase shifter for spin-wave logic applications. Appl Phys Lett. (2009) 94:252502–3. doi: 10.1063/1.3159628
80. Klingler S, Pirro P, Brächer T, Leven B, Hillebrands B, Chumak AV. Design of a spin-wave majority gate employing mode selection. Appl Phys Lett. (2014) 105:152410. doi: 10.1063/1.4898042
81. Chumak AV, Serga AA, Hillebrands B. Magnon transistor for all-magnon data processing. Nat Commun. (2014) 5:4700. doi: 10.1038/ncomms5700
82. Pirro P, Brächer T, Vogt K, Obry B, Schultheiss H, Leven B, et al. Interference of coherent spin waves in micron-sized ferromagnetic waveguides. Phys Status Solidi B (2011) 248:2404–8. doi: 10.1002/pssb.201147093
83. Demidov VE, Demokritov SO, Rott K, Krzysteczko P, Reiss G. Nano-optics with spin waves at microwave frequencies. Appl Phys Lett. (2008) 92:232503. doi: 10.1063/1.2945000
84. Obry B, Pirro P, Brächer T, Chumak AV, Osten J, Ciubotaru F, et al. A micro-structured ion-implanted magnonic crystal. Appl Phys Lett. (2013) 102:202403. doi: 10.1063/1.4807721
85. Chumak AV, Pirro P, Serga AA, Kostylev M, Stamps RL, Schultheiss H, et al. Spin-wave propagation in a microstructured magnonic crystal. Appl Phys Lett. (2009) 95:262508–3. doi: 10.1063/1.3279138
86. Gubbiotti G, Tacchi S, Madami M, Carlotti G, Adeyeye A, Kostylev M. Brillouin light scattering studies of planar metallic magnonic crystals. J Phys. (2010) 43:264003. doi: 10.1088/0022-3727/43/26/264003
87. Chumak AV, Tiberkevich VS, Karenowska AD, Serga AA, Gregg JF, Slavin AN, et al. All-linear time reversal by a dynamic artificial crystal. Nat Commun. (2010) 1:141. doi: 10.1038/ncomms1142
88. Yu H, Duerr G, Huber R, Bahr M, Schwarze T, Brandl F, et al. Omnidirectional spin-wave nanograting coupler. Nat Commun. (2013) 4:2702. doi: 10.1038/ncomms3702
89. Fassbender J, Strache T, Liedke MO, Marko D, Wintz S, Lenz K, et al. Introducing artificial length scales to tailor magnetic properties. New J Phys. (2009) 11:125002. doi: 10.1088/1367-2630/11/12/125002
90. Obry B, Meyer T, Pirro P, Brächer T, Lägel B, Osten J, et al. Microscopic magnetic structuring of a spin-wave waveguide by ion implantation in a Ni81Fe19 layer. Appl Phys Lett. (2013) 102:022409. doi: 10.1063/1.4775759
91. Clausen P, Vogt K, Schultheiss H, Schäfer S, Obry B, Wolf G, et al. Mode conversion by symmetry breaking of propagating spin waves. Appl Phys Lett. (2011) 99:162505. doi: 10.1063/1.3650256
92. Brächer T, Pirro P, Westermann J, Sebastian T, Lägel B, Van de Wiele B, et al. Generation of propagating backward volume spin waves by phase-sensitive mode conversion in two-dimensional microstructures. Appl Phys Lett. (2013) 102:132411. doi: 10.1063/1.4800005
93. Demidov V, Kostylev M, Rott K, Krzysteczko P, Reiss G, Demokritov S. Generation of the second harmonic by spin waves propagating in microscopic stripes. Phys Rev B (2011) 83:054408. doi: 10.1103/PhysRevB.83.054408
94. Bayer C, Park J, Wang H, Yan M, Campbell C, Crowell P. Spin waves in an inhomogeneously magnetized stripe. Phys Rev B (2004) 69:134401. doi: 10.1103/PhysRevB.69.134401
95. Gubbiotti G, Conti M, Carlotti G, Candeloro P, Fabrizio ED, Guslienko KY, et al. Magnetic field dependence of quantized and localized spin wave modes in thin rectangular magnetic dots. J Phys Condens Matter. (2004) 16:7709–7721. doi: 10.1088/0953-8984/16/43/011
96. Sebastian T, Ohdaira Y, Kubota T, Pirro P, Brächer T, Vogt K, et al. Low-damping spin-wave propagation in a micro-structured Co2Mn0.6Fe0.4Si Heusler waveguide. Appl Phys Lett. (2012) 100:112402. doi: 10.1063/1.3693391
97. Kubota T, Tsunegi S, Oogane M, Mizukami S, Miyazaki T, Naganuma H, et al. Half-metallicity and Gilbert damping constant in Co2Mn0.6Fe0.4Si Heusler alloys depending on the film composition. Appl Phys Lett. (2009) 94:122504. doi: 10.1063/1.3105982
98. Oogane M, Kubota T, Kota Y, Mizukami S, Naganuma H, Sakuma A, et al. Gilbert magnetic damping constant of epitaxially grown Co-based Heusler alloy thin films. Appl Phys Lett. (2010) 96:252501. doi: 10.1063/1.3456378
99. Trudel S, Gaier O, Hamrle J, Hillebrands B. Magnetic anisotropy, exchange and damping in cobalt-based full-Heusler compounds: an experimental review. J Phys. (2010) 43:193001. doi: 10.1088/0022-3727/43/19/193001
100. Berger L. Emission of spin waves by a magnetic multilayer traversed by a current. Phys Rev B (1996) 54:9353–8. doi: 10.1103/PhysRevB.54.9353
101. Slonczewski JC. Current-driven excitation of magnetic multilayers. J Magn Magn Mater. (1996) 159:L1–7. doi: 10.1016/0304-8853(96)00062-5
102. Katine JA, Albert F, Buhrman R, Myers E, Ralph DC. Current-driven magnetization reversal and spin-wave excitations in Co/Cu/Co pillars. Phys Rev Lett. (2000) 84:3149–52. doi: 10.1103/PhysRevLett.84.3149
103. Kiselev S, Sankey JC, Krivorotov I, Emley N, Schoelkopf R, Buhrman R, et al. Microwave oscillations of a nanomagnet driven by a spin-polarized current. Nature (2003) 425:380–3. doi: 10.1038/nature01967
104. Krivorotov I, Emley N, Sankey JC, Kiselev S, Ralph DC, Buhrman R. Time-domain measurements of nanomagnet dynamics driven by spin-transfer torques. Science (2005) 307:228–31. doi: 10.1126/science.1105722
105. Slavin AN, Tiberkevich VS. Nonlinear auto-oscillator theory of microwave generation by spin-polarized current. IEEE Trans Magn. (2009) 45:1875–918. doi: 10.1109/TMAG.2008.2009935
106. Schultheiss H, Janssens X, van Kampen M, Ciubotaru F, Hermsdoerfer S, Obry B, et al. Direct current control of three magnon scattering processes in spin-valve nanocontacts. Phys Rev Lett. (2009) 103:157202–4. doi: 10.1103/PhysRevLett.103.157202
107. Madami M, Bonetti S, Consolo G, Tacchi S, Carlotti G, Gubbiotti G, et al. Direct observation of a propagating spin wave induced by spin-transfer torque. Nat Nanotechnol. (2011) 6:635–8. doi: 10.1038/nnano.2011.140
108. Urazhdin S, Demidov V, Ulrichs H, Kendziorczyk T, Kuhn T, Leuthold J, et al. Nanomagnonic devices based on the spin-transfer torque. Nat Nanotechnol. (2014) 9:509–13. doi: 10.1038/nnano.2014.88
109. Kaka S, Pufall MR, Rippard WH, Silva TJ, Russek SE, Katine JA. Mutual phase-locking of microwave spin torque nano-oscillators. Nature (2005) 437:389–92. doi: 10.1038/nature04035
110. Mancoff F, Rizzo N, Engel B, Tehrani S. Phase-locking in double-point-contact spin-transfer devices. Nature (2005) 437:393–5. doi: 10.1038/nature04036
111. Macià F, Kent AD, Hoppensteadt FC. Spin-wave interference patterns created by spin-torque nano-oscillators for memory and computation. Nanotechnology (2011) 22:095301. doi: 10.1088/0957-4484/22/9/095301
112. Demidov VE, Urazhdin S, Demokritov SO. Direct observation and mapping of spin waves emitted by spin-torque nano-oscillators. Nat Mater. (2010) 9:984. doi: 10.1038/nmat2882
113. Bonetti S, Puliafito V, Consolo G, Tiberkevich VS, Slavin AN, Åkerman J. Power and linewidth of propagating and localized modes in nanocontact spin-torque oscillators. Phys Rev B (2012) 85:174427. doi: 10.1103/PhysRevB.85.174427
114. Demidov VE, Urazhdin S, Ulrichs H, Tiberkevich VS, Slavin AN, Baither D, et al. Magnetic nano-oscillator driven by pure spin current. Nat Mater. (2012) 11:1028–1031. doi: 10.1038/nmat3459
115. Duan Z, Smith A, Yang L, Youngblood B, Lindner J, Demidov VE, et al. Nanowire spin torque oscillator driven by spin orbit torques. Nat Commun. (2014) 5:5616. doi: 10.1038/ncomms6616
116. Madami M, Gubbiotti G, Moriyama T, Tanaka K, Siracusano G, Carpentieri M, et al. Micro-focused Brillouin light scattering study of the magnetization dynamics driven by spin hall effect in a transversely magnetized NiFe nanowire. J Appl Phys. (2015) 117:17D504. doi: 10.1063/1.4907612
117. Liu L, Pai CF, Ralph DC, Buhrman RA. Magnetic oscillations driven by the spin hall effect in 3-terminal magnetic tunnel junction devices. Phys Rev Lett. (2012) 109:186602. doi: 10.1103/PhysRevLett.109.186602
118. Serga AA, Schneider T, Hillebrands B, Demokritov SO, Kostylev M. Phase-sensitive Brillouin light scattering spectroscopy from spin-wave packets. Appl Phys Lett. (2006) 89:063506. doi: 10.1063/1.2335627
119. Fohr F, Serga AA, Schneider T, Hamrle J, Hillebrands B. Phase sensitive Brillouin scattering measurements with a novel magneto-optic modulator. Rev Sci Instrum. (2009) 80:043903. doi: 10.1063/1.3115210
120. Vogt K, Schultheiss H, Hermsdoerfer S, Pirro P, Serga AA, Hillebrands B. All-optical detection of phase fronts of propagating spin waves in a Ni81Fe19 microstripe. Appl Phys Lett. (2009) 95:182508–3.
121. Demidov VE, Urazhdin S, Demokritov SO. Control of spin-wave phase and wavelength by electric current on the microscopic scale. Appl Phys Lett. (2009) 95:262509. doi: 10.1063/1.3279152
122. Bütner O, Bauer M, Demokritov SO, Hillebrands B, Kivshar Y, Grimalsky V, et al. Spatial and spatiotemporal self-focusing of spin waves in garnet films observed by space- and time-resolved Brillouin light scattering. J Appl Phys (2000) 87:5088–90. doi: 10.1063/1.373257
123. Schultheiss H, Sandweg CW, Obry B, Hermsdörfer S, Schäfer S, leven B, et al. Dissipation characteristics of quantized spin waves in nano-scaled magnetic ring structures. J Phys. (2008) 41:164017. doi: 10.1088/0022-3727/41/16/164017
124. Brächer T, Heussner F, Pirro P, Fischer T, Geilen M, Heinz B, et al. Time- and power-dependent operation of a parametric spin-wave amplifier. Appl Phys Lett. (2014) 105:232409. doi: 10.1063/1.4904078
125. Conca A, Greser J, Sebastian T, Klingler S, Obry B, Leven B, et al. Low spin-wave damping in amorphous Co40Fe40B20 thin films. J Appl Phys. (2013) 113:213909. doi: 10.1063/1.4808462
126. Pirro P, Brächer T, Chumak A, Lägel B, Dubs C, Surzhenko O, et al. Spin-wave excitation and propagation in microstructured waveguides of yttrium iron garnet/Pt bilayers. Appl Phys Lett. (2014) 104:012402. doi: 10.1063/1.4861343
127. Sun Y, Song YY, Chang H, Kabatek M, Jantz M, Schneider W, et al. Growth and ferromagnetic resonance properties of nanometer-thick yttrium iron garnet films. Appl Phys Lett. (2012) 101:152405. doi: 10.1063/1.4759039
128. Sun Y, Chang H, Kabatek M, Song YY, Wang Z, Jantz M, et al. Damping in yttrium iron garnet nanoscale films capped by platinum. Phys Rev Lett. (2013) 111:106601. doi: 10.1103/PhysRevLett.111.106601
129. Schäfer S, Kegel V, Serga AA, Hillebrands B, Kostylev MP. Variable damping and coherence in a high-density magnon gas. Phys Rev B (2011) 83:184407. doi: 10.1103/PhysRevB.83.184407
130. Brächer T, Pirro P, Obry B, Leven B, Serga AA, Hillebrands B. Mode selective parametric excitation of spin waves in a Ni81Fe19 microstripe. Appl Phys Lett. (2011) 99:162501. doi: 10.1063/1.3651506
Keywords: Brillouin light scattering, microscopy, spin waves, magnons, magnonics
Citation: Sebastian T, Schultheiss K, Obry B, Hillebrands B and Schultheiss H (2015) Micro-focused Brillouin light scattering: imaging spin waves at the nanoscale. Front. Phys. 3:35. doi: 10.3389/fphy.2015.00035
Received: 19 February 2015; Accepted: 11 May 2015;
Published: 03 June 2015.
Edited by:
Stefano Bonetti, Stockholm University, SwedenReviewed by:
Chun-Gang Duan, East China Normal University, ChinaMarco Madami, University of Perugia, Italy
Copyright © 2015 Sebastian, Schultheiss, Obry, Hillebrands and Schultheiss. This is an open-access article distributed under the terms of the Creative Commons Attribution License (CC BY). The use, distribution or reproduction in other forums is permitted, provided the original author(s) or licensor are credited and that the original publication in this journal is cited, in accordance with accepted academic practice. No use, distribution or reproduction is permitted which does not comply with these terms.
*Correspondence: Thomas Sebastian, Institute of Ion Beam Physics and Materials Research, Helmholtz-Zentrum Dresden - Rossendorf, Bautzner Landstraße 400, 01328 Dresden, Germany, t.sebastian@hzdr.de