Characterizing interactions in online social networks during exceptional events
 Elisa Omodei
 Manlio De Domenico
 Alex Arenas
- Departament d'Enginyeria Informàtica i Matemàtiques, Universitat Rovira i Virgili, Tarragona, Spain
Nowadays, millions of people interact on a daily basis on online social media like Facebook and Twitter, where they share and discuss information about a wide variety of topics. In this paper, we focus on a specific online social network, Twitter, and we analyze multiple datasets each one consisting of individuals' online activity before, during and after an exceptional event in terms of volume of the communications registered. We consider important events that occurred in different arenas that range from policy to culture or science. For each dataset, the users' online activities are modeled by a multilayer network in which each layer conveys a different kind of interaction, specifically: retweeting, mentioning and replying. This representation allows us to unveil that these distinct types of interaction produce networks with different statistical properties, in particular concerning the degree distribution and the clustering structure. These results suggests that models of online activity cannot discard the information carried by this multilayer representation of the system, and should account for the different processes generated by the different kinds of interactions. Secondly, our analysis unveils the presence of statistical regularities among the different events, suggesting that the non-trivial topological patterns that we observe may represent universal features of the social dynamics on online social networks during exceptional events.
1. Introduction
The advent of online social platforms and their usage in the last decade, with exponential increasing trend, made possible the analysis of human behavior with an unprecedented volume of data. To a certain extent, online interactions represent a good proxy for social interactions and, as a consequence, the possibility to track the activity of individuals in online social networks allows one to investigate human social dynamics [1].
More specifically, in the last years an increasing number of researchers focused on individual's activity in Twitter, a popular microblogging social platform with about 302 millions active users posting, daily, more than 500 millions messages (i.e., tweets) in 33 languages1. In traditional social science research the size of the population under investigation is very small, with increasing costs in terms of human resources and funding. Conversely, monitoring Twitter activity, as well as other online social platforms as Facebook and Foursquare to cite just some of them, dramatically reduces such costs and allows to study a larger population sample, ranging from hundreds to millions of individuals [2], within the emerging framework of computational social science [3].
The analysis of Twitter revealed that online social networks exhibit many features typical of social systems, with strongly clustered individuals within a scale-free topology [4]. Twitter data [5] has been used to validate Dunbar's theory about the theoretical cognitive limit on the number of stable social relationships [6, 7]. It has been shown that individuals tend to share ties within the same metropolitan region and that non-local ties distance, borders and language differences affect their relationships [8]. Many studies were devoted to determine which and how information flows through the network [9–12], as well as to understand the mechanisms of information spreading—e.g., as in the case of viral content—to identify influential spreaders and comprehend their role [13–17]. Attention has also been given to investigate social dynamics during emergence of protests [18], with evidences of social influence and complex contagion providing an empirical test to the recruitment mechanisms theorized in formal models of collective action [19].
Twitter allows users to communicate through small messages, using three different actions, namely mentioning, replying and retweeting. While some evidences have shown that users tend to exploit in different ways the actions made available by the Twitter platform [20], such differences have not been quantified so far. In this work, we analyze the activities of users from a new perspective and focus our attention on how individuals interact during exceptional events.
In our framework, an exceptional event is a circumstance not likely in everyday news, limited to a short amount of time—typically ranging from hours to a few days—that causes an exceptional volume of tweets, allowing to perform a significant statistical analysis of social dynamics. It is worth mentioning that fluctuations in the number of tweets, mentions, retweets, and replies among users may vary from tens up to thousands in a few minutes, depending on the event. A typical example of exceptional event is provided by the discovery of the Higgs boson in July 2012 [21], one of the greatest events in modern physics.
We use empirical data collected during six exceptional events of different type, to shed light on individual dynamics in the online social network. We use social network analysis to quantify the differences between mentioning, replying and retweeting in Twitter and, intriguingly, our findings reveal universal features of such activities during exceptional events.
2. Materials and Methods
2.1. Material
It has been recently shown that the choice of how to gather Twitter data may significantly affect the results. In fact, data obtained from a simple backward search tend to over-represents more central users, not offering an accurate picture of peripheral activity, with more relevant bias for the network of mentions [14]. Therefore, we used the streaming Application Programming Interface (API) made available by Twitter, to collect all messages posted on the social network satisfying a set of temporal and semantic constraints. More specifically, we made use of the public streaming API2 subjected to filters (keywords, hashtags or a combination of both). If the flow of tweets corresponding to the filter is smaller than 1% of the total flow on Twitter, then all tweets satisfying the filters are obtained, otherwise a warning reporting the number of missed tweets is received.
We consider different exceptional events because of their importance in different subjects, from politics to sport. More specifically, we focus on the Cannes Film Festival in 20133 (Cannes2013), the discovery of the Higgs boson in 20124 [21] (HiggsDiscovery2012), the 50th anniversary of Martin Luther King's famous public speech “I have a dream” in 20135 (MLKing2013), the 14th IAAF World Championships in Athletics held in Moscow in 20136 (MoscowAthletics2013), the “People's Climate March”—a large-scale activist event to advocate global action against climate change—held in New York in 20147 (NYClimateMarch2014) and the official visit of US President Barack Obama in Israel in 20138 (ObamaInIsrael2013).
For each event, we collected tweets sent between a starting time ti and a final time tf containing at least one keyword or hashtag, as specified in Table 1. For almost all events, we have chosen keywords and hashtag that are very specific, reducing the amount of noise (i.e., tweets that are not related to the event although they satisfy our filters). In the case of the visit of Barack Obama in Israel in 2013 we have included the more generic keyword “peace,” because in this specific context it was relevant for gathering data. However, it is worth anticipating here that our results show that the (unknown) amount of noise in this dataset did not alter the salient statistical features of the dataset.
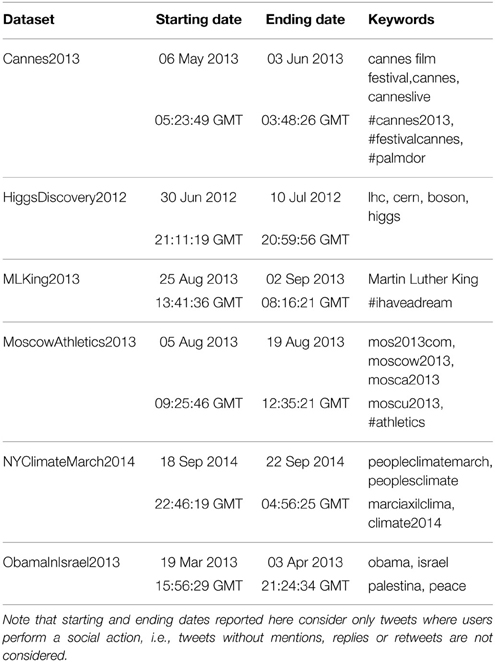
Table 1. Information about events used in this work.
Finally, we report that in a few cases we complemented a dataset by including tweets obtained from the search API (at most 5% of tweets with respect to the whole dataset) and that in the worst cases, the flow of streaming API was limited causing a loss of less than 0.5% of tweets.
2.2. Methods
To understand the dynamics of Twitter user interactions during these exceptional events, we reconstruct, for each event, a network connecting users on the basis of the retweets, mentions and replies they have been the subject or object of. In the literature on Twitter data what is usually built is the network based on the follower-followee relationships between users [4, 8, 9]. However, this kind of network only captures users' declared relations and it does not provide a good proxy for the actual interactions between them. Users, in fact, usually follow hundreds of accounts whose tweets appear in their news feed, even if there is no real interaction with the majority of those individuals. Therefore, to capture the social structure emerging from these interactions we build instead a network based on the exchanges between users, which can be deduced from the tweets that they produce. In particular, there are three kinds of interactions that can take place on Twitter and that we will focus on:
• A user can retweet (RT) another user's tweet. This means that the user is endorsing a piece of information shared by the other user, and is rebroadcasting it to her/his own followers.
• A user can reply (RP) to another user's tweet. This represents an exchange from a user to another as a reaction of the information contained in a user's tweet.
• A user can mention (MT) another user in a tweet. This represents an explicit share of a piece of information with the mentioned user.
A fourth kind of possible interaction is to favourite a user's tweet, which represents a simple endorsement of the information contained in the tweet, without rebroadcasting. However, we do not have this kind of information for this dataset and therefore we do not consider this kind of interaction.
As just discussed, each kind of activity on Twitter (retweet, reply, and mention) represents a particular kind of interaction between two users. Therefore, an appropriate framework to capture the overall structure of these interactions without loss of information about the different types is the framework of multilayer networks [22–27]. More specifically, in the case under investigation the more appropriate model is given by edge-colored graphs, particular multilayer networks where a color is assigned to different relationships—i.e., the edges—among individuals defining as many layers as the number of colors. We refer to Kivelä et al. [28] and Boccaletti et al. [29] for thorough reviews about multilayer networks.
Here, for each event, we build a multilayer network composed by L = 3 layers {RT,RP,MT}, corresponding to the three actions that users can perform in Twitter, and N nodes, being N the number of Twitter users interacting in the context of the given event. A directed edge between user i and user j on the RT layer is assigned if i retweeted j. Similarly, an edge exists on RP layer if user i replied to user j, and on MT layer if i mentioned j. An illustrative example is shown in Figure 1.
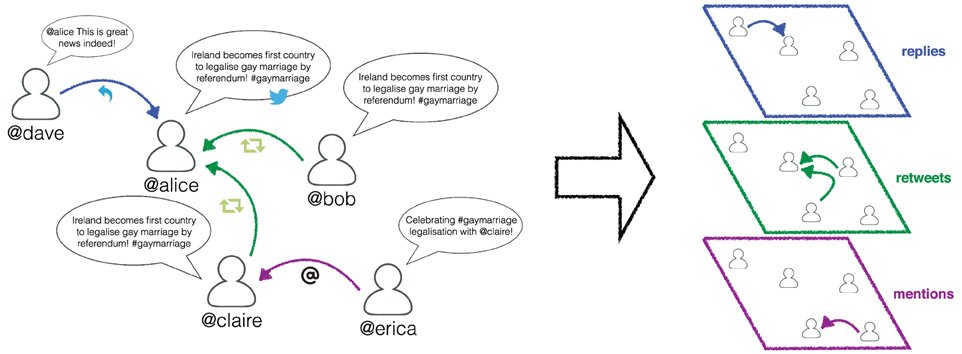
Figure 1. Illustrative example of a multilayer network representing the different interactions between Twitter users in the context of an exceptional event. Different colors are assigned to different actions.
Details about the number of nodes and edges characterizing each event are reported in Table 2. We can observe that the number of nodes and edges can vary importantly across events and across layers, but for each event and each interaction type the size of the corresponding networks is sufficient to allow a statistically significant analysis of the data.
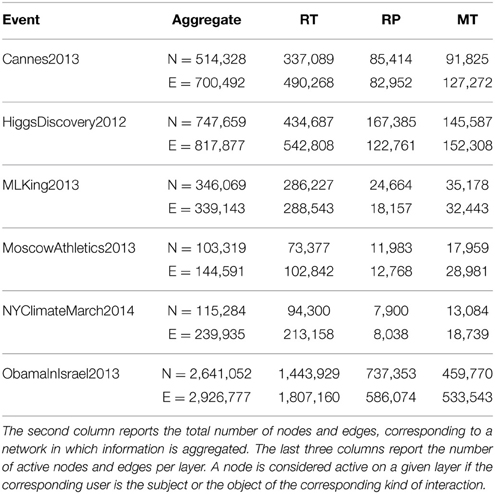
Table 2. Number of nodes and edges of the network corresponding to each event considered in this study.
3. Results
In the following we present an analysis of the networks introduced in the previous section, which is oriented at exploring two different but complementary questions.
Firstly we want to know if, within one same event, the three kinds of interactions produce different network topologies. To this aim, we consider basic multilayer and single-layer network descriptors relevant to characterize social relationships, and we study how they vary when considering different layers.
Secondly, we want to unveil if different exceptional events present any common pattern regarding users interactions. As shown in Figure 2, the temporal pattern of the different events considered in our study presents highly heterogeneous profiles. Some events are, in fact, limited to one day or only to a few hours, whereas others span over a week or more, and the profile of tweets volume varies accordingly. However, despite of these differences, do the user interactions that take place during these events present any common feature?
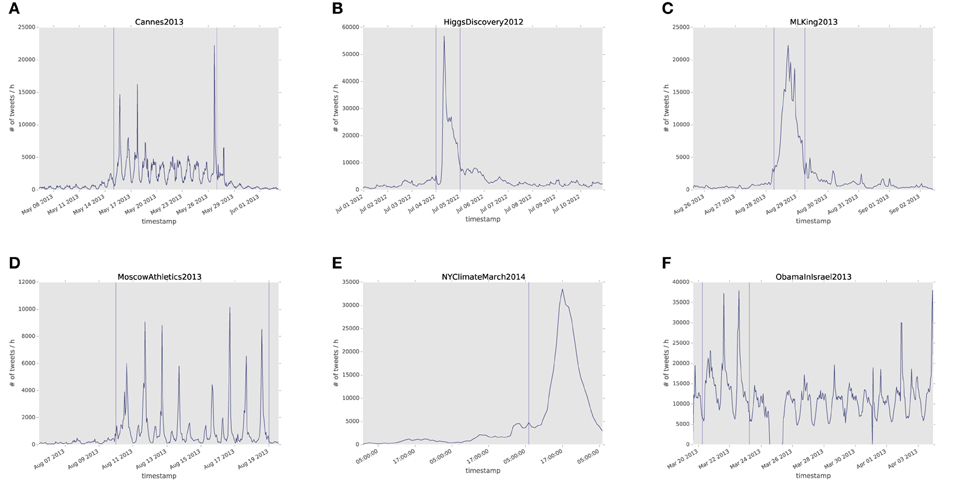
Figure 2. Volume of tweets, in units of number of messages posted per hour, over time for the six exceptional events considered in our study. In panels (A–F) we show the volume corresponding to each exceptional event reported in Table 1, respectively.
3.1. Edge Overlap Across Layers
To understand if the kinds of interaction produce similar networks or not, we analyze if users interact similarly with each other regardless of the type of activity (retweet, reply, or mention), or not. This information can be obtained by calculating the edge overlap [26, 30] between each pair of layers. However, when the number of edges is very heterogeneous across layers, a more suitable descriptor of edge overlap is given by:
where Eα (Eβ) is the set of edges belonging to layer α (β) and | · | indicates the cardinality of the set. This measure quantifies the proportion of pair-wise interactions—represented by the edges—that are common to two different layers. Because, as shown in Table 2, the number of edges can vary largely on the different layers, the normalization is given by the cardinality of the smallest set of edges, to avoid biases resulting from the size difference. The results are reported in Figure 3. Each value is obtained by averaging over the different events. The standard deviations are not shown in the figure for the sake of clarity, but are reported in Table 3. We see that, for every couple of layers, (α, β), oαβ ≪ 1. This result indicates that different layers contain different pairwise interactions, i.e., the users that we retweet are not necessarily the same that we mention or we reply to, for example. This result suggests that considering the different activities separately might be very relevant in order to understand human interaction dynamics on Twitter.
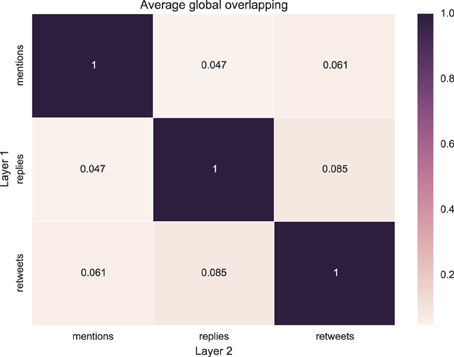
Figure 3. Heatmap representing the edge overlap between pairs of layers, averaged over the different events.
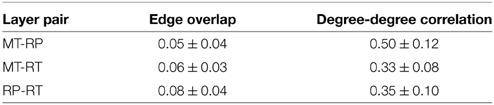
Table 3. Number of nodes and edges of the network corresponding to each event considered in this study.
3.2. Degree-degree Correlations Across Layers
In this section, we study the degree connectivity of users, the most widely studied descriptor of the structure of a network. We focus in particular on the in-degree ki, α, which quantifies the number of users who interacted with user i on layer α (α = RT, RP, and MT). This is the simplest measure of the importance of the user in the network.
First, we explore if users have the same connectivity on the different layers, or not, i.e., if the users consistently have the same degree of importance on all the layers, or not. To this aim, we compute the Spearman's rank correlation coefficient [31] between the in-degree of users on one layer and their in-degree on a different layer, for each pair of layers. The results, averaged across the different events, are reported in Figure 4, with statistical details reported in Table 3. The value of two degree-degree correlations out of three is about 0.35, and the third—and highest—correlation is 0.5. This means that users tend to have different in-degree values on the different layers, i.e., a highly retweeted user is most likely not to be mentioned or replied to by as many users. This result suggests that the different types of interaction might produce different networks and should be considered separately in realistic modeling of individual dynamics.
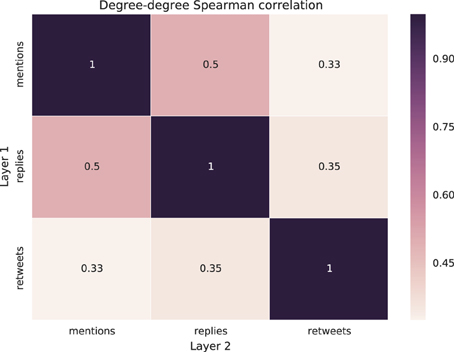
Figure 4. Heatmap representing the average degree-degree correlation between layer pairs.
3.3. Degree Distribution Per Layer
Building on the result discussed in the previous section, we also explore, for each event, the distribution of the in-degree on the different layers, separately. Intriguingly, for each layer, we find that the empirical distributions corresponding to all the exceptional events present very similar shape, as shown in Figure 5. This result suggests that individuals' communications on Twitter present some universal characteristics across very different types of events.
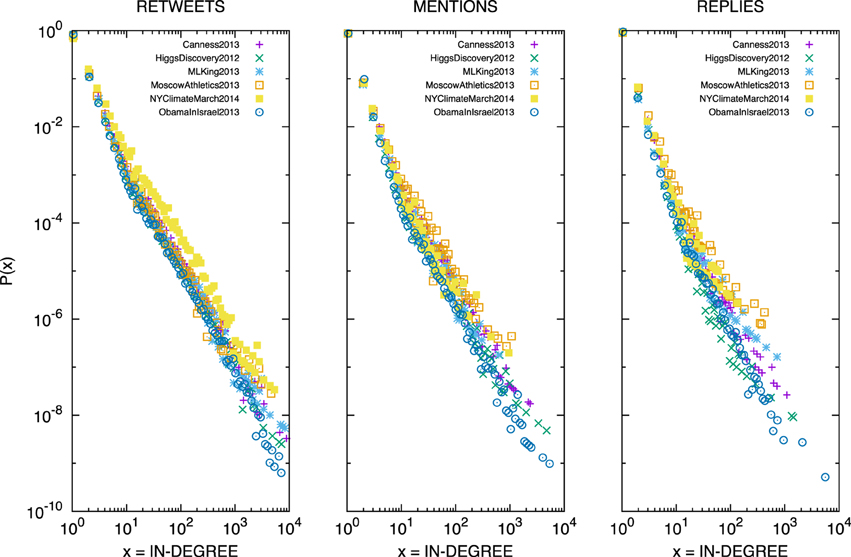
Figure 5. Distribution of the in-degree for each event considered in this study (encoded by points with different shape and color) and each layer: retweets (left), mentions (center), and replies (right).
The in-degree, shown in Figure 5, exhibits a power-law distribution for about three order of magnitudes. To validate our observation, we fit a power law to each distribution following a methodology similar to the one introduced in Clauset et al. [32]. By noticing that the in-degree is a discrete variable, we estimate the scaling exponent of a discrete power law for each empirical distribution. The goodness of fit is estimated by using the Chi Square test [33]. We find that the null hypothesis that the data is described by a discrete power law is accepted for all empirical distributions with a confidence level of 99%. We have tested other hypotheses, by considering other distributions with fat tails such as lognormal, exponential, Gumbel's extreme values, and Poisson. In the cases where the null hypothesis is accepted with the same confidence level, we used the Akaike information criterion (AIC) [34, 35] to select the best model. It is worth remarking that, in all cases, we find that the power law provides the best description of the data.
Power-law distributions of the degree have been found in a large variety of empirical social networks [36]. Here, the main finding of our results is that each kind of interaction presents a different scaling exponent. To show this, in Figure 6 we report three notched box plots, each corresponding to a different layer and including the information about the different events. Notched box plots present a contraction around the median, whose height is statistically important: if the notches of two boxes do not overlap, this offers evidence of a statistically significant difference between the two medians. This is indeed the case in Figure 6, meaning that the median scaling exponent of the in-degree distribution of each of the three layer is different from the exponent characterizing the in-degree distribution of the other layers. The fact that the in-degree distributions corresponding to the different types of interaction are characterized by different scaling exponents indicates that the dynamics of each type of interaction in Twitter should be modeled as a distinct process, and that existing models of Twitter activity that do not take into account this fact should be carefully rethought.
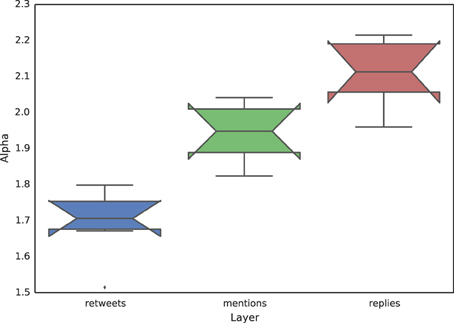
Figure 6. Notched box plots showing the value of the scaling exponent of the in-degree distribution for each layer. Each box aggregates the values corresponding to the different events considered. Notched box plots present a contraction around the median, whose height is statistically important: if the notches of two boxes do not overlap, this offers evidence of a statistically significant difference between the two medians. This is the case here, meaning that the median scaling exponent of the in-degree distribution of each of the three layer is different from the exponent characterizing the in-degree distribution of the other layers.
3.4. Average Clustering Per Layer
Lastly, for each layer separately, we calculate the average clustering coefficient of the corresponding network. This is a measure of the transitivity of the observed interactions, and constitutes an important metric to characterize social networks [37]. In particular, for each event and each layer, we compute the average local clustering coefficient defined by:
where
where ejk indicates the edge between users j and k. We show in Figure 7 the values of the clustering coefficient using three notched box plots, each corresponding to a different layer and including the information about the different events. The mention network has the highest clustering level, whereas the reply network has the lowest one. The clustering level of the retweet network is the most variable across events, however the three medians are again different because the notches do not overlap. This result is a further confirmation that the three layers, and therefore the three types of interaction that they represent, form different network topologies and that the dynamical processes producing them are thus distinct.
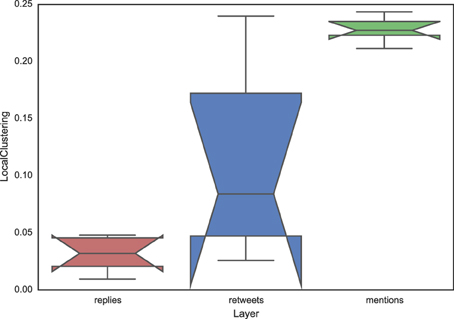
Figure 7. Notched box plots showing the value of the average clustering coefficient for each layer. Each box aggregates the values corresponding to the different events considered.
4. Discussion
In this paper we analyze six datasets consisting of Twitter conversations surrounding distinct exceptional events. The considered events span over very different topics: entertainment, science, commemorations, sports, activism, and politics. Our results show that, despite the different fluctuations in time and in volume, there are some statistical regularities across the different events. In particular, we find that the in-degree distribution of users and the clustering coefficient in each of the three layers (representing interactions based on retweet, replies, and mentions, respectively) are the same across the six different events. Our first conclusion is therefore that users behavior on Twitter—during exceptional events—presents some universal patterns.
Secondly, we show that different types of interactions between users on Twitter (retweeting, replying, and mentioning) generate networks presenting different topological characteristics. These differences were captured making use of the multilayer network framework: instead of discarding the information contained in the tweets regarding how users interact, we use this information to build a more complete representation of the system by means of three layers, each representing a different type of interaction. The fact that networks corresponding to different layer present different statistical properties is an important hint for models aiming at reproducing human behavior in online social networks. Our results indicate that, to faithfully represent how users interact, these models cannot be based on an aggregated view of the network and should account for all the different processes taking place in the system, separately.
Conflict of Interest Statement
The authors declare that the research was conducted in the absence of any commercial or financial relationships that could be construed as a potential conflict of interest.
Acknowledgments
AA and MD were supported by the European Commission FET-Proactive project PLEXMATH (Grant No. 317614) and the Generalitat de Catalunya 2009-SGR-838. AA also acknowledges financial support from the ICREA Academia, James S. McDonnell Foundation and MINECO FIS2012-38266. EO is supported by James S. McDonnell Foundation.
Footnotes
1. ^https://about.twitter.com/company.
2. ^https://dev.twitter.com/streaming/public.
3. ^https://en.wikipedia.org/wiki/2013_Cannes_Film_Festival.
4. ^https://en.wikipedia.org/wiki/Higgs_boson#Discovery_of_candidate_boson_at_CERN.
5. ^https://en.wikipedia.org/wiki/I_Have_a_Dream.
6. ^https://en.wikipedia.org/wiki/2013_World_Championships_in_Athletics.
7. ^https://en.wikipedia.org/wiki/People's_Climate_March.
8. ^https://en.wikipedia.org/wiki/List_of_presidential_trips_made_by_Barack_Obama#2013.
References
1. Centola D. The spread of behavior in an online social network experiment. Science (2010) 329:1194–7. doi: 10.1126/science.1185231
2. Borge-Holthoefer J, Baños RA, González-Bailón S, Moreno Y. Cascading behaviour in complex socio-technical networks. J Complex Netw. (2013) 1:3–24. doi: 10.1093/comnet/cnt006
3. Lazer D, Pentland AS, Adamic L, Aral S, Barabasi AL, Brewer D, et al. Life in the network: the coming age of computational social science. Science (2009) 323:721. doi: 10.1126/science.1167742
4. Kwak H, Lee C, Park H, Moon S. What is twitter, a social network or a news media? In: Proceedings of the 19th International Conference on World Wide Web. Raleigh, NC: ACM (2010). pp. 591–600.
5. Gonçalves B, Perra N, Vespignani A. Modeling users? activity on twitter networks: validation of dunbar's number. PLoS ONE (2011) 6:e22656. doi: 10.1371/journal.pone.0022656
6. Dunbar RI. Neocortex size as a constraint on group size in primates. J Hum Evol. (1992) 22:469–93. doi: 10.1016/0047-2484(92)90081-J
7. Dunbar RI. Foundations in social neuroscience. In: Cacioppo JT, Berntson GG, Adolphs R, Carter CS, Davidson RJ, McClintock M, et al. editors. The Social Brain Hypothesis. Vol. 5. Cambridge, MA: The MITPress (2002), p. 69.
8. Takhteyev Y, Gruzd A, Wellman B. Geography of twitter networks. Soc Netw. (2012) 34:73–81. doi: 10.1016/j.socnet.2011.05.006
9. Java A, Song X, Finin T, Tseng B. Why we twitter: understanding microblogging usage and communities. In: Proceedings of the 9th WebKDD and 1st SNA-KDD 2007 Workshop on Web Mining and Social Network Analysis. San Jose, CA: ACM (2007). pp. 56–65.
10. Yang J, Counts S. Predicting the speed, scale, and range of information diffusion in twitter. In: Proceedings of the Fourth International Conference on Weblogs and Social Media. Vol. 10. Washington, DC (2010), pp. 355–8.
11. Wu S, Hofman JM, Mason WA, Watts DJ. Who says what to whom on twitter. In: Proceedings of the 20th International Conference on World Wide Web. Hyderabad: ACM (2011). pp. 705–14.
12. Myers SA, Zhu C, Leskovec J. Information diffusion and external influence in networks. In: Proceedings of the 18th ACM SIGKDD International Conference on Knowledge Discovery and Data Mining. Beijing: ACM (2012). pp. 33–41.
13. Bakshy E, Hofman JM, Mason WA, Watts DJ. Everyone's an influencer: quantifying influence on twitter. In: Proceedings of the Fourth ACM International Conference on Web Search and Data Mining. Kowloon: ACM (2011). pp. 65–74.
14. González-Bailón S, Wang N, Rivero A, Borge-Holthoefer J, Moreno Y. Assessing the bias in samples of large online networks. Soc Net. (2014) 38:16–27. doi: 10.1016/j.socnet.2014.01.004
15. Borge-Holthoefer J, Meloni S, Gonçalves B, Moreno Y. Emergence of influential spreaders in modified rumor models. J Stat Phys. (2013) 151:383–93. doi: 10.1007/s10955-012-0595-6
16. González-Bailón S, Borge-Holthoefer J, Moreno Y. Broadcasters and hidden influentials in online protest diffusion. Am Behav Sci. (2013) 57:943–65. doi: 10.1177/0002764213479371
17. Baños RA, Borge-Holthoefer J, Moreno Y. The role of hidden influentials in the diffusion of online information cascades. EPJ Data Sci. (2013) 2:1–16. doi: 10.1140/epjds18
18. Borge-Holthoefer J, Rivero A, García I, Cauhé E, Ferrer A, Ferrer D, et al. Structural and dynamical patterns on online social networks: the spanish may 15th movement as a case study. PLoS ONE (2011) 6:e23883. doi: 10.1371/journal.pone.0023883
19. González-Bailón S, Borge-Holthoefer J, Rivero A, Moreno Y. The dynamics of protest recruitment through an online network. Sci Rep. (2011) 1:197. doi: 10.1038/srep00197
20. Conover M, Ratkiewicz J, Francisco M, Gonçalves B, Menczer F, Flammini A. “Political polarization on twitter. In: Fifth International AAAI Conference on Weblogs and Social Media. Barcelona (2011).
21. De Domenico M, Lima A, Mougel P, Musolesi M. The anatomy of a scientific rumor. Sci Rep. (2013) 3:2980. doi: 10.1038/srep02980
22. Cardillo A, Gómez-Gardeñes J, Zanin M, Romance M, Papo D, del Pozo F, et al. Emergence of network features from multiplexity. Sci Rep. (2012) 3:1344. doi: 10.1038/srep01344
23. De Domenico M, Solé-Ribalta A, Cozzo E, Kivelä M, Moreno Y, Porter MA, et al. Mathematical formulation of multilayer networks. Phys Rev X. (2013) 3:041022. doi: 10.1103/PhysRevX.3.041022
24. Nicosia V, Bianconi G, Latora V, Barthelemy M. Growing multiplex networks. Phys Rev Lett. (2013) 111:058701. doi: 10.1103/PhysRevLett.111.058701
25. Gallotti R, Barthelemy M. Anatomy and efficiency of urban multimodal mobility. Sci Rep. (2013) 4:6911. doi: 10.1038/srep06911
26. De Domenico M, Nicosia V, Arenas A, Latora V. Structural reducibility of multilayer networks. Nat Commun. (2015) 6:6864. doi: 10.1038/ncomms7864
27. De Domenico M, Solé-Ribalta A, Omodei E, Gómez S, Arenas A. Ranking in interconnected multilayer networks reveals versatile nodes. Nat Commun. (2015) 6:6868. doi: 10.1038/ncomms7868
28. Kivelä M, Arenas A, Barthelemy M, Gleeson JP, Moreno Y, Porter MA. Multilayer networks. J Complex Netw. (2014) 2:203–71. doi: 10.1093/comnet/cnu016
29. Boccaletti S, Bianconi G, Criado R, Del Genio CI, Gómez-Gardeñes J, Romance M, et al. The structure and dynamics of multilayer networks. Phys Rep. (2014) 544:1–122. doi: 10.1016/j.physrep.2014.07.001
30. Battiston F, Nicosia V, Latora V. Structural measures for multiplex networks. Phys Rev E (2014) 89:032804. doi: 10.1103/PhysRevE.89.032804
31. Spearman C. The proof and measurement of association between two things. Am J Psychol. (1904) 15:72–101. doi: 10.2307/1412159
32. Clauset A, Shalizi CR, Newman ME. Power-law distributions in empirical data. SIAM Rev. (2009) 51:661–703. doi: 10.1137/070710111
33. Snedecor GW, Cochran WG. Statistical Methods. Iowa City, IA: Iowa State University Press (1967).
34. Akaike H. Information theory and an extension of the maximum likelihood principle. In: 2nd International Symposium on Information Theory. Tsahkadsor: Akadémiai Kiadó (1973). pp. 267–81.
35. Akaike H. A new look at the statistical model identification. Automat Control IEEE Trans. (1974) 19:716–23. doi: 10.1109/TAC.1974.1100705
36. Caldarelli G. Scale-free Networks: Complex Webs in Nature and Technology. Oxford, UK: OUP Catalogue (2007).
Keywords: multilayer, social networks, complex networks, exceptional events, big data
Citation: Omodei E, De Domenico M and Arenas A (2015) Characterizing interactions in online social networks during exceptional events. Front. Phys. 3:59. doi: 10.3389/fphy.2015.00059
Received: 30 June 2015; Accepted: 27 July 2015;
Published: 11 August 2015.
Edited by:
Taha Yasseri, University of Oxford, UKReviewed by:
Benjamin Miranda Tabak, Universidade Católica de Brasília, BrazilSandro Meloni, University of Zaragoza, Spain
Copyright © 2015 Omodei, De Domenico and Arenas. This is an open-access article distributed under the terms of the Creative Commons Attribution License (CC BY). The use, distribution or reproduction in other forums is permitted, provided the original author(s) or licensor are credited and that the original publication in this journal is cited, in accordance with accepted academic practice. No use, distribution or reproduction is permitted which does not comply with these terms.
*Correspondence: Elisa Omodei, Departament d'Enginyeria Informàtica i Matemàtiques, Universitat Rovira i Virgili, Avda. Paisos Catalans, 26, 43007 Tarragona, Spain, elisa.omodei@urv.cat