Gas migration regimes and outgassing in particle-rich suspensions
 Julie Oppenheimer
 Alison C. Rust
 Katharine V. Cashman
 Bjornar Sandnes
- 1School of Earth Sciences, University of Bristol, Bristol, UK
- 2College of Engineering, Swansea University, Swansea, UK
Understanding how gasses escape from particle-rich suspensions has important applications in nature and industry. Motivated by applications such as outgassing of crystal-rich magmas, we map gas migration patterns in experiments where we vary (1) particle fractions and liquid viscosity (10–500 Pa s), (2) container shape (horizontal parallel plates and upright cylinders), and (3) methods of bubble generation (single bubble injections, and multiple bubble generation with chemical reactions). We identify two successive changes in gas migration behavior that are determined by the normalized particle fraction (relative to random close packing), and are insensitive to liquid viscosity, bubble growth rate or container shape within the explored ranges. The first occurs at the random loose packing, when gas bubbles begin to deform; the second occurs near the random close packing, and is characterized by gas migration in a fracture-like manner. We suggest that changes in gas migration behavior are caused by dilation of the granular network, which locally resists bubble growth. The resulting bubble deformation increases the likelihood of bubble coalescence, and promotes the development of permeable pathways at low porosities. This behavior may explain the efficient loss of volatiles from viscous slurries such as crystal-rich magmas.
Introduction and Background
Volcanic eruptions provide a striking example of the importance of outgassing in natural viscous suspensions. Erupting magmas are suspensions of bubbles and crystals in silicate melt, and eruptions are driven by the exsolution and expansion of the gas phase. Therefore, the mobility of bubbles strongly influences eruption dynamics, and, more fundamentally, the ability of magma to erupt at all [e.g., 1]. Intriguingly, crystal-rich magmas are often found with depleted volatiles [e.g., 2, 3], suggesting an effective—and yet unknown—mechanism for gas loss. It is this conundrum that has motivated our research.
Analog experiments are commonly used to study gas migration behavior in particle-rich suspensions, where both the morphology and migration rate of injected gas can be used to identify distinct behavioral regimes [e.g., 4–6]. The simplest experimental configuration utilizes Hele-Shaw cells, parallel plates clamped together and separated by a small gap, where fluid flow is laminar [7]. Under these conditions, gas intruded into a more viscous liquid migrates in the shape of fingers due to the Saffman-Taylor instability [8]. Adding particles to the invaded liquid creates a spectrum of gas phase geometries that arise from interactions between gas bubbles, liquid and particles [e.g., 9, 10]. If the particles are density matched, increasing the particle fraction causes fingers to thin and branch, due to an increase in effective viscosity, and local perturbations from discrete particles [11, 12]. When the suspension approaches the random close packing (RCP, also called maximum random packing), fracture-like patterns may form [12–17]. The transition from fingering to fracturing has been placed at a packing fraction of 0.9 * RCP [10, 12]. At RCP, gas migration patterns depend on the confining pressure [15, 17, 18]. Specifically, low confining stress allows continued fracturing, while increasing the confining stress causes the granular material to become rigid, and forces the gas to invade the pore space in the form of capillary or viscous fingering.
In suspensions approaching RCP, the particles are likely to touch. Therefore, a key control on gas migration through particle suspensions is the interactions between solid particles, which also undergo regime changes. The random loose packing (RLP < RCP) is “the loosest possible random packing that is mechanically stable” [19]. Below RLP, a particle suspension generally behaves like a liquid, but at RLP, the suspension becomes capable of jamming [or developing a yield strength; 20, 21]. Furthermore, since a large number of particles are in contact with each other, suspensions of hard spheres become dilatant in response to shear [19]. Indeed, to accommodate an applied shear force, the particles must dislocate around other particles. This inefficient sliding requires space, and causes the whole suspension to dilate; particles transmit the displacement to their neighbors until the successive displacements reach the particles at the boundary. Dilation has important implications for the rheology of particle suspensions. Because the particles are in contact with each other, particle-particle contacts can transmit stress and build force chains, or networks, that extend from the source of shear to the suspension boundaries [22, 23]. Again, confining stress matters: if the boundaries can deform freely, then the particles at the edge will intrude the surface without transmitting stress to their neighbors. However, even a small resistance from the boundary will allow stress build-up in the particle network, which can then resist shear [24]. At the random close packing, the percentage of particles in contact with each other is at its highest (for a randomly packed suspension), and even suspensions of frictionless particles develop a yield strength [21, 25, 26].
We hypothesize that the fields of research synthesized above (finger-to-fracture transition in Hele-Shaw cells, dilation, and jamming) are linked and, together, can explain outgassing of particle-rich suspensions. To this purpose, we extend existing work on gas pattern formation in Hele-Shaw cells to (1) viscous suspending liquids (motivated by application to magmas), and (2) container shapes that approach fully three-dimensional systems. This work is detailed in Part I. In Part II, we assess the role of gas distribution by generating bubble growth throughout the suspension. By combining observations from these diverse experiments, we then explore the likely mechanisms that control both spatial gas migration patterns and outgassing efficiency in particle-rich suspensions.
Part I: Injection of Single Bubbles
Materials and Methods
To study bubble-particle interactions in three-phase suspensions, we ran several suites of experiments that used continuous air injection into suspensions sandwiched between two glass plates. Plate gap distance, liquid viscosity and particle fraction were varied. These experiments were performed in open parallel plate geometries (Figure 1); the mixtures of liquid and particles could spread freely laterally, but were confined within a small gap vertically. The set-up procedure was as follows: a suspension was placed upon a solid glass plate (dimensions 40 × 40 × 2 cm), then covered with another glass plate of equal dimensions, allowing the mixture to spread under the weight of the top plate. The two confining plates were clamped together and held apart by separators. During the experiments, an inlet of diameter 1.35 cm in the center of the top plate allowed gas injection into the center of the suspensions. A T joint screwed into this hole connected a pressure gauge on one end (Edwards ASG 2000 mbar), and a 50 mL air-tight syringe on the other via a brass tube of length 31.5 cm and diameter 2.4 mm (Figure 1). The air flow from the syringe was controlled with a Becton Dickinson Programme 2 syringe pump that slid the plunger at a constant rate. The total air volume initially contained in the tubing, the T joint and the syringe was 57.6 mL. The pressure at the inlet was recorded in MATLAB at sampling frequencies of 2500 and 5000 Hz. A light box was placed over the top plate and the whole set-up was surrounded by a light-blocking curtain, so that the experiments were lit homogeneously and from above only. Time-lapse images were taken from below, every 2 s.
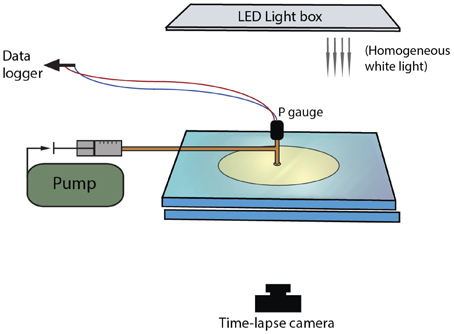
Figure 1. Experimental set-up for injection of single bubbles into particle suspensions sandwiched between parallel plates.
The materials used were sugar syrup (Tate and Lyle golden syrup), and poly-disperse soda-lime glass beads (Guyson co.) of ~100 μm diameter (with a range of 75–125 μm). The syrup is Newtonian with a viscosity of ~60 Pa s at 20°C and surface tension of ~80 mN/m [27]. We achieved viscosities of 10 Pa s to >600 Pa s (Table 1) by respectively diluting the syrup with 5 vol% water, and reducing the room temperature to 5°C. Nonetheless, viscosity ratios between the suspending liquid and injected gas remain high, within the range 5–500 × 105 (calculated as ηliq/ηgas, with η the viscosity). Since gas viscosity in our experiments remains relatively constant, we hereafter focus on liquid viscosity, so as to highlight the possible effects of viscous forces within the particle suspension. We express all particle and syrup contents in vol% of the original bubble-free suspensions. The relative volumes of syrup and particles were determined by weighing both components and correcting for density. The syrup density was measured by weighing 100 mL of syrup, and the glass bead density was measured by immersion in water. There is a substantial density difference between glass beads (2452 kg/m3) and sugar syrup (1412 kg/m3). However, for glass beads in pure syrup, Stokes terminal velocities predict a particle settling of 0.2–0.4 mm in 1 h. Hindered settling in dense particle suspensions further slows settling [only 15 vol% solids can halve settling velocities; 28, 29]. We therefore assume that settling is negligible compared to gap thickness for experiment durations < 1 h. Settling may become significant for low viscosity experiments (terminal velocity ≈ 2 mm/h), although these experiments were shorter because of higher flow rates.
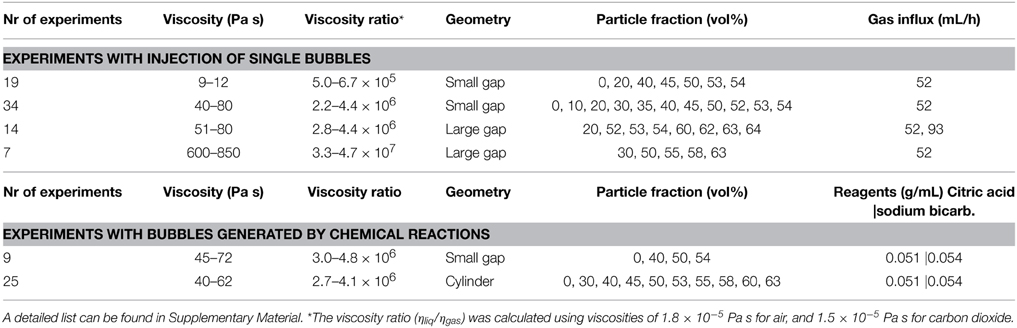
Table 1. Experimental conditions explored in this study.
The gap between plates was varied to explore the effect of confining geometry on gas migration patterns.
(1) “Small-gap parallel plate” (Hele-Shaw cell)
This set of experiments was performed with 0.48 mm plate spacing. Due to the higher resistance to spreading in such a small gap, the setup for experiments with high particle contents and more viscous liquids required weights to be placed on the top plate, and gentle movement of the top plate (with short back-and-forth pivoting motions) to facilitate spreading. As a result, the suspensions in these experiments occasionally had irregular outer edges. Experiments were performed with a constant suspension volume of 4 mL. Since the viscosity ratios are high between the liquid and injected gas, gas migration in this geometry is within the highly unstable displacement regime [e.g., 30], and therefore occurs in the shape of fingers. We defined different regimes by observing the direction and advance rate of the gas front and the overall gas geometry, and quantified regime transitions by measuring the bulk growth of the suspension, bubble shape parameters and average finger widths in ImageJ [31]. Key experiments were repeated three times and measurements on repeat experiments were averaged.
Bulk growth was measured from binary images, which allowed measurement of the total area of the gas + suspension. The image background was separated from the bulk suspension using a color intensity threshold. However, this method was applicable only when fingers grew in all directions. When one finger dominated, outgassing occurred prematurely when the dominant finger breached the outer boundary of the suspension, and bulk estimates ceased to be representative. In these cases, finger width was a better indicator of regime categories. Initial analysis of trial experiments showed that the finger width varied with time, especially at the very beginning (first appearance) and the very end (outgassing event) of the gas migration history. For this reason, finger widths were measured when they reached half the distance to the edge of the disk. The average finger thickness was determined by subtracting a Euclidean distance map from the skeleton of each finger, which provided a measure of the distance to the nearest edge from each point along the center of the finger (Figure 2). The method assumes a symmetric finger and may therefore underestimate finger width by up to two pixels (< 0.15 mm with our image resolutions).
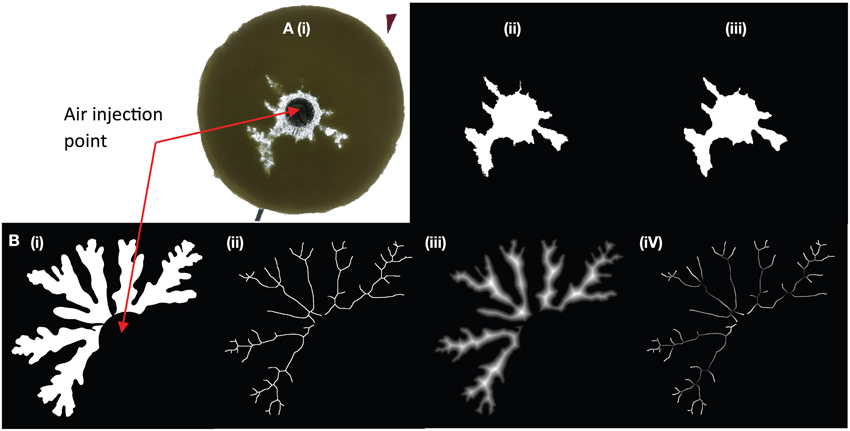
Figure 2. Two examples of finger analysis in (A) a large gap parallel plate experiment, and (B) a small gap Hele-Shaw cell. (A) treatment of a large gap experiment at 63% particles, ~700 Pa s. The original image (i) is thresholded (ii) then smoothed with a median filter (iii). Some details are lost in the fracture-like areas, but the artificial edge roughness is removed. (B) Experiments in small gap Hele-Shaw cells (here 45 vol% particle content, 11 Pa s) needed further processing to determine finger widths. The image is first thresholded as in (A), then skeletonized (ii) and a distance map is extracted (iii). The distance map records the distance from the center of the finger by incrementing gray scale values. The distance map is then subtracted from the skeleton (white values = 255) to calculate a “distance skeleton” where the gray scale value represents the distance in pixels from the skeleton to the first background pixel (iv). The resulting finger width was calculated as 2*(gray scale in pixels/number of pixels per unit length). In this example, brightness and contrast were increased to better visualize the variations in gray scale. The diameter of the black circle outlining the injection point is 1.9 cm.
Particle Image Velocimetry (PIV) provided insights into the local interactions between the fingers and the particle suspension. PIV analyses were performed on the entire suspension using the “PIVLab” tool in MATLAB [32]. This method tracks the darker elements of the image, and thus the movement of particle clusters and small bubbles trapped within the suspension, which appear darker to the camera due to refractive index contrasts. To compare particle mobilization caused by advancing fingers in the different migration regimes, we chose pairs of images taken 2 s apart, starting with the image selected for finger width analysis described above.
(2) “Large-gap parallel plate”:
A second set of experiments was performed with the confining plates held apart by separators 4.94 mm high. Initial suspension volume was kept constant at 40 mL, but a subset of experiments were performed with a volume of 70–90 mL. Regime categories were again characterized visually, then separated using shape (morphometric) analysis in ImageJ. Because these experiments formed round or deformed bubbles (gas pockets), image analysis was performed on entire bubbles, rather than individual branches. The bubbles were isolated with a color intensity threshold and smoothed using a median filter (Figure 2). We classified bubble shapes using both circularity C = 4πA/P2 where A is bubble area and P is perimeter, and solidity S = A/(Convex Hull). The convex hull is determined using a “gift wrapping algorithm” [31].
To compare results from different experiment geometries, we used the normalized packing fraction, ϕ, which was measured by dividing the particle concentration (by volume) in an experiment by the random close packing (RCP) in that geometry:
RCP was determined experimentally for each confining geometry by measuring the packing fraction of dry grains after shaking/tapping the containers for approximately 3 min. RCP was thus established at 54 ± 2% for the 0.48 mm gap, and at 63 ± 0.8% for the 4.94 mm gap; the discrepancy is due to the relative inefficiency of packing near walls.
Results
For small gap geometries, it is well established that injection of air into a more viscous liquid generates air fingers that grow from Saffman-Taylor instabilities. We observe in Figure 3A that the average finger thickness decreases with increasing particle content [increasing effective viscosity; e.g., 12, 33], which is consistent with the decrease in finger width for Saffman-Taylor instabilities with increasing host liquid viscosity (8, 12). At particle fractions above 45 vol% (normalized particle fractions ϕ > 0.83), however, the slope steepens; addition of particles causes stronger thinning of the fingers. At 54 vol% particles (ϕ ≈ 1) gas advances in a fracture-like manner. In contrast to the continuous advance and expansion of Saffman-Taylor fingers, the fractures are characterized by a gas front that advances intermittently and a constant fracture width. Fractures that reach the edge of the suspension can open and reseal repeatedly, or another fracture may develop and outgas in another direction. Consequently, outgassing is irregular, and often occurs in multiple bursts (Figure 4, green curve). Near the transition to fractures, small variations in particle fractions can strongly affect results, and even spatial variations within a suspension can cause fractures to turn into fingers, or fingers to fractures.
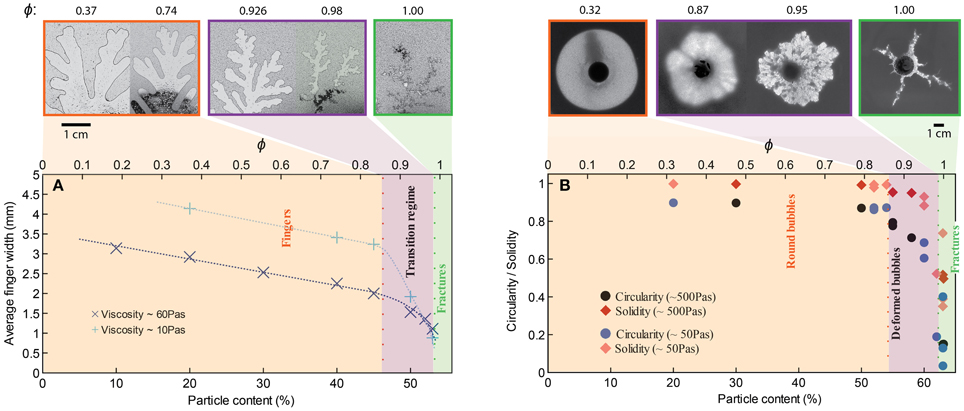
Figure 3. Change in bubble morphology with particle content for experiments with bubble injection in (A) small-gap parallel plate geometry, and (B) large-gap parallel plate geometry. Injection rate is 52 mL/h for all experiments, although a few additional experiments in graph (B) have an injection rate of 93 mL/h (at 59, 62, and 63% particles). The example experiments displayed above the graphs have a liquid viscosity of ~10 Pa s (small-gap), and ~50 Pa s (large-gap geometry). In all geometries and for all liquid viscosities, a change in bubble morphology occurs around ϕ ≈ 0.86.
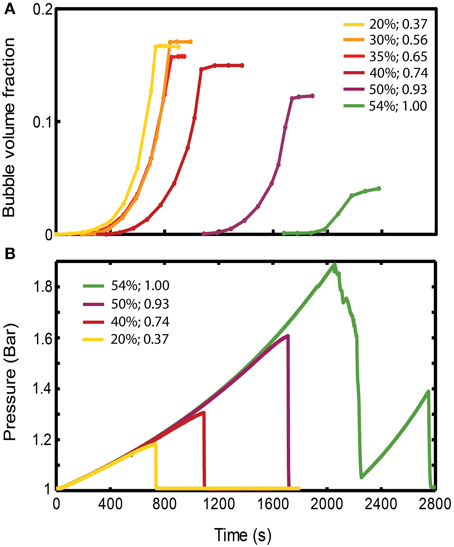
Figure 4. (A) Evolution of gas volume fraction at various particle concentrations for bubble injection experiments in small-gap Hele-Shaw cells. The gas volume fraction, calculated as Vgas/Vtotal, is a measure of bulk growth normalized by the total volume. The plateau indicates that a finger has reached the edge, creating an open channel for gas flow, and the gas volume fraction in the experiment cannot grow any further. (Viscosity ≈ 50 Pa s, gas influx = 52 mL/h, experiments with ~symmetrical fingers). (B) Pressure values at the inlet, reflecting the delay in outgassing experienced by the more particle-rich experiments. The outgassing event is characterized by a sudden drop in pressure. Experiments are the same as in (A). The figure legend shows particle volume fraction (first column), and ϕ (second column).
In large-gap parallel plate experiments (Figure 3B), the bubble is round for gas injected into syrup (ϕ = 0); increasing particle content produces successive regimes of rounded bubbles, deformed bubbles above 54 vol% particles (ϕ > 0.86) and fractures at 63 vol% particles (ϕ ≈ 1). Hence the transitions occur at different absolute particle volume fractions in the small- and large-gap geometries but at approximately the same values of ϕ.
Variations in liquid viscosity and injection rate do not appear to affect the transition ϕ values within the experimental range studied here. Indeed, increasing the liquid viscosity from 10 Pa s to > 600 Pa s yields the same transitional ϕ values. However, bubbles expanding in the lower viscosity suspensions have lower internal bubble pressures for the same air injection rate. Fracture morphology also varies, with straighter and longer fractures observed in lower viscosity liquids. Experiments at 10 Pa s in the small gap geometry also have wider fingers at low particle fractions, due to the viscosity-dependence of Saffman-Taylor instabilities [8]. There is no observable change in bubble morphology with viscosity in the large gap experiments, although the viscosity ratio between liquid and gas is consistently high. Air injection rate was not specifically investigated, but some faster experiments (93 mL/h) in large-gap parallel plates did not affect results (Figure 3B). A preliminary experiment in the small-gap geometry with injection rate 1 mL/h and 54 vol% particles generated thin fingers (instead of fractures) of width comparable to those at 53 vol% particles (just before the transition) under “normal” conditions. Therefore, the regime transitions appear insensitive to injection rate over two orders of magnitude.
The bulk response to bubble growth is also subject to regime transitions. Bulk expansions (gas volume fractions, Vgas/Vtotal) are plotted in Figure 4A for experiments in the small gap geometry that expanded symmetrically. For ϕ > 0.83, the maximum bulk growth decreases with increasing particle fractions, yet the onset of bubble expansion (or bulk growth) occurs with a significant delay. Since gas is injected at a constant rate, this delay suggest that an increase in pressure occurs before bubble growth begins in particle-rich experiments, which reflects a significant bulk resistance to bubble growth. Indeed experiments at ϕ > 0.83 accumulate higher internal bubble pressures before outgassing (at which point the pressure drops; Figure 4B), and maintain a lower bubble volume than particle-poor experiments (Figure 4A).
Particle Image Velocimetry (Figure 5) shows displacements caused by the advance of the gas fingers. While the entire suspension is mobilized in experiments with low particle contents, the mobilized area reduces considerably at ϕ > 0.83 (>45 vol% particles), and is limited to the very tip of the gas front in the fracturing regime, where most of the suspension remains static.
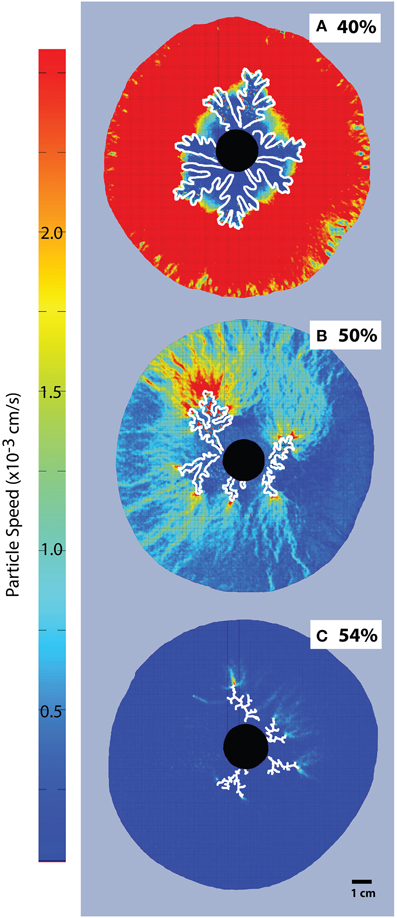
Figure 5. Particle Image Velocimetry on bubble injection experiments in a small-gap parallel plate geometry. Particle concentrations are (A) 40% or ϕ = 0.74, (B) 50% or ϕ = 0.93, and (C) 54%, or ϕ = 1. The black disk in the center is the injection point, and fingers grow radially (outlined in white). The color scale is constant for all images, for better comparison. The areas with most displacement appear red and the dark blue areas are essentially immobile (Viscosity ≈ 10 Pa s, air influx = 52 mL/h).
Key Insights from Part I
Gas injection experiments performed in parallel plate geometries reveal the fundamental interactions that occur when a bubble grows in a particle-rich suspension. Experiments in both small-gap and large-gap geometries show the same transition at a critical normalized particle fraction ϕdef ≈ 0.86, where fingers in small gap experiments become narrower, and bubbles in large gap experiments begin to deform. We refer to this as the “bubble deformation regime.”
At the random close packing (ϕfr ≈ 1), the bubble migration behavior changes again: the gas front migrates episodically, in the form of fractures that do not widen with time or distance. We refer to this as the fracture regime because the gas morphology resembles fractures in a solid medium; we note, however, that there are no cohesive forces between the grains, and thus the term is applied loosely. In both large-gap and small-gap experiments, the transition from bubble deformation to fractures occurs progressively, with fingers that thin as ϕ increases (Figure 3). Thus, in many cases, the onset of the fracture regime was defined visually, using characteristics such as intermittent advance of the gas front and the morphology of individual gas branches.
Previous experiments in Hele-Shaw cells (small gap geometry) describe only a single transition at ϕ = 0.9 where fingers change to fractures [10, 12]. Liquid viscosities in these experiments are lower (0.005–0.1 Pa s), but the viscosity ratios (order of 102–103) still place them in the highly unstable displacement regime [e.g., 30]. Therefore, Saffman-Taylor instabilities cause bubbles to form finger-like shapes, and the thinning of fingers in the bubble deformation regime resembles fractures. Thus, the distinction between regimes (bubble deformation and fractures) is subtle. In our large gap parallel plate experiments, bubble shape analyses (such as solidity measurements, Figure 3) can be used to locate the fracture regime more precisely; in this geometry, the gradual elongation of bubbles into fracture-like fingers occurs over a smaller range of particle fractions (~0.96 < ϕfr ≤ 1), where it is accompanied by a sharp decrease in solidity from ~0.8 to < 0.5.
We suggest, therefore, that these two gas migration regimes are likely important in three-dimensional settings. They do not depend on liquid viscosity or container shape, but are strongly dependent on particle fraction. In the following section, we test this hypothesis by extending our experiments to another three-dimensional geometry: vertical cylinders. Furthermore, to determine how these regime transitions affect outgassing, and by analogy with magmatic systems, we also investigate conditions where bubbles are generated internally, by chemical reactions, rather than externally, by injection.
Part II: In situ Bubble Growth Generated by Chemical Reactions
Materials and Methods
These experiments were designed to examine the effect of the regime transitions described in part I on outgassing behavior of three-phase suspensions where the gas phase is dispersed in the granular suspension. The experiments were performed using the materials described in part I, with the exception that bubbles were generated in situ by chemical reactions between powders of citric acid (C6H8O7) and sodium bicarbonate (NaHCO3). The resulting exsolution of CO2 generated bubble nucleation and growth throughout the suspension.
Experiments began (t = 0 in data analysis) when the reactants were mixed into the suspension of syrup and particles. The initial concentration of reactants in the syrup was kept constant for all experiments at 0.051 g/mL (C6H8O7) and 0.054 g/mL (NaHCO3). This allowed relative changes in bubble content and outgassing rates to be studied for different particle contents. All experiments were allowed to run for 24–48 h, due to the low bubble growth rates, but only the first 10–15 h of the experiments were analyzed in detail, to limit the likelihood of significant particle settling. The rate of bubble exsolution decreased with time due to exhaustion of reactants, and reaction rates were sensitive to temperature (Figure S1, Supplementary Material). To minimize error, we kept room temperature at 22.0 ± 0.5°C for all experiments that were directly compared. For simplicity, all particle and syrup volume contents are expressed in vol% of the original bubble-free suspension, and bubble volume contents at time t are expressed by dividing the bubble volume by the bulk volume at time t (Vb/Vtot).
Two container geometries were used:
(1) “Small-gap parallel plate” (Hele-Shaw cell):
This set of experiments was performed in the same parallel plate geometry as described in part I, held apart by separators 0.48 mm high, with images captured from below (Figure 6). The liquid+particle suspension volume was always 6.0 ± 0.5 mL. Bubbles began to form before the mixture was enclosed between the rigid plates, thus affecting the initial bubble concentrations in the confined geometry. However, the experiment durations were much longer than the set-up time and most of the gas expansion occurred in the confined environment. This near-2D set-up permitted analysis of bubble geometry, shape and position from time lapse images taken every 10 s. Bulk (three-phase suspension) growth rates were estimated by measuring the area of thresholded images, multiplied by the gap width between plates to obtain a volume. Bubble size and shape (circularity, aspect ratio) were measured using binary (thresholded) images, for bubbles of diameter >0.1 mm.
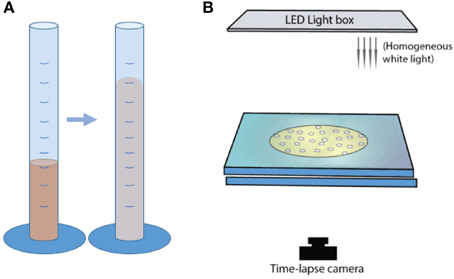
Figure 6. Experimental set-up for in situ bubble growth using chemical reactions, in (A) graduated cylinders, and (B) parallel-plate geometry.
(2) “Cylinder”:
Mixtures of syrup and particles were inserted in a graduated cylinder of diameter 28 mm and capacity 100 mL (Figure 6). A light box was placed behind a set of three cylinders, and bulk growth was monitored with time-lapse videos. Experiments were performed at a constant initial volume of 15.5 ± 1.0 mL. The cylinder geometry did not allow direct observations of outgassing paths or bubble morphologies. Instead, bulk growth rates were tracked by measuring total suspension volumes from time-lapse images taken every 30 s. The particle-rich experiments formed a convex upper surface, so the total volume was calculated as a cylinder using the average heights of the highest central point and the contact between the suspension and the cylinder walls.
As in part I, the results from different geometries were compared by using the normalized packing fraction, ϕ, calculated as the ratio of the particle fraction by the random close packing in the geometry used. The random close packing of particles was measured experimentally at 54 ± 2% for small gap parallel plates, and at 63 ± 0.7% for graduated cylinders. This latter value is close to the empirical value of 64% for monodispersed spheres [e.g., 34].
Results
Bubble Behavior in Small-gap Parallel Plates
The small gap (Hele-Shaw) set-up allows observations of bubble behavior through time. Three stages of foam development were identified in both particle-rich and particle-free experiments (Figure 7):
(1) Isolated bubbles: At the beginning, the bubbles were distributed sufficiently far apart to not interact with each other. Bubbles in the center were smaller than those at the edges.
(2) Bubble coalescence and deformation: When enough bubbles had formed, they began to interact and coalesce. When bubbles broke the surface at the edge and outgassed, the bubbles immediately behind them visibly expanded due to a local pressure decrease.
(3) Bursting foam: In this final stage, bulk spreading slowed and outgassing occurred in large, apparently random events of cascading bubble ruptures that propagated from the edge toward the center of the suspension.
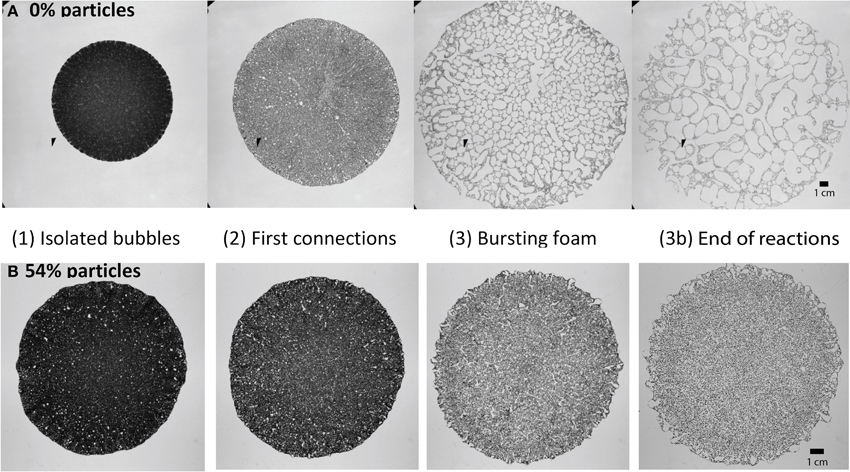
Figure 7. Four phases of foam build-up for (A) a particle free experiment, and (B) a particle rich experiment containing 54 vol% particles (ϕ ≈ 1). For all cases, syrup viscosity is 45–49 Pa s. Videos of these two experiments are available in Supplementary Material.
The particle-poor experiments were characterized by relatively large bulk expansion. In early stages, the flow of liquid, bubbles and particles was fastest in radial channels, which gave lobate outer edges to the expanding mixture. These channels remained stable throughout stages (1) and (2) of the experiment (see Video 1 in Supplementary Material). Bubble coalescence and outgassing initiated at the edges of the suspension, where populations of small bubbles accumulated and grew. As the whole suspension expanded, the outgassing events progressively reached farther into the suspension. In this way, the experiment slowly evolved toward the bursting foam stage, with coalescence events involving bubbles in locations that span the entire radial range of the suspension. Individual bursts, however, occurred slowly due to depleted reactants, and ultimately the bubbles became large and convoluted.
In contrast, particle-rich experiments showed little expansion. Instead, the lateral flow of liquid, bubbles and particles that developed in the first two phases was quickly replaced by gas expulsion (see Video 2 in Supplementary Material). The short (≤30 min) phase of bubble coalescence and deformation was terminated by sudden coalescence and outgassing events throughout the suspension that narrowed the bubble size distribution. This transition to the bursting foam stage initiated rapid and frequent bursting events that lasted until the end of the experiment (when the chemical reactions stop). It occurred earlier in experiments with higher ϕ, and corresponded with a substantial reduction in bulk expansion rate. The bubbles remained small throughout the experiment, although they tended to elongate into long, thin and winding fingers in the final stages.
The interactions between bubbles and their environment changed significantly when particle fractions increased. Bubble size and bubble deformation increased with time in both the particle-free and particle-rich cases (Figure 8). However, while particle-free experiments showed large increases in bubble size, particle-rich experiments retained very small bubbles, and rapidly reached a stable bubble size distribution, which remained constant throughout the experiment (Figure 8A). Bubble shapes were also dramatically different, with particle-free experiments bearing mostly rounded bubbles (concave cumulative circularity distributions; Figure 8B), and particle-rich experiments containing more deformed bubbles (convex cumulative circularity distributions; Figure 8B).
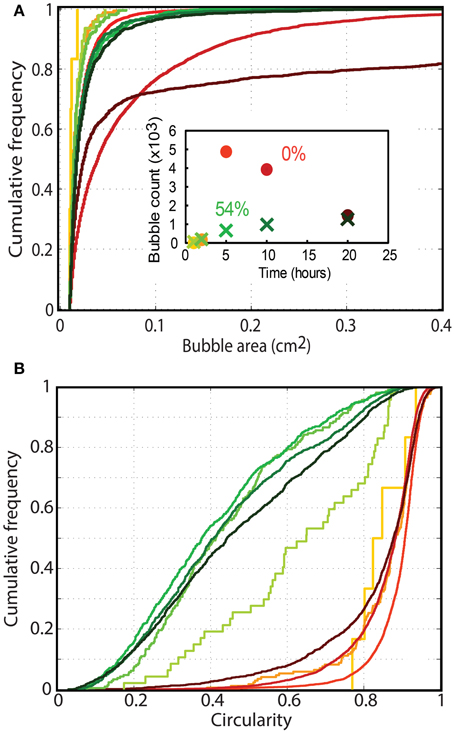
Figure 8. Cumulative frequency distribution of (A) bubble circularity and (B) bubble sizes in particle rich (green; 54 vol% or ϕ = 1) and particle free (orange; ϕ = 0) foam generation experiments. The color gradient shows the migration of distributions with time at t = 1, 2, 5, 10, and 20 h (as shown in the inset graph). Only bubbles larger than 0.01 cm2 are considered, and the first lines in each series appear jagged because they are built from measurements on few bubbles. The number of bubbles considered in each measurement is shown in the inset graph (colors are consistent with Figures 7A,B). The profiles clearly differ for particle-rich (small, highly deformed bubbles) and particle-free experiments (rounder bubbles that continually grow with time).
Bulk Behavior in Cylinders
In graduated cylinders, suspension height and volume are proportional, since the suspension can only expand upward. Thus, the time history of the suspension height, plotted in Figure 9, illustrates gas exsolution in the experiment. Gas exsolution initially triggered a rapid growth phase, which slowed down as the experiments progressed. After a time that varied with particle concentration, the surface level of the column began to oscillate, and bulk growth ceased. For experiments that contain less than 55 vol% particles (ϕ < 0.87), this phenomenon often coincided with the appearance of larger bubbles (on the scale of the cylinder width) that rose through the foam at a faster rate than the other (smaller) bubbles. As the experiments progressed, the amplitude of the surface oscillations increased, until the whole column slumped back toward its original volume (i.e., outgassing was complete). Large bubbles were not observed in experiments with particle fractions above 55 vol%, although these experiments were more opaque and thus individual gas pockets were less visible. Furthermore, experiments with higher particle fractions did not exhibit a final deflation, but instead maintained a gas volume fraction close to their peak values even after all chemical reactions had stopped (Figure 9, green and purple curves). Since chemical concentrations in the syrup were kept constant in all experiments, suspensions with higher particle fractions (lower syrup fractions) contained less reactants, therefore simple measurements of column growth can be misleading. However, normalizing the bulk growth by the syrup volume yields a similar result (Figure S2), and Figure 10 shows that, for ϕ > 0.84, the maximum bubble capacity decreases rapidly with increasing ϕ, far beyond the decrease in available chemicals.
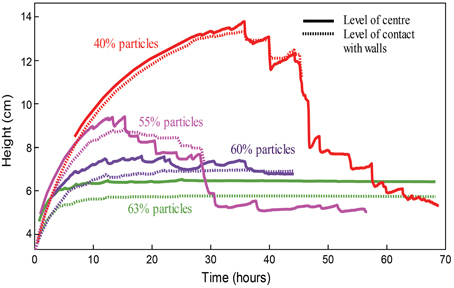
Figure 9. Tracks of column height with time over the full lifespan of four experiments with foams (generated via chemical reactions) in cylinder geometries, with particle fractions of 40, 55, 60, and 63%. Note that the 55% line shows characteristics of both regimes: early onset oscillations and low maximum growth, as well as large oscillations (accompanied by the rise of large bubbles) and a final deflation.
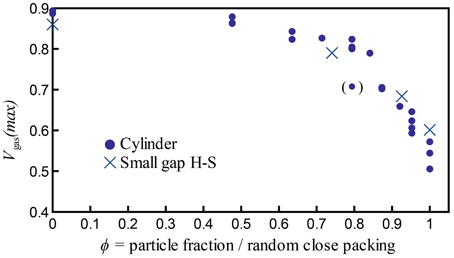
Figure 10. Maximum bubble volume fractions Vgas(max) = Vgas/Vtotal achieved in all experiments with bubbles generated by chemical reactions, including experiments at all temperatures tested (19–23°C). The outlier at ϕ = 0.79 is indicated in parentheses, because four additional experiments at the same ϕ value all reached a larger maximum bubble volume fraction of Vgas/Vtot ≈ 0.8.
Bulk Growth and Outgassing
Figure 10 shows the maximum growth (maximum bubble content) reached by individual experiments, calculated as Vgas(max) = Vgas/Vtot. The data from both parallel plate and cylinder geometries are comparable when particle fractions are normalized by the random close packing: they collapse onto a single trend with a change in slope at a critical packing fraction ϕC ≈ 0.84–0.87, where the maximum bubble capacity decreases rapidly with increasing ϕ. This suggests an increase in gas expulsion at high particle fractions that is valid in both geometries. Moreover, this transition is remarkably stable despite small variations in experimental conditions (such as room temperature).
Key Insights from Part II
The in situ bubble growth experiments show a dramatic increase in gas expulsion above a critical particle fraction (ϕC ≈ 0.84–0.87). Outgassing occurs through large-scale coalescence events (bursting foam) that begin earlier in the more particle-rich experiments. The transition ϕ value is constant in both cylinder and small-gap parallel plate (Hele-Shaw) geometries, two dramatically different geometries. Importantly, foams in graduated cylinders grow vertically and are constrained laterally, so that outgassing occurs in the direction of buoyancy. In contrast, experiments in horizontal Hele-Shaw cells are constrained vertically and expand laterally, hence the flow of bubbles is perpendicular to gravitational forces. The fact that both experiments yield similar results indicates that the main outgassing mechanism does not occur by buoyant rise of bubbles through the suspension. Instead, particle-rich foams appeared to have a lower capacity for bubble retention (Figure 10), and bubbles that were smaller and more deformed. A likely explanation involves an increase in bubble connectivity with increasing particle concentrations, which will be discussed in detail in the next section.
General Discussion
Gas Migration Regimes are Governed by ϕ
The three geometries used (cylinders, large- and small- gap parallel plates) offer varying levels of confinement, but the normalized particle fraction (ϕ) allows comparison between the different geometries (see Supplementary Material for details). Figure 11 shows a regime diagram based on (Figure 11A) bubble shapes observed in single bubble experiments (part I), and (Figure 11B) maximum bulk growth of foams generated by chemical reactions (part II). The most striking feature is that the ϕ marking the onset of bubble deformation in single bubble experiments corresponds with the substantial decrease in gas retention observed in experiments involving in situ foam generation. The behavioral transition to the “bubble deformation regime” (named after the bubble shapes) occurs in both experiment types at a critical normalized packing fraction ϕdef = 0.86 ± 0.03. This value is calculated using the average transition (black line in Figure 11) and the maximum observed offset between experiments immediately adjacent to the transition in both experiment types (single bubble vs. in situ foam generation, in the large gap and cylinder geometries). The error value also includes the error on random close packing. This correlation suggests that (1) bubble deformation and gas expulsion are closely linked, and (2) this first behavioral transition is not affected by the amount of bubbles already in suspension.
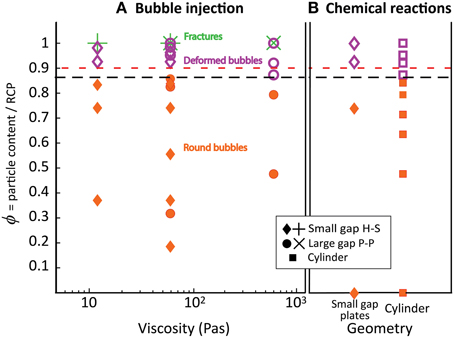
Figure 11. Regime diagram separating the round bubble regime (filled orange shapes), the bubble deformation regime (purple open symbols) and the fracture regime (green crosses). The red dashed line indicates the transition from fingering to fracturing in Sandnes et al. [10] and Chevalier et al. [12] at viscosities of 0.01, and 0.005–0.2 Pa s. The black line indicates ϕdef, determined from regime changes in part I and II. (A) Bubble injection experiments in small-gap parallel plates (diamonds) and large-gap parallel plates (disks), with bubble growth rates of 52 and 93 mL/h; (B) Chemical reaction experiments in small-gap parallel plates (diamonds) and cylinder geometries (squares), with bubble growth rates that average 2–3 mL/h in the first few hours of the experiments.
Considering the many variations of experiments performed in part I and part II, this transition at ϕdef is remarkably consistent. It is insensitive to container shape, to the direction of outgassing, to the amount of bubbles in suspension, and to liquid viscosity. It is also insensitive to bubble growth rate, as demonstrated by the consistent behavior of experiments involving chemical reactions and those involving gas injection. Indeed, bubble growth rates in chemical reaction experiments average 2–3 mL/h initially and progressively decrease during the experiment, while single bubble experiments have a gas injection rate of 52 mL/h or 93 mL/h, an order of magnitude higher. Surface tension (σ) also has little effect on the particle fraction at which bubble deformation begins, as illustrated by consistent results in experiments performed with silicone oil [σ = 21 mN/m; 12], water/glycerin mixtures (σ ~ 68 mN/m; 10), and sugar syrup (σ ~ 80 mN/m; our data). We conclude that the normalized particle volume fraction (ϕ) controls the threshold that separates regimes in bubble shape (round to deformed) and outgassing behavior (bubble growth to gas expulsion).
Experiments with single bubbles underwent a second transition, from deformed bubbles to fractures, at ϕfr ≈ 1. This transition was also insensitive to container shape and liquid viscosity, but did not occur in experiments with in situ bubble growth, suggesting that suspensions of deformable bubbles affect the formation of fractures. The effect of bubble growth rate on the transition to fractures was not tested, however this transition occurred at the same particle fraction during bubble injection at 52–93 mL/h, and our low rate experiment (1 mL/h) was indicatively close to the regime transition. Again, particle volume fraction (ϕ) appears to control this transition in gas migration regimes.
The Role of Particles on Regime Transitions
PIV analysis of single bubble experiments [Figure 5; 12] shows that at low particle fractions, bubble advance fronts mobilize the entire suspension. When the bubble deformation regime is reached, the mobilized area shrinks until, in the fracture regime, only the area in the direct vicinity of the gas front is mobilized. This behavior indicates an intrinsic resistance to flow within the suspension, which develops in the deformation regime and can be explained by local jamming phenomena because of particle interactions in a frictional system [12].
The importance of particle interactions is further demonstrated by the rigidity of particle-rich foams in vertical cylinder experiments. While foams with few particles tend to slump back to their original volume at the end of an experiment, particle-rich foams (ϕ > ϕdef) maintain their peak bulk volume, 2–3 times their original bubble-free volume, even after gas exsolution ends (Figure 9). In this case, foams with high particle concentrations appear to be stabilized by a rigid structure of local solid-solid particle contacts.
The transition to bubble deformation at ϕdef = 0.86 ± 0.03 lies close to the random loose packing (RLP) of monodisperse spheres at 55.5 ± 0.5 vol% [ϕ = 0.867 ± 0.008, using 64% as the close packing of spheres; 19, 35]. This RLP value also marks the onset of shear-dilation [19]. Hence the bubble deformation regime occurs within the limits of RLP and random close packing (RCP). These dense suspensions dilate in response to shear, and can therefore develop a normal force against their boundaries and build force-bearing networks of particles. The strength of the particle networks is determined by the number of particles in contact with each other [22], the friction between particles [36], and the magnitude of the forces that resist particle displacement / dilation, such as the flexibility of the boundaries against which the force chains rest [24, 37], or the applied pressure [e.g., from gravitational loading; 17].
In our experiments, the forces that resist dilation include frictional interaction with the rigid plates or cylinder walls, the internal bubble pressure and the interfacial tension at the gas-liquid boundary. We suggest that the bubbles and particles both act on- and react to- each other. The growing bubbles displace the whole suspension, and are therefore the source of shear stress that causes dilation. They create strong force chains inside the suspension that, in turn, locally resist bubble growth. The growing bubble must then deform around this “backbone,” preferentially displacing areas in the suspension with unconnected or weakly connected particles, where the stress opposing motion is lowest. As a result, the bubble deforms into a lobate or finger-like pattern (“bubble deformation regime” in Figure 11).
The stress that opposes bubble growth increases as particle fractions increase toward RCP, where fracture propagation begins (ϕfr ≈ 1). Previous research shows that at ϕ ≈ 1, if confining pressures are high, the particle network can lock. Under these conditions, the gas front cannot mobilize the particles, because the mechanical forces that resist particle displacement are stronger than those generated by bubble expansion, and the gas must advance by invading the pore-space [15, 17, 18]. Importantly, the fracture regime was not observed in experiments with in situ bubble generation. In these three-phase suspensions, compressible bubbles increased the bulk deformability, which may have affected fracture formation. Therefore, it appears that the suspension must be neither too rigid nor too deformable for the fracture regime to occur.
This frustrated dilation model fits well with our observations, where regime transitions are controlled by particle interactions, and are not affected by liquid viscosity, bubble growth rate or container shape. Interestingly, frustrated dilation, as well as the dependence of suspension behavior on ϕ (when ϕ > ϕdef), are also consistent with discontinuous shear-thickening, the rapid increase of a suspension's bulk viscosity over a short range of applied shear [23, 24].
Consequence for Outgassing
We propose that the interactions that occur between the densely packed particles create particle force chains that resist bubble growth, and cause the gas front to deform around the areas that offer the larger resistance. This causes bubble deformation on two scales, and bubble compression.
Large-scale Bubble Deformation
The increase in outgassing efficiency with increasing particle fraction at ϕ > ϕdef in the experiments involving chemical reactions coincides with the onset of bubble deformation observed in parallel plate geometries (Figure 11). Similarly, in experiments involving chemical reactions in small-gap parallel plates, bubble deformation is significantly greater, and bubble sizes significantly smaller, in experiments above ϕdef than in those below ϕdef (Figure 8). In particle-rich experiments, regular gas release maintains a relatively constant bubble size distribution. Hence bubble deformation and bulk permeability appear to be linked. Indeed, bubble deformation enhances the likelihood of bubble contact and coalescence, and thus the likelihood of forming a bubble network that reaches the edge of the suspension [38, 39]. When a network of touching bubbles breaches the edge of the suspension, a large-scale outgassing episode ensues, until the network seals again and other bubbles expand. As a consequence, the gas flux exiting the suspension is episodic and expressed as sudden and dispersed bursting events. This episodic gas release also characterizes the transition to fractures, since in single bubble experiments, thin fingers and fractures open and seal intermittently, releasing gas in puffs (Figure 4B).
Small-scale Perturbation of Bubble Walls
Particles also affect the coalescence of bubbles on the scale of inter-bubble films. Previous work on foam stability (mostly in colloidal suspensions) focuses on static foams, where bubbles are not formed in situ, and the bubble volume fraction does not increase with time [e.g., review by 40–42]. In these foams, particles that are wetting and density-matched increase foam stability by (a) increasing the viscosity and thus stabilizing thick films, (b) obstructing gravitational drainage, and (c) limiting coarsening, the diffusion of volatiles from smaller bubbles toward larger bubbles. We compare this expectation with our cylindrical experiments with internally nucleated bubbles. In accordance with these results, after the chemical reactions ended (static foam), particle-rich foams retained their peak bubble volumes, displaying an ability to resist gravitational collapse (Figure 9). However, while the bubbles were growing (dynamic foam), experiments with ϕ > ϕdef showed increased gas expulsion. Particle-rich foams reached a maximum bubble capacity early on in the experiment (Figures 9, 10) and had markedly smaller bubbles than particle-poor foams (Figure 8). Therefore, particles appear to weaken bubble walls in a dynamic foam.
The most important distinction between a static and dynamic foam is that as the bubbles grow, the films between bubbles elongate and thin with time. Inefficient particle packing in a bubble film causes the film surface to deform around the protruding particles, as shown in gravitational drop detachment experiments. In these experiments, drops with higher particle fractions detached earlier, at a shorter filament length and at larger filament diameters [43, 44]. An additional detachment regime was observed, whereby the air intrudes in the gaps between particle clusters until a short-lived particle-free filament separates two particle rich bodies [45]. A similar mechanism likely occurs in planar films between bubbles in a foam. If the film can rupture earlier, and at shorter elongation, then bubble coalescence will also occur earlier and at smaller bubble sizes.
Bubble Compression
As particle fractions increase above ϕdef, the areas mobilized by the expanding bubble localize to the bubble edge, where the shear stress is highest (Figure 5). This localization illustrates the increase in stress necessary to deform the suspension as the force-bearing particle chains transmit force to the confining plates, thereby increasing the opposing frictional stress experienced by the moving interface. As a result, the suspension can resist larger internal bubble pressures with minimal bulk deformation, and limit bubble expansion. Because this stiffening occurs in conjunction with bubble deformation, the small pressurized bubbles are also more likely to outgas. This is best illustrated in Figure 4, where air injection in particle-rich suspensions (ϕ > 0.86) caused less bulk growth than in particle-poor suspensions, despite substantially higher internal bubble pressures.
General Conclusions
We have identified two successive changes in gas migration regime that occur in particle-rich suspensions. The first transition, predominant in all sets of experiments, occurs when particle fractions reach the random loose packing. At this packing fraction, dilation of the granular network develops in response to shear, and creates a local resistance to bubble growth, causing the bubbles to deform. At the random close packing, gas migration can occur in a fracture-like manner if the suspension is somewhat deformable and does not contain too many bubbles. Parameters such as liquid viscosity (or viscosity ratios), container geometry, or gas inflow rate may affect certain aspects of bubble migration (internal pressure, front velocity, or bubble shapes within individual regimes), but they did not affect regime transitions within the ranges tested. Instead, the transitions were entirely dependent on particle interactions.
Furthermore, we establish a link between the onset of bubble deformation in particle-rich suspensions and increased outgassing with increasing particle fractions. The particle-particle interactions that occur in such densely packed suspensions promote outgassing by (1) deforming bubbles into long fingers and fractures that reach far into the suspension, (2) causing perturbations at the bubble walls facilitating coalescence of neighboring bubbles, and (3) compressing the bubbles (limiting bulk expansion). As a result, a new gas migration regime occurs. It is characterized by an increase in permeability whereby the gas escapes through pathways formed by coalesced bubbles. This type of outgassing occurs in bursts or puffs, through transient apertures that open and seal intermittently.
Because liquid viscosity does not significantly affect these gas migration regimes, they are likely applicable to most granular deformable media, including crystal-rich magmas. Severely deformed bubbles are commonly observed in such magmas [e.g., 46, 47], therefore our results give a compelling explanation for the efficient outgassing of these particle-rich slurries.
Conflict of Interest Statement
The authors declare that the research was conducted in the absence of any commercial or financial relationships that could be construed as a potential conflict of interest.
Acknowledgments
We would like to thank Mr Charles Clapham for his help with building the set-up. The research leading to these results has received funding from the People Programme (Marie Curie Actions) of the European Union's Seventh Framework Programme (FP7/2007-2013) under the project NEMOH, REA grant agreement n° 289976. KVC acknowledges the AXA Research Fund for their support.
Supplementary Material
The Supplementary Material for this article can be found online at: https://www.frontiersin.org/article/10.3389/fphy.2015.00060
References
1. Cashman KV, Sparks RSJ. How volcanoes work: a 25 year perspective. Geol Soc Am Bull. (2013) 125:664–90. doi: 10.1130/B30720.1
2. Pinkerton H, Wilson L, Macdonald R. The transport and eruption of magma from volcanoes: a review. Contemp Phys. (2002) 43:197–210. doi: 10.1080/00107510110097756
3. Cashman KV. Volatile controls on magma ascent and degassing. The state of the planet: frontiers and challenges in geophysics. Am Geophys Union Monogr. (2004) 150:109–24. doi: 10.1029/150GM10
4. Mena PC, Ruzicka MC, Rocha FA, Teixeira JA, Drahoš J. Effects of solids on homogeneous-heterogeneous flow regime transition in bubble columns. Chem Eng Sci. (2005) 60:6013–26. doi: 10.1016/j.ces.2005.04.020
5. Kong XZ, Kinzelbach W, Stauffer F. Morphodynamics during air injection into water-saturated movable spherical granulates. Chem Eng Sci. (2010) 65:4652–60. doi: 10.1016/j.ces.2010.05.007
6. Mota A, Vicente AA, Teixeira J. Effects of spent grains on flow regime transition in bubble column. Chem Eng Sci. (2011) 66:3350–7. doi: 10.1016/j.ces.2011.01.042
8. Saffman PG, Taylor G. The penetration of a fluid into a porous medium or Hele-Shaw cell containing a more viscous liquid. Proc R Soc Lond Ser Math Phys Sci. (1958) 245:312–29. doi: 10.1098/rspa.1958.0085
9. Knudsen HA, Sandnes B, Flekkøy EG, Måløy KJ. Granular labyrinth structures in confined geometries. Phys Rev E (2008) 77:021301. doi: 10.1103/PhysRevE.77.021301
10. Sandnes B, Flekkøy EG, Knudsen HA, Måløy KJ, See H. Patterns and flow in frictional fluid dynamics. Nat Commun. (2011) 2:8. doi: 10.1038/ncomms1289
11. Chevalier C, Lindner A, Clément E. Destabilization of a saffman-taylor fingerlike pattern in a granular suspension. Phys Rev Lett. (2007) 99:4. doi: 10.1103/PhysRevLett.99.174501
12. Chevalier C, Lindner A, Leroux M, Clément E. Morphodynamics during air injection into a confined granular suspension. J Non-Newtonian Fluid Mech. (2009) 158:63–72. doi: 10.1016/j.jnnfm.2008.07.007
13. Shin H, Santamarina JC. Fluid-driven fractures in uncemented sediments: underlying particle-level processes. Earth Planet Sci Lett. (2010) 299:180–9. doi: 10.1016/j.epsl.2010.08.033
14. Varas G, Vidal V, Géminard JC. Morphology of air invasion in an immersed granular layer. Phys Rev E (2011) 83:7. doi: 10.1103/physreve.83.061302
15. Holtzman R, Szulczewski ML, Juanes R. Capillary fracturing in granular media. Phys Rev Lett. (2012) 108:4. doi: 10.1103/PhysRevLett.108.264504
16. Varas G, Geminard JC, Vidal V. Air invasion in a granular layer immersed in a fluid: morphology and dynamics. Granular Matter (2013) 15:801–10. doi: 10.1007/s10035-013-0435-7
17. Islam A, Chevalier S, Sassi M. Experimental and numerical studies of CO2 injection into water-saturated porous medium: capillary to viscous to fracture fingering phenomenon. Energy Procedia (2013) 37:5511–19. doi: 10.1016/j.egypro.2013.06.471
18. Holtzman R, Juanes R. Crossover from fingering to fracturing in deformable disordered media. Phys Rev E (2010) 82:5. doi: 10.1103/PhysRevE.82.046305
19. Onoda GY, Liniger EG. Random loose packings of uniform spheres and the dilatancy onset. Phys Rev Lett. (1990) 64:2727–30. doi: 10.1103/PhysRevLett.64.2727
20. Pica Ciamarra M, Nicodemi M, Coniglio, A. Recent results on the jamming phase diagram. Soft Matter (2010) 6:2871–4. doi: 10.1039/b926810c
21. Silbert LE. Jamming of frictional spheres and random loose packing. Soft Matter (2010) 6:2918–24. doi: 10.1039/c001973a
22. Bi DP, Zhang J, Chakraborty B, Behringer RP. Jamming by shear. Nature (2011) 480:355–8. doi: 10.1038/nature10667
23. Brown E, Jaeger HM. Shear thickening in concentrated suspensions: phenomenology, mechanisms and relations to jamming. Rep Prog Phys. (2014) 77:23. doi: 10.1088/0034-4885/77/4/046602
24. Brown E, Zhang HJ, Forman NA, Maynor BW, Betts DE, Desimone JM, et al. Shear thickening and jamming in densely packed suspensions of different particle shapes. Phys Rev E (2011) 84:11. doi: 10.1103/PhysRevE.84.031408
25. Liu AJ, Nagel SR. Granular and jammed materials. Soft Matter (2010a) 6:2869–70. doi: 10.1039/c005388k
26. Liu AJ, Nagel SR. The jamming transition and the marginally jammed solid. In: Langer JS, editor. Annual Review of Condensed Matter Physics, Vol. 1. Palo Alto: Annual Reviews (2010b). p. 347–69. doi: 10.1146/annurev-conmatphys-070909-104045
27. Llewellin EW, Mader HM, Wilson SDR. The rheology of a bubbly liquid. Proc R Soci Math Phys Eng Sci. (2002) 458:987–1016. doi: 10.1098/rspa.2001.0924
28. Richardson JF, Zaki WN. Sedimentation and fluidisation: part I. Trans Inst Chem Eng. (1954) 32:35–53.
30. Lenormand R, Touboul E, Zarcone C. Numerical models and experiments on immiscible displacements in porous media. J Fluid Mech. (1988) 189:165–87. doi: 10.1017/S0022112088000953
31. Schneider CA, Rasband WS, Eliceiri KW. NIH Image to ImageJ: 25 years of image analysis. Nat Methods (2012) 9:671–5. doi: 10.1038/nmeth.2089
32. Thielicke W, Stamhuis EJ. PIVlab – Towards User-friendly, Affordable and Accurate Digital Particle Image Velocimetry in MATLAB. J Open Res Soft. (2014) 2:e30. doi: 10.5334/jors.bl
33. Stickel JJ, Powell RL. Fluid mechanics and rheology of dense suspensions. Ann Rev Fluid Mech. (2005) 37:129–49. doi: 10.1146/annurev.fluid.36.050802.122132
34. Kamien RD, Liu AJ. Why is random close packing reproducible? Phys Rev Lett. (2007) 99:155501. doi: 10.1103/PhysRevLett.99.155501
35. Jerkins M, Schröter M, Swinney HL, Senden TJ, Saadatfar M, Aste A. Onset of mechanical stability in random packings of frictional spheres. Phys Rev Lett. (2008) 101:018301–4. doi: 10.1103/PhysRevLett.101.018301
36. Seto R, Mari R, Morris JF, Denn MM. Discontinuous shear thickening of frictional hard-sphere suspensions. Phys Rev Lett. (2013) 111:5. doi: 10.1103/PhysRevLett.111.218301
37. Brown E, Jaeger HM. The role of dilation and confining stresses in shear thickening of dense suspensions. J Rheology (2012) 56:875–923. doi: 10.1122/1.4709423
38. Walsh SDC, Saar MO. Numerical models of stiffness and yield stress growth in crystal-melt suspensions. Earth Planet Sci Lett. (2008) 267:32–44. doi: 10.1016/j.epsl.2007.11.028
39. Saar MO, Manga M, Cashman KV, Fremouw S. Numerical models of the onset of yield strength in crystal-melt suspensions. Earth Planet Sci Lett. (2001) 187:367–79. doi: 10.1016/S0012-821X(01)00289-8
40. Hunter TN, Pugh RJ, Franks GV, Jameson GJ. The role of particles in stabilising foams and emulsions. Adv Colloid Interface Sci. (2008) 137:57–81. doi: 10.1016/j.cis.2007.07.007
41. Dickinson E. Food emulsions and foams: stabilization by particles. Curr Opin Colloid Interface Sci. (2008) 15:40–9. doi: 10.1016/j.cocis.2009.11.001
42. Fameau AL, Salonen A. Effect of particles and aggregated structures on the foam stability and aging. C. R. Phys. (2014) 15:748–60. doi: 10.1016/j.crhy.2014.09.009
43. Bonnoit C, Bertrand T, Clement E, Lindner A. Accelerated drop detachment in granular suspensions. Phys Fluids (2012) 24:14. doi: 10.1063/1.4704801
44. Bertrand T, Bonnoit C, Clement E, Lindner A. Dynamics of drop formation in granular suspensions: the role of volume fraction. Granular Matter (2012) 14:169–74. doi: 10.1007/s10035-012-0318-3
45. Roche M, Kellay H, Stone HA. Heterogeneity and the role of normal stresses during the extensional thinning of non-brownian shear-thickening fluids. Phys Rev Lett. (2011) 107:5. doi: 10.1103/PhysRevLett.107.134503
46. Bacon CR. Magmatic inclusions in silicic and intermediate volcanic rocks. J Geophys Res. (1986) 91:6091–112. doi: 10.1029/JB091iB06p06091
Keywords: three-phase suspension, porosity, permeability, outgassing, bubble deformation, granular material, rheology, crystal-rich magma
Citation: Oppenheimer J, Rust AC, Cashman KV and Sandnes B (2015) Gas migration regimes and outgassing in particle-rich suspensions. Front. Phys. 3:60. doi: 10.3389/fphy.2015.00060
Received: 01 May 2015; Accepted: 27 July 2015;
Published: 12 August 2015.
Edited by:
Wei-Xing Zhou, East China University of Science and Technology, ChinaReviewed by:
Kunal Bhattacharya, Birla Institute of Technology and Science, Pilani, IndiaChristopher William MacMinn, University of Oxford, UK
Copyright © 2015 Oppenheimer, Rust, Cashman and Sandnes. This is an open-access article distributed under the terms of the Creative Commons Attribution License (CC BY). The use, distribution or reproduction in other forums is permitted, provided the original author(s) or licensor are credited and that the original publication in this journal is cited, in accordance with accepted academic practice. No use, distribution or reproduction is permitted which does not comply with these terms.
*Correspondence: Julie Oppenheimer, Volcanology Group, School of Earth Sciences, University of Bristol, Queen's Rd, BS8 1RJ Bristol, UK, julie.oppenheimer@bristol.ac.uk