Invasion patterns during two-phase flow in deformable porous media
 Fredrik K. Eriksen
 Renaud Toussaint
 Knut J. Måløy
 Eirik G. Flekkøy2
- 1Institut de Physique du Globe de Strasbourg, Université de Strasbourg/EOST, Centre National de la Recherche Scientifique, Strasbourg, France
- 2Department of Physics, University of Oslo, Oslo, Norway
We study the formation of viscous fingering and fracturing patterns that occur when air at constant overpressure invades a circular Hele-Shaw cell containing a liquid-saturated deformable porous medium—i.e., during the flow of two non-miscible fluids in a confined granular medium at high enough rate to deform it. The resulting patterns are characterized in terms of growth rate, average finger thickness as function of radius and time, and fractal properties. Based on experiments with various injection pressures, we identify and compare typical pattern characteristics when there is no deformation, compaction, and/or decompaction of the porous medium. This is achieved by preparing monolayers of glass beads in cells with various boundary conditions, ranging from a rigid disordered porous medium to a deformable granular medium with either a semi-permeable or a free outer boundary. We show that the patterns formed have characteristic features depending on the boundary conditions. For example, the average finger thickness is found to be constant with radius in the non-deformable (ND) system, while in the deformable ones there is a larger initial thickness decreasing to the ND value. Then, depending on whether the outer boundary is semi-permeable or free there is a further decrease or increase in the average finger thickness. When estimated from the flow patterns, the box-counting fractal dimensions are not found to change significantly with boundary conditions, but by using a method to locally estimate fractal dimensions, we see a transition in behavior with radius for patterns in deformable systems; In the deformable system with a free boundary, it seems to be a transition in universality class as the local fractal dimensions decrease toward the outer rim, where fingers are opening up like fractures in a paste.
Introduction
Multi-phase flow in porous and granular materials are complex processes in nature and industry, and the understanding of the involved mechanisms is an ongoing challenge. In early research on the flow of two immiscible fluids in thin cells (Hele-Shaw cells), it was found that the invasion by a less viscous fluid into a more viscous fluid results in a displacement instability where viscous fingering patterns form [1]. This means that the invading fluid displaces the more viscous one in separated finger-like intrusions, while leaving the fluid inbetween the fingers less or not displaced. Following an increased interest in this phenomenon, two-phase flow have been widely studied in quasi-2-dimensional porous media confined in thin cells with circular and rectangular geometries [2–14]. In horizontal cells containing rigid disordered porous media, the unstable invasion patterns during drainage are found to be fractal and either form an invasion percolation cluster [15] in the capillary fingering regime [16, 17], or long thin fingers resembling DLA patterns in the viscous fingering regime [18, 19]. The flow regime during drainage of a horizontal porous medium is dependent on the ratio between the driving and stabilizing forces involved in flow and pore-invasion, usually described by the dimensionless capillary number Ca [3, 5]. The capillary number is the ratio of viscous pressure drop over capillary pressure drop at the characteristic pore scale, and can be found by
where μ is the viscosity of the saturating fluid, v is a characteristic velocity (flux/injection cross section), a is the bead diameter, γ is the interface tension between the invading and defending fluid and κ is the permeability of the porous medium. For low capillary numbers (Ca ≪ 1) capillary fingering dominates and for higher capillary numbers (Ca → 1) there is a crossover to viscous fingering. The stabilizing mechanism is provided by a network of capillary pressure thresholds situated at the pore-necks along the fluid-fluid interface. The capillary thresholds arise from the surface tension γ between the immiscible fluids and is described by
where R1 and R2 are the smallest possible radii of curvature for the interface meniscus in the vertical and horizontal directions. In a perfect wetting situation, the radii are half the height of the pore-neck and half the width of the pore-neck. The capillary pressure thresholds at each pore is thus determined by the pore geometry. The consequence of Equation (2) is that the pressure difference dP between the invading and saturating fluids has to overcome a certain threshold before a given pore is invaded, i.e., dP > pcap. At low enough capillary numbers, at very low constant injection flow, we will see pore-by-pore invasions where the fluid takes the path of least resistance (larger pores have lower thresholds), leaving some pores trapped and/or never invaded. At higher capillary numbers, flow may be driven on a sample scale by a viscous pressure gradient over the saturating fluid. The filtration velocity (interstitial fluid velocity times the porosity) v through a porous medium with permeability κ is described by Darcy's law as
where μ is the viscosity of the saturating fluid, ΔP is the pressure difference between the invading fluid and the cell outlet, and r is the distance from the invading fluid to the cell outlet. At high enough capillary numbers, since the pressure can be considered constant within the invading fluid cluster [19], Equation (3) shows that the parts of the cluster that are closer to the outside of the cell flow faster than less advanced parts. In addition, the pressure distribution is given by the Laplace equation (∇2P = 0) such that the longest fingers are “screening” the pressure gradient from the less advanced fingers [19]. Due to this instability and the geometry of the pore-space, an invasion bubble will become perturbed early and we will see the onset of viscous fingers from the most advanced parts of the interface, growing on expense of the less advanced parts. In addition, the flow path of fingers is influenced by random capillary thresholds at the interface.
In similar systems where air is injected with high enough overpressure into dry and dense deformable porous media in thin cells, granular fingering patterns emerge as a result of hydraulic fracturing of the dense packing [20–24]. This granular fingering is also observed in liquid saturated dense porous media where the same fluid is injected [25]. An interesting observation in these cases is that despite the absence of surface tension, the granular fingering patterns resemble viscous fingering. This fingering formation is driven by momentum exchange between the flowing fluid and particles, and becomes unstable like viscous fingers when the fluid-solid interface is perturbed. The stabilizing mechanism during granular fingering was found to be particle-particle and particle-plate friction, which builds up in stress-chains during compaction of the multi-layered packing and prevents further particle displacement.
Moreover, combinations of two-phase and granular flow in thin cells have been studied. In e.g., [26–28] it was found that a range of different patterns emerge when air is injected in granular suspensions in thin cells. Invasion patterns such as frictional fingering, viscous fingering, fluidized fronts and stick-slip bubbles were observed depending on bead fraction and injection rate. The resulting patterns depend on whether the invading fluid overcomes frictional or capillary thresholds first, i.e., bead displacement occurs when the capillary threshold is highest and pore-invasion when the frictional threshold is highest. Experiments with air injection into saturated deformable porous media placed under a confining pressure was studied in Holtzman et al. [29]. For a given interface tension γ and friction coefficient μf, the crossover from fingering to fracturing during constant flow rates was found to depend only on the confining pressure Pc and particle size d, and that fracturing tends to occur if the particle size is below a critical value dc = (γ/μf)Pc−1. In other words, opening of pore-necks and fracturing was observed when capillary forces could overcome frictional thresholds and rearrange particles. Flow induced deformation in a monolayer of deformable porous media has also been studied in the absence of surface tension, during fluid injection into a soft granular media saturated with the same fluid [30]. During injection, the beads were observed to be displaced radially outwards due to the pressure gradient in the flow, and an empty cavity formed around the injection center. In these experiments, no fingers emerged and the central cavity stabilized at a certain size since the beads were confined within the cell.
In this paper we present an exploratory study where we further experiment with the combination of two-phase and granular flows by performing air injection into saturated monolayers of beads. It is part of fundamental research on pattern morphology in various deforming systems, which is important for increased understanding of flow in any deformable porous medium. By injecting air at a constant overpressure into a deformable saturated monolayer, we have a system where particles may be displaced by a viscous pressure gradient and/or capillary forces between the two fluids. Since it is a single layer of beads without imposed confining pressure, granular stress is expected to depend on the boundary condition and number of particles in contact ahead of the flow, rather than build-up of normal stress against the plates. The outer boundary can be set to either allow or prevent decompaction of the medium. As a result of competition between viscous and capillary forces, and build-up/relaxation of friction during flow, we expect to see transitions between finger opening and pore invasion in the viscous fingering regime, for example during initial compaction or outer decompaction. We aim to characterize these flow patterns and porous media deformations, depending on imposed boundary conditions and injection pressure.
Increased knowledge of the mentioned processes may have applications in earth science and industry where multiphase flow and solid deformation occur. Examples are oil and gas production [31–33], carbon sequestration [34], enhancement of water well- and geothermal energy production [35–37]. There may also be applications in natural flow, especially in the field of subsurface sediment mobilization, where formations like sand injectites, mud diapirs, and mud volcanoes occur due to pore-fluid overpressure [38–43].
Materials and Methods
Three different types of porous media samples are created by preparing them with the different boundary conditions referred to as non-deformable (ND), confined deformable (CD), or open deformable (OD). These three sample types are presented after a brief introduction to the general experimental setup which is common for all the experiments.
Experimental Setup
In general, the porous samples are created by forming a single layer of 1.0 mm diameter glass beads between the transparent plates of a horizontal and circular Hele-Shaw cell. The bead size has a tolerance of ±10%, but beads are sifted, resulting in a distribution between 1.0 and 1.1 mm. The diameter of the cell is 40 cm, and the 10 mm thick plates are clamped together with a vertical plate separation of 1.0 mm in the ND case and 1.4 mm in the deformable cases. This setup results in obtained volume fractions of 32.7 ± 0.9% beads in the ND cell, and 29.4 ± 1.8% beads in the cell for the deformable systems. If we only consider the volume occupied by the monolayers, the deformable systems have ~105 beads with a volume fraction that is 68.2 ± 4.2% of ηhcp, where ηhcp = 60.5% is the volume fraction of the densest possible bead configuration in the cell if the plate separation is 1.0 mm (i.e., a hexagonal close packing with ~1.45·105 beads). The ND systems have ~8·104 beads and a volume fraction that is 54.2 ± 1.4% of ηhcp. The reason for the different monolayer volume fractions arise from the different filling procedures for the ND and CD/OD systems, which are described in the next section. The fluid inlet to the sample is a 10 mm diameter hole in the center of the bottom disk, and the outlet is the open perimeter along the rim of the cell. After a sample is prepared, its pore-space is saturated with a viscous water-glycerol solution consisting of 20% water and 80% glycerol by mass, with a viscosity of 0.045 Pa·s. The saturating fluid is wetting the beads as well as the cell disks. Figure 1 shows a cross-sectional illustration of the experimental setup.
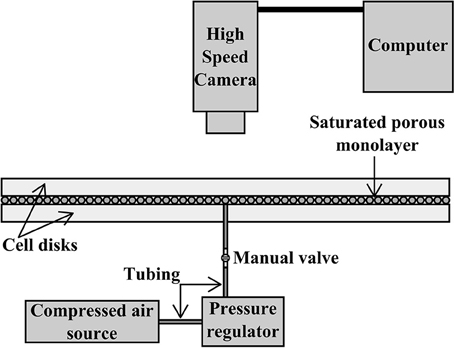
Figure 1. Sketch of the experimental setup for the two-phase flow experiments: The horizontal cell consists of two transparent disks of 40 cm in diameter, clamped together (not shown) but separated by a small gap. The gap is big enough to accommodate a saturated porous monolayer of 1.0 mm beads. This sketch represents the non-deformable system, however the setup is the same for the other boundary conditions as well. A compressed air source is connected to an injection hole in the center of the bottom disk, and a pressure regulator is used to adjust the constant injection pressure between 25 and 100 hPa. During air injection, the high speed camera situated directly above the cell captures the invasion at a framerate of 125 frames per second.
The experimental procedure is also common for all the sample types; the air overpressure to be applied at the cell inlet is pre-set with a pressure regulator situated between a pressurized air reservoir and the cell inlet. The experiment starts when the inlet valve is opened, allowing air to invade the sample with a maintained and constant overpressure. As the overpressure is kept constant at a pressure in the range from 25 to 100 hPa (hPa = mbar), the air cluster will grow and drain the sample radially outwards until it breaks through at the rim. Breakthrough of the air cluster was seen in all our experiments and marks the end of the experiment. The cell is illuminated by flicker free white light from below, and a Photron SA5 high-speed camera positioned above the cell captures optical data at a framerate of 125 frames per second (fps) during the experiment.
Three Cases of Boundary Conditions
The porous matrix of a ND sample is rigid, single-layered and disordered. This sample type is prepared on the bottom disk before assembling the cell; first, the top surface of the bottom disk is coated with an adhesive, thin and transparent plastic film. Then, beads are poured onto the adhesive surface, which will cause them to attach at random positions on the bottom disk. The process is continued until no more beads are able to hit the bottom disk surface, i.e., when the longest distance between beads in the monolayer is shorter than a bead diameter. Pores that are slightly smaller than a bead can occur, so this filling procedure generates a rather loose packed random layer. After removing excess beads of a beginning second layer, the top disk, also adhesive, is put onto the resulting monolayer and clamped together with the bottom disk. The disk separation therefore equals the bead diameter of 1.0 mm.
The porous matrix of a CD sample is a random close packed monolayer of beads which can be displaced within the cell volume, but are prevented to leave the cell by a semi-permeable border. This sample type is prepared partially before and after assembling the cell. First, the rim of the bottom disk is fitted with a semi-permeable belt made of foam rubber (it can be seen in Figure 2A). This belt, which is permeable to fluids and impermeable to beads, is 5 mm wide. Next, the top disk is placed onto the bottom disk and they are clamped together. The disk separation is controlled with 1.4 mm thick spacers between the disks at the clamp positions, and ensures the possibility of bead displacement as well as keeping the bead packing approximately single-layered. The gap above the beads (0.4 mm) is still smaller than the large interparticle nearest distance in the system (1 mm), and we observed no significant invasion occurring over several bead lengths in the gap above the beads. When clamped between the plates, the semi-permeable belt with an elastic stiffness of 1.5 kPa is imposed a 47% compressive strain, and has an estimated permeability of 10−5 cm2. Finally, beads are injected into the cell through the central injection hole until they form a monolayer that fills the confined volume. Since the beads may rearrange during the filling procedure, this method results in a more close packed random layer than achieved with the ND method.
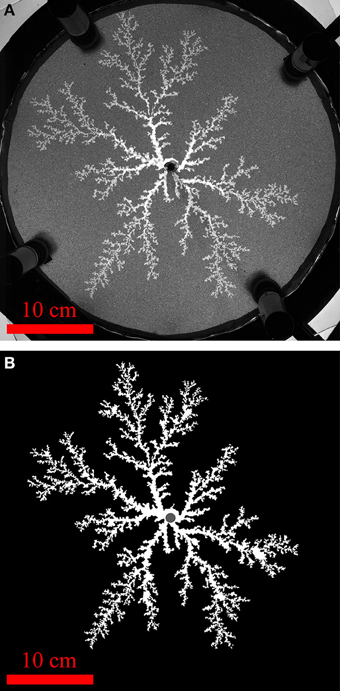
Figure 2. The raw data breakthrough image of the confined deformable experiment with 75 hPa injection pressure (A), and the resulting binary image after segmentation of the air cluster (B), where the active pixels belonging to the cluster is shown in white and the inactive background pixels are shown in black. The dark injection region where it is difficult to separate saturated and invaded parts is indicated in gray, and is excluded from our analysis. In the raw data image we can also see the 0.5 cm thick semi-permeable belt surrounding the porous medium.
The OD sample is prepared in the same way as the CD sample, but with a temporary semi-permeable border at the rim which is removed before experiments. This means that the OD porous matrix is a deformable monolayer where the beads can be displaced and also pushed out of the cell at the open perimeter. Thus, on one side of the scale we have the ND boundary condition where nothing is deformed in the porous medium, and on the other end of the scale we have the OD boundary condition where most of or all of the sample is deformed. Somewhere in between we have the CD boundary condition.
Performed Experiments
Ten experiments are considered in this study. They lasted between 0.9 and 9.7 s, where two of them were ND, four were CD and four were OD. The two ND experiments, used as reference for no deformation, were both injected with an air overpressure of 25 hPa and are labeled ND1 and ND2. Patterns in this system will appear similar for higher injection pressures since we already are in the viscous fingering regime. The CD experiments are referred to as CD25, CD50, CD75, and CD100 since the injection pressures were set as 25, 50, 75, and 100 hPa, respectively. The injection pressures in the OD experiments were selected in the same way, so these experiments are referred to as OD25, OD50, OD75, and OD100. Approximate capillary numbers Ca were calculated for each experiment, based on the equation
which is obtained by combining Equations (1) and (3), where a = 1 mm is the typical pore size, γ = 65.7 μN/mm is the interfacial tension between the fluids, R = 20 cm is the cell radius and ΔP is the imposed overpressure. The approximate capillary numbers are found to be Ca = 0.2, 0.4, 0.6, and 0.8 for ΔP = 25, 50, 75, and 100 hPa, respectively, and independent of boundary conditions. These capillary numbers confirm that the displacement flow in all our experiments is dominated by viscous forces (viscous fingering regime), as seen in e.g., Løvoll et al. [3] for Ca = 0.22. A characteristic permeability for the systems is estimated with the Kozeny-Carman relation [27],
where a is the bead diameter and ϕ is the porosity. For the ND system with a porosity of 0.673, we get κ = 1.22·10−4 cm2, and for the deformable systems with a porosity of 0.706 we get κ = 2.26·10−4 cm2 (initially, before deformation). In the CD system, the permeability of the outer belt is one order of magnitude lower than the initial permeability of the porous medium, however we observed no significant influence on the flow regime due to that. For a characteristic filtration velocity, the pressure drop along a distance L is given by ΔP = μvL/κ. Even if κ is smaller in the belt than in the cell, its extent L along the flow is much smaller than the radius of the cell. Thus, the characteristic pressure drop, which scales like L/κ, is much larger in the cell than in the belt—explaining why it does not seem to significantly affect the pattern.
The raw data from each experiment is a sequence of grayscale images with a spatial resolution of 1024 × 1024 pixels, where the side of one pixel corresponds to 0.4 mm. The framerate yields high temporal resolution with a snapshot every 8 ms, and each image contains information about the instantaneous configuration of the air cluster and the porous medium. A raw data snapshot is shown in Figure 2A.
Flow Pattern Analysis
The raw images are transformed into binary images of the air clusters, i.e., every pixel being a part of the air cluster, defined as having an intensity value above a certain threshold, is given the pixel-value “1” (white) while all the other pixels are assigned the pixel-value “0” (black). An example is shown in Figure 2B. In the images of ND experiments, beads have been removed by subtracting the graymap field of the initial image from the graymap field of the current image - a process called image subtraction technique (as e.g., in Løvoll et al. [3], Niebling et al. [12]). Later on, trapped liquid clusters within fingers are replaced by white pixels, considering them as parts of the finger. In the images of deformable experiments, beads have been removed by deleting small white clusters not connected to the large white pattern. A dark central region of 10 mm in diameter is caused by shadow from the injection tubing, so image data here is not considered (the air cluster cannot be distinguished from the liquid). There are different features of the flow patterns that we want to analyze, such as their shape, growth, and fractal dimension. This information is obtained from the binary images with various image processing methods.
To get a visual overview of the shape and growth of a flow pattern over time we create a figure of the breakthrough pattern where colors indicate the time when a pixel was invaded by air. Such a figure is made by summing together all the binary images in the sequence (obtained as explained above), creating a matrix where the elements indicate the number of timesteps during which the considered pixel has been invaded: A value more than 1 means that invasion occurred earlier than breakthrough, 1 is at breakthrough and 0 means that this pixel is never invaded. This matrix is then converted to a figure where colors represent the time of invasion at each pixel of the air cluster, and shown in Figure 3 for each of the experiments.
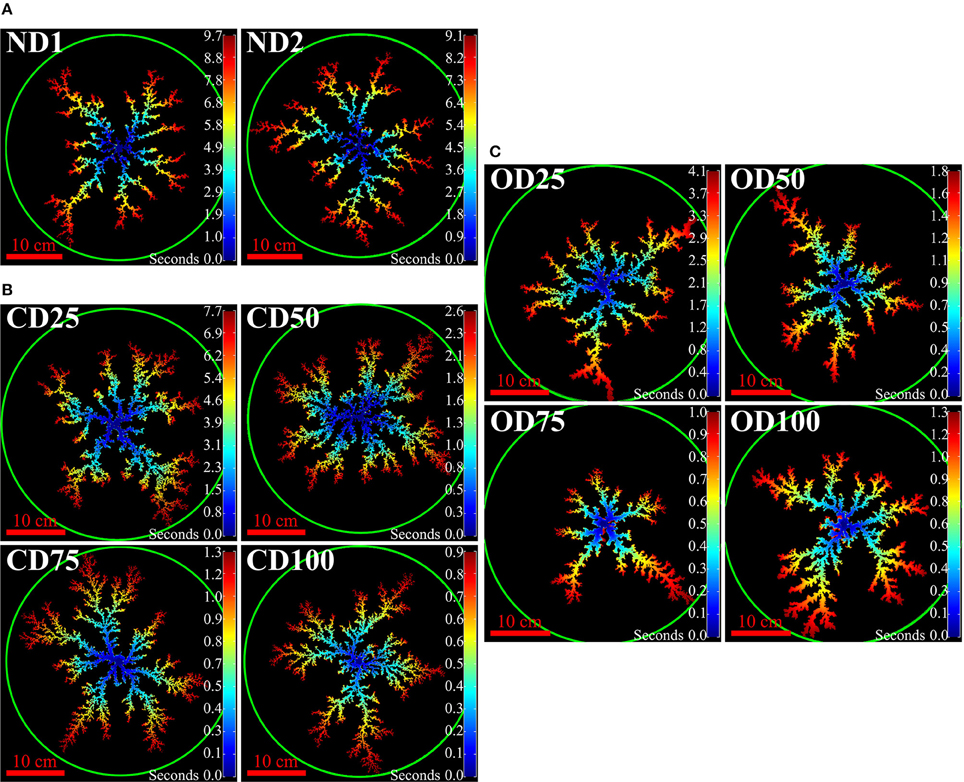
Figure 3. Breakthrough patterns for the non-deformable experiments (A), confined deformable experiments (B), and open deformable experiments (C). Both ND experiments have an injection pressure of 25 hPa, while for the CD and OD experiments the number in the experiment name (top left corners) gives the injection pressure in hPa. The color code indicates the time of air invasion in seconds after start, where blue is at the start and dark red is at breakthrough. The green circles indicate the cell rims.
In addition to a visual characterization of the patterns, we obtain some quantities to describe the growth of the clusters over time. To investigate the growth of the clusters we plot the radius of the most advanced finger and the radial variation of finger thicknesses as function of time. The longest finger radius as function of time is found by assigning values to the pixels in the binary patterns according to their distance from the injection center, and then record the highest value of each image in the sequence. For the investigation of radial finger thickness variation we look at the average finger thickness as a function of radius from the injection center. This is found by counting the number of active pixels within a small window (plus minus one pixel) around each integer radius, giving the total sum of finger widths per radius. These values are then divided by the corresponding number of fingers per radius (the number of active pixel-segments at each radius), giving the average finger thickness per radius.
Fractal analysis is a commonly used method to describe a two-phase flow pattern since its fractal dimension, when it exists, reveals information about how the pattern fills the space it occupies. There are different ways to estimate the fractal dimension of a pattern [44, 45]. We will look at the mass- and box fractal dimensions, and compare them with local fractal dimensions of intersections at different radii. The mass-radius relation of a pattern is found by counting the number of active pixels (mass) contained within each radius from the injection center. If the log-log plot of the mass-radius relation is linear, such that it follows a power law
the fractal mass-dimension Dm of the pattern is found as the slope of the plot. Figure A1 in the Supplementary Material shows the mass-radius relations for the breakthrough patterns from each experiment. The fractal box-dimension of a pattern is estimated by counting the number of squares needed to cover the pattern as a function of the side length of the square. As boxes we use grids of equal squares, where the pattern center is always in the center of a square. Starting with a square larger than the image size, a box count is performed before decreasing the box size. This is repeated until the smallest square covering the entire pattern is found. Then, the smallest box covering the entire pattern is divided into equal but increasingly smaller squares for each box count. The procedure of subsequent box size decreasing and counting is continued until the lower size limit of one pixel is reached. For a fractal, the number of boxes N as function of side length l follows a power law
The value of the fractal box-counting dimension Db is found as the opposite of the slope of the number of boxes as function of side length in a log-log plot. The slope is fitted between the lower box size cutoff at 1 mm (typical pore size), and the upper cutoff at the largest box size where at least one box does not cover the pattern. Figure A2 in the Supplementary Material shows these plots for each experiment. Finally, a local fractal dimension DL is estimated as function of radius by intersecting the pattern with a one pixel thick, concentric ring at each radius and do 1-dimensional box counts along the rings. At each radius, the ring is divided into equal arc segments and the number of arc segments that intersect the pattern are counted as function of arc length as the arc length is decreased. The number of arc segments intersecting the pattern is plotted in a log-log plot as a function of arc length, and we find the local fractal dimension as the opposite of the value of the slope as shown in Figure 4. The local dimension slopes have one upper and one lower cutoff length at each radius. The upper cutoff length is approximately the separation distance between fingers along the ring, and the lower cutoff length is approximately the average thickness of the fingers. We set the lower cutoff constant as the average finger thickness for the ND patterns, which is found to be approximately 0.4 cm (see Section Pattern Characteristics). The upper cutoff length is set at each radius as the maximum arc length where at least one of the arc segments does not intersect the pattern and is not counted. It is assumed that the flow patterns have an isotropic pattern morphology such that the local fractal dimensions are independent on the angular offset of the arcsegment cuts. In order to compare DL with Dm and Db we use Mandelbrot's rule of thumb for intersecting fractal sets [46, 47]. It states that the codimension of a set of intersection points equals the sum of codimensions of the individual intersecting sets. In our case, in the image plane (with dimension E = 2), the intersecting sets are the air cluster of codimension 2-D and a ring of codimension 2-1. This gives
where D is the fractal dimension of the pattern and DL is the local fractal dimension. In a physical view, if the mass within a circle of thickness dr is given by dr·α(2πr)DL where α is a constant pre-factor, the total mass inside a radius R is given by
if DL is independent of r. For a perfect fractal cluster N(R) ~ RD, so if DL(r) is constant we have a perfect fractal with fractal dimension D = DL + 1.
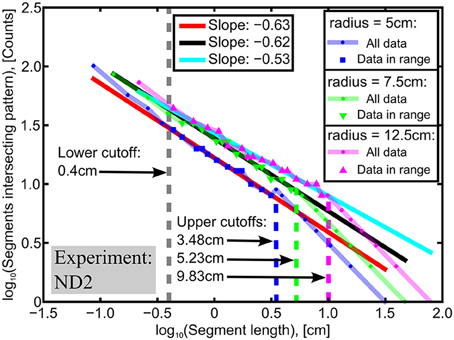
Figure 4. Results of 1-dimensional box counts of the ND2 pattern along a radius of 5, 7.5, and 12.5cm. The slopes that are used to determine the local fractal dimension are fitted to the data points in the range between the lower cutoff of 0.4cm (average finger width) and the upper cutoffs where the pattern appears space filling (indicated by arrows). We see that the upper cutoff, which is approximately the separation between fingers, increase for increasing radius. Local dimension as function of radius is found as the negative value of such slopes, estimated at each pixel radius (approximately every 0.04 cm) outside the injection region. However, at radii where there are < 10 data points between cutoffs, the local dimensions are not included for analysis.
Deformation Analysis
We quantify the deformation of a porous medium by processing the sequence of raw images with a Digital Image Correlation (DIC) software called Ncorr, which by cross-correlation of subsequent frames estimates both direction and magnitude of bead displacements. Closer discussions of this DIC algorithm is found in Blaber et al. [48], Hariral et al. [49]. A qualitative assessment of deformations in the different sample types is done by comparing figures representing the porous media where values of radial displacement components at each pixel is represented by a color code. In addition, areas of compaction or decompaction are identified in figures where the volumetric strains εv are represented at each pixel. The volumetric strains are found by Vable [50]
assuming that εzz = 0 in the direction normal to the plates, corresponding to the fixed character of the side plates. The strains εxx and εyy at a pixel are estimated from the gradients of the displacement fields around that pixel. In order to reduce noise, least-squares fits are made to the displacement fields within an approximate 2 mm radius around the evaluated pixel, and the slopes of the fits are considered as the displacement gradients.
Results
Pattern Characteristics
The flow patterns from all ten experiments are shown in Figure 3, where the color of a pixel indicates the time taken from experiment start until the area of the pixel became invaded by air (For readers who wants a closer look, a larger image is included in the Supplementary Material). In Figure 3A, we see that the flow patterns in ND media have long and thin fingers, and the thickness of the fingers appears constant at all radii outside the injection center. The flow patterns in CD media are shown in Figure 3B, and they typically feature centrally few and thick fingers that cross over to thinner and more numerous fingers with increasing radius. For the flow patterns in OD media, shown in Figure 3C, we see centrally few and thick fingers that cross over to more numerous and thinner fingers at intermediate radii, which then cross back to few thick fingers near the cell outlet. The intermediate region where the fingers are thinner seems to decrease in length for increasing injection pressure. In all the systems the growth of fingers is mainly in the radial direction, favored on the finger tips, and more advanced fingers grow on expense of less advanced fingers.
Figure 5 shows plots of the longest finger radius as function of time for all the experiments, as well as breakthrough times as function of overpressure. The experiments and their breakthrough times are also listed in Table 1.
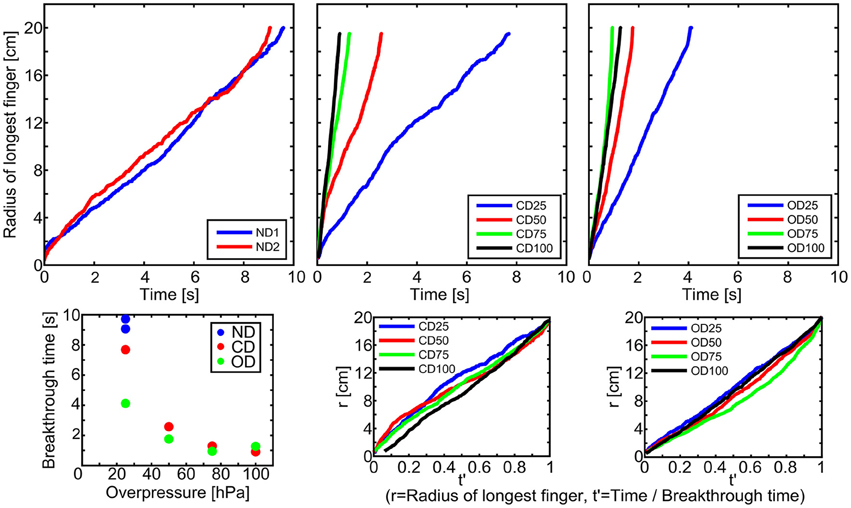
Figure 5. Radius of longest finger as function of time for all the experiments, grouped by boundary condition. From top left to top right: non-deformable, confined deformable, and open deformable. The injection pressure in both ND experiments is 25 hPa, while the number in the experiment names for the CD and OD experiments gives the injection pressure in hPa. In the bottom plots below the deformable experiments, time is divided by breakthrough time to compare the shape of the curves, and the bottom left plot shows the breakthrough times as function of overpressure for all the experiments.
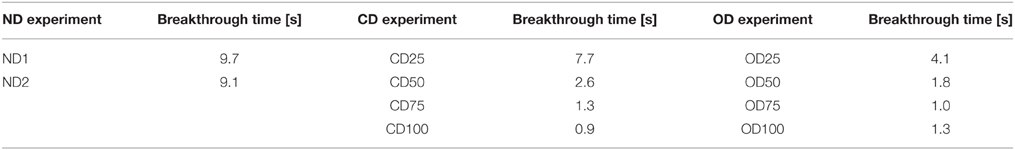
Table 1. Breakthrough times for the experiments.
Both the ND experiments were performed with a constant injection pressure of 25 hPa, and we see that the time required to reach breakthrough of the air cluster is similar for both experiments. In the CD experiments we see that the time until breakthrough decreases for increasing injection pressure. This is also seen in the OD boundary condition, except for OD100 which breaks through slower than OD75. The patterns seem to grow with a roughly constant rate over time with some deviations, e.g., a faster growth rate initially for the CD25 and CD50 cases, and OD75 with an increasing growth rate in the second half of the experiment.
In Figure 6, plots of the average finger thickness as function of radius are shown in several snapshots during the experiments. For both the ND experiments in Figure 6A we see that, over time, the average finger thickness approaches a limiting curve with a more or less constant value around 0.4 cm. For the CD experiments in Figure 6B we again see the average finger thickness approach a limiting curve over time, but in this system there is a continuous decrease in average finger thickness with increasing radius. For the CD25, CD75, and CD100 breakthrough patterns the average finger thickness starts at 1.0–1.5 cm near the injection center and quickly decreases to the ND value of 0.4 cm. The CD50 breakthrough pattern already has an average finger thickness of 0.4 cm initially. However, for all the patterns, when the average finger thickness has decreased to 0.4 cm it will continue to decrease slowly toward 0.2 cm over the remaining radial length of the sample. In the plots for the OD experiments in Figure 6C, we also see that the average finger thickness approach a limiting curve over time. In this system, the limiting curves have initially larger average finger thicknesses which decrease and approach the ND constant value of 0.4 cm with increasing radius. Then, after remaining at a thickness of around 0.4 cm over an intermediate range, the average finger thickness increases again when approaching the cell rim. The intermediate range where the average finger thickness is similar to the ND flow patterns seems to decrease in size for increasing injection pressure.
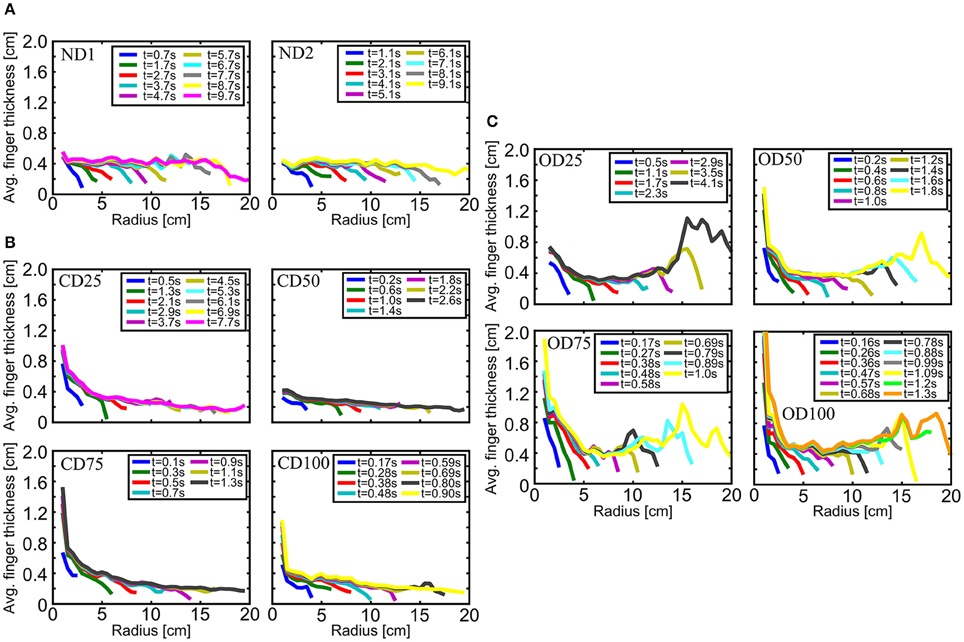
Figure 6. Average finger thickness as function of radius plotted at several snapshots for the non-deformable experiments (A), confined deformable experiments (B), and open deformable experiments (C). The injection pressure in both ND experiments is 25 hPa, while the number in the experiment names for the CD and OD experiments gives the injection pressure in hPa.
The different fractal dimensions found for the breakthrough patterns are shown in Figure 7; Table 2.
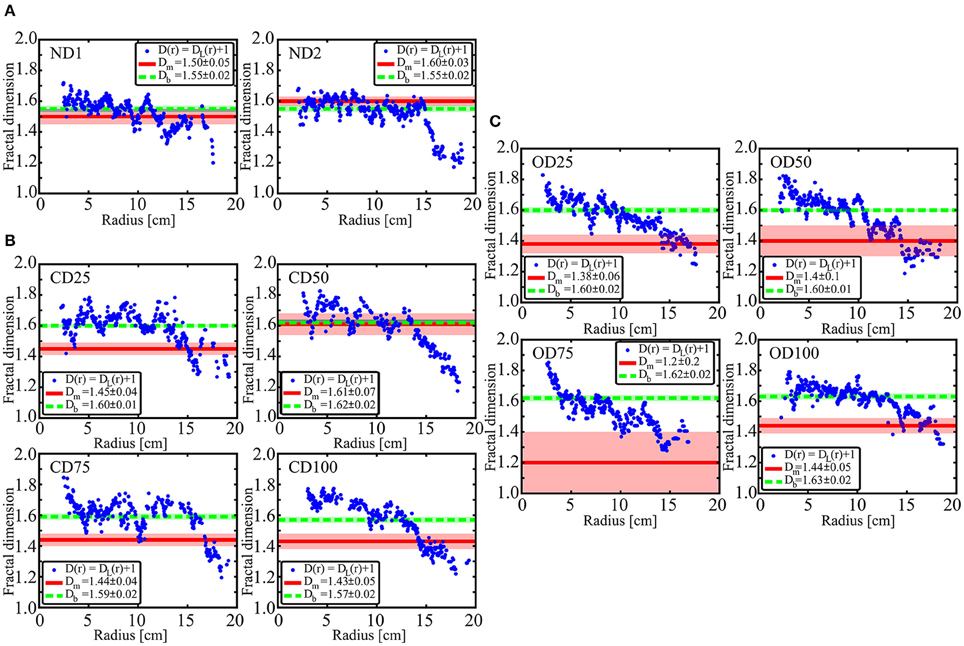
Figure 7. The blue dots represent local fractal dimensions plotted as (DL + 1) as function of radius for the non-deformable breakthrough patterns (A), confined deformable breakthrough patterns (B), and open deformable breakthrough patterns (C). The estimated mass dimensions Dm are indicated as solid red lines with uncertainties shown as light red bands, and the box dimensions Db are indicated as dotted green lines with uncertainties shown as light green bands. Overlaps of the Dm and Db uncertainties are colored gray. The injection pressure in both ND experiments is 25 hPa, while the number in the experiment names for the CD and OD experiments gives the injection pressure in hPa.
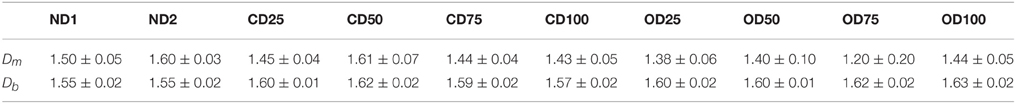
Table 2. The fractal mass dimensions Dm and box dimensions Db for the breakthrough patterns.
Having used Equation (8), the local dimensions are plotted as DL(r) + 1, and the mass dimensions Dm and box dimensions Db are indicated as lines with uncertainties. The uncertainty intervals for the fractal dimensions are determined as the difference between the steepest and least steep slope that can be fit within a 95% confidence interval around the best fits in the log-log plots. In Figure 7A, we see that the ND1 and ND2 mass dimensions are virtually equal to their corresponding box dimensions since they have overlapping uncertainty intervals. The mass and box dimensions also correspond well with the local fractal dimensions according to Mandelbrot's rule of thumb, since DL(r) + 1 fluctuates around the corresponding Dm and Db values. A sharp decrease in local dimensions is seen close to the rim, and is due to finite size effects of the clusters. In Figure 7B we see the fractal dimensions found for the CD patterns. Except for the CD50 pattern where the mass dimension is equal to the box dimension within the uncertainties, the mass dimensions are significantly lower than the obtained box dimensions. The box dimensions correspond better to the local dimensions than the mass dimensions do. As for the ND patterns the CD25 and CD50 local dimensions fluctuate around the box dimension values, before the outer finite size effects make the local dimensions decrease. For the higher injection pressures, CD75 and CD100, we see an inner region with higher local dimensions, before the local dimensions approach values fluctuating around the corresponding box dimensions, and finally decrease due to the finite size effects. The obtained dimensions for the OD breakthrough patterns are plotted in Figure 7C. All of the patterns show a decreasing trend in local dimensions for increasing radius. The mass dimensions are significantly lower than the obtained box dimensions, and the box dimensions seem to best correspond to the local dimensions for intermediate radii. Inner regions show higher local dimensions, with DL(r) + 1 starting on 1.8–1.9, indicating emptier inner structures.
Figure 8A shows examples of mass-radius relations at several snapshots of growing clusters in each boundary condition. For the boundary conditions probed, the mass-radius relations are seen to grow toward a limiting curve over time. The flat regions seen at larger radii are outside the current pattern, and they give the total mass at that time. We check whether the mass dependence on time and radius can be collapsed onto a master curve according to a Family-Vicsek relationship [51]. Indeed, such a relationship is common in many growth phenomena, as e.g., in rough interface evolution during two-phase flow in Hele-Shaw cells [52], interface depinning models [53], fracture front growth [54] and thermal roughening of dipolar chains [55, 56]. Figure 8B shows Family-Vicsek scaling of the same mass-radius relations as in Figure 8A, and show how they scale over time. We have assumed that the total mass N and longest finger r of a pattern scales with time as
where Nb, rb, and tb are breakthrough values of mass, radius and time, respectively. It is a reasonable assumption once the fingering instability is established, i.e., after the patterns had grown to a mass of around 10% of Nb. The plots are shown in Figure A3 in the Supplementary Material. Since, in addition, the mass-radius relation is assumed to follow Equation (6), the scaled mass-radius relation should be on the form
where Dm is the mass dimension of the pattern. We find the scaling exponent α from the slope of the log-log plot of (N(t)/Nb) as function of (t/tb), and the scaling exponent β from the slope of the log-log plot of (r(t)/rb) as function of (t/tb), following Equation (11). The estimated values for α and β are presented in Table 3, and the corresponding plots are shown in Figure A3 in the Supplementary Material.
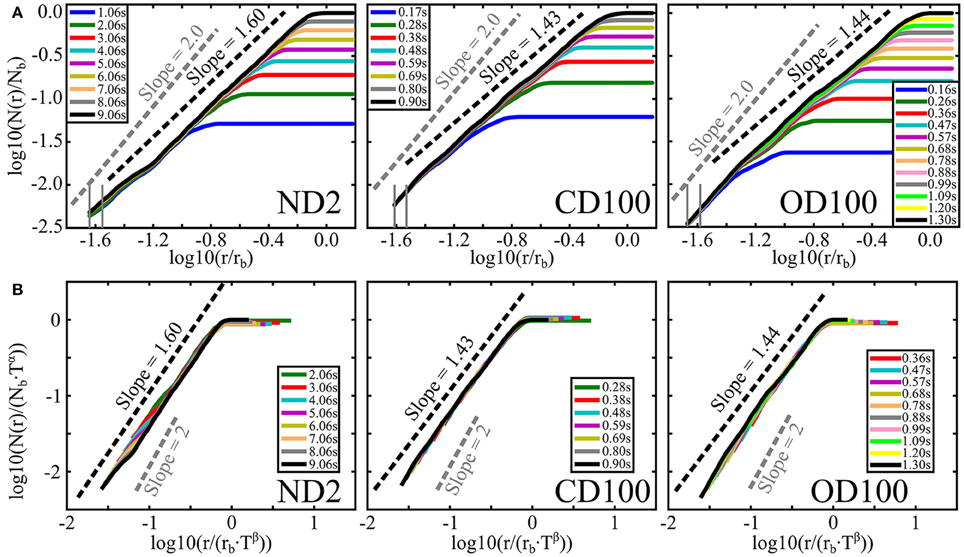
Figure 8. (A) Examples of mass-radius relations at several snapshots for a non-deformable experiment at 25 hPa (left), a confined deformable experiment at 100 hPa (middle), and an open deformable experiment at 100 hPa (right). At the start of the curves, the leftmost gray vertical lines mark the lower radius cutoff, which is just outside the injection region, and the gray vertical lines to the right mark a distance of 1 mm outside the lower cutoff. The black dotted lines show the estimated mass dimensions for the breakthrough patterns. The gray dotted lines has slopes of 2 to indicate the space filling dimension of an emptied bubble. (B) Family-Vicsek scaling of the same mass-radius relations as above, except for the smallest clusters with a total mass < 10% of the breakthrough mass. On the axes, T = (t/tb) is the ratio of time over breakthrough time, r is radius, rb is breakthrough radius, N(r) is mass within radius r, Nb is total mass at breakthrough, and α and β are scaling exponents. Here, for ND2: α = 1.45 and β = 0.80, for CD100: α = 1.58 and β = 1.02, and for OD100: α = 1.73 and β = 1.10.
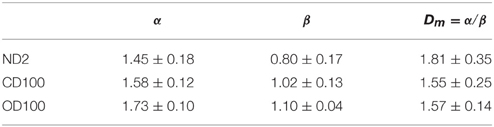
Table 3. The scaling exponents α and β found for the experiments ND2, CD100, and OD100.
For the ND boundary condition we see that the scaled curves collapse fairly well on top of each other, except for an inner part which has a slightly lower mass-radius slope. The slopes are however limited to the estimated mass dimension. For both the deformable boundary conditions we see that the scaled curves collapse well on top of each other and along the estimated mass dimensions. Although, there are inner parts with slopes close to 2 falling down from the collapsed curves. This effect is most obvious in the OD plots.
Deformations
Deformation of the porous media is illustrated in Figure 9 for selected snapshots of the confined and OD experiments with an injection pressure of 100 hPa. The radial displacements and volumetric strains are shown at an early stage, around mid-experiment, at a later stage and at breakthrough. Radial displacement of beads in the CD boundary condition, seen in Figure 9A, are directed outwards from the injection center. In the initial stage, the displacements do not reach all the way to the rim of the cell, but over time the displaced area grows toward a final size and magnitude, which goes toward zero near the rim. The corresponding volumetric strains are shown in Figure 9B, and show that the porous medium is increasingly compacted with time outside the invasion cluster. Finger opening, i.e., parts of the air cluster empty of beads, is observed in regions where the volumetric strain exceeds 0.05. Thus, there is a crossover from finger opening to pore invasion in the latter half of the experiment. Radial displacements at different snapshots for the OD100 experiment are shown in Figure 9C. We see a similar behavior as in the CD case initially, where the inner beads are displaced radially outwards from the injection center while the outer beads are not yet displaced. With time, the radial displacements increase in magnitude outside the growing cluster and eventually reach out to the rim where beads leave the cell. The corresponding volumetric strains for the OD snapshots are shown in Figure 9D. Initially, there is compaction outside the growing air cluster, and with time there is increasing decompaction of the outer portion of the medium. Again, finger opening is observed in regions with volumetric strain above 0.05 and we see that it goes on until breakthrough in this experiment.
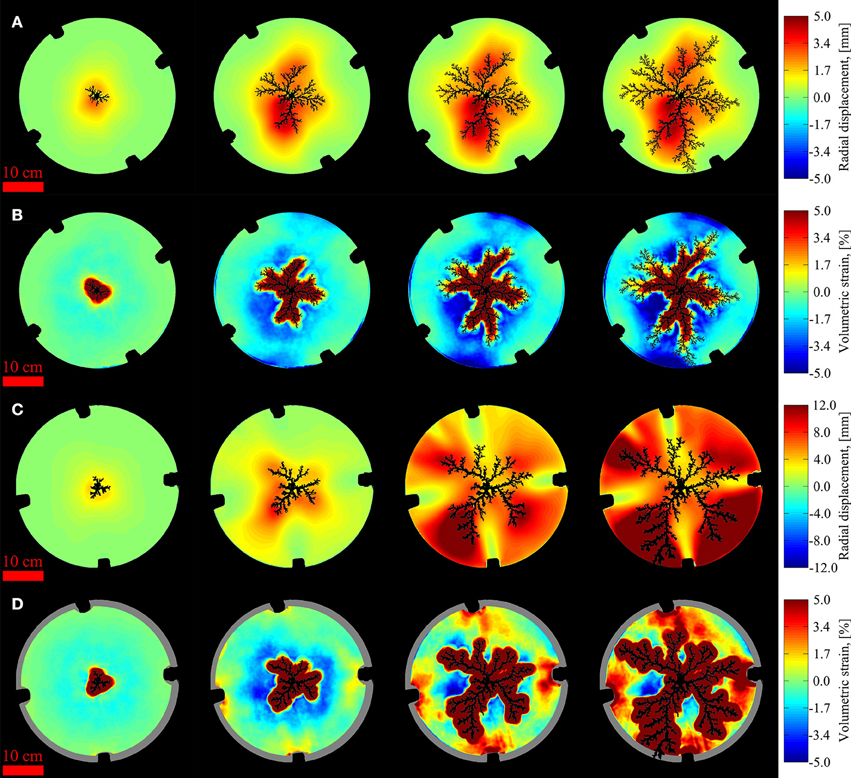
Figure 9. Visualization of accumulated deformation at different snapshots during experiments: Radial displacements (A) and volumetric strains (B) in the confined deformable experiment with 100 hPa injection pressure. The radial displacements (C) and volumetric strains (D) are for the open deformable experiment with 100 hPa injection pressure. Time is increasing from left to right, where the snapshots in (A,B) are taken at 176, 488, 696, and 904 ms (i.e., 20, 54, 77, and 100% of the breakthrough time). The snapshots in (C,D) are taken at 232, 544, 960, and 1272 ms (i.e., 18, 43, 75, and 100% of the breakthrough time). For the radial displacements (A,C), red color means that displacements are directed outwards and blue means inwards. For the volumetric strains (B,D), red color means decompaction and blue means compaction. The air clusters and areas outside of the cell are shown in black, and the black bumps at the cell rim are due to the clamps. The gray areas in (D) indicate omitted data where boundary effects of beads leaving the cell influence the strain calculations.
The tangential displacements were found to look similar for both boundary conditions, and is illustrated for a 40 ms interval in Figure 10. The displacements are directed away from the sides of the fingers, and are higher in magnitude for larger fingers. Outside the air cluster, where radial displacement dominates, tangential displacement magnitudes are small.
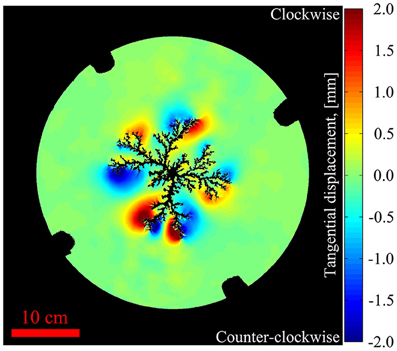
Figure 10. Example of tangential displacement behavior taken from the interval of 448–488 ms (50–54% of breakthrough time) for the confined deformable experiment with 100 hPa injection pressure. Blue color means counter-clockwise displacements and red means clockwise displacements. The air cluster and area outside of the cell are shown in black, and the black bumps at the cell rim are due to the clamps.
Discussion
When we examine the flow patterns in Figure 3, we find that they have both common features across boundary conditions and typical characteristics depending on the boundary conditions. In common, they all have the dendritic branching structure that spreads out from the center, similar to DLA [18], where longer fingers grow on expense of less advanced fingers. This behavior is expected for viscous fingering in a porous medium since the invasion flow follows Darcy's law (3), with the pressure distribution given by the Laplace equation outside the air cluster (of constant pressure) such that the pressure gradient is screened inside the longest fingers [19]. We do observe in Figures 6, 8 that spatial properties of the structures grow toward limiting curves over time, and in Figure 7 that the local fractal dimensions show a sudden decrease at the outermost radii, i.e., the active growth zone. This confirms that growth dynamics of the patterns follow a behavior where an outer active growth zone surrounds an internally developed and frozen pattern, as described in similar linear systems [3, 4]. The fundamental similarity in the growth dynamics of the structures is reflected by their similar global appearance across boundary conditions. This is also indicated by the fractal box dimensions, which are all observed in the range from 1.55 to 1.63, consistent with earlier observed values of e.g., 1.53 [4] and 1.62 [19] for viscous fingers in ND porous media. The breakthrough times, shown in Figure 5, are generally observed to decrease with increased deformability and injection pressure, while the growth rates generally seem to have a linear trend with some fluctuations.
Typically, as seen in Figures 3A, 6A, invasion patterns in the ND system has long thin fingers with approximately the same finger thickness at all radii. In the deformable systems, typical invasion patterns have initially an air bubble emptied of grains, as observed in Johnsen et al. [21]. The empty bubble seems larger for higher injection pressure and deformability, but in all cases it branches rather quickly into few and thick fingers. In the CD system (Figures 3B, 6B) the few thick fingers cross over to increasingly numerous and thinner fingers with radius, while in the OD system (Figures 3C, 6C), typical invasion patterns goes from the few thick fingers into more numerous and thinner fingers before crossing back to few and thick fingers close to the rim. The key difference between the deformable systems is visualized in Figures 9B,D. The porous medium in the CD system is increasingly compacted as the cluster grows, while the porous medium in the OD system is centrally compacted and then decompacted near the rim as the cluster grows. Inside the longest finger radius, displacements are observed to be directed out from the side of fingertips as in Figure 10, while outside the invasion cluster, radial displacements dominate.
The radial displacements outside the invasion cluster are driven by a viscous pressure gradient, as in the experiments by MacMinn et al. [30] where a saturated granular material is injected with the same fluid. We assume that radial displacement occurs outside the invasion cluster when
where Δp is the viscous pressure drop across a bead and σg is the granular stress opposing bead displacement. In the OD boundary condition, decompaction at the rim is believed to initiate when the pressure drop across the outer layer of beads overcome the pressure necessary to move one bead out of the cell, Δp > σb.
The displacements away from fingertips correspond to opening of fractures by capillary forces, as e.g., discussed in Holtzman et al. [29]. A typical capillary threshold in our deformable systems is found from Equation (2) as
where a is the typical bead size and b is the plate separation, giving pcap = 225.26 Pa. Since the lowest injection pressure in our experiments is 2500 Pa, we can always expect pore invasions if fracturing does not occur. However, if
where Δp⊥ is the pressure drop perpendicular to fingers across beads, fracturing is assumed to occur. Limiting mechanisms for fracturing can then be an increase in σg due to compaction and accumulated friction, or a decrease in Δp⊥ due to pressure screening from the longest fingers.
In the CD system fracturing occurs initially, but since the granular stress increase as the medium compacts over time, we observe a crossover from fracturing to pore invasions. In the OD system, fracturing occurs initially and may cross over to pore invasions in the intermediate compacted region due to compaction and accumulated friction. Later on, when the fingers approach the open rim, the medium decompacts and friction is relaxed such that fracturing re-initiates. This results in a new instability as fingers are sensitive to the proximity of the open rim, and we observe 1–2 fingers grow to breakthrough on expense of the others. The outer fingers appear similar to fractures in a paste [57]. During the outer fracturing instability for the higher injection pressures, we also see an increased number of branches on the longest fingers. This could be a consequence of outer decompaction of the media, in the sense that the pore sizes increase along the fingers and become more easily invaded.
The local fractal dimensions in Figure 7A are more or less constant inside the frozen region, and correspond well to the global mass- and box dimensions by Mandelbrot's rule of thumb (8). Thus, the ND patterns have fairly well defined fractal dimensions on a global scale, between 1.5 and 1.6, consistent with earlier observed values. The local fractal dimensions in Figure 7B, for the CD experiments, are observed to be approximately constant in the frozen part of the patterns, similar to the ND case for the lower injection pressures (CD25, CD50). However, for higher injection pressures we see slightly higher local dimensions initially, influenced by the central emptied structures and thick fingers. The local dimensions for the structures in the OD system, Figure 7C, are more or less decreasing with radius. In addition, mass dimensions for the deformable patterns generally do not correspond well with the local dimensions due to finite size effects. In other words, the less developed outer parts contribute to a decrease in the mass-radius slope. For the CD100 and OD experiments the box dimension only corresponds with a part of the local dimensions. This indicates that the patterns in the most deformable systems does not have a well-defined global fractal dimension, but have locally defined fractal dimensions and transitions of universality class with radius. The initial emptied and thick finger regions seem to have local dimensions corresponding to around 1.7 which is the measured fractal dimension for invasion patterns in empty cells and DLA [58, 59]. In an intermediate region, the local dimensions correspond well to the measured box dimensions around 1.6, indicating viscous fingering. For the outer parts in the OD system, the local dimensions decrease toward 1.4, which is similar to the measured box dimension of 1.43 for fractures in a paste [57].
After pattern growth develops into viscous fingering, the mass-radius relations as function of time are found to scale according to a Family-Vicsek scaling relation, where and . The dynamic scaling exponents α for the invaded area over time N(t) ~ tα are observed to increase with the deformability of the porous media. When considering that
we see that higher values of α imply that the invaded area changes at a faster rate. To the knowledge of the authors, a dynamic scaling exponent for invasion area over time for two-phase flow in deformable porous media is not discussed in earlier papers. Thus, we present a new measured exponent which calls for theoretical evaluation and comparison with theoretical models. When mass dimensions of the patterns in the deformable systems are estimated from the scaling law, Dm = α/β, we get the values 1.55 ± 0.25 for CD100 and 1.57 ± 0.14 for OD100, which is similar to the respective box dimensions as well as observed fractal dimensions of patterns in ND systems.
Conflict of Interest Statement
The authors declare that the research was conducted in the absence of any commercial or financial relationships that could be construed as a potential conflict of interest.
Acknowledgments
This project has received funding from the European Union's Seventh Framework Programme for research, technological development and demonstration under grant agreement no. 316889, ITN FlowTrans. We acknowledge the support of the University of Strasbourg and the IDEX program through the award “Hope of the University of Strasbourg,” and the University of Oslo. We thank Mihailo Jankov for technical support.
Supplementary Material
The Supplementary Material for this article can be found online at: https://www.frontiersin.org/article/10.3389/fphy.2015.00081
References
1. Saffman, PG, and Taylor, G. The penetration of a fluid into a porous medium or Hele-Shaw cell containing a more viscous liquid. Proc R Soc Lond A Math Phys Sci. (1958) 245:312–29. doi: 10.1098/rspa.1958.0085
2. Lenormand, R. Pattern growth and fluid displacements through porous media. Physica A. (1986) 140:114–23.
3. Løvoll, G, Méheust, Y, Toussaint, R, Schmittbuhl, J, and Måløy, KJ. Growth activity during fingering in a porous Hele-Shaw cell. Phys Rev E. (2004) 70:026301. doi: 10.1103/PhysRevE.70.026301
4. Toussaint, R, Løvoll, G, Méheust, Y, Måløy, KJ, and Schmittbuhl, J. Influence of pore-scale disorder on viscous fingering during drainage. Europhys Lett. (2005) 71:583. doi: 10.1209/epl/i2005-10136-9
5. Toussaint, R, Måløy, KJ, Méheust, Y, Løvoll, G, Jankov, M, Schäfer, G, et, al. Two-phase flow: structure, upscaling, and consequences for macrosopic transport properties. Vadoze Zone J. (2012) 11:3. doi: 10.2136/vzj2011.0123
6. Huang, H, Zhang, F, Callahan, P, and Ayoub, J. Granular fingering in fluid injection into dense granular media in a Hele-Shaw cell. Phys Rev Lett. (2012) 108:258001. doi: 10.1103/PhysRevLett.108.258001
7. Kong, XZ, Kinzelbach, W, and Stauffer, F. Morphodynamics during air injection into water-saturated movable spherical granulates. Chem Eng Sci. (2010) 65:4652–60. doi: 10.1016/j.ces.2010.05.007
8. Varas, G, Vidal, V, and Géminard, JC. Morphology of air invasion in an immersed granular layer. Phys Rev E. (2011) 83:061302. doi: 10.1103/PhysRevE.83.061302
9. Vinningland, JL, Johnsen, Ø, Flekkøy, EG, Toussaint, R, and Måløy, KJ. Granular Rayleigh-Taylor instability: experiments and simulations. Phys Rev Lett. (2007) 99:048001. doi: 10.1103/PhysRevLett.99.048001
10. Frette, V, Feder, J, Jøssang, T, and Meakin, P. Buoyancy-driven fluid migration in porous media. Phys Rev Lett. (1992) 68:3164. doi: 10.1103/PhysRevLett.68.3164
11. Völtz, C, Pesch, W, and Rehberg, I. Rayleigh-Taylor instability in a sedimenting suspension. Phys Rev E. (2001) 65:011404. doi: 10.1103/PhysRevE.65.011404
12. Niebling, MJ, Flekkøy, EG, Måløy, KJ, and Toussaint, R. Mixing of a granular layer falling through a fluid. Phys Rev E. (2010) 82:011301. doi: 10.1103/PhysRevE.82.011301
13. Birovljev, A, Furuberg, L, Feder, J, Jøssang, T, Måløy, KJ, and Aharony, A. Gravity invasion percolation in two dimensions: experiment and simulation. Phys Rev Lett. (1991) 67:584. doi: 10.1103/PhysRevLett.67.584
14. Méheust, Y, Løvoll, G, Måløy, KJ, and Schmittbuhl, J. Interface scaling in a two-dimensional porous medium under combined viscous, gravity, and capillary effects. Phys Rev E. (2002) 66:051603. doi: 10.1103/PhysRevE.66.051603
15. Wilkinson, D, and Willemsen, JF. Invasion percolation: a new form of percolation theory. J Phys A Math Gen. (1983) 16:3365–76.
16. Chandler, R, Koplik, J, Lerman, K, and Willemsen, JF. Capillary displacement and percolation in porous media. J Fluid Mech. (1982) 119:249–67.
17. Lenormand, R, and Zarcone, C. Capillary fingering: percolation and fractal dimension. Transp Porous Media. (1989) 4:599–612.
18. Paterson, L. Diffusion-Limited Aggregation and two-fluid displacements in porous media. Phys Rev Lett. (1984) 52:1621–4. doi: 10.1103/PhysRevLett.52.1621
19. Måløy, KJ, Feder, J, and Jøssang, T. Viscous fingering fractals in porous media. Phys Rev L. (1985) 55:2688.
20. Lemaire, E, Abdelhaye, YOM, Larue, J, Benoit, R, Levitz, P, and van, Damme H. Pattern formation in noncohesive and cohesive granular media. Fractals (1993) 1:968–76. doi: 10.1142/S0218348X93001040
21. Johnsen, Ø, Toussaint, R, Måløy, KJ, and Flekkøy, EG. Pattern formation due to air injection into granular materials confined in a circular Hele-Shaw cell. Phys Rev E. (2006) 74:001301. doi: 10.1103/PhysRevE.74.011301
22. Cheng, X, Xu, L, Patterson, A, Jaeger, HM, and Nagel, SR. Towards the zero-surface-tension limit in granular fingering instability. Nat Phys. (2008) 4:234–7. doi: 10.1038/nphys834
23. Johnsen, Ø, Toussaint, R, Måløy, KJ, Flekkøy, EG, and Schmittbuhl, J. Coupled air/granular flow in a linear Hele-Shaw cell. Phys Rev E. (2008) 77:011301. doi: 10.1103/PhysRevE.77.011301
24. Niebling, MJ, Toussaint, R, Flekkøy, EG, and Måløy, KJ. Dynamic aerofracture of dense granular packings. Phys Rev E. (2012) 86:061315. doi: 10.1103/PhysRevE.86.061315
25. Johnsen, Ø, Chevalier, C, Lindner, A, Toussaint, R, Clément, E, Måløy, KJ, et, al. Decompaction and fluidization of a saturated and confined granular medium by injection of a viscous liquid or gas. Phys Rev E. (2008) 78:051302. doi: 10.1103/PhysRevE.78.051302
26. Chevalier, C, Lindner, A, Leroux, M, and Clément, E. Morphodynamics during air injection into a confined granular suspension. J NonNewton Fluid Mech. (2009) 158:63–72. doi: 10.1016/j.jnnfm.2008.07.007
27. Sandnes, B, Flekkøy, EG, Knudsen, HA, Måløy, KJ, and See, H. Patterns and flow in frictional fluid dynamics. Nat Commun. (2011) 2:288. doi: 10.1038/ncomms1289
28. Eriksen, JA, Marks, B, Sandnes, B, and Toussaint, R. Bubbles breaking the wall: two-dimensional stress and stability analysis. Phys Rev E. (2015) 91:052204. doi: 10.1103/PhysRevE.91.052204
29. Holtzman, R, Szulczewski, ML, and Huanes, R. Capillary fracturing in granular media. Phys Rev Lett. (2012) 108:264504. doi: 10.1103/PhysRevLett.108.264504
30. MacMinn, CW, Dufresne, ER, and Wettlaufer, JS. Fluid-driven deformation of a soft granular material. Phys Rev X. (2015) 5:011020. doi: 10.1103/PhysRevX.5.011020
31. Montgomery, CT, and Smith, MB. Hydraulic fracturing: history of an enduring technology. J Pet Technol. (2010) 62:26–32. doi: 10.2118/1210-0026-jpt
33. Naik, GC. Tight Gas reservoirs - An Unconventional Natural Energy Source for the Future (2003). Available online at: http://www.pinedaleonline.com/socioeconomic/pdfs/tight_gas.pdf (Accessed 11, 2014).
34. Johnson, SM, and Morris, JP. Hydraulic fracturing mechanisms in carbon sequestration applications. In: 43rd U.S. Rock Mechanics Symposium and 4th U.S. - Canada Rock Mechanics Symposium. Asheville, NC: American Rock Mechanics Association (2009).
35. Williamson, WH, and Wooley, DR. Hydraulic Fracturing to Improve the Yield of Bores in Fractured Rock. Canberra, ACT: Australian Government Publishing Service (1980).
36. Rummel, F, and Kappelmayer, O. The Falkenberg geothermal frac-project: concepts and experimental results. Hydraul Fract Geotherm Energy. (1983) 5:59–74. doi: 10.1007/978-94-009-6884-4_4
37. Clark, L. Energy company plans to frack volcano. In: Wired Science (2012). Available online at: http://www.wired.com/wiredscience/2012/10/newberry-volcano-fracking (Accessed 11, 2014).
38. Hurst, A, Cartwright, J, and Duranti, D. Fluidization structures produced by upward injection of sand through a sealing lithology. In: Van Rensbergen P, Hillis RR, Maltman AJ, Morley CK, editors. Subsurface Sediment Mobilization. London: Geological Society (2003), Special Publications 216. pp. 123–38.
39. Løseth, H, Wensaas, L, Arntsen, B, and Hovland, M. Gas and fluid injection triggering shallow mud mobilization in the Hordaland Group, North Sea. In: Van Rensbergen P, Hillis RR, Maltman AJ, Morley CK, editors. Subsurface Sediment Mobilization. London: Geological Society (2003), Special Publications 216. pp. 139–57.
40. Van, Rensbergen P, Poort, J, Kipfer, R, De, Batist M, Vanneste, M, Klerkx, J, et, al. Near-surface sediment mobilization and methane venting in relation to hydrate destabilization in southern Lake Baikal, Siberia. In: Van Rensbergen P, Hillis RR, Maltman AJ, Morley CK, editors. Subsurface Sediment Mobilization. London: Geological Society (2003), Special Publications 216. pp. 207–21.
41. Talukder, AR, Comas, MC, and Soto, JI. Pliocene to recent mud diapirism and related mud volcanoes in the Alboran Sea (Western Mediterrenean). In: Van Rensbergen P, Hillis RR, Maltman AJ, Morley CK, editors. Subsurface Sediment Mobilization. London: Geological Society (2003), Special Publications 216. pp. 443–59.
42. Pralle, N, Külzer, M, and Gudehus, G. Experimental evidence on the role of gas in sediment liquefaction and mud volcanism. In: Van Rensbergen P, Hillis RR, Maltman AJ, Morley CK, editors. Subsurface Sediment Mobilization. London: Geological Society (2003), Special Publications 216. pp. 159–71.
43. Deville, E, Battani, A, Griboulard, R, Guerlais, S, Herbin, JP, Houzay, JP, et, al. The origin and processes of mud volcanism: new insights from Trinidad. In: Van Rensbergen P, Hillis RR, Maltman AJ, Morley CK, editors. Subsurface Sediment Mobilization. London: Geological Society (2003), Special Publications 216. pp. 475–90.
45. Barabási, AL, and Stanley, HE. Fractal Concepts in Surface Growth. Cambridge: Cambridge University Press (1995).
48. Blaber, J, Adair, B, and Antoniou, A. Ncorr: open-source 2D digital image correlation matlab software. Exp Mech. (2015) 55:1105–22. doi: 10.1007/s11340-015-0009-1
49. Hariral, R, and Ramji, M. Adaption of open source 2D DIC Software Ncorr for solid mechanics applications. In: 9th International Symposium on Advanced Science and Technology in Experimental Mechanics, New Delhi (2014).
50. Vable, M. Mechanics of Materials, 2nd Edn. Michigan Technological University (2014). Available online at: http://www.me.mtu.edu/~mavable/MoM2nd.htm
51. Family, F, and Vicsek, T. Scaling of the active zone in the Eden process on percolation networks and the ballistic deposition model. J Phys A Math Gen. (1985) 18:L75–81. doi: 10.1088/0305-4470/18/2/005
52. Horváth, VK, Family, F, and Vicsek, T. Dynamic scaling of the interface in two-phase viscous flows in porous media. J Phys A Math Gen. (1991) 24:L25–9. doi: 10.1088/0305-4470/24/1/006
53. Makse, HA, and Nunes, Amaral LA. Scaling behavior of driven interfaces above the depinning transition. Europhys Lett. (1995) 31:379–84. doi: 10.1209/0295-5075/31/7/007
54. Tallakstad, KT, Toussaint, R, Santucci, S, Schmittbuhl, J, and Måløy, KJ. Local dynamics of a randomly pinned crack front during creep and forced propagation: an experimental study. Phys Rev E. (2011) 83:046108. doi: 10.1103/PhysRevE.83.046108
55. Toussaint, R, Helgesen, G, and Flekkøy, EG. Dynamic roughening and fluctuations of dipolar chains. Phys Rev Lett. (2004) 93:108304. doi: 10.1103/PhysRevLett.93.108304
56. Toussaint, R, Flekkøy, EG, and Helgesen, G. Memory of fluctuating Brownian dipolar chains. Phys Rev E. (2006) 74:051405. doi: 10.1103/PhysRevE.74.051405
57. Lemaire, E, Levitz, P, Daccord, G, and Van, Damme H. From viscous fingering to viscoelastic fracturing in colloidal fluids. Phys Rev Lett. (1991) 67:2009. doi: 10.1103/PhysRevLett.67.2009
58. Sharon, E, Moore, MG, McCormick, WD, and Swinney, HL. Coarsening of viscous fingering patterns. Phys Rev Lett. (2003) 91:205504. doi: 10.1103/PhysRevLett.91.205504
Keywords: two-phase flow, drainage, deforming porous media, viscous fingering, fracturing
Citation: Eriksen FK, Toussaint R, Måløy KJ and Flekkøy EG (2015) Invasion patterns during two-phase flow in deformable porous media. Front. Phys. 3:81. doi: 10.3389/fphy.2015.00081
Received: 03 June 2015; Accepted: 18 September 2015;
Published: 02 October 2015.
Edited by:
Antonio F. Miguel, University of Evora, PortugalReviewed by:
Sujata Tarafdar, Jadavpur University, IndiaChristopher William MacMinn, University of Oxford, UK
Copyright © 2015 Eriksen, Toussaint, Måløy and Flekkøy. This is an open-access article distributed under the terms of the Creative Commons Attribution License (CC BY). The use, distribution or reproduction in other forums is permitted, provided the original author(s) or licensor are credited and that the original publication in this journal is cited, in accordance with accepted academic practice. No use, distribution or reproduction is permitted which does not comply with these terms.
*Correspondence: Fredrik K. Eriksen, Institut de Physique du Globe de Strasbourg, 5 Rue René Descartes, 67084 Strasbourg Cedex, France, eriksen@unistra.fr