Dynamic Wettability Alteration in Immiscible Two-phase Flow in Porous Media: Effect on Transport Properties and Critical Slowing Down
 Vegard Flovik
 Santanu Sinha
 Alex Hansen
- 1Department of Physics, Norwegian University of Science and Technology, Trondheim, Norway
- 2Department of Physics, University of Oslo, Oslo, Norway
The change in contact angles due to the injection of low salinity water or any other wettability altering agent in an oil-rich porous medium is modeled by a network of disordered pores transporting two immiscible fluids. We introduce a dynamic wettability altering mechanism, where the time dependent wetting property of each pore is determined by the cumulative flow of water through it. Simulations are performed to reach steady-state for different possible alterations in the wetting angle (θ). We find that deviation from oil-wet conditions re-mobilizes the stuck clusters and increases the oil fractional flow. However, the rate of increase in the fractional flow depends strongly on θ and as θ → 90°, a critical angle, the system shows critical slowing down which is characterized by two dynamic critical exponents.
1. Introduction
The world's primary energy demand is predicted to increase by one-third between 2011 and 2035, where 82% of it comes from fossil fuels [1]. In this scenario, the fact that some 20–60% of the oil remains unrecovered in a reservoir after the production is declared unprofitable, is a challenge of increasing importance [2]. The main reason for this loss is the formation of oil clusters trapped in water and held in place by capillary forces, which in turn are controlled by the wetting properties of the reservoir fluids with respect to the matrix rock. The production from complex oil reserves that today are considered immobile or too slow compared to the cost is therefore an important area of research. In this context, the role of formation wettability is a focus area within the field of Enhanced Oil Recovery (EOR) [3].
Different reservoir rocks have widely different wetting characteristics [4]. Wettability may vary at the pore level from strongly oil wet through intermediate wetting to strongly water wet. Carbonate reservoirs contain more than half of the world's conventional oil reserves, but the oil recovery factor (a number between zero and unity representing the fraction of recoverable oil [5]) is very low compared to sandstone reservoirs [6]. This is due to the complex structure, formation heterogeneity and more chemically active wettability characteristics of the carbonate reservoirs, which leads to uncertainty in the fluid flow and oil recovery [7]. Sandstone is strongly water wet before oil migrates from a source rock into the reservoir. When oil enters a pore, it displaces the water which leaves behind a water film sandwiched between the oil and rock surface. This happens as a result of balancing van der Waals and electric double layer forces, capillary pressure and grain curvature [8]. A permanent wettability alteration is then believed to take place by adsorption of asphaltenes from the crude oil to the rock, and leads to high but slow recovery through continuous oil films [9, 10]. As the oil saturation drops, these films can become discontinuous, leaving immobile oil clusters held in place by capillary forces.
After drilling a well into a reservoir, the natural pressure inside can force only around 10% of the total available volume of oil to reach the surface, which is called the primary recovery stage [5]. To maintain the pressure for further recovery, water or gas is injected by another injection well which is known as secondary recovery. This allows around 30% further production of oil depending on fluid properties and reservoir parameters. To recover the huge amount of oil left inside the reservoir after the secondary recovery, different techniques beyond the simple secondary injection are implemented, which constitutes the tertiary or EOR stage. In this stage wettability is the most important petrophysical property which plays a key role in the fluid transport properties of both conventional (permeabilities in milli-Darcy to Darcy range) and unconventional (low porosity and low permeability in nano to milli-Darcy range, e.g., shale) reservoirs [11] and there is great potential to improve the oil recovery efficiency by altering the wetting properties [12]. Main factors which can alter the pore wettability are: lowering the salinity [13, 14], adding water-soluble surfactants [15, 16] or adding oil-soluble organic acids or bases [17]. Increasing the reservoir temperature also increases water-wetness [4, 18]. There are some correlations with the wetting behavior to the electrostatic forces between the rock and oil surfaces [19], but there is no consensus on the dominating microscopic mechanism behind the wettability alteration. It is known from laboratory experiments and field tests that a drift from strongly oil-wet to water-wet or intermediate-wet conditions can significantly improve the oil recovery efficiency [17]. The amount of change in the wetting angle is a key factor here [20, 21] which not only decides the increase in oil flow but also the speed of the process. An improper change in the wetting angle can also make the recovery very slow and not profitable.
Given there is a certain change in the wetting angle due to a brine, the next important factor is the flow pathways in the matrix rock which transports the oil and brine. One cannot expect any change in the wetting angle of a pore if there is no flow of the brine through it. The flow pathways depend on several different factors: the porous network itself, oil saturation, capillary number and also on the present wettability conditions. A change in the wettability will cause a perturbation in the flow distribution of the system. This will in turn again affect the wettability change through the altered flow pathways, causing further changes in the flow distribution. The dynamics of wettability alterations is therefore controlled by a strongly correlated process.
There are some studies of wettability alterations in two-phase flow by equilibrium-based network models [22] for capillary dominated regimes where viscous forces are negligible. Wettability alterations by network models with film-flow has been studied [23] to find residual oil saturation as functions of contact angle. However, investigation of the time-scale of dynamics lacks attention in such models which is extremely important for practical reasons. In this article, we present a detailed study of wettability alterations in two-phase flow considering a network model of disordered pores transporting two immiscible fluids where a dynamic wettability alteration mechanism, correlated with the flow-pathways, is implemented. We will focus on the transport properties due to the change in the wettability as well as on the time scale of the dynamics.
We study in the following the effect of wettability changes on immiscible two-phase flow based on a network model [24–26]. In Section 2, we present the model and how we adapt it to incorporate the dynamic wettability changes. In Section 3, we present our results. Initially, we let the two phases settle into a steady state where the averages of the macroscopic flow parameters no longer evolve. At some point, we then introduce the wettability altering agent, so that it starts changing the wetting angle. The wetting angle alteration depends on the cumulative volume of the wettability altering fluid that has flowed past a given pore. This induces transient behavior in the macroscopic flow properties and we measure the time it takes to settle back into a new steady state. We find that there is a critical point at a wetting angle of 90° and we measure its dynamical critical exponents; the exponents are different whether one approaches the critical point from smaller or larger angles. In Section 4 we summarize and conclude.
2. Model
We model the porous medium by a network of tubes (or links) oriented at 45° relative to the overall flow direction. The links contain volumes contributed from both the pore and the throat, which then intersect at volume-less vertices (or nodes). Any disorder can be introduced in the model by a proper random number distribution for the radius r of each link, and we choose a uniform distribution in the range [0.1l, 0.4l] here, where l is the length of each tube. It is possible to consider any other distribution of pore sizes without any further change in the model. The network transports two immiscible fluids (we name them as oil and water), one of which is more wetting than the other with respect to the pore surface. The pores are assumed to be in between particles, and the pore shape is thus approximated to be hour-glass shaped, which introduces capillary effects in the system. The model is illustrated in Figure 1.
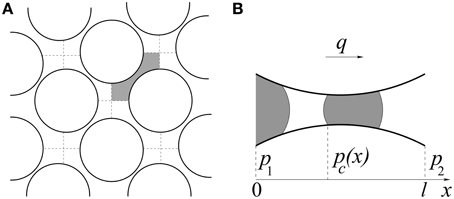
Figure 1. (A) Illustration of the pore network model, constructed by links (tubes) with random radii connected to each other via nodes at the intersection of the dashed lines. One single link in the network is highlighted by gray which is again shown in (B) filled with two fluids. The wetting and non-wetting fluids are colored by white and gray, respectively. p1 and p2 are the pressures at the two ends of the link and q is the local flow-rate. There are three menisci inside and capillary pressure difference at a menisci is indicated as pc(x).
Due to the hour glass shape of the pore, the capillary pressure at a menisci separating the two fluids is not constant, and depends on the position x of the menisci inside the pore. The capillary pressure pc(x) at position x inside the ith pore is then calculated from a modified form of the Young Laplace equation [24, 27],
where γ is the interfacial tension between the fluids and ϑi is the wetting angle for that pore. As an interface moves in time, pc(x) changes. The capillary pressure is zero at the two ends (x = 0 and l) and it is maximum at the narrowest part of the pore. It makes the model closer to the dynamics of drainage dominated flow, where the film flow can be neglected. When there are multiple menisci in a pore, the total capillary pressure inside the ith pore is obtained from the vector sum () over all the menisci in that pore. The flow is driven by maintaining a constant total flow rate Q throughout the network, which introduces a global pressure drop. The instantaneous local flow rate qi inside the ith link between two nodes with pressures p1 and p2 follows the Washburn equation of capillary flow [28],
where Δpi = p2 − p1. is the permeability of cylindrical tubes. Any other cross-sectional shape will only lead to an additional overall geometrical factor. , is the volume averaged viscosity of the two phases inside the link, which is a function of the oil saturation si in that link. Here μo and μw are the viscosities of oil and water, respectively.
The flow equations for the tube network are solved using a conjugate gradient method [29]. These are the Kirchhoff equations balancing the flow, where the net fluid flux through every node should be zero at each time step, combined with the constitutive equation relating flux and pressure drop across each tube. The system of equations is then integrated in time using an explicit Euler scheme with a discrete time step and all the menisci positions are changed accordingly. Inside the ith tube, all menisci move with a speed determined by qi. When any menisci reach at the end of a tube, new menisci are formed in the neighboring tubes. Consequently, wetting and non-wetting bubbles are snapped-off from the links having flow toward a node and enters in neighboring links having outward flow. Here, the total volume of the fluids entering to a node are distributed according to the flow rates of the neighboring tubes. Moreover, it is not allowed to increase the number of menisci inside any tube infinitely and therefore we implement coalescence process by merging two nearest menisci. In this article, we considered a maximum of four menisci inside one pore which can be tuned depending on the experimental observations. When this maximum number is exceeded, the two nearest menisci are merged keeping the volume of each fluid conserved. In this way bubble snap-off and coalescence are introduced in the model. The absolute details of these processes in the simulation can be found in Knudsen et al. [25]. We did not consider film-flow in the present study. This is because wettability alteration techniques are important for reservoirs with low oil-saturation and when oil-saturation drops, the continuous oil films [9, 10] in a oil-wet network are expected to become discontinuous leaving immobile oil clusters stuck due to capillary forces.
The simulations are started with an initial random distribution of two fluids in a pure oil-wet network. Bi-periodic boundary conditions are implemented in the system, which effectively makes flow on a torus surface. The flow can therefore go on for infinite time, keeping the saturation constant and the system eventually reaches to a steady state. In the steady state, both drainage and imbibition take place simultaneously and fluid clusters are created, merged and broken into small clusters. One can consider this as the secondary recovery stage. Once the system reaches the steady-state in a oil-wet network, the dynamic wettability alterations are implemented, which may be considered as the tertiary recovery stage or EOR. In the following we discuss this in detail.
2.1. Dynamic Wettability Alteration
We now introduce a dynamic wettability alteration mechanism to simulate any wetting angle change, decided by the oil-brine-rock combination and the distribution of the flow channels in the system. In a previous study [26], a simplified static wettability alteration mechanism was studied, where the alteration probability was considered equal for all pores without any correlation with the flow of brine inside a pore. However, for wettability alterations to occur, the wettability altering agent (e.g., low-salinity water or surfactant) needs to be in contact with the pore walls. Thus, the wettability alteration should follow the fluid flow pathways and any change in the wetting angle inside a pore should depend on the cumulative volumetric flow of brine through that pore. This claim is rather trivial, as one can not expect any wettability change in a pore if the altering agent is not present. This means that if a certain pore is flooded by large amounts of brine, the wetting angle should change more in that pore than the one which had very little water flooded through. This is implemented in the model by measuring the cumulative volumetric flux Vi(t) in each individual pore with time t,
where t0 is the time when the injection of low salinity water is initiated, is the time interval between two simulation steps and is the water saturation. Vi(t) is then used to change the wetting angle for each tube continuously, updated at every time step after t = t0. The wetting angle ϑi of the ith pore can change continuously from 180° to 0° as Vi(t) changes from 0 to ∞. Correspondingly, the cosϑi term in Equation (1) will change from −1 to 1 continuously. This continuous change of the wetting angle with the variation of Vi(t) is modeled by a function Gi(t) given by,
which replaces the cosϑi term in Equation (1). As, to our knowledge, there is no consensus in the literature about the exact functional dependence of the wetting angle on the volumetric flow of brine at the pore level, we have chosen a function which starts the wetting angles from oil-wet conditions () at Vi(t) = 0 and then asymptotically approaches to water-wet conditions () as Vi(t) → ∞. The pre-factor 2∕π is a normalization constant to set the range of the function. The parameter C can be tuned to adjust the slope during the transition from oil wet to water wet and can also change the initial wetting angle from 180°. As our model does not include film flow, the wetting angles are not likely to reach either 0 or 180° for circular cross-section of pores. We have chosen C = 20 for our simulations which sets the starting wetting angle when Vi(t) = 0. This leads to the change in the wetting angle as a function of Vi(t) as shown in Figure 2.
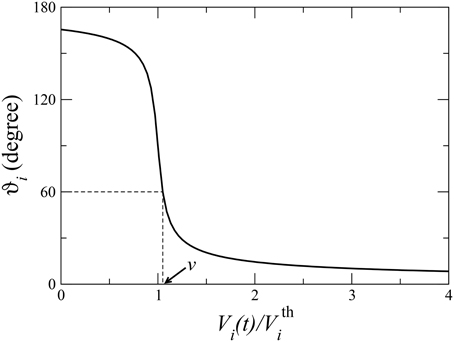
Figure 2. Variation of the wetting angle ϑi in the ith link given by Gi(t) (Equation 4) as a function of the cumulative volume of water Vi(t) (Equation 3) passed through that link. is the water volume needed to reach the wetting angle to 90° in that pore. When there is a cut-off (θ) in the maximum change in the wetting angle, ϑi is not allowed to change anymore as soon as ϑi = θ. An example of a cut-off 60° is shown by dashed lines, in this case as soon as or , ϑi is not changed anymore. The time (t) needed to reach the cut-off value therefore varies from pore to pore and depends on the value of .
As a larger pore will need more brine to be flooded in order to have a similar change in the wetting angle than a smaller pore, a threshold value is introduced, which is proportional to the volume of that pore,
At , the wetting angle reaches to 90° in that pore and pc(x) essentially becomes zero. Here η is a proportionality constant which decides how many pore volumes of water is needed to reach for the ith pore. This parameter can possibly be adjusted against future experimental results, but is considered as a tuning parameter in this study. The expression for the capillary pressure at a menisci from Equation (1) then takes the form,
The maximum amount of wetting angle that can be changed depends on the combination of brine, oil and rock properties [20, 21]. We therefore set a cut-off θ in the wetting angle change, such that any pore that has reached to a wetting angle ϑi = θ, can not be changed further. The model thus includes all the essential ingredients of wettability alteration study–it is a time dependent model where the wettability alteration is correlated with the flow pathways of the brine, and can be used to study any oil-brine-rock combination decided by θ.
3. Results
Simulations are started with a random distribution of oil and water in an oil-wet network, where θ = 165.5° for all links. First, the oil-wet system is evolved to a steady state before any wettability alteration is started. This will allow us to compare the change in the steady-state fractional flow of oil (F) with a change in the wetting angle. The oil fractional flow (F) is defined as the ratio of the oil flow-rate (Qoil) to the total flow-rate (Q) given by, F = Qoil∕Q. The flow rate (Q) is kept constant throughout the simulation, which sets the capillary number Ca = μeffQ∕(γA), where A is the cross-sectional area of the network. A network of 40 × 40 links are considered, which is sufficient to be in the asymptotic limit for the range of parameters used [25]. An average over 5 different realizations of the network has been taken for each simulation. As the simulation continues, both drainage and imbibition take place simultaneously due to bi-periodic boundary conditions and the system eventually evolves to a steady state, with a distribution of water and oil clusters in the system. In Figure 3, F is plotted against the number of pore volumes passed (N) through the network. As we run the system with constant flow-rate, N is directly proportional to the time t, N = tQ∕v where v is the total volume of the network. The initial 200 pore volumes are for an oil-wet network, where it reaches to a steady state with F ≈ 0.235. We then initiate the dynamic wettability alteration which resembles the flow of a wettability altering brine and F starts to drift. Here we run simulations for different values of η, defined in Equation (5), and the results are plotted in different colors. θ = 0° in these simulations, which means any pore can change to pure water-wet depending upon the flow of brine through it. One can see that F approaches to a new steady-state with F ≈ 0.308 due to the wettability alteration. The initialization of steady state is defined as the instant when the average fractional flow stops changing with time and essentially stays within its fluctuation. The time (τ) required to initialize the steady state after wettability alteration is started is measured in terms of the pore-volumes and plotted in the inset of Figure 3 as a function of η and a simple linear dependency is observed. Therefore, different values of η only make the simulation faster or slower, but it reaches to the same steady state. In order to save computational time, we therefore use η = 10 in all our following simulations.
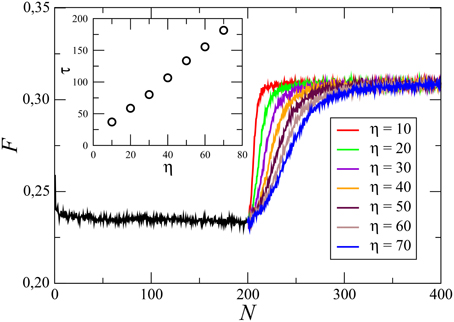
Figure 3. (Color online) Change in the oil fractional-flow (F) during the simulation as a function of the number of network pore-volumes (N) of fluids passed through any cross-section of the network. Here the network is of size 40 × 40 links with oil saturation S = 0.3 and Ca = 10−1. The initial part of the plot (N < 200) shows the change in F in an oil-wet system where it approaches to a steady state with F ≈ 0.235. The wettability alteration starts at N = 200, where results for different simulations with different values of η (the number of pore volumes of water needed to pass through one pore to reach the wetting angle to 90° in that pore) are plotted in different colors. The system evolves to a new steady-state where F fluctuates around a higher average value. Different values of η only affects the rate of change in F but leads to the same average F. In the inset we plot τ, the number of network pore-volumes of fluids passed through the network to reach the steady-state after wettability alteration is initiated, as a function of η. τ is proportional to the total time to reach steady state which increases linearly with η as seen in the inset. A higher value of η results in a longer time to reach the new steady-state.
How the two fluids and the local flow-rates are distributed in the network in the two steady-states before and after the wettability alteration are shown in Figure 4. The network size is 64 × 64 links here with an oil-saturation S = 0.3 and the capillary number Ca = 10−2. All the links are hour-glass shaped in the actual simulation with disorder in radii, but shown as a regular network for simplicity in drawing. The upper row shows the distribution of oil bubbles drawn in black. The left column (Figure 4A) shows the steady state in a oil-wet network and the right column (Figure 4B) shows the steady-state after the wettability alteration is initiated with maximum possible wetting angle change θ = 0°. A closer look in these bubble distributions shows more clustered oil bubbles in Figure 4A than in Figure 4B where they are more fragmented. A more interesting picture can be seen in the local flow-rate distribution in the bottom row, which shows a more dynamic scenario. The left (Figure 4C) and right (Figure 4D) figures are for the same time-steps before and after wettability alteration as in Figures 4A,B, respectively. Here the local flow-rates in each pore, normalized in between 0 and 1, are shown in gray scale. Interestingly, in the oil-wet system (Figure 4C), the flow is dominated in a few channels (black lines) where the flow-rates are orders of magnitude higher than the rest of the system. Other than those channels, the system has negligible flow, indicated by white patches which means the fluids are effectively stuck in all those areas. This situation happens when the difference in the saturation of the two fluids is large, where the phase with higher saturation (water here) tries to percolate in paths dominated by a single phase with less number of interfaces. This is not favorable in oil-recovery, as it leaves immobile fluid in the reservoir. In the flow distribution after the wettability alteration (Figure 4D), the flow is more homogeneous and distributed over the whole system, indicating higher mobility of the fluids. However, one should remember that when the wettability alteration is started in a system shown in Figure 4C, the wettability alteration starts taking place only in those pores with active flow. But then it perturbs the flow-field and starts new flow paths and eventually the system drifts toward a more homogeneous flow with time, as shown in Figure 4D.
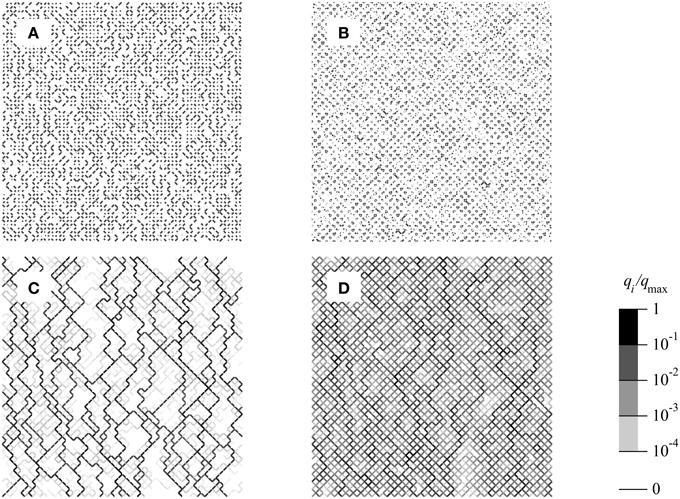
Figure 4. Distribution of fluid bubbles (top row) and local flow rates (bottom row) in steady state in a network of 64 × 64 links with oil saturation S = 0.3 and Ca = 10−2. The left column is for the steady state in a oil-wet network and the right column is the new steady state after wettability alteration takes place. In (A,B), the oil bubbles are drawn in black. In (C,D), the normalized local flow-rates qi∕qmax are drawn in gray scale.
We now present the results when the wetting angle of any pore can change all the way down to zero degree (θ = 0°). In Figure 5 the steady-state oil fractional-flow in an initial oil-wet system (F) is compared with that in the steady-state after wettability alteration (F′). Results are plotted as a function of S for two different capillary numbers, (Figure 5A) Ca = 10−1 and (Figure 5B) Ca = 10−2. The diagonal dashed line in the plots corresponds to F = S. If the fluids are miscible and there is no capillary forces at the menisci then both the fluids will flow equally and F will be exactly equal to S. But the presence of capillary forces at the interfaces lead to the deviation of the fractional-flow curve from the diagonal line. A lower capillary number (higher capillary forces) therefore results in more deviation from the F = S line. For low oil saturation, the oil fractional-flow is lower than S, i.e., under the diagonal and for high S, F is higher than S, i.e., above the diagonal. Roughly, the phase with higher volume fraction gains and it flows faster than the other. At some point, the curve crosses the diagonal and it is the point where no phase gains. The crossover point is not at 50% saturation which clearly shows the asymmetry between the two phases [30]. As F stays below the F = S line for low S, the flow of oil becomes lower and lower as oil saturation drops resulting small but stuck oil clusters. Interestingly, when wettability alterations are implemented, a significant increase in F can be observed for the full range of oil-saturation. Moreover, increase in F is higher for the lower capillary number, indicating that wettability alteration is very significant in the case of oil recovery, as Ca can go as low as 10−6 in the reservoir pores. Fractional flow also obeys the symmetry relation F′(S) = 1−F(1 − S) [26] which implies that, if the wetting angle of any pore is allowed to change all way down to zero degree (θ = 0°), the system will eventually become pure water-wet with time.
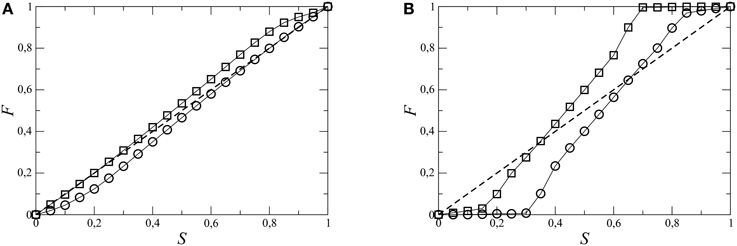
Figure 5. Oil fractional-flow (F) in the steady state at different oil saturation (S) in the initial oil-wet system (○) and after the wettability alteration (□). There is no cut-off in the wetting angle change in these simulations and therefore θ = 0° here. Individual simulations are performed for all S values at two different capillary numbers (A) Ca = 10−1 and (B) Ca = 10−2. F is higher after wettability alteration for the whole range of S. The diagonal dashed line represents F = S curve, miscible fluids without any capillary pressures at the menisci would follow that line.
As noted earlier, the maximum change in wetting angle for a system, depends on the properties of the reservoir rock, crude oil and brine, and also on the temperature. Existing wettability alteration procedures generally turns the oil-wet system into intermediate wet, rather than to pure water-wet. Some examples of the change in the wetting angle for different rock materials and brine can be found in Kathel and Mohanty [20] and Nasralla et al. [21]. In our simulation this is taken care of by the parameter θ, which decides the maximum change in the wetting angle ϑi for any pore. One should remember that, we are not forcibly changing the wetting angles ϑi to θ, rather the change in ϑi is decided independently for individual pores by the amount of brine passed through it (by Equations 3–6), and there is a maximum allowed change in any ϑi. As before, simulations are started with a pure oil-wet system to reach a steady state and then wettability alteration is started and simulation continues until the system reaches to a steady state again. Independent simulations have been performed for different values of θ. The proportionate change in the oil fractional-flow due this wettability change from the oil-wet system, ΔF∕F = (F′ − F)∕F is measured for different simulations and plotted in Figure 6 against θ. There are a few things to notice. First, as one can immediately see, fractional flow increases with the decrease of oil-wetness, θ → 0°. The maximum increase in F is higher for lower Ca, about 86% for Ca = 10−2 and about 32% for Ca = 10−1. This is because the change in wetting angle affects the capillary pressures at the menisci, so the change in F is larger when the capillary forces are higher. Secondly, the major change in F happens in the intermediate wetting regime, upto θ ≈ 60°, and then it becomes almost flat afterwards. Moreover, this increase in F is more rapid for lower value of Ca. All these facts points toward an optimal range of wetting angle change to increase the oil flow. This is an important observation for practical reasons, as it is not necessary to change the wetting angle further. Thirdly, there is a discontinuity in the curve exactly at θ = 90°, as we will discuss later.
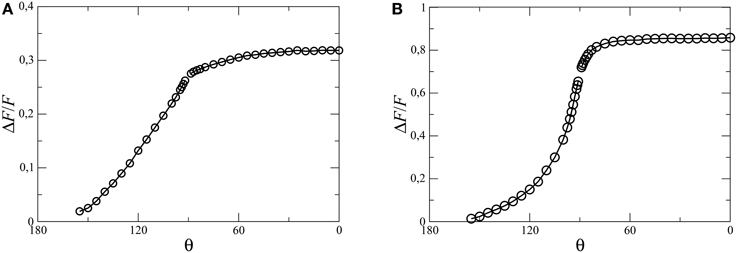
Figure 6. Proportionate change in the steady-state oil fractional-flow (ΔF∕F) due to wettability alteration as a function of maximum wetting angle θ. For (A) the capillary number Ca = 10−1 with oil-saturation S = 0.3 and for (B) Ca = 10−2 with S = 0.4.
Increase in the oil fractional-flow with the increase in the water-wetness may seem to be obvious and reported by many experiments and field tests. But, the most important concern for the oil industry is the rate of increase, or the time required to achieve a significant increase in the oil production. If the increment in oil flow is very slow compared to the cost of the process, then the oil recovery is declared as not profitable and the reservoir may be considered to be abandoned. As per our knowledge, there are very few systematic studies reported in the literature predicting the time scale to change the oil flow due to the wettability change by two-phase flow of brine and oil in a porous media. We observe that, due to the correlations between the flow paths and the wetting angle change, the time scale of the process varies dramatically with θ. This is illustrated in Figure 7, where F is plotted as a function of pore volumes (N) of fluid passed through the system. The initial 400 pore volumes are for an oil-wet system and then results of few different simulations with θ = 85, 88, 89, 90, 91, 92 and 94° are plotted. Interestingly, the rate at which the system reaches a new steady-state, varies significantly depending on the value of θ. For example, after the wettability alteration is started, it needs to flow less than 100 pore volumes to reach the new steady state for θ = 94° whereas more than 300 pore volumes are needed to reach a steady state for θ = 91°. Therefore, even if the final steady-state fractional flow is higher for θ = 91° than for θ = 94°, it might not be profitable to alter the wetting angles to 91° because of the slow increase in F. In general, the process becomes slower and slower as θ → 90° from both sides. Such kind of slow increase in oil recovery as θ → 90° is also observed in experiments [20, 21]. This slowing down of the process is an combined effect of two factors. First, the fact that wettability only can change in the pores where there is flow of brine and the second is the value of θ. All the pores were initially oil-wet () and when it reaches the steady state, the flow finds the high mobility pathways depending on the mobility factor of the pores and the capillary pressures at the menisci. When the wettability alteration is started, the wetting angles of the existing flow pathways start decreasing. As a result, capillary pressures at menisci in those channels first decreases as and then it increase afterwards as . This creates a perturbation in the global pressure field and correspondingly viscous pressures start changing with time which changes the flow field. However, capillary pressures at the zero-flow regimes are now higher than the high-flow regimes which makes it difficult to invade the zero-flow regimes causing a slower change in the flow field as ϑi approaches 90°. An interesting feature is observed exactly at θ = 90°, where the average fractional flow does not change at all after the wettability change. At exactly θ = 90°, capillary pressures in all the pores in the existing flow pathways essentially become zero, making them the lowest resistive channels with zero capillary barriers. As a result, the fluids keep flowing in the existing channels forever and the system stays in the same steady-state. The time taken to reach another new steady-state is therefore infinite at θ = 90° and it therefore is a critical point for the system.
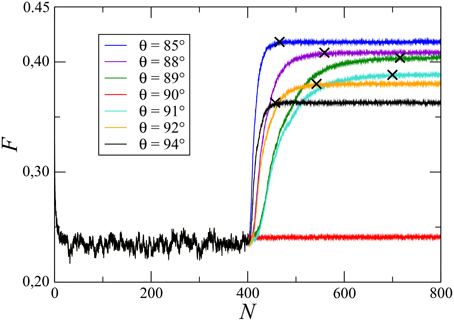
Figure 7. Change in the oil fractional-flow F during the simulation for different values of maximum allowed wetting angle θ. The wettability alteration started at N = 400 pore-volumes. The initialization of the steady-states for different θ values are marked by crosses on the respective plots.
We now measure the steady-state initialization time τ, defined as the moment when the average of the fractional flow stops changing with time and becomes horizontal with the x axis. This is shown In Figure 7, where the initialization of steady states is marked by crosses on the respective plots. As the simulations are performed with constant Q, τ is proportional to the fluid volume passed through the system and therefore we measure τ in the units of N. τ for different simulations with different values of the maximum wetting angle (θ) is plotted in Figure 8A for Ca = 10−1 with S = 0.3 and in Figure 8B for Ca = 10−2 with S = 0.4. One can see that τ diverges rapidly as θ approaches from both sides, θ > 90° and < 90°. This divergence of the steady-state time τ as θ → θc indicates the critical slowing down of the dynamics, which is a characteristics of critical phenomena. The critical slowing down is the outcome of the divergence of correlations at the critical point and can be characterized by a dynamic critical exponent z defined as τ~ξz, where ξ is the correlation length [31]. As θ → θc, the correlation length ξ diverges as where ν is the correlation length exponent. The divergence of the steady-state time τ can therefore be expressed as , where α = zν. In Figure 9, τ is plotted vs. |θ − θc| in log-log scale which gives two different slopes for θ > θc and θ < θc. We then find the value of the dynamic exponents α as α = 1.2±0.1 for θ > θc and α = 1.0±0.1 for θ < θc. However, they are the same within error bar for different capillary numbers and saturations (Figure 9). The value of the dynamic critical exponents depend on the underlying dynamics and on the model [32]. In this case, wettability alteration was started from an oil-wet system with for all the pores. So for the simulations with θ < 90°, the wetting angles cross the critical point (90°) when the capillary forces change directions. This might cause the system to mobilize the clusters somewhat faster than for θ > 90° when the capillary forces does not change any direction. As a result, α becomes smaller for θ < 90° than for θ > 90°.
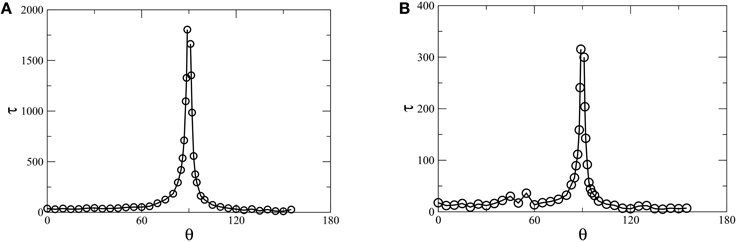
Figure 8. Variation of steady-state initialization time τ (measured in pore-volumes) as a function of maximum allowed wetting angle θ in any pore. For (A) Ca = 10−1 with oil saturation S = 0.3 and for (B) Ca = 10−2 with S = 0.4. τ diverges rapidly as θ → 90°, which is the critical wetting angle (θc).
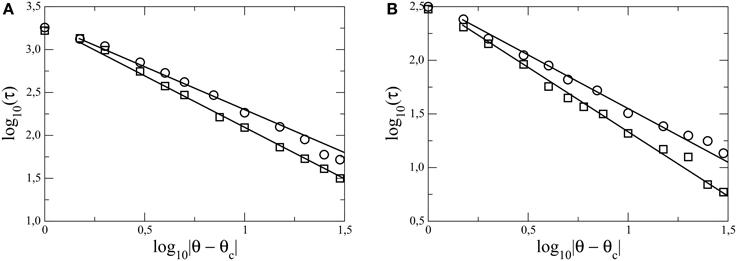
Figure 9. Plot of logτ vs. log|θ − θc|, where θ is the final allowed wetting angle in any pore, and τ is steady-state initialization time (measured in pore-volumes) after wettability alteration is initiated. For (A) the capillary number Ca = 10−1 with oil saturation S = 0.3 and for (B) Ca = 10−2 with S = 0.4. From the slopes, the value of the dynamic critical exponent α is obtained as α = 1.0 ± 0.1 for θ < θc (circles) and α = 1.2 ± 0.1 for θ > θc (squares).
We like to point out that a 2-dimensional (2D) pore network is considered in this study, but the model is equally applicable to any 3-dimensional (3D) network without any further change. However, as critical exponents depend on the spatial dimensionality of the system, values of the exponents measured for a 3D network are expected to be different.
4. Conclusions
In this article we have presented a detailed computational study of wettability alterations in two-phase flow in porous media, where the change in the wetting angle in a pore is controlled by the volumetric flow of the altering agent through it. When the wetting angles are allowed to alter toward water-wetness, the stuck oil clusters start to mobilize and oil-fractional flow increases. However, due to the correlations in the wetting angle change with the flow pathways, the time-scale of the dynamics strongly depends on the maximum allowed change in the wetting angle. We find that, as the final wetting angle is chosen closer to 90°, the system shows a critical slowing down in the dynamics. This critical slowing down is characterized by two dynamic critical exponents. The critical point we are dealing with is an equilibrium critical point as the system is in steady state. The dynamical critical exponents measure how long it takes to go from one steady state to a new one. To our knowledge, this is the first example of there being different values for the exponents on either side of the critical point. Our findings are in agreement with experimental observations reported in literature, and are extremely important for application purposes like oil recovery, where the time scale of the process is a key issue.
Conflict of Interest Statement
The authors declare that the research was conducted in the absence of any commercial or financial relationships that could be construed as a potential conflict of interest.
Acknowledgments
We thank E. Skjetne for introducing us to the subject of this study. We have benefited from discussions with D. Bideaux, E. G. flekkøy, S. Kjelstrup, and K. J. Måløy. This work has been supported by the Norwegian Research Council. We furthermore thank the Beijing Computational Sciences Research Center and its Director, H. Q. Lin for hospitality during the final stages of this work.
References
2. Roberts P. The End of Oil: On the Edge of a Perilous New World. New York, NY: Houghton Mifflin (2005).
3. Abdallah W, Buckley JS, Carnegie A, Edwards J, Herold B, Fordham E. Fundamentals of wettability. Schlumberger Oilfield Rev. (2007) 19:44. Available online at: http://www.slb.com/resources/publications/industry_articles/oilfield_review/2007/or2007sum04_wettability.aspx
4. Skauge A, Spildo K, Høiland L, Vik B. Theoretical and experimental evidence of different wettability classes. J Pet Sci Eng. (2007) 57:321–33. doi: 10.1016/j.petrol.2006.11.003
6. Sheng JJ. Comparison of the effects of wettability alteration and IFT reduction on oil recovery in carbonate reservoirs. Asia-Pac J Chem Eng. (2013) 8:154. doi: 10.1002/apj.1640
7. Chilingar GV, Yen TF. Some notes on wettability and relative permeabilities of carbonate reservoir rocks, II. Energy Sources (1983) 7:67. doi: 10.1080/00908318308908076
9. Kovscek AR, Wong H, Radke CJ. A pore-level scenario for the development of mixed wettability in oil reservoirs. AlChe J. (1993) 39:1072. doi: 10.1002/aic.690390616
10. Kaminsky R, Radke CJ. Asphaltenes, water films, and wettability reversal. SPE J. (1997) 2: 485. doi: 10.2118/39087-PA
11. Kidnay AJ, Parrish WR, McCartney DG. Fundamentals of natural gas processing, 2nd Edn. Florida, FL: CRC Press; Taylor & Francis Group (2011).
12. Alvarez JO, Neog A, Jais A, Schechter DS. Impact of surfactants for wettability alteration in stimulation fluids and the potential for surfactant EOR in unconventional liquid reservoirs. Soc. Pet. Eng. (2014). doi: 10.2118/169001-MS
13. Tang GQ, Morrow NR. Salinity, temperature, oil composition, and oil recovery by waterflooding. SPE Reserv Eng. (1997) 12:269. doi: 10.2118/36680-PA
14. Tang GQ, Morrow NR. Influence of brine composition and fines migration on crude oil/brine/rock interactions and oil recovery. J Pet Sci Eng. (1999) 24:99. doi: 10.1016/S0920-4105(99)00034-0
15. Standnes DC, Austad T. Wettability alteration in chalk: 2. Mechanism for wettability alteration from oil-wet to water-wet using surfactants. J Pet Sci Eng. (2000) 28:123. doi: 10.1016/S0920-4105(00)00084-X
16. Mohan K, Gupta R, Mohanty KK. Wettability altering secondary oil recovery in carbonate rocks. Energy Fuels (2011) 25:3966. doi: 10.1021/ef200449y
17. Tweheyo MT, Holt T, Torsæter O. An experimental study of the relationship between wettability and oil production characteristics. J Pet Sci Eng. (1999) 24:179. doi: 10.1016/S0920-4105(99)00041-8
18. Schembre JM, Tang GQ, Kovscek AR. Wettability alteration and oil recovery by water imbibition at elevated temperatures. J Pet Sci Eng. (2006) 52:131. doi: 10.1016/j.petrol.2006.03.017
19. Buckley JS, Takamura K, Morrow NR. Influence of electrical surface charges on the wetting properties of crude oils. SPE Reserv Eng. (1989) 4:332. doi: 10.2118/16964-PA
20. Kathel P, Mohanty KK. EOR in tight oil reservoirs through wettability alteration. Soc. Petro. Eng. (2013). doi: 10.2118/166281-MS
21. Nasralla RA, Bataweel MA, Nasr-El-Din HA. Investigation of wettability alteration and oil-recovery improvement by low-salinity water in sandstone rock. Soc. Petro. Eng. (2013). doi: 10.2118/146322-PA
22. Blunt MJ. Physically-based network modeling of multiphase flow in intermediate-wet porous media. J Pet Sci Eng. (1998) 20:117. doi: 10.1016/S0920-4105(98)00010-2
23. Ryazanov AV, van Dijke MIJ, Sorbie KS. Two-phase pore-network modelling: existence of oil layers during water invasion. Transp Porous Med. (2009) 80:79. doi: 10.1007/s11242-009-9345-x
24. Aker E, Måløy KJ, Hansen A, Batrouni GG. A two-dimensional network simulator for two-phase flow in porous media. Transp Porous Med. (1998) 32:163. doi: 10.1023/A:1006510106194
25. Knudsen HA, Aker E, Hansen A. Bulk flow regimes and fractional flow in 2D porous media by numerical simulations. Transp Porous Med. (2002) 47:99. doi: 10.1023/A:1015039503551
26. Sinha S, Grøva M, Ødegården TB, Skjetne E, Hansen A. Local wettability reversal during steady-state two-phase flow in porous media. Phys Rev E (2011) 84:037303. doi: 10.1103/PhysRevE.84.037303
27. Dullien FAL. Porous Media: Fluid Transport and Pore Structure. San Diego, CA: Academic Press (1992).
28. Washburn EW. The dynamics of capillary flow. Phys Rev. (1921) 17:273. doi: 10.1103/PhysRev.17.273
29. Batrouni GG, Hansen A. Fourier acceleration of iterative processes in disordered systems. J Stat Phys. (1988) 52:747. doi: 10.1007/BF01019728
30. Knudsen HA, Hansen A. Relation between pressure and fractional flow in two-phase flow in porous media. Phys Rev E (2002) 65:056310. doi: 10.1103/PhysRevE.65.056310
31. Bellac ML, Mortessagne F, Batrouni GG. Equilibrium and Non-Equilibrium Statistical Thermodynamics. Cambridge: Cambridge University Press (2004).
Keywords: wettability, porous media, porous media flow, fluid transport, two-phase flow in porous media, two-phase flow, capillary forces, critical slowing down
Citation: Flovik V, Sinha S and Hansen A (2015) Dynamic Wettability Alteration in Immiscible Two-phase Flow in Porous Media: Effect on Transport Properties and Critical Slowing Down. Front. Phys. 3:86. doi: 10.3389/fphy.2015.00086
Received: 23 July 2015; Accepted: 23 October 2015;
Published: 10 November 2015.
Edited by:
Renaud Toussaint, University of Strasbourg, FranceCopyright © 2015 Flovik, Sinha and Hansen. This is an open-access article distributed under the terms of the Creative Commons Attribution License (CC BY). The use, distribution or reproduction in other forums is permitted, provided the original author(s) or licensor are credited and that the original publication in this journal is cited, in accordance with accepted academic practice. No use, distribution or reproduction is permitted which does not comply with these terms.
*Correspondence: Vegard Flovik, vegard.flovik@ntnu.no;
Santanu Sinha, santanu.sinha@ntnu.no;
Alex Hansen, alex.hansen@ntnu.no