Emotions and Activity Profiles of Influential Users in Product Reviews Communities
 Dorian Tanase
  David Garcia
 Antonios Garas
- Chair of Systems Design, ETH Zurich, Zurich, Switzerland
Viral marketing seeks to maximize the spread of a campaign through an online social network, often targeting influential nodes with high centrality. In this article, we analyze behavioral aspects of influential users in trust-based product reviews communities, quantifying emotional expression, helpfulness, and user activity level. We focus on two independent product review communities, Dooyoo and Epinions, in which users can write product reviews and define trust links to filter product recommendations. Following the patterns of social contagion processes, we measure user social influence by means of the k-shell decomposition of trust networks. For each of these users, we apply sentiment analysis to extract their extent of positive, negative, and neutral emotional expression. In addition, we quantify the level of feedback they received in their reviews, the length of their contributions, and their level of activity over their lifetime in the community. We find that users of both communities exhibit a large heterogeneity of social influence, and that helpfulness votes and age are significantly better predictors of the influence of an individual than sentiment. The most active of the analyzed communities shows a particular structure, in which the inner core of users is qualitatively different from its periphery in terms of a stronger positive and negative emotional expression. These results suggest that both objective and subjective aspects of reviews are relevant to the communication of subjective experience.
1. Introduction
Popularity of socially-powered online platforms increased so much during the last years that, if we could imagine a country with a population as large as the user-base in Facebook, then it would be ranked as world's second largest country, with more than 1.23 Billion active users at the end of 2013 [1]. Users interact online via different platforms for personal blogging, dating, online shopping, reviewing products, etc. The latter two kind of platforms use their massive user community to both collect and disseminate information: Users create and discover reviews, form opinions based on the experience of others, and ultimately make the informed decision of buying a product or not. This form of socially-powered platforms are usually referred to as Social Recommender Systems (SRS) [2].
Similar to real-world social interactions, in online SRS platforms, some users manage to distinguish themselves from the rest by acquiring fame and social influence. If seen from a graph's perspective, some nodes become more central than others, but how this process works is not clear for real and online networks alike. How can a user increase its social influence and visibility? Are there any similarities in the career path of successful users? In this article, we address these questions by performing an empirical analysis on two datasets of online SRS that contain both product reviews and explicit social networks. Information is transferred in these systems through social ties, by means of social recommender filtering, which selects products and reviews from the peers that a user trusts. This functionality creates a spreading process through the social network that offers opportunities for viral marketing [3], using the social capital of online communities to maximize the visibility of a product [4].
The emotional content in product reviews is an interesting resource not only to overcome the bias present in ratings, but for the role emotions play in human communication and product evaluation. Studies in social psychology show that people find emotional information more interesting than the non-emotional, and that they show more engagement with emotional narrators [5]. Additionally, the social link between narrator and listener has been observed to strengthen when emotions are involved [6]. We are interested in testing these social theories, and assess whether they hold also in online recommender systems: Does a user who shares its emotions have a larger impact in the community? Do users prefer neutral product evaluations or, on contrary, is the personal experience, as emotional as it can be, considered more valuable?
In the theory of core affect [7], emotions are partially conscious, short-lived internal states, as opposed to the nature of opinions. A reviewer might not be fully aware of its own emotions, and if asked a long time after making the review, these emotions would have relaxed or disappeared, while its opinion about a product would remain. There is an expected overlap between rating and emotional classification [8], but the properties and social dynamics of opinions and emotions differ. For example, disclosure of emotions has been shown to be a better predictor for social connection than the sharing of facts and information [9], and collective emotions pose additional questions regarding collective identity, social action, and emergent phenomena in human societies [10].
The topic of social influence and spreading processes in social networks has attracted increasing attention, due to the presence of frequent cascades and viral phenomena in social systems. Influence processes have been studied in the context of rumor spreading in social networks [11]. To identify social influence, traditional measures focused on the concept of centrality [12], often measuring it as degree or betweenness centrality [13]. Recent works have shown that coreness centrality [14, 15] outperforms degree and betweenness centrality in detecting influentials both data-driven simulations [16] leading to applications to political movements [17, 18], scientific rumors [19, 20], gender inequality in Wikipedia [21], and cascades of users leaving a social network [22].
Finding influentials is often motivated by viral marketing, aiming at the maximization of the reach of a marketing campaign and user adoption [4, 23, 24]. Beyond purchase decisions, users of social recommender systems create star ratings and write reviews that can influence product adoption. The straightforward manner to analyze these reviews is to take into account the star rating as a measure of consumer satisfaction. This approach has been proved useful in the field of recommender systems [2, 25]. On the other hand, self-selection biases difficult the analysis of star-rating distributions, as their high bias reduces the heterogeneity of user evaluations, following a J-shaped distribution [26].
The large amount of product reviews in a social recommender system produce a state of information overload [25]. This kind of information overload influences the priority processing patterns of individuals [27]. Works in psychology identify emotions as one of the mechanisms for priority assignment: while we seek for positive experiences, negative ones make us react faster [28]. This leads to a stronger influence of emotions in social sharing [29], which also appears in product reviews [8]. Emotional expression cascades through social interaction have been identified in the context of chatrooms [30] and political movements [18], as well as for experimental [31] and field studies in social psychology [32]. Furthermore, pieces of information are more likely to be shared in a social context when they contain a stronger emotional content, as it has been shown for the case of urban legends [33].
Sentiment analysis tools allow researchers to process and analyze emotions in large scale datasets. Different techniques can be used to extract emotional content from short, informal texts [34, 35], being SentiStrength one of the leading tools for sentiment analysis in this context [36, 37]. Product reviews are much longer and better composed than tweets or YouTube comments, calling for the application of established lexicon-based techniques based on human annotation of words [35, 38]. These techniques have been proved useful to reveal patterns of depressive moods [39] and analyze the dynamics of happiness of whole societies [38]. We chose to apply this kind of lexicon-based sentiment analysis tool, due to its previous validation with large, formal texts, and for its possibility for extension to other languages [40].
To explore the role of emotions and activity into the social influence of users of product reviews communities, we empirically quantify user behavior in various aspects. First, we analyze the trust network of two independent online communities, measuring social influence in relation to spreading processes in social networks [41]. We compute the coreness centrality of all users [14], and validate that it serves as an indicator of the spreading potential of users. Second, we measure emotions in product reviews by means of sentiment analysis, and aggregated these values into emotional expression profiles of each users. Combining this subjective information with other objective dimensions, such as age in the community and review votes, we create extended user profiles with rich behavioral information. Third, we analyze the signatures of emotional expression across the different centrality values of each network, testing the existence of patterns of emotional expression.
2. Materials and Methods
2.1. Product Reviews Communities Data
We base our empirical analysis on two independent datasets based on two trust-based product reviews communities: Dooyoo1 and Epinions2. Dooyoo claims to be a “social-shopping platform which helps consumers make informed purchasing decisions”3. Similarly, Epinions is a product comparison website which features product reviews with a social component [42]. Both platforms are intended for English-speaking users, and allow them to post written reviews about products with a star-rating from 1 to 5. A particularly interesting feature of these two communities is that both allow the creation of directed social links that can be defined as trust and distrust links toward other users. Distrust links are not publicly available on the website, and for that reason our study is restricted only to trust links. These links are directional, meaning that the origin of the link trusts the destination of the link, as a way to acknowledge the quality of the reviews of the trusted user. The motivation for the creation of these links is advertised in both platforms as a way to improve product recommendations, as their recommender systems would refine the way they filter information based on this explicit trust [25].
Both platforms are product-generic, in the sense that users can review products in multiple categories, not limited to books or software. Apart from reviewing and creating trust links, users can also provide feedback about the quality of product reviews written by other users. This evaluation is done by clicking a helpful/unhelpful button, which the website uses to measure the helpfulness of a review as the aggregation of the votes of all users. This feedback feature is precisely relevant in Dooyoo, where users have the possibility of receiving money from the website as a reward for the creation of useful reviews4. In both communities, each review has a helpfulness score summarized as Very helpful, Somewhat helpful, Helpful, Not helpful, or No feedback if the review did not receive positive nor negative votes.
In our network datasets, nodes represent users, and a directed link from user u1 to user u2 means that u1 explicitly trusts u2. In both communities, users are allowed to see all the reviews created by all the other users, i.e., there are no private reviews. This means that there is a global information flow between users, which does not necessarily depend on the trust network. On the other hand, both websites advertise that their recommender systems take into account trust links in order to personalize recommendations. This implies that the trust network exercises a “filtering influence,” increasing the visibility and impact of the reviews of user u2 for user u1, if u1 trusts u2. This opens the question of the role of the trust network, especially when users are allowed to see all the reviews and can vote any review, regardless of the trust network, as helpful or unhelpful.
For Dooyoo, we gather a dataset which we refer to as the DY dataset. Datasets on Epinions are available from previous work [42], but to the best of our knowledge, none of them used the text of the reviews for extracting additional information beyond ratings. Therefore, we performed a web crawl on Epinions and fetched, besides the trust network, the text of reviews. The raw data was further cleaned up, by removing duplicate reviews, users, etc. We will refer to this dataset as the EP dataset. This second dataset is smaller, in terms of number of users, number of trust links and number of reviews than the version used in Walter et al. [25], but contains richer information including reviews text and helpfulness feedback. As shown in Table 1, the DY dataset contains roughly half the number of users in comparison to EP dataset, however, the amount of users that contributed at least one review is roughly the same. More details on the distributions of lifetimes and activity levels can be found in the Supplementary Information.
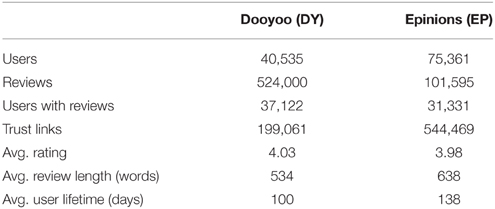
Table 1. Descriptive statistics on the Dooyoo and Epinions datasets.
2.2. User Sentiment Analysis
The star-rating of a review provides the explicit opinion given by the user, but the emotional content is not acknowledged when making the review, contrary to other communities like Livejournal [43]. For this reason, we apply a sentiment analysis technique that extracts an estimation of the valence v, which represents the amount of pleasure or displeasure associated with an emotional experience [44]. Among other dimensions that can be used to measure emotions [45], valence is the one that explains the most variance of emotional experience [46, 47]. This technique analyzes each word in the review by looking into a lexicon on word valence, providing an estimation of v as the mean valence of the words appearing in the text (for more details see Supplementary Information). Then, this value of valence is compared with the baseline distribution of the valence for emotional words in generalized text, as estimated from a large dataset from web crawls [40]. If the valence of a review r is above a threshold given this baseline distribution, the review is classified as positive (er = 1), if it is below another threshold, it is classified as negative (er = −1), and if it is between both it is classified as neutral (er = 0).
Given the emotional classification of each review, we calculate the degree of positivity, negativity, and neutrality of every user, by aggregating its emotional scores over the whole number of reviews it contributed in the following way:
where Ru is the set of reviews written by the user u, |Ru| is the number of reviews created by u, which is a metric for the amount of information it contributes to the community, and Θ(x) is a Boolean function that returns +1 if the argument is true and zero otherwise. These three metrics contain additional information about user behavior that is not contained in the average star-rating of a user.
Intuitively, one could expect that a successful user, a professional product reviewer, creates neutral, rigorous reviews, without emotional charge, in a similar fashion in which a journalist would write news and articles. However, in both datasets, we find that a large fraction of the reviews are positively charged, i.e., the user presents the product or service in a favorable manner by using positively emotional words. Reviews with negative emotions are less frequent than positive ones, but they are significantly present. These ratios are presented in Table 2.
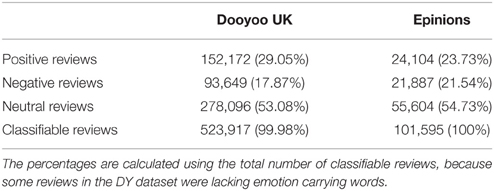
Table 2. The fraction of positively, negatively charged, and neutral reviews.
2.3. Network Analysis
We quantify the social influence of users of Dooyoo and Epinions by analyzing their respective social networks. First, we measured a set of descriptive statistics on each network, measuring diameter, reciprocity, path length, and finding the largest weakly and strongly connected components. These metrics are included in Table 3, showing that a significant difference between the two datasets is the size of their largest strongly and weakly connected components. Beyond that difference, the rest of statistics show relative similarity, displaying typical properties of social networks such as low average path length and diameter. The reciprocity for both networks is relatively low, in line with previous findings on Twitter [48].
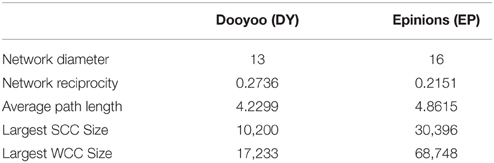
Table 3. Network statistics of the analyzed datasets, Dooyoo and Epinions.
We measure the level of social influence of a user through the k-shell decomposition of the social network [14, 15, 18, 49]. We measure the influence of a node by its coreness centrality ks, which is the state of the art metric to measure influence in social networks, as it is the best known predictor for the size of cascades [16].
In general, the k-shell decomposition of a graph is obtained by recursively removing all its vertices with degree less than k, until all the remaining vertices have minimum degree k + 1. The removed vertices are labeled with a shell number (ks) equal to k. For our study, we choose to collapse links into undirected ones, using as degree the sum of unidirectional and bidirectional links of a user. The reason for this stems from previous studies on Twitter, which show that the undirected k-shell decomposition of follower networks can predict empirical cascades of tweets in various phenomena [17, 50].
With the k-shell decomposition we are able to obtain a ranking of nodes which is related to a hierarchical organization in terms of importance, as illustrated in Figure 1. The larger the ks of a node, the more influential it is. We should note that the coreness centrality is, in general, highly correlated with the degree centrality. However, there is no one to one relation, since as shown in Figure 1, a node can have large degree and still be located at an external shell. Figure 2 shows the networks visualized with LaNet-vi [51], in which nodes have a color and position corresponding to their coreness.
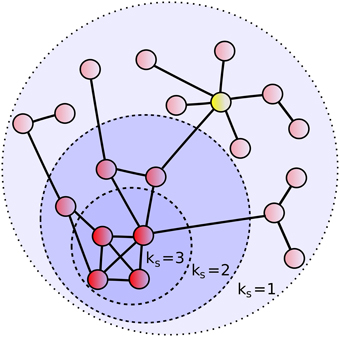
Figure 1. Example of a k-shell structure. Nodes in the same k-shell have the same coreness centrality ks. A high degree is not a sufficient condition for a high coreness, for example for the case of the yellow node.
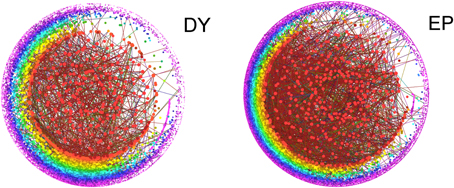
Figure 2. k-shell structure of the trust networks, where nodes have a color and position according to their coreness, and size according to their degree. The plots were created using the LaNet-vi software [51].
3. Results
3.1. Network Position and Social Influence
3.1.1. Heterogeneity of Coreness
For the EP network we find 126 shells, while for the DY network we find 84 shells. The distribution of coreness values ks of both networks, shown in Figure 3, is skewed and reveals that the location of users in the k-shells follows similar patterns. The majority of users are located in the periphery of the network, and only a small fraction of them is paced in the more central k-shells. However, though, despite that the EP network is almost twice as large as the DY network (see Table 1; the LCC of the EP is more than three times the LCC of the DY) the number of users in the more central k-shells is similar in both networks. This means that the number of very central users is not directly proportional to the total amount of users in a network, thus, there should be other factors determining users' centrality.
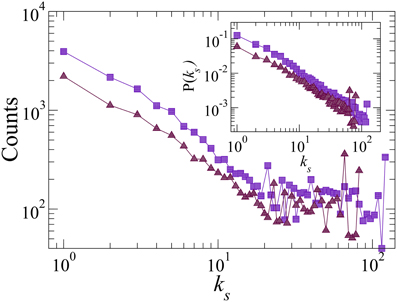
Figure 3. Frequency of coreness values for DY (triangles) and EP (squares). Inset: Probability density function of coreness values.
The heterogeneity of the distributions of ks values becomes evident when fitting power-law distributions to the empirical data. Applying a maximum likelihood criterion that minimizes the Kolmogorov-Smirnov distance between empirical and theoretical distributions [52], we find that both distributions can be explained by truncated power laws of exponent αEP = 1.39 ± 0.004 for EP and αDY = 1.207 ± 0.005 for DY. This result is robust, since log-likelihood ratio tests vs. log-normal and exponential alternatives give positive and significant values, i.e., the power-law distribution explains the distribution of ks significantly better than its non-scaling alternatives.
3.1.2. Social Influence Simulation
One of the goals of social networks is to facilitate information exchange between its users, i.e., information from user A can reach user B through the network link connecting them. Subsequently, the same piece of information can be forwarded by user B to user C through their respective link, and so on. This is an example of a classical spreading process taking place in a network topology [41]. In product review communities an underlying explicit social network facilitates information exchange about products (i.e., reviews). For example, when a review is created, the peers of the author will get access to new information and they have the option to either read it (and become informed) or not. Therefore, a natural way to simulate information propagation in such systems is by means of a Susceptible-Infectious (or better suited to our case Susceptible-Informed, SI) model. Such models have been used widely in the literature to describe processes like the spreading of epidemics, rumors, economic crises, etc. [53–58].
We perform large scale computer simulations of spreading processes, assuming that users stay informed after reading a review, i.e., users do not return to the susceptible state. This SI process is modeled as follows: starting from the explicit social network (DY or EP) we choose a user at random and we assume it will try (through the creation of a review) to spread information to all users it is connected to. The probability that a targeted user becomes informed by reading the review is β, and remains constant throughout the simulation. Next, the informed users will try to pass this information to all their neighbors, and so on. This process is terminated after all informed users have tried to propagate information through their respective connections. For both networks, we perform 10 runs initiating the spreading process from a specific user, and we repeated this sequentially for every user in the network using probability of infection β∈[0.1, 0.6] with step Δβ = 0.1.
In Figure 4, we plot the average fraction f of users that become informed from reviews created by users belonging to a k-shell vs. the k-shell number (ks). In agreement with [16], we find that information initiated by the more central users in terms of ks can reach a larger percentage of users in both networks. Therefore, the incentive of increasing ones impact in the network is correlated with the network centrality. As a result if users want to increase the impact of the transmitted information, they should try to become more central.
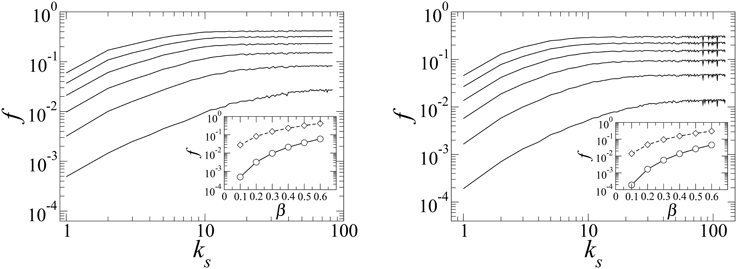
Figure 4. Average fraction f of informed population by reviews created from users of different k-shells vs. the k-shell number (ks). The different curves show results for different probabilities β∈[0.1, 0.6], with the lower curves corresponding to smaller β's. Inset: Average fraction f of informed population by reviews created from users of the lowest (circle) and the highest (diamond) k-shell vs. probability of information transmission β. Left panel: DY. Right panel: EP.
In the left panel of Figure 5 we plot the average fraction, fc, of the network that becomes informed by a review created from users belonging to the Largest Connected Component (LCC) of the network vs. the probability of transmission β. Besides the expected trend that fc increases with the probability β, in the left panel of Figure 5 it is shown that in the DY network fc can receive much higher values for the same β than in the EP network. This result suggests that the DY network allows a more efficient information transmission in comparison to the EP network, if we only consider the Largest Connected Component (LCC). But, if we consider the full network, then the situation is inversed. This can be attributed to the different connectivity pattern observed in the two communities (as discussed in Table 1), where for EP the largest connected component is almost 90% of the nodes, while for DY this percentage is almost 40%.
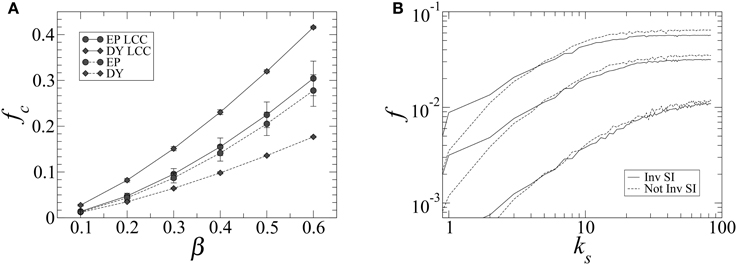
Figure 5. (A) Average fraction fc of informed population by reviews created from users of the LCC of the network vs. the probability of transmission β. The error bars stand for the standard deviation. (B) Average fraction f of informed population by reviews created from users of different k-shells vs. the k-shell number (ks) for the case of DY with β∈[0.1, 0.3]. The solid line is according to the assumption that information propagates contrary to the directionality of the link and the dashed line is according to the assumption that information propagates following the directionality of the link (dashed line).
We calculate topological features of users measured through the k-shell decomposition neglecting any possible effect of directionality in the links that connect them. However, the evolution of a dynamical process on a network could be heavily affected by the presence of directed links. Thus, in order to test whether link directionality affects our conclusions we apply the SI model to the DY network assuming two distinct hypotheses, (a) that information flows according to the direction of the links, and (b) that information flows inversely to the direction of the links. The right panel of Figure 5 shows the fraction f vs. ks for both hypotheses described above i.e., information flows following the link directionality, and information flows in the opposite direction. In general, we find that for ks > 5 the link directionality does not influence heavily the process of spreading, thus, the results we discussed in the previous analysis are valid for both cases. In what follows we try to identify the profile of the more central users, in order to understand whether there are common patterns in their behavior. After all, it is natural to assume that they did not end up being central purely by “luck.”
3.2. User Production
3.2.1. Helpfulness
Users give feedback on the quality of other users' reviews by voting individual reviews as helpful or unhelpful. In both communities, each review has a helpfulness rating calculated as a combination of these votes. The helpful rating hr is displayed along with a review r in a qualitative scale of four grades: “very useful,” “useful,” “somewhat useful,” and “not useful.” We map these ratings on a scale from 0 (not useful) to 4 (very useful), in order to quantify the impact of a review in the community. Table 4 contains the ratios of each type of feedback in EP and DY.
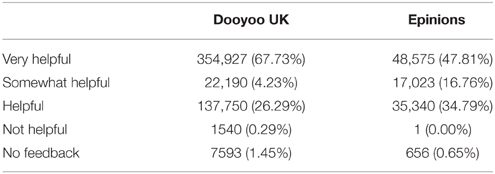
Table 4. Ratios of community feedback values for the reviews of each dataset.
Given this measure of helpfulness of a review, for each user u we can calculate a value of total helpfulness
which is a sum of all the helpfulness scores attributed by the community to the reviews created by the user, Ru. Figure 6 shows the distribution of the values of hu in each community. This figure reveals the large heterogeneity in the helpfulness of users, where most users have very few helpful reviews, while some others accumulate large amounts of positive feedback from the rest. The two communities differ in the shape of this heterogeneity, as in DY there are significantly larger amounts of users with high helpfulness in comparison with EP.
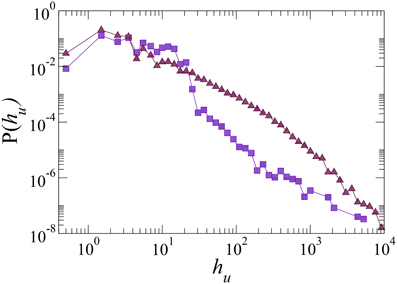
Figure 6. The distribution of the total helpfulness (hu) of users for DY (triangles) and EP (squares).
While the distribution of hu in EP is very irregular, it seems to follow a stylized broad distribution in DY. While the tail is not long enough to verify a power-law distribution [59], we tested the possibility of a log-normal distribution. A maximum likelihood estimation, discussed in the Supplementary Information, gives a set of parameters that fail to fit the tail of the distribution, leading us to reject the log-normal hypothesis. This initial observation indicates the existence of a process of helpfulness accumulation that creates larger heterogeneity than the one present in a log-normal distribution, but we do not have enough data to precisely explore its properties at larger scales.
3.2.2. Ratings and Emotions
Product reviews contain factual information about properties of the product and its experienced quality from the reviewer's point of view. In the two communities we study, as discussed above, a product review contains two elements: a star rating, which summarizes product experience in a form of opinion, and a review text with detailed information written by the user. The straightforward manner to analyze these reviews is to take into account the star rating, as a measure of consumer satisfaction with the product. This approach has been proved useful in the field of recommender systems [2, 25, 60, 61]. On the other hand, self-selection biases make it difficult to analyze star-rating distributions, as their high bias reduces the heterogeneity of user evaluations, following a J-shaped distribution [26]. This is the case for both EP and DY, where the distribution of star-ratings of the reviews follows a J-shaped distribution, as shown in Figure 7. Most of the reviews have star ratings ≥ 4, with a small increase on the amount of 1-star reviews in comparison with 2-star reviews. In addition, user average ratings suffer from this bias, as shown in Figure 8. To overcome this limitation, we study the emotions expressed in the text of the review, as explained below.
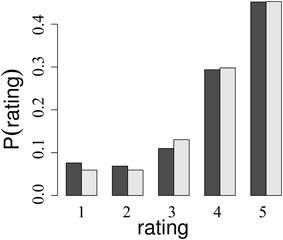
Figure 7. Distribution of ratings in the reviews of EP (dark) and DY (light). Both distributions show a strong bias toward positive ratings, with a moderated J-shape.
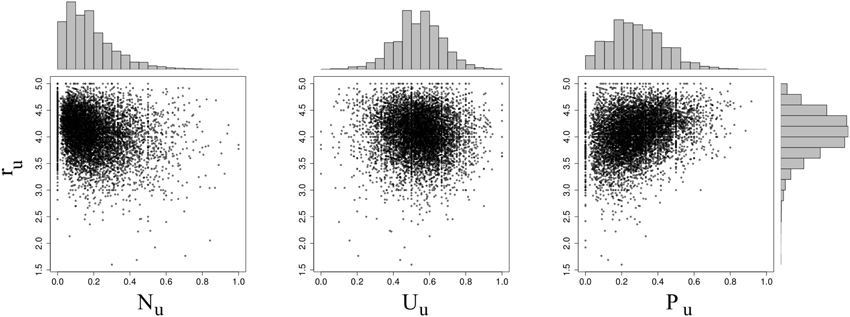
Figure 8. Scatter plot of user average ratings ru vs. user emotional ratios for negative (Nu, left), neutral (Uu, right), and positive (Pu, right) reviews. The histograms show the distributions of each variable.
Figure 8 shows the scatter plots of the user ratios of emotional expression vs. the average rating of users, with the corresponding distributions in each axis. We can clearly observe how the average rating of users, ru is skewed with a mean around 4, while the ratios Nu, Uu, and Pu have different distributions between 0 and 1. The pairwise Pearson correlation coefficients of ru with each of the other three variables has absolute values below 0.25, indicating that there is significant variance of the emotional expression of users that is not captured by the ratings. The three metrics Nu, Uu, and Pu provide us with additional data beyond the simple average rating provided by a user, profiling the different types of users by the way they express their emotions in the reviews they create.
3.3. The Profile of Influential Users
We test whether there are user specific features associated with an increased coreness of the user ku and thus with an increased user social influence. For our analysis, we use a linear regression technique on a logarithmic transformation of ku, using the behavior metrics explained above as independent variables. This technique of substitution models has been used before to study the relation between Facebook user popularity and personality metrics from a survey [62]. In our case, we fit the following model:
The dependent variable is a transformation of the coreness in two ways: (i) calculating the logarithm to provide a monotonic transformation that decreases the variance of ku, as its distribution is right skewed (see Figure 2), and (ii) an increment of 1 to include in our analysis active but disconnected nodes with ku = 0. The independent variables of our model capture the different metrics of user behavior explained above. The first two variables, Pu and Nu account for the emotional expression of the user. We omit the ratio of neutral messages Uu, as its redundancy with the previous two would lead to a singularity due to the identity Pu + Nu + Uu = 1. The third variable, the average rating of the user ru accounts for the style of the user in capturing its opinions into a precise number. The fourth variable is the lifetime of the user in the community tu, as explained in Section 3.2.1. This variable accounts for heterogeneity in the age of users, and it might play a relevant role in the impact a user can have in the product reviews community. The fifth variable is a transformation of the total helpfulness of the user hu, following the same principle as for the dependent variable. Finally, the last variable accounts for the logarithm of the average amount of words in the reviews of the user log(wu), as a proxy for the amount of unfiltered information in a typical review of the user, which could have an effect on its relevance in the community (for more details on the amount of words of reviews, see SI).
We fit Equation 3, first normalizing each variable and then solving the linear regression by the method of least squares, obtaining results summarized in Table 5. Our first observation is that the linear regression is different for the two datasets. The R2 for the case of DY is 0.6174, while for EP is 0.1751. This indicates that the data we obtained for Dooyoo allows us to better estimate the social influence of a user by its activity, in comparison with the EP dataset. Second, in both cases the largest significant coefficient is the total helpfulness of the user. This shows that the total helpfulness and the k-shell number of a user are directly related. In other words, a user becomes central, and therefore, more important in the community, if it contributes with many helpful reviews.
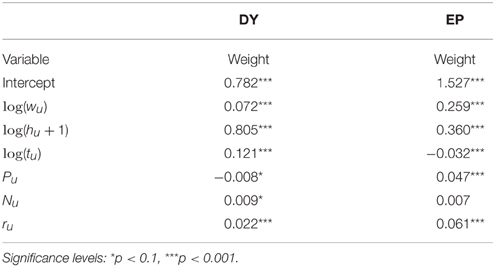
Table 5. Linear regression coefficients and p-values for log(ku + 1) from the rest of the user metrics (normalized), for Dooyoo (DY) and Epinions (EP).
The second largest weight for the users in DY corresponds to the lifetime of a user in the community tu, with significant positive value. This means that users that have been longer in the product reviews community also have higher coreness. For EP, the average length of the reviews created by a user is the second most important factor for centrality. As in DY with lifetime, wu is less relevant than the total helpfulness implying that the community is not concerned about the size of reviews but rather about their overall quality.
Focusing on the relation between the coreness of a user and its total helpfulness, we computed Pearson's correlation coefficients between log(hu + 1) and log(ku + 1), giving a value of 0.677 ± 0.006 for DY, and 0.337 ± 0.01 for EP, both with p < 0.001. This way, we conclude that the total helpfulness of a user is a good predictor for its network centrality, as both variables are significantly correlated in both datasets. Figure 9 shows the mean coreness values for users of different helpfulness levels. Both communities display a clear relation between both variables: users with higher amounts of helpful reviews also have more social influence.
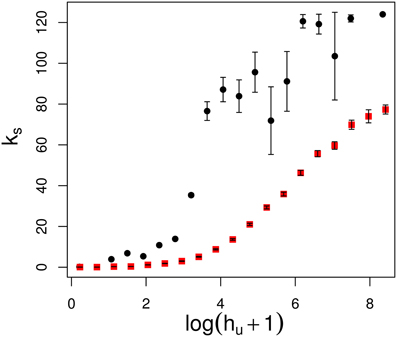
Figure 9. Dependency of the ks value given the logarithm of the helpfulness of its users (DY in red, EP in black). Points are mean values of ks and error bars are standard error. Helpfulness serves as a predictor for coreness in both communities.
Testing the role of emotionality ratios and average rating in the results of Table 5, we notice that all three variables have very low regression weights. Pu and Nu have low significance in DY, and Nu is not significant in EP. This indicates that the role of emotions in social influence cannot be observed through this analysis at the individual level, and that helpfulness and age are more predictive variables.
3.4. The Emotional Core of Dooyoo
Motivated by the theory of collective emotions [10], we tackle the question of how do the aggregated emotions of users in different k-shells differ. For a given coreness number ks, we aggregate the activity of all the users in that shell by the average values 〈P〉s, 〈U〉s, 〈N〉s, calculated over all the users with coreness ks. The emotional profile of the users in different k-shells can be observed in Figure 10, where each k-shell is represented by a semicircle with distance to the center according to their coreness number. Each shell has three colors that range from the minimum to the maximum values of each 〈N〉s, 〈U〉s, 〈P〉s. For both communities, k-shells closer to the core have stronger negativity and weaker neutrality. It is important to notice that, even though these emotions increase within their individual ranges, the maximum values of 〈N〉s in DY still remain lower than the other two average ratios.
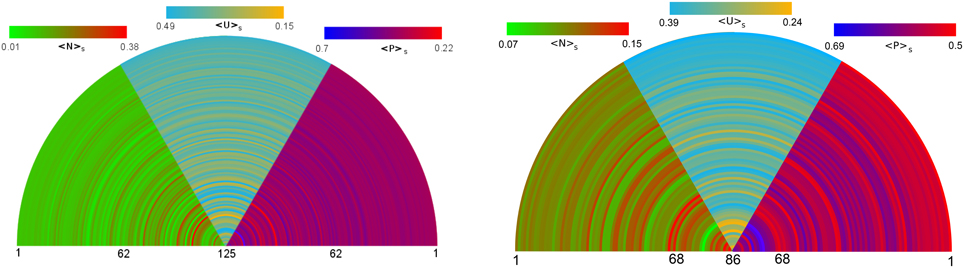
Figure 10. Representation of the average emotional expression of the nodes of each k-shell, for EP left and for DY right. Each circle represents the nodes with a particular k-shell number, with a distance from the center inversely proportional to their coreness. Circles are colored in three intervals according to 〈N〉s, 〈U〉s, and 〈P〉s, ranging from minima to maxima as indicated by the color bars.
A close inspection of Figure 10 shows a pattern in DY that does not appear in EP: There is an inner core composed of some shells with high coreness number that have stronger average emotion indicators, as compared with the rest of shells with lower ks numbers. This inner vs. outer part difference is described by a critical value of kc, which highlights a stronger emotional expression for k-shells with ks at least kc (the core), in comparison with the weaker emotional expression of those with ks < kc (the periphery).
We test the existence of this core by a set of Wilcoxon tests dividing each community in users with k-shell number above and below different values of kc. Figure 11 shows the Wilcoxon distances Δ of 〈N〉s, 〈U〉s, and 〈P〉s between the core and periphery, for values of the division kc from 1 to the maximum coreness number. For EP we did not find any significant nonzero distances separating the neutral and negative average scores of the inner and outer parts. For DY, on the other hand, the scenario is different. There is a value kc = 68, where there is a sharp transition that indicates a maximal distinction between core and periphery, highlighting the existence of a more emotional central subcommunity.
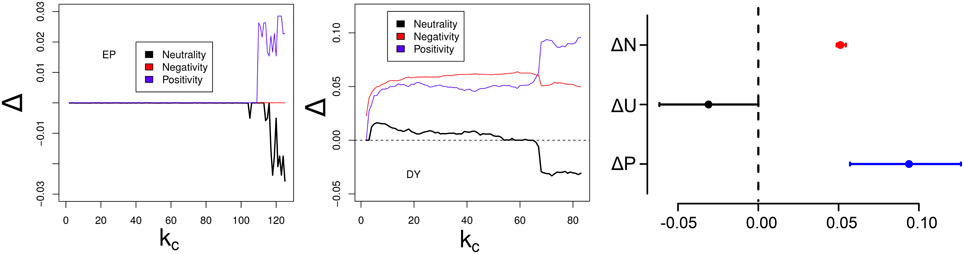
Figure 11. Wilcoxon distances for averaged user emotions between divisions in core and periphery, depending on the division value kc, for EP on the left and DY on the center. Right: Wilcoxon distances between inner and outer parts of DY.
The significant separation of DY in core and periphery leads to a central core with stronger emotional expression. The right panel of Figure 11 shows the Wilcoxon distance between emotion ratios, comparing core and periphery divided by kc = 68. The core has significantly higher negative and positive ratios, with decreased neutrality ratio. This result is supported by the dependence of the p-value of the Wilcoxon test and the ratios of emotional expression vs. kc, as shown in the SI.
4. Discussion
Our analysis of two online product reviews communities shows the relation between community feedback, emotions, and social influence within the trust network. We measure social influence by means of the coreness of individual users, and validated such metric based on the SI process of information spread. Our findings show that, in line with previous research [16], the expected size of a cascade increases with the coreness centrality of the node it starts from. Furthermore, we analyze the heterogeneity of coreness through model fitting to the empirical distributions, finding that the coreness in both communities follows a power-law distribution. The exponents we found for these fits suggest that the mean and variance of coreness scales with system size, i.e., larger online communities serve as training grounds for even more influential users. Testing this type of scaling requires the analysis of several online communities, and remains open for future research.
We measure emotional expression in reviews through the ANEW lexicon, and aggregate the emotions of individual users in three scores for positivity, negativity, and neutrality. These three dimensions create a richer representation of individuals beyond average ratings, as emotional expression contains information not encoded in the star-ratings of reviews. Combining these features with the lifetime in the community, the average review size in words, and the levels of helpfulness votes of the users, we find that total helpfulness and average review length are the most relevant indicators for individual social influence, beyond emotional expression. Our observational analysis of one snapshot of the system point at the relevance of emotions in social influence, but further research should test other individual and temporal aspects of this explanation. Experimental studies can isolate the individual components that drive the decisions and expressions of users. Data with temporal resolution in network formation should further explore the career path of influential users, measuring the changes in k-core values as a function of contributions and emotions.
Our statistical analysis shows the existence of a sharp transition in coreness that divides the Dooyoo community in two levels: An emotional core and a more neutral surface. This structure was absent in Epinions, opening the question what process could create such difference in the relation between topology and emotional expression. An initial conjecture would point to the different reward schemes of the two communities: Dooyoo offered monetary rewards to its most successful users, who created the emotional core of influential users. While our results at the individual level are inconclusive with respect to emotional expression, this characterization of emotions in a core-periphery structure suggests that the expression of emotions provides a medium for the communication of subjective experience. Such kind of communication process would enhance the interaction of certain types of users, improving their social influence as a whole rather than if they just wrote reviews with purely factual information. Understanding how such a pattern emerges from individual emotional interaction is a question open for future research, which could potentially link individual and collective patterns of emotions and social influence.
Author Contributions
DT gathered and processed data, DT and AG analyzed the networks, DT and DG performed statistical analyses, DT, DG, AG, and FS wrote the article.
Funding
This research has received funding from the European Community's Seventh Framework Programme FP7-ICT-2008-3 under grant agreement no 231323 (CYBEREMOTIONS).
Conflict of Interest Statement
The authors declare that the research was conducted in the absence of any commercial or financial relationships that could be construed as a potential conflict of interest.
Acknowledgments
The authors would like to thank Epinions.com and Dooyoo.co.uk for their accessibility to public reviews and trust data.
Supplementary Material
The Supplementary Material for this article can be found online at: https://www.frontiersin.org/article/10.3389/fphy.2015.00087
Footnotes
3. ^“About”-page of www.dooyoo.co.uk.
4. ^Description of monetary rewards in Dooyoo: http://www.dooyoo.co.uk/community/_page/advice_participate.
References
1. Facebook. Facebook Reports Fourth Quarter and Full Year 2013 Results (2014). Available online at: http://investor.fb.com/releasedetail.cfm?ReleaseID=821954
2. Victor P, Cornelis C, De Cock M. Trust Networks for Recommender Systems. Vol. 4. Springer Science & Business Media (2011). Available online at: http://www.springer.com/us/book/9789491216077
3. Leskovec J, Adamic LA, Huberman BA. The dynamics of viral marketing. ACM Trans Web (TWEB) (2007) 1:5. doi: 10.1145/1232722.1232727
4. Bonchi F, Castillo C, Gionis A, Jaimes A. Social network analysis and mining for business applications. ACM Trans Intell Syst Technol. (2011) 2:22. doi: 10.1145/1961189.1961194
5. Collins NL, Miller LC. Self-disclosure and liking: a meta-analytic review. Psychol Bull. (1994) 116:457475.
6. Peters K, Kashima Y. From social talk to social action: shaping the social triad with emotion sharing. J Pers Soc Psychol. (2007) 93:780–97. doi: 10.1037/0022-3514.93.5.780
7. Russell JA. Core affect and the psychological construction of emotion. Psychol Rev. (2003) 110:145. doi: 10.1037/0033-295X.110.1.145
8. Garcia D, Schweitzer F. Emotions in product reviews - empirics and models. In: International Conference on Social Computing. Boston, MA (2011). pp. 483–8.
9. Laurenceau JP, Barrett LF, Pietromonaco PR. Intimacy as an interpersonal process: the importance of self-disclosure, partner disclosure, and perceived partner responsiveness in interpersonal exchanges. J Pers Soc Psychol. (1998) 74:1238–51. doi: 10.1037/0022-3514.74.5.1238
11. Chierichetti F, Lattanzi S, Panconesi A. Rumor spreading in social networks. Theor Comput Sci. (2011) 412:2602–10. doi: 10.1016/j.tcs.2010.11.001
12. Newman MEJ. Networks: An Introduction. Oxford University Press (2010). Available online at: http://www.oxfordscholarship.com/view/10.1093/acprof:oso/9780199206650.001.0001/acprof-9780199206650
13. Freeman LC. A set of measures of centrality based on betweenness. Sociometry (1977) 40:35–41. doi: 10.2307/3033543
14. Seidman SB. Network structure and minimum degree. Soc Netw. (1983) 5:269–87. doi: 10.1016/0378-8733(83)90028-X
15. Garas A, Schweitzer F, Havlin S. A k-shell decomposition method for weighted networks. New J Phys. (2012) 14:083030. doi: 10.1088/1367-2630/14/8/083030
16. Kitsak M, Gallos LK, Havlin S, Liljeros F, Muchnik L, Stanley HE, et al. Identification of influential spreaders in complex networks. Nat Phys. (2010) 6:888–93. doi: 10.1038/nphys1746
17. González-Bailón S, Borge-Holthoefer J, Moreno Y. Broadcasters and hidden influentials in online protest diffusion. Am Behav Sci. (2013) 57:943–65. doi: 10.1177/0002764213479371
18. Alvarez R, Garcia D, Moreno Y, Schweitzer F. Sentiment cascades in the 15M movement. EPJ Data Sci. (2015) 4:1–13. doi: 10.1140/epjds/s13688-015-0042-4
19. De, Domenico M, Lima A, Mougel P, Musolesi M. The anatomy of a scientific rumor. Sci Rep. (2013) 3:02980. doi: 10.1038/srep02980
20. Borge-Holthoefer J, Meloni S, Gonçalves B, Moreno Y. Emergence of influential spreaders in modified rumor models. J Stat Phys. (2013) 151:383–93. doi: 10.1007/s10955-012-0595-6
21. Wagner C, Garcia D, Jadidi M, Strohmaier M. It's a man's wikipedia? Assessing gender inequality in an online encyclopedia. In: International AAAI Conference on Weblogs and Social Media. Oxford, UK (2015). pp. 454–63.
22. Garcia D, Mavrodiev P, Schweitzer F. Social resilience in online communities: the autopsy of Friendster. In: Conference in Online Social Networks. Boston, MA (2013). pp. 39–50.
23. Arthur D, Motwani R, Sharma A, Xu Y. Pricing strategies for viral marketing on social networks. In: Leonardi S, editor. Internet and Network Economics. Rome: Springer (2009). pp. 101–12.
24. Barbieri N, Bonchi F. Influence maximization with viral product design. In: Proceedings of the 2014 SIAM International Conference on Data Mining (2014). pp. 55–63. Available online at: http://epubs.siam.org/doi/abs/10.1137/1.9781611973440.7
25. Walter FE, Battiston S, Schweitzer F. Personalised and dynamic trust in social networks. In: Proceedings of the Third ACM Conference on Recommender Systems - RecSys '09. New York, NY (2009). p. 197.
26. Hu N, Zhang J, Pavlou PA. Overcoming the J-shaped distribution of product reviews. In: Communications of the ACM (2009) 52:144. Available online at: http://dl.acm.org/ft_gateway.cfm?id=1562800&type=html
27. Rodriguez MG, Gummadi K, Schölkopf B. Quantifying information overload in social media and its impact on social contagions. In: Proceedings Eighth International AAAI Conference on Weblogs and Social Media (ICWSM). Ann Arbor, MI (2014).
28. Norman GJ, Norris CJ, Gollan J, Ito, Ta, Hawkley LC, Larsen JT, et al. Current emotion research in psychophysiology: the neurobiology of evaluative bivalence. Emotion Rev. (2011) 3:349–59. doi: 10.1177/1754073911402403
29. Rime B. Emotion elicits the social sharing of emotion: theory and empirical review. Emotion Rev. (2009) 1:60–85. doi: 10.1177/1754073908097189
30. Garas A, Garcia D, Skowron M, Schweitzer F. Emotional persistence in online chatting communities. Sci Rep. (2012) 2:402. doi: 10.1038/srep00402
31. Christophe V, Rime B. Exposure to the social sharing of emotion: emotional impact, listener responses and secondary social sharing. Eur J Soc Psychol. (1997) 27:37–54.
32. Harber KD. The emotional broadcaster theory of social sharing. J Lang Soc Psychol. (2005) 24:382–400. doi: 10.1177/0261927X05281426
33. Heath C, Bell C, Steinberg E. Emotional selection in memes: the case of urban legends. J Pers. (2001) 81:1028–41. doi: 10.1037/0022-3514.81.6.1028
34. Gonçalves P, Araújo M, Benevenuto F, Cha M. Comparing and combining sentiment analysis methods. In: Conference on Online Social Networks. Boston, MA (2013).
35. Iosub D, Laniado D, Castillo C, Fuster, Morell M, Kaltenbrunner A. Emotions under discussion: gender, status and communication in online collaboration. PLoS ONE. (2014) 9:e104880. doi: 10.1371/journal.pone.0104880
36. Thelwall M, Buckley K, Paltoglou G, Skowron M, Garcia D, Gobron S, et al. Damping sentiment analysis in online communication: discussions, monologs and dialogs. In: Gelbukh A, editor. Computational Linguistics and Intelligent Text Processing. Samos: Springer (2013). pp. 1–12.
37. Abbasi A, Hassan A, Dhar M. Benchmarking Twitter sentiment analysis tools. In: Language Resources and Evaluation Conference. Reykjavik (2014).
38. Dodds PS, Danforth CM. Measuring the happiness of large-scale written expression: songs, blogs, and presidents. J Happiness Stud. (2009) 11:441–56. doi: 10.1007/s10902-009-9150-9
39. Park M, Cha C, Cha M. Depressive moods of users portrayed in twitter. In: Proceedings of the ACM SIGKDD Workshop on Healthcare Informatics, HI-KDD. Beijing (2012).
40. Garcia D, Garas A, Schweitzer F. Positive words carry less information than negative words. EPJ Data Sci. (2012) 1:3. doi: 10.1140/epjds3
41. Anderson RM, May RM. Infectious Diseases of Humans: Dynamics and Control. Oxford, UK: Oxford Science Publications (1992).
42. Massa P, Avesani P. Controversial users demand local trust metrics: an experimental study on epinions. com community. In: Proceedings of the National Conference on Artificial Intelligence. Vol. 20. Pittsburgh, PA (2005). p. 121.
43. Zafarani R, Cole WD, Liu H. Sentiment propagation in social networks : a case study in livejournal. In: Advances in Social Computing, Lecture Notes in Computer Science. Vol. 6007. Bethesda, MD (2010). pp. 413–20.
44. Russell JA. A circumplex model of affect. J Pers Soc Psychol. (1980) 39:1161–78. doi: 10.1037/h0077714
45. Bradley MM, Lang PJ. Affective Norms for English Words (ANEW): Instruction Manual and Affective Ratings. The Center for Research in Psychophysiology, University of Florida (1999).
46. Russell JA, Mehrabian A. Evidence for a three-factor theory of emotions. J. Res Pers. (1977) 11:273–94.
47. Fontaine JR, Scherer KR, Roesch EB, Ellsworth PC. The world of emotions is not two-dimensional. Psychol Sci. (2007) 18:1050–7. doi: 10.1111/j.1467-9280.2007.02024.x
48. Kwak H, Lee C, Park H, Moon S. What is Twitter, a social network or a news media? In: International Conference on World Wide Web. Raleigh, NC (2010). pp. 591–600.
49. Batagelj V, Zaveršnik M. Fast algorithms for determining (generalized) core groups in social networks. Adv Data Anal Class. (2011) 5:129–45. doi: 10.1007/s11634-010-0079-y
50. Baños RA, Borge-Holthoefer J, Moreno Y. The role of hidden influentials in the diffusion of online information cascades. EPJ Data Sci. (2013) 2:1–16. doi: 10.1140/epjds18
51. Beiró, MG, Alvarez-Hamelin JI, Busch JR. A low complexity visualization tool that helps to perform complex systems analysis. New J Phys. (2008) 10:125003. doi: 10.1088/1367-2630/10/12/125003
52. Alstott J, Bullmore E, Plenz D. powerlaw: a Python package for analysis of heavy-tailed distributions. PLoS ONE. (2014) 9:e85777. doi: 10.1371/journal.pone.0085777
53. Daley DJ, Kendall DG. Stochastic rumours. IMA J Appl Math. (1965) 1:42–55. doi: 10.1093/imamat/1.1.42
54. Hethcote HW. The mathematics of infectious diseases. SIAM Rev. (2000) 42:599. doi: 10.1137/S0036144500371907
55. Newman MEJ. Spread of epidemic disease on networks. Phys Rev E. (2002) 66:1–11. doi: 10.1103/PhysRevE.66.016128
56. Colizza V, Barrat A, Barthélemy M, Vespignani A. The role of the airline transportation network in the prediction and predictability of global epidemics. Proc Natl Acad Sci USA. (2006) 103:2015–20. doi: 10.1073/pnas.0510525103
57. Castellano C, Fortunato S, Loreto V. Statistical physics of social dynamics. Rev Mod Phys. (2009) 81:591–646. doi: 10.1103/RevModPhys.81.591
58. Garas A, Argyrakis P, Rozenblat C, Tomassini M, Havlin S. Worldwide spreading of economic crisis. New J Phys. (2010) 12:113043. doi: 10.1088/1367-2630/12/11/113043
59. Clauset A, Shalizi CR, Newman MEJ. Power-law distributions in empirical data. SIAM Rev. (2009) 51:661. doi: 10.1137/070710111
60. Jamali M, Ester M. A matrix factorization technique with trust propagation for recommendation in social networks. In: Proceedings of the Fourth ACM Conference on Recommender Systems - RecSys '10. New York, NY: ACM Press (2010). p. 135. Available online at: http://portal.acm.org/citation.cfm?doid=1864708.1864736
61. Tanase D. Social Dynamics in Online Product Review Communities. Dissertation, Eidgenössische Technische Hochschule ETH Zürich, Zürich (2013). Available online at: http://e-collection.library.ethz.ch/view/eth:6433
Keywords: social network analysis, social influence, sentiment, trust, spreading processes
Citation: Tanase D, Garcia D, Garas A and Schweitzer F (2015) Emotions and Activity Profiles of Influential Users in Product Reviews Communities. Front. Phys. 3:87. doi: 10.3389/fphy.2015.00087
Received: 26 June 2015; Accepted: 26 October 2015;
Published: 17 November 2015.
Edited by:
Taha Yasseri, University of Oxford, UKReviewed by:
Boris Podobnik, University of Rijeka, CroatiaMarija Mitrovic Dankulov, Institute of Physics Belgrade, Serbia
Copyright © 2015 Tanase, Garcia, Garas and Schweitzer. This is an open-access article distributed under the terms of the Creative Commons Attribution License (CC BY). The use, distribution or reproduction in other forums is permitted, provided the original author(s) or licensor are credited and that the original publication in this journal is cited, in accordance with accepted academic practice. No use, distribution or reproduction is permitted which does not comply with these terms.
*Correspondence: David Garcia, dgarcia@ethz.ch