Electric Alignment of Plate Shaped Clay Aggregates in Oils
 René C. Castberg
 Zbigniew J. Rozynek
 Eirik G. Flekkøy
 Knut J. Måløy
- 1Department of Physics, University of Oslo, Oslo, Norway
- 2Faculty of Physics, Institute of Acoustics, Adam Mickiewicz University, Poznań, Poland
- 3Department of Physics, Norwegian University of Science and Technology, Trondheim, Norway
We experimentally investigate the rotation of plate shaped aggregates of clay mineral particles immersed in silicone oil. The rotation is induced by an external electric field. The rotation time is measured as a function of the following parameters: electric field strength, the plate geometry (length and width) and the dielectric properties of the plates. We find that the plates always align with their longest axis parallel to the direction of the electric field (E), independently of the arrangement of individual clay mineral particles within the plate. The rotation time is found to scale as E−2 and is proportional to the viscosity (η), which coincides well with a model that describes orientation of dipoles in electric fields. As the length of the plate is increased we quantify a difference between the longitudinal and transverse polarizability. Finally, we show that moist plates align faster. We attribute this to the change of the dielectric properties of the plate due to the presence of water.
1. Introduction
Electrorheological fluids are able to change their material properties on application of an external electric field. They are made from a dispersed material, in our case a clay mineral, and a dispersing fluid, typically this is a non-conductive and non-polar liquid, such as silicone oil used here. In the presence of an electric field a dispersion of clay mineral particles in oil behaves as a shear thinning non-Newtonian fluid that exhibits a yield stress at a shear rate approaching zero [1–4]. The clay mineral particles align themselves with the electric field, undergoing interactions between each other which eventually leads to the formation of dipolar chains that span the gap between the electrodes. This interaction can cause the viscosity to drastically change, typically orders of magnitude. Electrorheological fluids have found many uses where a large change in viscosity is desirable, for example brakes, clutches and dampers [5–7]. An electrorheological fluid that is able to adapt its viscosity quickly would be able to quickly respond to external changing conditions. Previous studies have mostly concentrated on how bulk properties, like the viscosity and shear stress, of the electrorheological fluid change due to the particle properties [8–10]. Here we study the initial steps of this process, where a plate aligns itself to the field. The initial rotation may take a couple of milliseconds for powdered sodium fluorohectorite (Na-FH) [11]. This is short in comparison with the time needed for the formation of long particle chains that often span the entire gap between electrodes. The time of formation of such chains is often a few order of magnitude higher [1, 12, 13]. By studying individual clay mineral plates we wish to determine the factors influencing the alignment time. Aggregate samples are prepared and used in experiments such that we are able to study the initial alignment process in a reproducible manner. The present article is a comprehensive study with new results and interpretations based on preliminary studies published previously [14].
2. Materials and Methods
In this paper we study a synthetic 2:1 clay mineral, sodium fluorohectorite (Na-FH) with the chemical formula Na1.2+[(Mg4.8Li1.2) F4Si8O20]1.2−, suspended in silicone oil. The clay mineral powder was purchased from Corning Inc., New York; and the Na-FH clay minerals used here come from the same batch of materials as reported and characterized by Hansen et al. [15], and references therein. The samples were prepared as rectangular shaped plates made out of many individual clay mineral particles.
2.1. Sample Preparation
The plates were made as follows: a grain of the clay mineral powder is assembled from many single particles (we refer to “a single particle” as a particle composed of stacked crystallographic sheets). Typically, the single particles that form the grain are oriented in different directions. In order to form a plate-shaped clay mineral aggregate composed of large number of single particles oriented in one direction we performed the following steps: We dispersed clay powder in distilled water, ultrasonicated (10 min) and mechanically shook (2 h) to disassemble into single clay mineral particles. The dispersion was then transferred into a Petri dish and left covered to dry at room temperature. While sedimenting and drying the particles align (on average) with their stacking direction along the direction of gravity [16]. We controlled the thickness of the dry sheet by adding an adequate amount of the dispersion to the Petri dish. After drying for 3 days the thickness obtained was 70 ± 2 μm. As the water evaporates the Na-FH single particles will settle, lying flat on top of one another (Figure 1A).The final plate-shaped clay aggregates composed of single clay mineral particles, orientated (on average) with their stacking direction perpendicular to the longest axis of the aggregate (Figure 1A), are cut out from the dry sheet (Figure 1C). Whereas, for the rectangular-shape aggregates of clay mineral particles with their stacking direction parallel to the direction of the longest axis of the aggregate (Figure 1B) are made by stacking approximately 64 layers of sample (a) on top of each other and slicing a strip of the plate to obtain the desired shape.
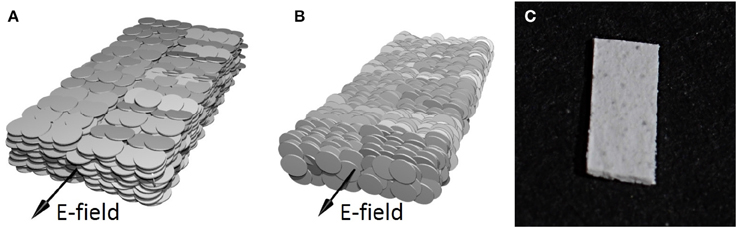
Figure 1. A sketch of a plate made out of particles aligned in a stacking direction (A) perpendicular and (B) parallel, to the direction of the longest axis. In the presence of electric field the plate-shaped clay aggregate undergoes electro-orientation. The final orientation of the plate is parallel to the field, irrespective of the arrangement of the individual clay mineral particles within the aggregated plate. Black arrows show the direction of the electric field. (C) Photograph of a plate with length, width and thickness of ≈5.0 × 2.5 × 0.07 mm.
2.2. Experimental Procedure
The experimental set-up is sketched in Figure 2. The plate orientation and motion is observed using a microscope. The plate is immersed in silicone oil (Sigma Aldrich, 1000 cSt). A standard 10 × 10 × 50 mm transparent cuvette made from PMMA was used as a sample cell. Two copper electrodes are attached to the inside of the cuvette, each of which is connected to a high voltage amplifier (Trek Model 2220). Before each measurement, the plate is aligned using a metal needle such that its longest axis is perpendicular to the electric field, and its surface normal to the camera view. Rotation time in comparison to sedimentation time is insignificant, and hence does not influence the measurement. When the external electric field is applied across the copper electrodes, the plate will rotate to align itself with the field.
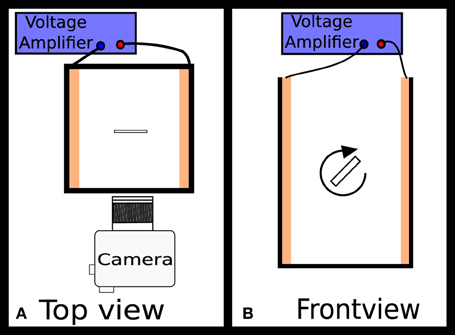
Figure 2. A sketch of the experimental setup. In panel (A) the plate is in the center of the cuvette and will rotate through the plane of the diagram, while in (B) it rotates in the plane of the diagram. The electrode separation is 9 mm.
After a full rotation the plate is brought back to (approximately) the same initial location in the cell and aligned as above and the experiment is repeated.
As these experiments are performed in an AC field, with an oscillation period that is at least 100 times shorter than the typical alignment period, we do not expect any permanent dipole to effect the measurements. Experimental observations of frequencies on the order of 1 Hz only showed velocity oscillations consistent with the applied sinusoidal waveform and showed no tendency to change the rotation direction as we would expect from a permanent dipole.
2.3. Plate Ratio
In order to access the effects of geometrical changes (shape of particle), a plate, with perpendicular stacking, was consecutively trimmed such that the width:length ratio is different for each set of measurements. We choose to trim a plate rather than make new ones as this way we guarantee the same thickness and length. The plate is trimmed by placing it between two glass slides and slicing off a thin sliver along the long edge with a scalpel. The measurement is then made using the method described above.
2.4. Electric Field Magnitude
We also wished to assess the effect of the electric field, using two plates, 7 and 8 (Table 1), the magnitude of the electric field is adjusted from 50 to 293 V/mm and the method outlined above is performed at each field strength.
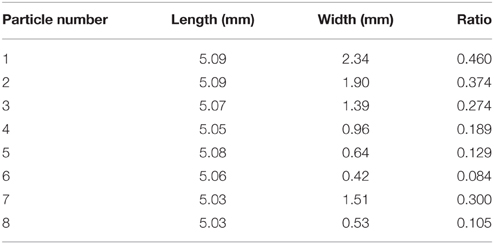
Table 1. Particle sizes of the perpendicularly stacked particles used in rotational experiments, thickness = 70 ± 2 μm, ratio given as width/length.
2.5. Effects of Water
In order to access the effect of the presence of water, a sample is kept in a 110 °C oven for 3 days. Hot (110 °C) silicone oil is poured over the plate before being removed from the oven, ensuring limited exposure to the humid air. The sample cuvette is then cooled as quickly as possible using room temperature metal plates held against the cuvette allowing the initial measurements to be performed soon after the removal from the oven. Upon removal from the oven the plate and oil will be exposed to lab conditions and thus the humid air, we expect over time this humidity will make its way into the clay mineral plate aggregate via the suspending oil.
The plate aggregates are placed in the cuvette as in the previous experiments and measurements made.
2.6. Analysis
The video of the plate rotating is split into its respective frames and a threshold is applied to the image such that the plate can be easily differentiated from the background. Each frame is then analyzed and the angle of the plate with respect to the electrodes is estimated. We subsequently calculated the rotation rate of the particle, which is defined in Equation (1). The rotation rate is related to both the electric field torque and the hydrodynamic drag. Since the latter depends on the angular velocity, which is related to the initial angle (θ0), we had to assure the same starting conditions in all experiments. It was challenging to pre-align the plate identically (with respect to θ0) before each measurement. However, we tackled the problem by adjusting the starting point of the rotation while fitting the data (see explanation further on in the text).
At low Reynolds number the torque due to the electric field and hydrodynamic forces will balance each other (see Appendix A for details) leading to:
Where θ is the angle between the longest axis of the plate and the electric field, is the angular velocity, E is the strength of the electric field, ξ is the rotational friction constant which is proportional to the viscosity η, and Δα is the difference in the longitudinal and transverse polarizability (Δα = α‖ − α⊥) of the particle. Solving Equation (1), for tanθ we obtain:
Where τ is given as:
and t is the elapsed time, and θ0 is the angle with respect to the field of the particle at t = t0.
Using two fitting parameters (t0, τ) on Equation (2) we can fit the experimental data using:
Parameter t0 shifts the curve on the horizontal time axis and is used to adjust the starting point of the rotation and τ adjusts the width and slope of the curve. When plotting the curves such that they all intersect at , multiple intersecting curves can thus be compared.
We are free to choose the zero time and can therefore set the time at which the plate is at to 0, thus shifting the curve. A typical fit is shown in Figure 3. Usually the residuals lie within 1° and its distribution is similar for all the datasets and plate rotations.
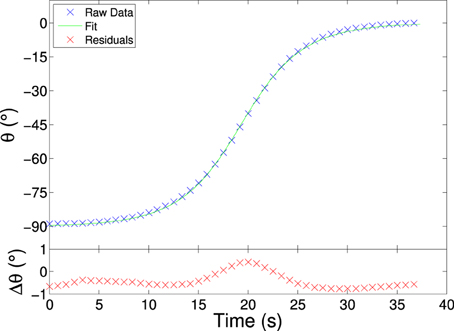
Figure 3. The upper plot shows measurement points (blue) and data fit (green) for an electro-rotating plate. The lower plot shows the residuals (red) after the fit. The magnitude and distribution of the residual points is similar for all the data-sets and plate ratios. Particle length is 5.10 mm and width is 0.55 mm, a ratio of 7.7. The distribution of the residual is typical for all the data-sets and plate ratios, with a slight underestimation initially and at the end and a slight overestimation at the middle of the rotation. For clarity only every 4th data point is plotted. E = 100 V/mm, 50 Hz.
For plates with their stacking direction parallel (Figure 1B) to the field we saw no difference in the dynamics of the rotation. We are unable to make a comparison of the rotation rate due to the size differences between these and the perpendicularly stacked plates. Due to the way the plates are stacked they become quite fragile and hence we are unable to trim them to the same dimensions as the perpendicularly stacked plate Figure 1A.
3. Results and Discussions
3.1. Plate Ratio
The plate ratio is varied as described in Section 2.3 and analyzed. The results from these experiments are shown in Figures 4, 5.
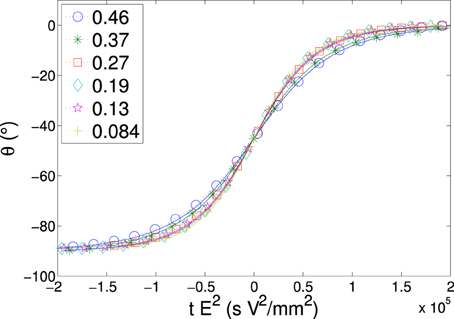
Figure 4. Rotation angle vs. scaled time for different width:length ratios (listed in the legend) for a perpendicularly stacked plate. Each data set is centered when the plate has rotated 45°. We fit the data (solid lines) with a function described in Equation (4), each data series consists of a single measurement for a plate of length 5.10 mm, and initial width of 2.34 mm before the plate is trimmed. E = 100 V/mm, 50 Hz.
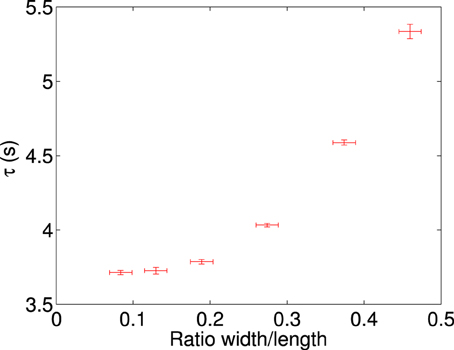
Figure 5. Characteristic rotation time vs. the ratio of width/length for a perpendicularly stacked plate, plotting the mean value along with the standard deviation of the mean of the dataset against the ratio along with an estimate of the error. Each data point represents a minimum of 22 measurements, the plate has an initial size of 5.10 × 2.34 mm, and then successively trimmed in the width dimension to obtain the ratios above. Data is recorded at 100 V/mm at 50 Hz.
Figure 4 shows a typical data series for single measurements of a plate rotating, where rotation angle is plotted as a function of time for each of the different ratios (see Table 1 for the particle sizes used). We observe that as the ratio is decreased, thus producing a more needle-like plate, the curve becomes steeper. The average characteristic rotation time for alignment of a plate is shown in Figure 5, where each data point represents at least 22 independent measurements. We can see that the effect of changing the ratio becomes quite substantial and there is a sharp increase in the rotation time, starting from a plateau at low ratio values. This may correspond to either an increase of magnitude of the dipole moment or a decrease in the friction coefficient or both. After removing the effect of the hydrodynamic drag (for details see Appendix 20), we can still clearly see the shape dependency on the time of rotation. In Figure 6 we plot the difference in the polarizability (Δα) vs. the plate aspect ratio (the correction for the hydrodynamic drag was already included).
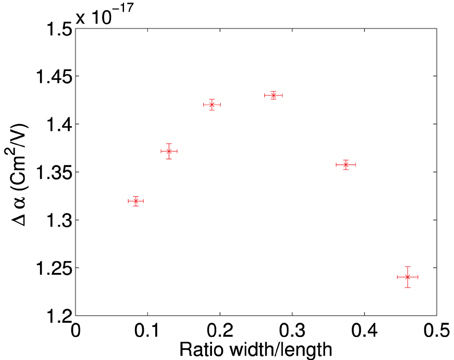
Figure 6. Δα plotted vs. the ratio of width/length for a perpendicularly stacked plate, plotting the mean value along with the standard deviation of the mean of the dataset against the ratio along with an estimate of the error. Each data point represents a minimum of 22 measurements, the plate had an initial size of 5.10 × 2.34 mm, and then successively trimmed in the width dimension to obtain the ratios above. Data is recorded at 100 V/mm at 50 Hz.
In Na-FH clay there is, order of magnitude, 1 unit electron charge per nm3 of material [17]. Here, the typical plate aggregates have a volume of order of magnitude 106 × 107 × 107nm3 = 1020 nm3, giving a total order of magnitude 10 C charge associated with physically bound charge compensating ions in our plate aggregate. In the extreme event that the induced polarization in our plate aggregates involves physical transportation of all charge compensating cations to the edge of the sample, this would thus correspond to an induced dipole of order of magnitude 0.1 Cm (our samples are in the centimeter range), which at an applied field of about 100 V/mm would give an order of magnitude polarizability Δα of about 10−6 Cm2∕V. This is 11 orders of magnitude larger than our observed Δα. Thus, as we expect, our observations are consistent with plate aggregate polarizability due to local charge displacements on the nanoscale rather than on the sample scale. This is also strongly supported by the observation that parallel stacked plates show the same order of magnitude rotation times as the perpendicularly stacked ones, i.e., that the polarization is due to clay mineral particle surface charges rather than due to charges that are intercalated in the clay mineral nanostructure.
3.2. Electric Field Magnitude
The electric field is varied and the experiments are performed as described in the Section 2.4. The analyzed results for these measurements are shown in Figure 7A. As the voltage is increased the rotation rate increases, giving a steeper curve. We can see a very simple relationship between the applied field and rotation time. Scaling the time with E2 we obtain a data collapse as can be seen in Figure 7B. Thus, we can conclude, the characteristic rotation time scales as E−2.
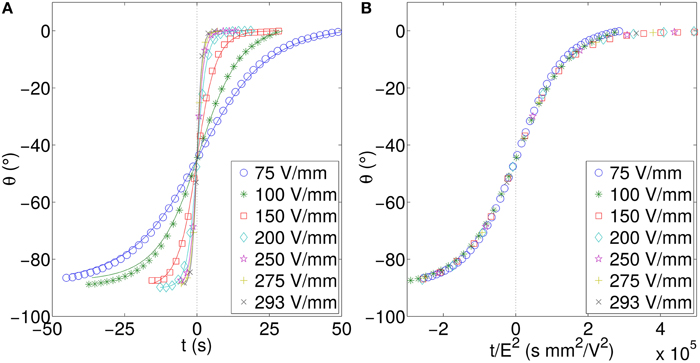
Figure 7. (A) Rotation angle vs. time and (B) data collapse using scaled time for a plate of length 5.03 mm, and width 1.51 mm, corresponding to a length:width ratio of 3.2. For the sake of clarity the number of data points has been reduced. All data presented are for the perpendicularly stacked particle.
This is as expected and confirms the model including the E−2 dependency on the characteristic rotation time. Similar behavior is found when electro-orientating a plate with a different width:length ratio. Figure 8 shows an increased plate ratio as compared to Figure 7.
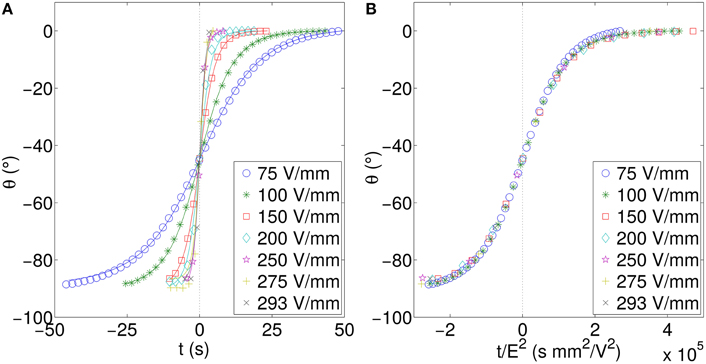
Figure 8. (A) Rotation angle vs. time and (B) data collapse using scaled time for a plate of length 5.03 mm, and width 0.53 mm, corresponding to a length:width ratio of 9.5. This is the same plate as in 7 but trimmed to increase the length/width ratio. All data presented are for the perpendicularly stacked particle.
3.3. Effects of water
The effects of hydration on the rotation time were measured as described in Section 2.5. Figure 9 shows the characteristic rotation time as a function of the aging time. The rotation time is the highest for the measurement taken just after the sample was removed from the oven. The magnitude of the characteristic rotation time decreased from around 9.7 to 8.2 s. We see two possible explanation to this, this is either due to the increased number of dipoles, or possibly due to the enhanced polarizability because of the local displacement of charge compensating cations.
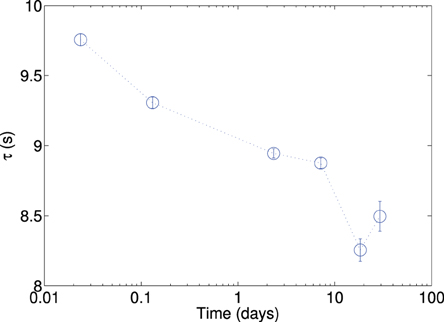
Figure 9. Characteristic rotation time, plotted against aging of plate aggregate, initially it was heated to 110 °C for 3 days, and then transferred to a room temperature vial and allowed to cool quickly. Measurements were made over the next 30 days (immediately, 3 h, 2 days, 7 days, 18 days and 30 days after initially cooling the sample.) The plots shown are for a minimum of 12 measurements per data point, and with a single initial orientation (see discussion in article text). The data presented are for the perpendicularly stacked particle.
In Na-FH the polar water molecules will intercalate the clay mineral nanostructure [18–20], in addition to adhering to the outer clay mineral particle surfaces.
3.4. Concluding Remarks
In presence of an external electric field, clay particle aggregates undergo electro-orientation due to the induced electric torque. The magnitude of the electric torque is related to the strength of the electric dipoles induced on the clay particle aggregates. Since the rate of rotation of the plate is related to both the magnitude of the induced electric torque and the hydrodynamic drag, by ruling out the latter factor we were able to measure the difference between the longitudinal and vertical polarizability Δα. The small value of Δα measured in our experiments is consistent with plate aggregate polarizability of bounded charge displacements on the nanoscale rather than on the sample scale. This is also supported by the observation that the parallel stacked plates show approximately the same characteristic rotation time as the perpendicular stacked ones. We also observed the influence of water molecules on the characteristic rotation time, i.e., as the plate aggregate is hydrated the rate of rotation increases substantially, which indicates that water serves to increase the polarizability, and thus increases the torque due to the electric field. The geometry of a plate-shaped clay aggregate affects the polarizability. Interestingly, the magnitude of the polarizability has its peak value for plates with length-to-width ratio of around 0.25. We also validated the theoretical predictions on both electric field strength and viscosity dependency on the rate of rotation (Appendix B). The measurements showed that the characteristic rotation time scale as E−2 and η.
Author Contributions
RC was involvement in all performed experiments, all the data analysis and presentation of results, and writing, editing and Corrections of the article and involved in the discussion of all the results. ZR was involvement in some of the performed experiments, some of the data analysis and presentation of results, and writing, editing and corrections of the article and in the discussion of all the results. KM was involvement in some of the performed experiments, some of the data analysis and presentation of results, and writing, editing and corrections of the article and in the discussion of all the results. EF was involvement in the data analysis and presentation of results, and editing and corrections of the article and in the discussion of all the results.
Conflict of Interest Statement
The authors declare that the research was conducted in the absence of any commercial or financial relationships that could be construed as a potential conflict of interest.
Acknowledgments
The authors wish to thank Jon Otto Fossum, and Paul Dommersnes for their useful comments and discussions. This work was supported by the Research Council of Norway through the Nanomat program, project number 182075 and the FRINAT program, project number: 171300. ZR acknowledges financial support from the Foundation for Polish Science through Homing Plus programme; and from the National Science Centre through FUGA4 programme (DEC-2015/16/S/ST3/00470).
References
1. Hemmen H, Alme LR, Fossum JO, Meheust Y. X-ray studies of interlayer water absorption and mesoporous water transport in a weakly hydrated clay. Phys Rev E (2010) 82:036315. doi: 10.1103/PhysRevE.82.036315
2. Parmar KPS, Méheust Y, Schjelderupsen B, Fossum JO. Electrorheological suspensions of laponite in oil: rheometry studies. Langmuir (2008) 24:1814–22. doi: 10.1021/la702989u
3. Méheust Y, Parmar KPS, Schjelderupsen B, Fossum JO. The electrorheology of suspensions of Na-fluorohectorite clay in silicone oil. J Rheol. (2011) 55:809–33. doi: 10.1122/1.3579189
4. Rozynek Z, Zacher T, Janek M, Čaplovičová, M, Fossum JO. Electric-field-induced structuring and rheological properties of kaolinite and halloysite. Appl Clay Sci. (2013) 77–78:1–9. doi: 10.1016/j.clay.2013.03.014
5. Furusho J, Sakaguchi M, Takesue N, Koyanagi K. Development of ER brake and its application to passive force display. J Intell Mater Syst Struct. (2002) 13:425–9. doi: 10.1106/104538902030340
6. Madeja J, Kesy Z, Kesy A. Application of electrorheological fluid in a hydrodynamic clutch. Smart Mater Struct. (2011) 20:105005. doi: 10.1088/0964-1726/20/10/105005
7. Petek NK, Romstadt DJ, Lizell MB, Weyenberg TR. Demonstration of an automotive semi-active suspension using electrorheological fluid. In: SAE Publication SP 1074 New Developments in Vehicle Dynamics, Simulation, and Suspension Systems. Warrendale: SAE Technical Paper 950586 (1995). Available online at: http://papers.sae.org/950586/
8. Qi Y, Wen W. Influences of geometry of particles on electrorheological fluids. J Phys D Appl Phys. (2002) 35:2231. doi: 10.1088/0022-3727/35/17/322
9. Hao T, Kawai A, Ikazaki F. Mechanism of the electrorheological effect: evidence from the conductive, dielectric, and surface characteristics of water-free electrorheological fluids. Langmuir (1998) 14:1256–62. doi: 10.1021/la971062e
10. Dürrschmidt T, Hoffmann H. Electrorheological effects in suspensions of hydrophobically modified saponite. Coll Surf A Physicochem Eng Asp. (1999) 156:257–69.
11. Fossum JO, Méheust Y, Parmar KPS, Knudsen KD, Måløy KJ, Fonseca DM. Intercalation-enhanced electric polarization and chain formation of nano-layered particles. Europhys Lett. (2006) 74:438–44. doi: 10.1209/epl/i2005-10541-0
12. Wang B, Zhou M, Rozynek Z, Fossum JO. Electrorheological properties of organically modified nanolayered laponite: influence of intercalation, adsorption and wettability. J Mater Chem. (2009) 19:1816–28. doi: 10.1039/b818502f
13. Rozynek Z, Knudsen KD, Fossum JO, Méheust Y, Wang B, Zhou M. Electric field induced structuring in clay-oil suspensions: new insights from WAXS, SEM, leak current, dielectric permittivity, and rheometry. J Phys Condens Mat. (2008) 22:324104. doi: 10.1088/0953-8984/22/32/324104
14. Castberg RC, Rozynek Z, Fossum JO, Måløy KJ, Dommersnes P, Flekkøy EG. Clay alignment in electric fieldS. Revista Cubana de Fisica. (2012) 29:17. Available online at: http://rcf.fisica.uh.cu/index.php/en/2012-06-13-19-06-50/vol-29-no-1e-2012?id=41
15. Hansen EL, Hemmen H, Fonseca DM, Coutant C, Knudsen KD, Plivelic TS, et al. Swelling transition of a clay induced by heating. Sci Rep. (2012) 2:618. doi: 10.1038/srep00618
16. DiMasi E, Fossum JO, Gog T, Venkataraman C. Orientational order in gravity dispersed clay colloids: A synchrotron x-ray scattering study of Na fluorohectorite suspensions. Phys Rev E (2001) 64:061704. doi: 10.1103/PhysRevE.64.061704
17. Kaviratna P, Pinnavaia TJ, Schroeder P. Dielectric properties of smectite clays. J Phys Chem Solids (1996) 57:1897–906. doi: 10.1016/S0022-3697(96)00076-5
18. Da Silva G, Fossum J, DiMasi E, Måløy K. Hydration transitions in a nanolayered synthetic silicate: A synchrotron x-ray scattering study. Phys Rev B (2003) 67:094114. doi: 10.1103/PhysRevB.67.094114
19. Knudsen KD, Fossum JO, Helgesen G, Haakestad MW. Small-angle neutron scattering from a nano-layered synthetic silicate. Phys B Condensed Matter (2004) 352:247–58. doi: 10.1016/j.physb.2004.07.018
20. da Silva GJ, Fossum JO, DiMasi E, Måløy KJ, Lutnaes SB. Synchrotron x-ray scattering studies of water intercalation in a layered synthetic silicate. Phys Rev E (2002) 66:011303. doi: 10.1103/PhysRevE.66.011303
21. Doi M, Edwards SF. The Theory of Polymer Dynamics. New York, NY: The Clarendon Press; Oxford University Press (1986).
Appendix A
Theoretical considerations
The rotating plate aggregate will experience two torques, one by the electric field and the other from the viscous drag with the silicone oil. We can attempt to explain the behavior of the plate aggregates by observing how the hydrodynamic drag and the electric field interact to impose a rotational torque on the plate aggregates. As the only two forces acting on the system are the viscous drag and electric field we expect the total torque to be:
The torque produced by the electric field is a function of the dipole moment (p) and the electric field (E):
The dipole moment consists of two parts an induced dipole and a permanent dipole. The permanent dipole will always be fixed with respect to the plate aggregate orientation, whereas for the induced dipole of a needle-like plate aggregate it will always be in the direction of the field. If on the other hand the plate aggregate is wide, the induced dipole will be a function of a parallel and perpendicular contributions [21].
which can then be written in terms of the polarizability (α):
Where we have assumed that the plates consists of an isotropic dielectric medium.
Inserting this into Equation (A2),
where
and inserting an expression for the hydrodynamic drag into Equation (A1) and using Equation (A5) we can write:
TD was given by [21], where ξ is the rotational friction constant and is proportional to viscosity (η) and is related to the drag on the plate aggregate, θ and are the plates angle and its derivative the angular velocity and is a unit vector in the direction the plate aggregate is pointed. As we are operating in a low Reynolds number regime, (Re < 0.01) (For L = 2.5 mm, tmin, 90° = 10 s, Re = 5.85·10−5), the inertia can be set to zero.
where τ is This can be solved, resulting in;
which gives:
Solving for tan θ gives:
Resulting in:
where:
and ξ is a function of the drag, and therefore we expect it to be proportional to the viscosity (η) (Appendix B).
From this we can see that:
Appendix B
Viscosity
In order to test the viscosity dependency on the time of rotation we immersed a plate in silicone oil, performing the experiments at different viscosities. Figure A1 shows the characteristic rotation time for a plate rotating in an AC electric field (100 V/mm, 50 Hz) immersed in silicone oil of four different viscosities. As expected from Equation (3) the dependence is linear.
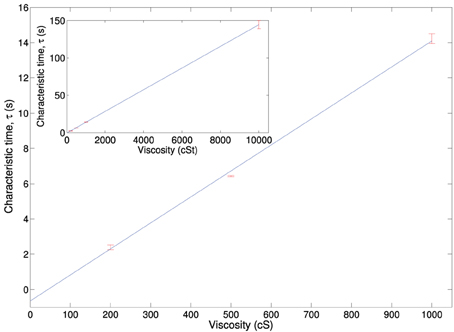
Figure A1. Characteristic rotation time for a plate rotating in an electric field in different viscosity silicone oils, inset shows a scaling up to 10,000 cSt silicone oil.
Appendix C
Plate Drag Analysis
In order to get an idea on what size the size of the frictional drag constant was and how it would change during the experiment we measured the rotation of aluminium plates in a high viscosity fluid (Glycerine). The experimental setup is shown in Figure A2. The plate was varied in both length and width. In Figures A3–A5 there are a couple of example plots for the process, each plate is rotated with a torque applied by a weight falling in a gravitational field. This is plotted against the angular velocity in Figures A3–A5. We assume a constant torque from the falling weight, and a constant drag after it has reached its equilibrium velocity. Assuming we have a constant velocity, for each plate size, we can write the following expression:
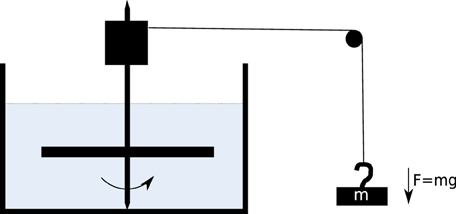
Figure A2. Diagram of setup for measuring plate drag, the mass (m) falls in a gravitational field, turning the barrel at the top of the spindle. This in turn rotates the aluminium plate which is submerged and feels the drag from the glycerine.
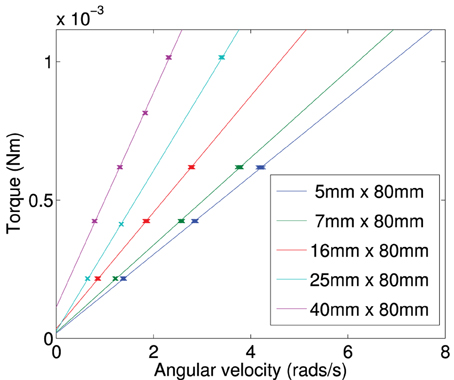
Figure A3. Calculated torque plotted against terminal angular velocity for a plate of constant length (80 mm) and varied width (5–40 mm).
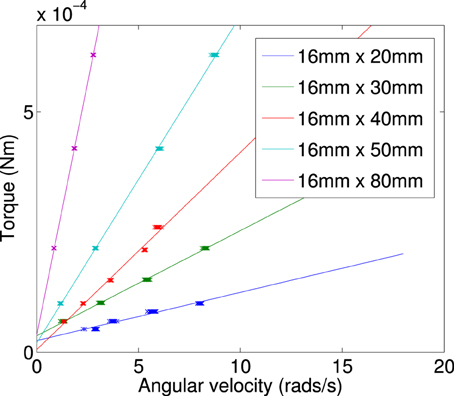
Figure A4. Calculated torque plotted against terminal angular velocity for a plate of constant width (5 mm) and varied length (20–80 mm).
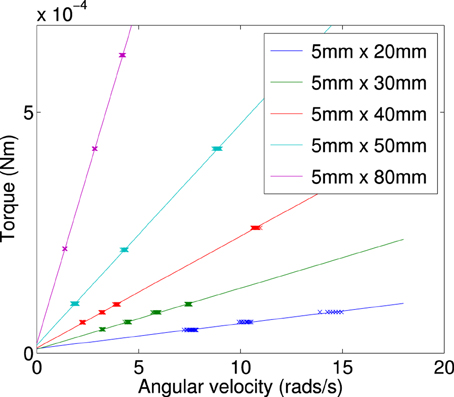
Figure A5. Calculated torque plotted against terminal angular velocity for a plate of constant width (16 mm) and varied length (20–80 mm).
Where F is the friction on the system and ξ is frictional drag constant on the plate, m is the mass of the falling object, g is gravity and r is the radius of the plate.
By finding the gradient for each of the curves of a specific length, we find the frictional drag constant(ξ) for each width of particle. Plotting the gradient for different widths we obtain the data shown in Figure A6. From this plot we can determine the frictional drag constant of any width (b) for a given length (a). Taking the gradients and intercepts for a given length of plate and plotting them (Figures A7, A8) we can find the parameter for a new width (b). Plotting this will allow us to determine the frictional drag constant for a particle 5.1 mm long and of varying width. This can be seen in Equation (A16).
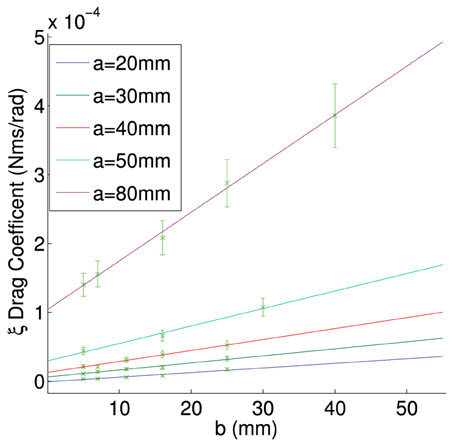
Figure A6. Frictional drag constant plotted as a function of width (b) for different length plates.
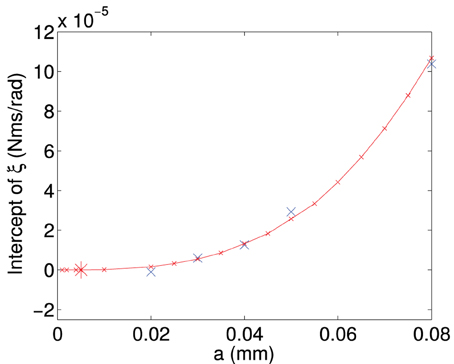
Figure A7. Figure showing the intercept of the frictional drag constant (ξ) plotted as a function of the length (a) of the plate. Intercept values are obtained from the data in Figure A6.
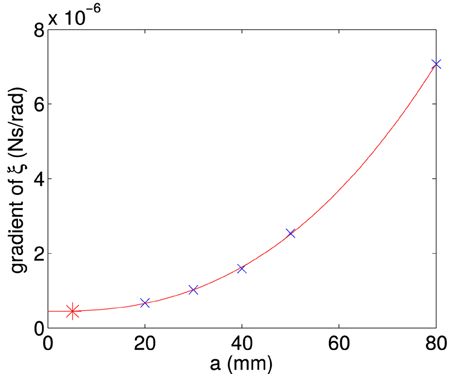
Figure A8. Gradient of the frictional drag constant curves (ξ) plotted as a function of the plate length (a). The gradient of the curves were obtained from data in Figure A6.
Using Figure A7 we can determine the intercept and Figure A8 we can find the slope and we can obtain the equation describing the frictional drag constant in our area of interest, i.e., a particle 5.1 mm long and of varying width.
Keywords: electrorheological fluid, clay aggregates, electric field alignment, polarizability
Citation: Castberg RC, Rozynek ZJ, Flekkøy EG and Måløy KJ (2016) Electric Alignment of Plate Shaped Clay Aggregates in Oils. Front. Phys. 4:1. doi: 10.3389/fphy.2016.00001
Received: 16 November 2015; Accepted: 04 January 2016;
Published: 20 January 2016.
Edited by:
Gang Zhang, Institute of High Performance Computing, A*Star, SingaporeReviewed by:
Jiebin Peng, National University of Singapore, SingaporeGuofeng Xie, Xiangtan University, China
Copyright © 2016 Castberg, Rozynek, Flekkøy and Måløy. This is an open-access article distributed under the terms of the Creative Commons Attribution License (CC BY). The use, distribution or reproduction in other forums is permitted, provided the original author(s) or licensor are credited and that the original publication in this journal is cited, in accordance with accepted academic practice. No use, distribution or reproduction is permitted which does not comply with these terms.
*Correspondence: René C. Castberg, rene@castberg.org;
Knut J. Måløy, k.j.maloy@fys.uio.no