How Stress and Temperature Conditions Affect Rock-Fluid Chemistry and Mechanical Deformation
 Anders Nermoen1,2*
  Reidar I. Korsnes2,3
  Olav Aursjø1
  Merete V. Madland2,3
  Trygve A. C. Kjørslevik3 Geir Østensen3
- 1International Research Institute of Stavanger, Stavanger, Norway
- 2The National IOR Centre of Norway, University of Stavanger, Stavanger, Norway
- 3Institute of Petroleum Sciences, University of Stavanger, Stavanger, Norway
We report the results from a series of chalk flow-through-compaction experiments performed at three effective stresses (0.5, 3.5, and 12.3 MPa) and two temperatures (92 and 130°C). The results show that both stress and temperature are important to both chemical alteration and mechanical deformation. The experiments were conducted on cores drilled from the same block of outcrop chalks from the Obourg quarry within the Saint Vast formation (Mons, Belgium). The pore pressure was kept at 0.7 MPa for all experiments with a continuous flow of 0.219 M MgCl2 brine at a constant flow rate; 1 original pore volume (PV) per day. The experiments have been performed in tri-axial cells with independent control of the external stress (hydraulic pressure in the confining oil), pore pressure, temperature, and the injected flow rate. Each experiment consists of two phases; a loading phase where stress-strain dependencies are investigated (approximately 2 days), and a creep phase that lasts for 150–160 days. During creep, the axial deformation was logged, and the effluent samples were collected for ion chromatography analyses. Any difference between the injected and produced water chemistry gives insight into the rock-fluid interactions that occur during flow through the core. The observed effluent concentration shows a reduction in Mg2+, while the Ca2+ concentration is increased. This, together with SEM-EDS analysis, indicates that magnesium-bearing mineral phases are precipitated leading to dissolution of calcite. This is in-line with other flow-through experiments reported earlier. The observed dissolution and precipitation are sensitive to the effective stress and test temperature. Higher stress and temperature lead to increased Mg2+ and Ca2+ concentration changes. The observed strain can be partitioned additively into a mechanical and chemical driven component.
Introduction
The study of how the physicochemical interplay between fluids and rocks alters the mechanical behavior of porous materials has enhanced the understanding of long-term creep behavior of crustal rocks (e.g., [1–3]), and has found industrial applications in e.g., CO2 sequestration, ore deposits, hydrology, pharmaceutical industries [4] as well as hydrocarbon migration, petroleum production, and reservoir engineering.
The mechanical integrity of reservoir chalks during seawater injection has been of significant interest to the scientific and industrial communities since the seabed subsidence and reservoir deformation was discovered in the Ekofisk (chalk) field in the 1980s [5]. Other examples include the Weyburn field in Canada that has undergone extensive monitoring during compaction (see e.g., [6] for a description). The primary production phase during hydrocarbon extraction is recognized by fluid over-pressure release (i.e., the pressure in addition to the hydrostatic stress). From the Terzaghi principle [7], expanded by the Biot theory [8, 9], the effective stress is given by the externally imposed load minus a fraction α (the Biot coefficient) of the pore pressure. In reservoirs, the external load is given by the principal stresses, typically related to the weight of the overburden rocks (vertical direction), and the horizontal stresses originating from tectonic processes and Poisson ratio. At Ekofisk, over-pressure depletion led to reservoir compaction which induced overburden deformation and seafloor subsidence which led to detrimental effects on the production equipment and to the platforms resting on the seafloor. In addition to that, when the pressure declined this led to significant reduction in the production rates during the late 1970's and early 1980's (see e.g., [10]). In the secondary production phase, recognized by seawater injection, pressure support was provided to maintain the pressure gradient through the oil-field and to reduce the effective stresses and corresponding compaction to pre-production times. Seawater injection has until now been a great financial success because, in addition to maintain a pressure gradient and to reduce the effective stress, the seawater imbibes from fractures into water-wet chalk matrix where it displaces the oil, an effect leading to increased oil production [11, 12]. However, for chalks, time-dependent creep effects are significant. At Ekofisk, for example, since the seawater injection started in the mid-1980s it took several years before the reservoir pressure and stress conditions were increased to pre-production level. Despite the re-pressurization, the compaction prevailed at approximately 1/3 of the peak compaction rate of 35 cm/year in the regions in contact with the injected seawater, an effect termed water weakening [13–15]. The prevailing compaction and seafloor subsidence after re-pressurization indicate that not only stress and pressure effects drive deformation, but also the chemical nature of the pore fluid.
Specially designed experiments have shown how the pore fluid composition (gases, water/brines, and oils) alters different aspects of the mechanical strength. For example, at temperatures above 90°C, injecting brines containing sulfate ions significantly reduces the elastic bulk modulus during loading (1 day interval) and while the magnesium ion enhances the rate of compaction during creep (10–100 days interval; see e.g., [16] and references there-in). In addition, the yield stresses, at which irreversible deformation occurs during stress-strain load experiments, are significantly altered by the chemistry of the pore fluids [16].
As such, the exact way in which pore fluid chemistry impacts chalk mechanics is multi-faceted, as both long-term and short-term chemical processes may occur simultaneously. For example adsorption processes occur at short time-intervals since it may occur within 1–2 pore volumes injected, while dissolution/precipitation is time-dependent occurring during injection for hundreds of pore volumes [17]. Rock-fluid interactions estimated from equilibrium calculations become increasingly important with temperatures above 100°C, reported in e.g., [18–20]. At these conditions they showed that when seawater is injected into chalk reservoirs it becomes supersaturated with respect to magnesium bearing minerals, e.g., dolomite, magnesite, huntite, and brucite. In addition, precipitation of the Mg-bearing carbonate minerals drives dissolution of calcium-carbonate, which subsequently leads to an excess amount of Ca-ions in the aqueous solution. These excess ions bind to the sulfate ions in the seawater to form calcium-sulfate, such as anhydrite. Chalks have a varying degree of CaCO3-purity. The impurity is often associated with silicate-bearing minerals such as quartz and various forms of clay. When dissolution of pre-existing quartz is taken into account, the geochemical calculations show that magnesium-bearing silicates such as tremolite and talc are also formed. These predictions have been supported by direct XRD and SEM observations that were published recently by Zimmermann et al. [21]. As such, calculations and direct rock-observations have shown that chalk is prone to chemical rock-fluid reactions at high temperatures [17].
The rate of deformation with time is linked to mineral alteration (see e.g., [17]). Any dissolution related to solid-volume changes may affect the bulk volume directly. And, in addition, changes to grain volumes increase the probability for the grain to “un-lock” from its current configuration and shift into pores nearby, effectively reducing the pore space. Since these mineral reactions, expected when MgCl2 are flooded through chalks, are associated with density increase, the total volumetric deformation can be partitioned into a solid volume and a pore volume component. Depending on how the solid volume and pore volume changes, the porosity may change in a non-intuitive way [17].
It is the chemical potential, related to the Gibbs free energy, which governs the chemical stability of minerals, with temperature and pressure as state variables. In granular systems, where there are large spatial variations in the local stress level, the difference between the externally applied forces over the bulk area may be significantly smaller than the stresses at the solid-solid contacts. The Biot coefficient, measured to be in the range of 0.80–0.99, is linked to the consolidated area, thereby leading to increased stresses at the grain contacts. These stresses may end up to be 5–100 times the externally imposed load (see later in this paper). However, the appropriate pressure to be used in the geochemical calculations may range from the pore pressure, in the lower end (typically 0.7 MPa to avoid boiling in many of the high temperature experiments reported), to 100 times the externally imposed load, in the upper. This range in the appropriate thermodynamic pressure at grain contacts are therefore significant, and may therefore lead to spatial differences in the solubility of the different minerals within the porous rock. The stress-driven dissolution at grain contacts is termed pressure solution and has been used to understand the long-term creep experiments (see [22, 23] for a review). Croize et al. [24] performed single-indenter experiments on calcite crystals showing that measurable pressure solution occurs at stresses above approximately 400 MPa.
Sub-critical crack growth, where cracks propagate at imposed stresses below a critical level due to the chemical interplay between the fluids and rock surface close to the crack tip [25], may also be an effective driver of deformation and grain re-organization. In addition, the adsorption of sulfate in the diffusive double layer sets up a disjoining pressure at the grain contacts that leads to a reduction in the attractive van der Waals forces. This mechanism has been shown to significantly alter the mechanical properties and rates of deformation in chalks [16].
It is important to note that the deformation, due to grain re-organization and porosity reduction, alters the flow pattern. As the material deforms, fresh mineral surfaces are exposed to the non-equilibrium brine, which again increases the chemical reactions there. Hence, deformation could be important for the total chemical reaction measured in the ion concentration of the effluent water concentration.
In this paper we present the results from six experiments, probing two test temperatures and three effective stress levels (). The chemical alteration, as measured from the effluent-brine analysis of the dissolved Ca2+ concentration and mass-and-rock analysis, is higher in the high stress experiments at 130°C. Such kind of stress-dependency is not observed for the 92°C temperature experiment. Many experiments from the University of Stavanger have been performed at these temperatures previously, since the temperature coincide with the temperature at Ekofisk and Valhall reservoir chalk fields at the Norwegian Continental Shelf.
Methods
The Chalk
The experiments were performed on Upper Cretaceous outcrop chalk samples collected from the Obourg quarry in Belgium from the Saint Vast formation of the Mons basin (OBSV). Each experiment is denoted OBSV with a number suffix for identification.
Chalk is a sedimentary rock with high calcium carbonate (CaCO3) content. The concentration of CaCO3 for these chalks has been reported to be ranging from approximately 90 to 95% (see e.g., [16, 21, 26]). Cylindrical plugs were drilled from a chalk block, before being radially adjusted to diameters D0 and cut to lengths L0. The bulk volumes Vb were estimated according to the volume of a cylinder. Before testing, the plugs were dried at 100°C overnight and the initial dry mass Ms, 0 was measured. The plugs were then placed in a vacuum cabinet before being saturated with distilled water, and the saturated weight of each plug was measured (Msat, 0). The difference between the saturated and dry mass was used to estimate the pore volume and thereby the porosity ϕ according to:
Here, ρdw is the density of distilled water. The porosity estimate from mass difference measurements was performed both before and after the experiment. Based on previous experience in related geochemistry, pycnometry, saturation and dry mass estimates, the porosity of connected pores is equal to the overall porosity of the chalk sample [17].
Helium gas pycnometer measurements, using the Micromeritics Gas Pycnometer model AccuPyc II 1340, were also employed to estimate the solid density ρs of tested and un-tested material. The solid density can be used to estimate the volume of the solids Vs, so that the porosity can be estimated (before and after test) according to:
The average mineral density was estimated from the dry mass divided by the solid volume. Lengths, diameters, densities, and other basic quantities, which were measured before and after the experiments, are reported in Tables 1, 2 for the 130 and 92°C experiments, respectively.
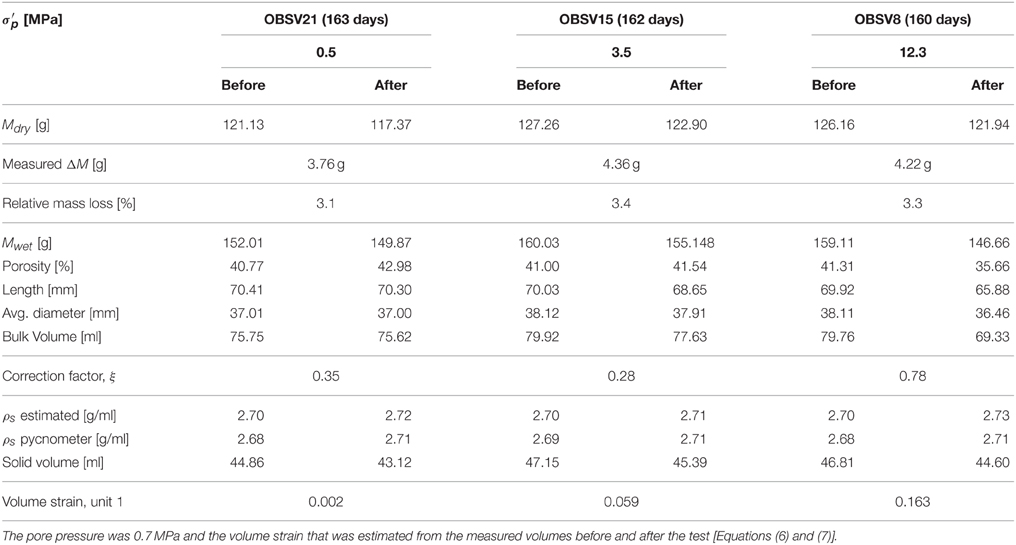
Table 1. Basic quantities of the 130°C experiments.
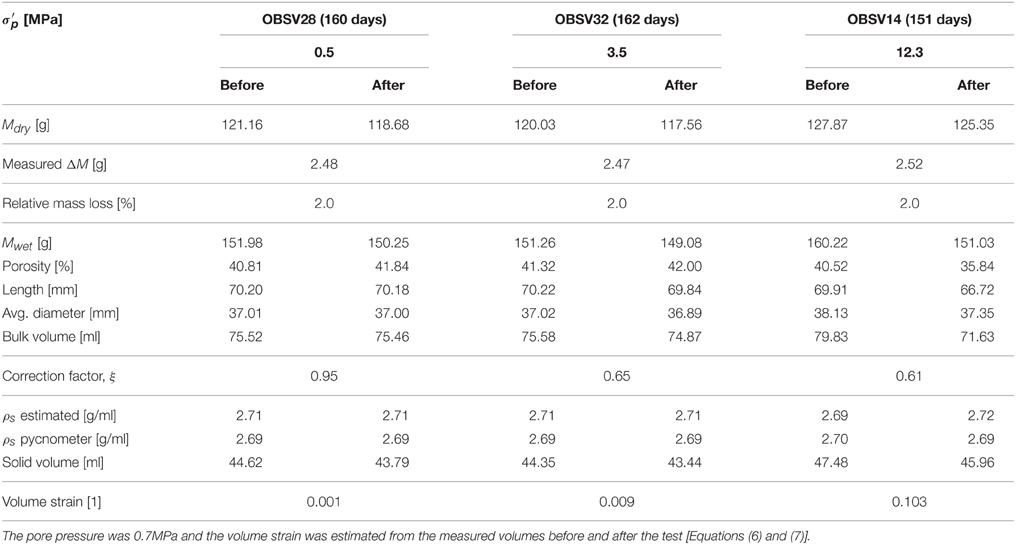
Table 2. Basic quantities of the 92°C experiments.
The Triaxial Cell and Experimental Setup
The chalk plugs were mounted into a triaxial cell that allowed for continuous measurements of the axial strains during the injection of reactive fluids at elevated stresses, pressures and temperatures (see Figure 1). The cell was equipped with a heating jacket and a regulating system (Omron E5CN) with precise temperature control (±0.1°C). The temperature was set to either 92 or 130°C, and monitored by a Pt-100RDT resistance temperature detector inside the cell. Three pumps were connected to the cell allowing for independent control of the piston pressure (Ppist), radial confining stress (σrad), and injection flow rate (qin) (Gilson Pump - Model 307 HPLC). The pore pressure was controlled by a back-pressure regulator ensuring constant pore pressure at 0.7 MPa on the downstream side of the core. The back-pressure regulator allowed for continuous sampling of the effluent water throughout the test period. The axial stress σax was calculated from the confining pressure Pconf (i.e., radial stress σrad), piston pressure Ppist, frictional pressure Pfric of the piston movement in the triaxial cell, and an area factor farea for the piston-pressure chamber and the cross area of the plug, giving:
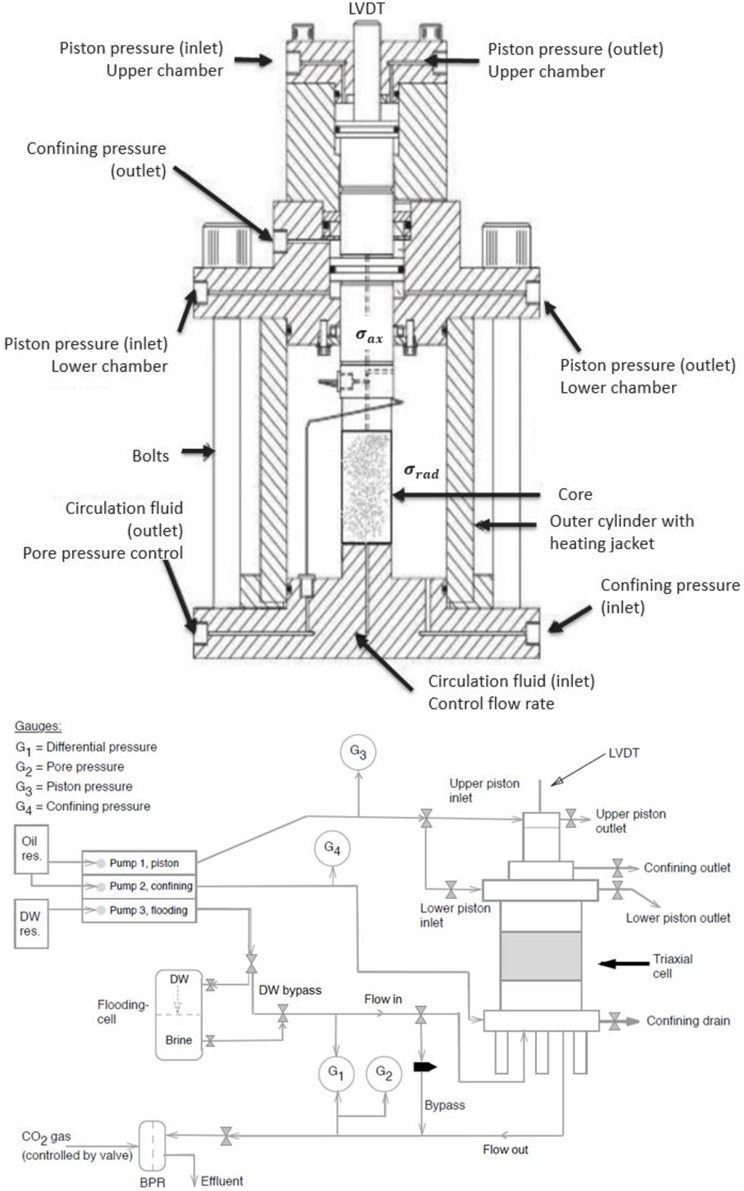
Figure 1. (Top) Sketch of the tri-axial cell [17] and an overview of the gauges, pumps and flow-loop in the experimental setup (Bottom).
The triaxial cell has been designed to have a balanced piston, meaning that the confining oil pressure can migrate to a chamber above the piston [see confining pressure (outlet) in Figure 1] to inhibit piston movement unless an additional piston pressure, that overcomes the friction pressure, is added in the upper chamber. The piston friction and the area factor is not the same for all the triaxial cells used. The piston friction is measured in each case, typically depending on temperature and confining pressure, and it takes on values between 0.3 and 0.5 MPa. The area factor varies for the different chalk core diameters and the design of each setup. It varies between the values of 1.2 and 1.3. The position of the piston, and hence the length L of the plug, was monitored by an external Linear Variable Differential Transducer (LVDT) placed on top of the piston.
The experiments were performed in the following steps:
(1) Loading the confining pressure to 1.2 MPa and the pore pressure to 0.7 MPa during flow of distilled water. The piston pressure was kept 0.2 MPa above the friction pressure of the piston (approximately 0.4 MPa). The 0.7 MPa pore pressure is used since it enables continuous water sampling and it is sufficient to avoid boiling of pore fluids within the core.
(2) Saturating the core with MgCl2-brine.
(3) Raising the temperature from ambient to 92 or 130°C.
(4) Increasing the confining pressure at hydrostatic conditions to 3.5 or 12.3 MPa (except the 0.5 MPa effective stress experiments). The confining (hydrostatic) pressure σp was increased with a constant flow rate of the hydraulic oil surrounding the core which was encapsulated by the shrinkage sleeve. During this phase, elastic and plastic parameters were measured from stress-strain plots. The initial steps from (1) to (4) lasted 3 days.
(5) Creep at constant hydrostatic stress conditions for varying number of days, while injecting 0.219 M MgCl2 brine at constant pore pressure and confining pressure.
Ion Chromatography (IC)
Samples of produced fluids downstream were collected approximately three times a week during the test period to quantify rock-fluid interactions. The samples were diluted 500 times with distilled water on a Gilson GX-271 machine to meet the linear region of the calibration curve of the Dionex ICS-3000 ion chromatograph. The concentration of four anions (IonPac AS16 exchange column) and three cations (IonPac CS12A exchange column) were estimated from the areas under the chromatographic curves when compared to known standards. Here, we report the Mg2+ and Ca2+ concentrations.
Constitutive Relations for the Volume Evolution of Bi-Phase Materials
The bulk volume Vb of a bi-phase material equals the sum of the solid volume Vs and the pore volume Vp, i.e.:
Any changes to the total volume are given by changes in pore volume and solid volume,
After testing, the plug is non-homogenously deformed such that a more accurate estimates of the bulk volume is given by the sum of truncated circular cones:
where the diameter Di is measured at intervals hi along the length of the plug (see Table 3).
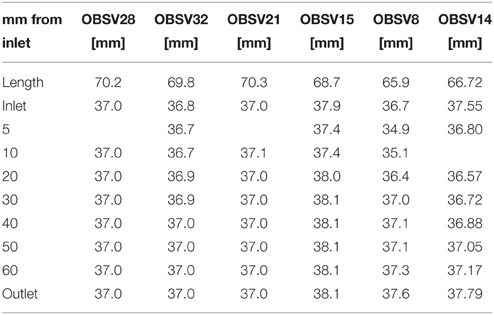
Table 3. Lengths and diameters of the cores after test.
Strain Measurements
Axial strains are estimated from length measurements according to:
where L is the length of the core during the experiment and L0 is the original length. If the core keeps a cylindrical geometry, the volumetric strain εvol can be calculated from the axial strains according to:
Here, the conversion factor ξ is given by the radial strain εrad to axial strain εax ratio measured directly on the core after the experiment, using that εrad = ξεax (see Tables 1, 2).
The Effective Stress and Stress-Strain Relations
The loading was performed by injecting hydraulic oil to the chamber surrounding the chalk core at a constant rate. Thus, the hydrostatic stress was increased from 0.5 to 3.5 MPa or 12.3 MPa with a hydrostatic stress rate ranging from 0.026 to 0.031 MPa/min. The loading phase lasted about 120 and 500 min, for the 3.5 and 12.3 MPa experiments, respectively. The effective stress of a porous material has been calculated from the Biot effective stress relation [8, 27]:
where the confining stress σp is reduced by a fraction α of the internal pore pressure P. Here, α is termed the Biot coefficient. For low pore pressures, as is the case here, the exact value of the Biot coefficient is not of great importance, and we equal it to one. In a drained hydrostatic experiment, the volumetric strain is linked to the effective stress σ′ via the drained bulk compressibility of the rock framework Kfr [28], so that:
Beyond a certain stress level during stress buildup, the observed strain dynamics deviate from the initial linear response. This is observed in the high-stress experiments. The onset of non-linearity signals the onset of irreversible deformation associated with grain-reorganization and pore-collapse. However, irreversible deformation could also occur at low stresses due to, e.g., the closure of micro-cracks that may originate from the rock sampling and preparation of the cores. When the extrapolated linear relation and the observed stress deviates above a threshold of 0.2 MPa, the onset of yield Yo was defined. Values of the bulk elastic modulus and the onset of yield are reported in Table 4.
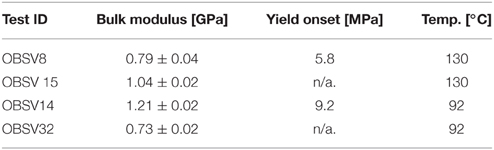
Table 4. Mechanical parameters obtained during loading.
Estimating Changes in Solid Mass
The evolution of the solid mass over time within the plug is given by the difference in chemical flux into the core and out of the core. The chemical flux in and out of the core is monitored by measuring the effluent concentration of different ions over time. Over a time interval δt the difference in mass is given by:
where cin, j − cout, j is the difference in the ion concentration [mol/l], q is the flow rate [l/day], and Mwj is the molar weight [g/mol] of species j (magnesium and calcium ions). The molar weight of calcium and magnesium are 40.08 and 24.31 g/mol respectively. The accumulated mass change at any given time t throughout the test period is estimated from the integrated sum of all sample analyses:
where the integrand is taken from Equation (11). Given knowledge about the density evolution of the solid constituent, we can now estimate the volume of solids through:
In Equation (13), the mass and the density before experiment, Ms, 0 and ρs, 0 respectively, are known quantities.
Results and Discussion
Mechanical Deformation during Loading
The axial strains (LVDT-measurements) were converted to volumetric strain according to Equation (8) with the values of ξ as reported in Tables 1, 2. The stress-strain curve during loading is shown in Figures 2A,B (for 92 and 130°C). The bulk modulus and yield stresses are given in Table 4. No direct dependency in the bulk modulus with respect to temperature can be drawn from the results, however the yield stress seem to be significantly reduced for the 130°C compared to the 92°C experiment. Significant variations in the elastic parameters can often be observed during direct loading (without cycling). The variation may e.g., be caused by defects that form during the core handling prior to the test, such that stress cycling are required to obtain more repeatable elastic properties as function of temperature. The authors are aware that several papers have been published on the temperature dependent elastic/plastic properties, see e.g., [29], but more work is required to understand the effect of temperature in these systems.
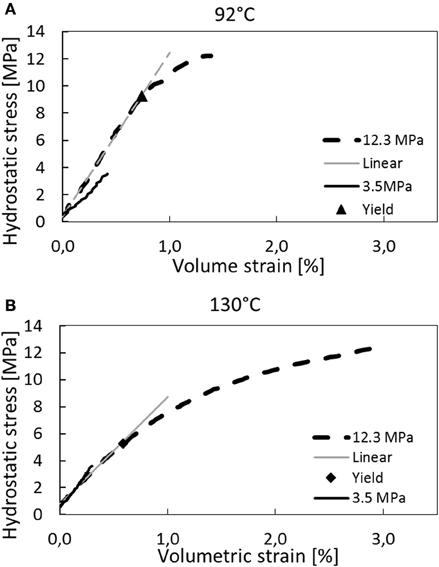
Figure 2. Stress–strain curves during loading to hydrostatic confining pressures of 4.2 and 13.0 MPa (i.e., 3.5 and 12.3 effective stress). In (A) the 130°C tests are shown while the 92°C tests are displayed in (B). The bulk modulus and onset of yield are shown in Table 4.
Mechanical Creep Deformation at 92 and 130°C
After the hydrostatic loading to 3.5 or 12.3 MPa, the stress, the fluid pressure, and the temperature were held constant during a constant flowrate of 1 PV/day of 0.219 M MgCl2 brine for the rest of the test. Since the individual cores had different initial pore volumes, the flow rates were different in each experiment (see Tables 1, 2). As can be seen in Figure 3, the cores in the high stress experiment (12.3 MPa) deform significantly more than the 3.5 MPa experiment, which again deform more than the 0.5 MPa experiments. This applies to both 92 and 130°C. However, when comparing experiments at equal stress, the temperature effect becomes apparent. With time, the 130°C experiments creep more than experiments performed at 92°C. An additional experiment performed at 92°C and 12.3 MPa that failed after 127 days, has been included into Figure 3 to display the repeatability in the experiments (dotted line).
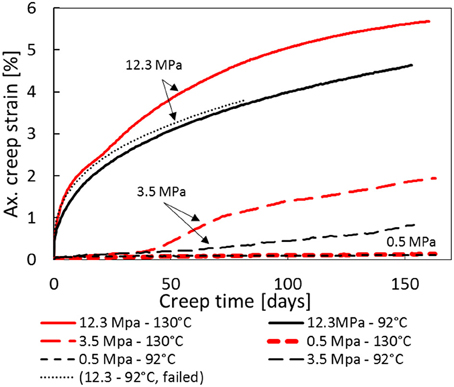
Figure 3. Axial creep strain curve with time for 130 and 92°C temperatures, and 0.5, 3.5, and 12.3 MPa effective stresses. In addition, a failed test performed at 12.3 and 92°C is included to display the repeatability of creep experiments.
For the 12.3 MPa experiments, the axial strain curves follow the approximately the same path for both 130 and 92°C until approximately 20–25 days. In this time interval (from 0 to 20 days), the creep rate of both 92 and 130°C is reduced with time (primary creep) and the temperature seems inconsequential to the observed creep dynamics. However, from 25 to 35 days the observed strain for the 130°C experiment enters an accelerating phase which is not observed for the 92°C experiment. Accelerated creep behavior were also reported by Madland et al. [19], Omdal [30], and Wang et al. [unpublished manuscript]. This may indicate how rock-fluid chemical processes at high temperatures impacts chalk mechanical deformation.
Interestingly, the same accelerating creep behavior is also observed for the 3.5 MPa effective stress experiment. In this experiment the acceleration occurs after 40–50 days, somewhat delayed compared to the 12.3 MPa experiment. The 3.5 MPa experiment was performed at stresses below yield (see Table 4) such that negligible strain was observed until 40 days. We see that the difference between creep curves at 130 and 92°C are the same for both the 3.5 and 12.3 MPa experiments. No temperature driven deformation is observed in the 0.5 MPa effective stress experiments.
Quantifying Primary Creep Dynamics
Creep is defined as the time-dependent irreversible/plastic deformation that occurs at constant stress conditions. For chalks, plastic creep is dominating the overall deformation at effective stresses beyond the yield stress (see Table 4 for yield values for 92 and 130°C). In this section we present, for the 12.3 MPa experiments, three simplified models to parametrize the creep curves. These models have been fitted to the observed creep curves at 92 and 130°C. This has been done to explore the functional form of the creep curve, and to visualize how chemical effects impact creep. Only the primary creep curve, recognized by a steadily declining creep rate, have been fitted since accelerated creep requires more sophisticated models that couple mechanical deformation and rock-fluid chemistry. For the 130°C experiment the primary creep applies to the first 20 days (after 20 days the creep rate accelerates) and the model fits are extrapolated beyond this time (see Figure 4A). Since no accelerated creep is observed in the 92°C experiment the whole creep curve is used (i.e., to 153 days; see Figures 5A,B). In Figure 4B the experimental and model-fitted strain rates are plotted together on log-log axis. Figure 4B shows that up to 20 days the creep rate declines with a constant slope in the log-log plot, indicating power-law behavior within this regime. From 20 to 30 days the strain rate increases, as can be seen by the red curve in Figure 4B. After the acceleration phase, from approximately 30 to 100 days, the curve attains the same slope as from 0 to 20 days. From approximately 100 to 160 days the log-log creep rate curve bends downwards, motivating using an exponential cut-off at finite times for the model fit.
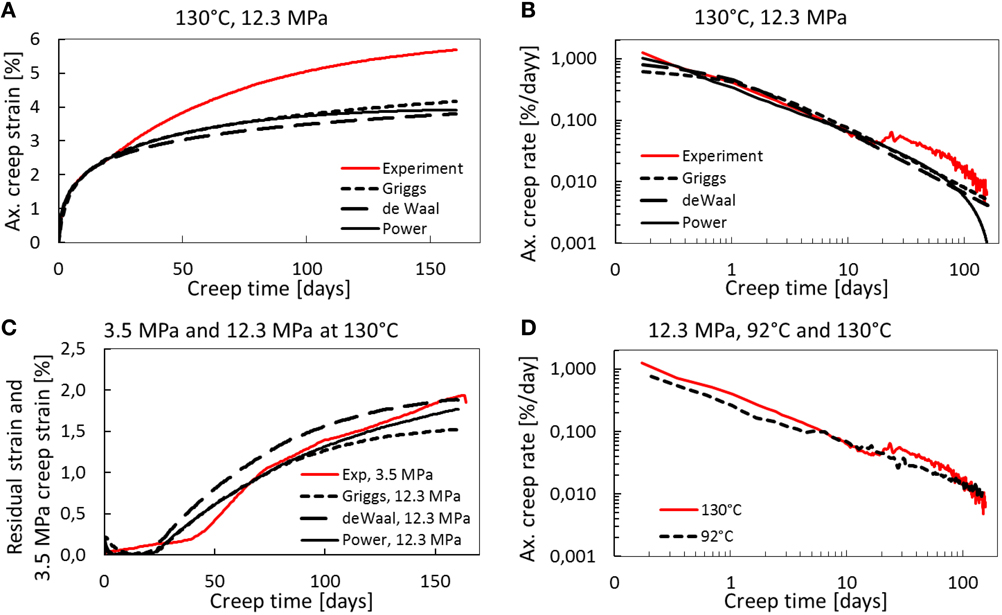
Figure 4. (A) Creep curve for the 130°C and 12.3 MPa effective stress experiment compared to the best model fits. The fitting has been performed on the primary creep part (i.e., first 20 days) and extrapolated to visualize the effect of chemistry. (B) Log-log plot of strain rate (in %/day) vs. time. Accelerated creep observed when the red experimental curve deviates from the models. (C) The difference between the extrapolated strain and observed strain at a given time, is plotted through time for the 12.3 and 130°C experiment (black line) and compared to the 130°C and 3.5 MPa experiment creep (red stippled line). The deviation is interpreted to arise from chemical effects, which coincide with the creep dynamic of the experiment performed at 3.5 MPa (below yield). (D) Comparison of the axial creep strain rate for the 92 and 130°C experiment. The GRG-nonlinear regression tool in the Solver add-in in Excel 2013 was used to search for the optimal values of A, B, and t0 to minimize the total residue.
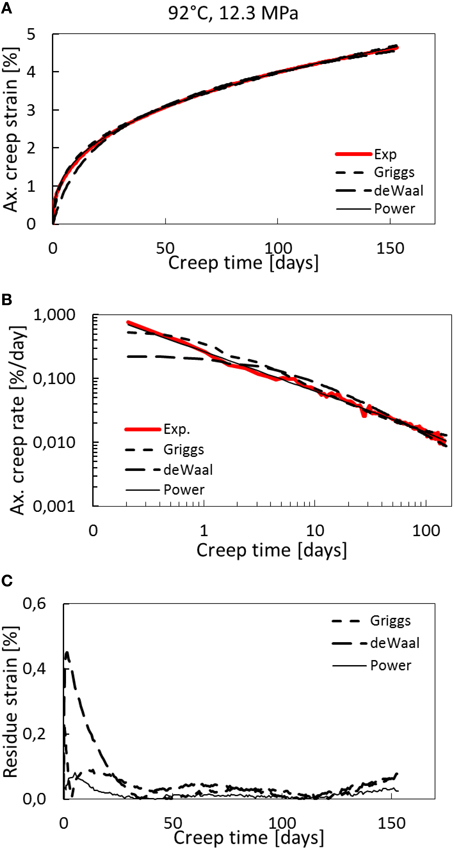
Figure 5. Creep curves for the 92°C and 12.3 MPa effective stress experiment (OBSV25). (A) Axial creep strain curves compared to the best fit of power law with exponential cutoff, de Waal and Griggs models. (B) Logarithmic strain rate (in %/day) plotted with logarithmic time-axis. (C) Residual strain through time. The power law curve fits the data better than the de Waal and Griggs models.
Three models have been used to quantify primary creep dynamics: the de Waal model, the Griggs model and a power law model with exponential cut-off. The de Waal model was obtained from his dissertation in 1986 [31] where he was studying time-dependent deformation in sandstone reservoirs, and has been re-used by e.g., Andersen 1992 [32] to North-Sea chalks. The Griggs model is obtained from his original work from 1939 [33]. The aim of these three models is to couple time to the observed volumetric creep. They are expressed as:
In the estimation of the factors A, B, and t0, the residual strain is minimized. The residual strain is defined as the sum of all absolute differences between the observed axial strain and the strain from the fitting curves (εmod). The overall residual strain has been rescaled by the number of data-points (N) such that the total residual can be compared for the different experiments:
The absolute values between the observed and the best fitted creep strain are shown in Figures 4C, 5C, whereas the model parameters (A and B) and the residuals (RES) are shown in Table 5.
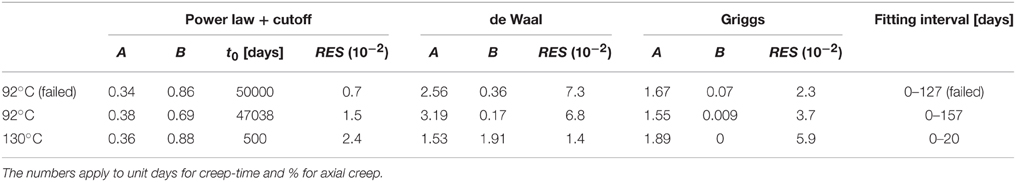
Table 5. Fitting parameters for the primary creep curve, i.e., with monotonous decreasing strain rate, in the 12.3 MPa experiments.
As can be seen in the reported residuals in Table 5, the power-law creep with a cut-off time of approximately 50,000 (infinity, which indicates no cut-off) fits better the observed creep curve compared to the de Waal and Griggs relations, with a residue of 1.5 × 10⁻² compared to 6.7 × 10⁻² and 3.7 × 10⁻², respectively, for the 92°C experiments (Figure 5). This is not the case for the 130°C experiment where the de Waal model seems to fit to the data in a more satisfactory way than the power-law model with a finite cut-off time (Figure 4). Based on the presented data, we cannot conclusively identify whether power law models with exponential cut-offs are more than the best fit out of three selected models, or if power laws models and self-organized criticality represent the best description of how nature works [34]. Special care should be taken before claiming that creep curves, which indeed are finite systems, exhibit scale-free behavior [35].
At 3.5 MPa effective stress it is expected that the mechanical component of the observed strain, associated with grain re-organization, should be negligible. In Figure 4C we plot the observed strain from the 3.5 MPa experiment (dashed) together with the residual strain from the 12.3 MPa experiment, i.e., the difference between the fitting models and the observed strain extrapolated into the accelerated phase, as a function of time. As can be seen, the 3.5 MPa experiment creep curve coincides with the residual strain. This may presumably indicate that the deviation between the extrapolated models and the observed deformation are caused by chemical reactions alone. As such, Figure 4C is significant to our interpretation, since it visualizes the effect of chemistry from the reactive flow on the volumetric strain for both the 3.5 and 12.3 MPa experiment. The additional strain increases monotonously to approximately 2% after 160 days. We can therefore suggest a simplified additive partitioning of the observed strain into a mechanical component and a chemical component.
In Figure 4D the creep strain rate for both the 92 and 130°C experiment is seen. Accelerated strain is not observed for the 92°C experiment, as also can be seen in Figure 5A where the axial creep strain is plotted with time for the experiment and the model fits. In Figure 5B we plot the creep strain rate and time on logarithmic axes, and in Figure 5C the residual strain are plotted with time.
The Chemical Interactions—Effluent Profiles
The observed creep dynamics in Figure 3 shows that temperature is important during creep with flow of non-equilibrium brines as a temperature of 130°C leads to more strain than at 92°C.
In this section, we describe the results of the ion chromatography (IC) analysis of the effluent brine. Any changes between the injected concentrations and the effluent samples indicate to which extent rock-fluid interactions occurred in the core. In Figures 6A,B, the effluent Mg2+ and Ca2+ concentrations are shown. The injected concentration of Ca2+ and Mg2+ are 0 and 0.219 mol/l (dotted line). The larger the difference between the zero line and the Ca2+ concentration and the dotted line and the Mg2+ concentration, the more chemical reactions have taken place in the core. The effluent chemical profiles for the 92°C experiments (Figure 6B) indicate that less chemical reactions occur compared to the 130°C experiments (Figure 6A).
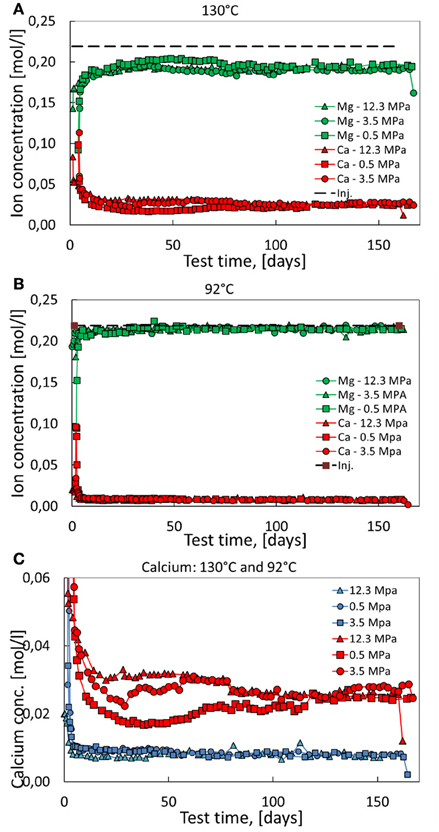
Figure 6. Magnesium and calcium ion concentrations of the effluent at 92°C (A) and 130°C (B). The injected Mg2+-concentration is shown as dashed line at 0.219 mol. (C) Comparing the calcium production dynamics from the 92°C and 130°C experiments.
In Figure 6C the produced calcium concentration is shown for all experiments. Here, the produced Ca2+ concentration for the 92°C experiment overlap each other, indicating that the chemical reactions are in-sensitive to the stress level. This is not the case for the 130°C experiments in which more stress leads to more dissolution. As such, both stress and temperature are important for the chemical reactions. We split the discussion up into the early effluent dynamics from 0 to 20–30 days and intermediate and late effluent dynamics from 30 to 100 days and 100 to 160 days, respectively.
Early Effluent Dynamics
As can be seen in Figure 6C, the produced effluent Ca2+-concentration is reduced from being initially being around 0.10–0.01 mol/l for the 92°C experiments and to 0.02–0.03 mol/l for the 130°C experiments. This transient behavior lasts approximately 2–3 days for the 92°C experiments and up to 3 weeks for the 130°C temperature experiments. The same trend is seen for the retention of Mg2+-ions. The underlying reason for this behavior has been debated in the scientific literature (see e.g., [36]). One hypothesis has been associated with the migration of the finest particles through the porous chalk, see e.g., Karoussi and Hamouda [37]. They conclude that fine migration could be a mechanism for wettability alteration and enhanced oil recovery. We believe that fine migration is unlikely in the experiments presented here for two reasons: Firstly, if fine migration is the dominating mechanism for the initial transient behavior, why would this phenomenon be temperature dependent? Any fine migration is supposedly obstructed by the pore throat dimensions and dependent on the extent to which the grains attach to each other, rather than temperature vibrations of the smallest fines. Fine attachment could, however, be affected by temperature due to the electrostatic forces (sometimes named disjoining pressures) which depend on temperature [16]. A second reason why we believe fine migration is unlikely in some of these experiments, is that if fines are produced from the porous body it would be in the form of CaCO3-minerals and thus the retention of Mg-ions should not be mirrored by the Ca-production. In Table 6, we estimated the amount of carbonate ions CO produced from the core, based on the discrepancy between the total molar production of Mg2+ and Ca2+. As can be seen in this table, stoichiometry is almost perfectly conserved for the high-temperature experiments (i.e., produce the same amount of Ca2+ as what is lost in Mg2+). This indicates that Mg2+ ions are bound to the dissolved CO to form magnesite (MgCO3) and/or dolomite (MgCa2(CO3)2), thus very low concentrations of CO ions are produced in the experiments where the transient behavior is observed. Thus, based on Mg-Ca stoichiometry, fines of CaCO3 that would increase the measured produced Ca2+ concentration in the effluent, has not been produced. However, for the 92°C experiments stoichiometry is not conserved, i.e., more Ca2+ is produced than Mg2+ retained within the core (see Table 6). This indicate that CO are produced from the core, possibly in the form of fines the first 2–3 days, but it cannot explain the 3 week transient behavior in the high temperature experiments.
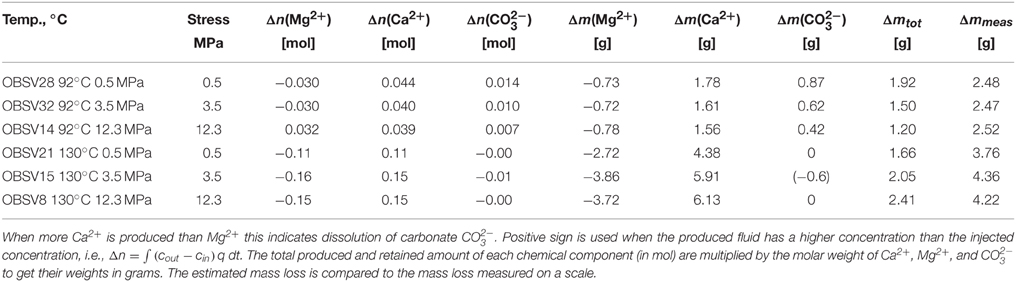
Table 6. Integrated effluent Ca2+ and Mg2+ concentrations.
Hiorth et al. [38] and Andersen et al. [39] propose, using geochemical simulations coupled to fluid flow dynamics, that the initial high value in the produced calcium concentration, observed in the IC-data, may be understood using a relatively high Mg-Ca ion exchange capacity. However, the slow transient decline in the calcium production (and increase in Mg-concentration) over the next 20 days (i.e., 20 pore volumes injected) cannot easily be explained by the use of common rate equations. An extension of this analysis has been presented by Pedersen et al. [36], where they describe how the slow transient behavior may be naturally captured by assuming an evolving pore geometry, thereby dynamically modifying the surface areas prone to chemical interplay.
Intermediate and Late Effluent Dynamics from 30 Days—Dissolution at Stressed Contacts
From approximately 20–30 to 80–100 days, the three 130°C experiments display several interesting features. As can be seen in Figures 6B,C, the effective stress level is important to the observed IC-data. The produced calcium concentration is successively higher for higher stress, i.e., it is higher at 12.3 MPa than at 3.5 MPa, and higher at 3.5 MPa than at 0.5 MPa. However, from 80 to 100 days and onwards the production of Ca2+ and the retention of Mg2+ reach the same values independent of stress within experimental the error.
The externally applied load σp is imposed onto the solid skeleton through the heat-shrinkable sleeve, separating the core material from the hydraulic oil in the tri-axial cell surrounding the core samples. The external stress is evenly distributed (Figure 7A) and it is carried by the force-chains transmitted through the grain contacts (Figure 7B). At the deformation rates reported in this paper, the permeability of these rocks is adequate to ensure drained conditions, i.e., the relative movement of the grains does not lead to build up of pore pressure within the sample, despite the fact that the pore pressure carries some of the externally imposed load according to the Terzhagi principle. When grains are partially cemented together at grain contacts, the effect of the pore pressure on the carrying capacity of the solid skeleton is reduced by the fraction termed the Biot coefficient. These effects are included into the effective stress concept as shown in Equation (9). The Biot coefficient is, in this perspective, an indirect measure of the area of the fluid-solid contact area Af→s divided by the total area Atot projected onto an arbitrary plane within the porous body:
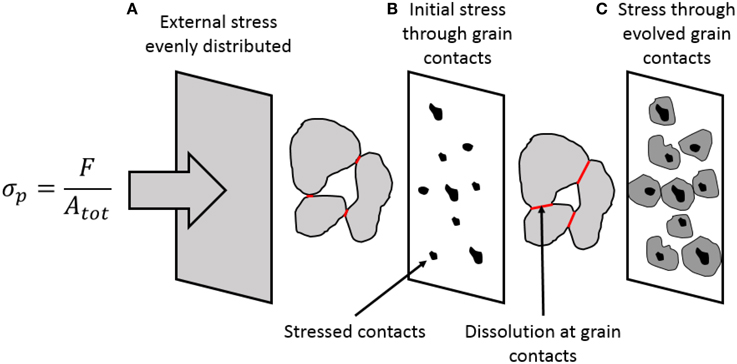
Figure 7. (A) The external stress is evenly distributed over the plastic sleeve covering the whole plug. The stress is transmitted through the granular package through grain contacts. (B) Initially, the contact area is small compared to the total area, thus the contact stresses are large leading to localized dissolution either due to the electrochemical effects and-/or pressure solution at the grain contacts. (C) When the grain contacts evolve, and the relation of increase, this effect reduces the contact stresses thus reducing pressure solution effects with time.
Here, we have used that the total cross sectional area is the sum of the solid-to-solid contact areas As→s and the fluid-to-solid contact areas, Atot = Af→s + As→s. (For a discussion on the Biot coefficient see, e.g., [40]). In drained conditions, the pore fluids have ample time to escape the pore volumes during compaction, i.e., the deformation-rate is lower than the flow-rate such that the pore pressure is unaffected by the solid stresses (σf→f = 0). Force balance considerations may be applied in static equilibrium. The externally imposed load is counteracted by the pore fluid pressure times the solid-fluid contact area plus the solid-solid skeleton stress times the solid-solid contact area (see e.g., [41, 42]). Thus:
Re-arranging and using the Biot coefficient as defined in Equation (16), the magnitude of the solid-solid stress will be given as:
The Biot coefficient for the type of rocks tested here has been shown to vary between 0.8 and 0.99 (see e.g., [40, 43], and references therein), such that the contact stresses are a factor from 5 to 100 times larger than the effective stress imposed to the system. If this is the case then the contact stresses could be sufficient for pressure-solution of calcite grains to occur [22, 24].
With time pressure solution leads to localized dissolution, thereby increasing the solid-to-solid contact areas as sketched in Figures 7B,C, where granular contact areas have increase in size. This effect would then reduce the Biot stress coefficient α and this would reduce the solid-solid contact stresses that drive additional dissolution. Thus, the stress driven dissolution process is reduced with time. It is exactly this effect that is observed in the continuous monitoring of the effluent brines in Figure 6, and especially in Figure 6C where the calcium concentration of the produced effluent attains the same value from approximately 80 days and onward. Thus, dissolution from the stressed contacts seem to stop. Remark that the stress-driven dissolution effect is only observed for the 130°C experiments.
Model of Chemo-Mechanical Creep Curve Dynamics
As was seen in Section Quantifying Primary Creep Dynamics, the data by itself cannot univocally identify with certainty the functional form of the observed creep as several models may fit the observed behavior equally well. In this section, we develop an analytical primary creep model from more basic principles from simple additive partitioning between the chemical and mechanical component, which is based on the coinciding residual for the 12.3 MPa experiment and the creep curve of the 3.5 MPa experiments at 130°C (see Figure 4C).
Assume that the observed strain may be partitioned into a pore volume and a solid volume component:
This assumption is always valid in a porous material of solids and voids where the pore volume reduction is associated with re-organization of grains, and the solid volume reduction is associated with rock-fluid interactions (dissolution and precipitation) changing the solid volume. In both [17, 21] the compositional changes have been documented displaying how MgCl2 flooding of chalk leads to calcite—magnesite replacement. This again leads to density increase and mass loss which changes the solid volume. The assumption that the volume change is constant through time implies that there are adequate amounts of calcite surfaces available for reactions (unlike what was shown in [17]). In the partitioning above we make a further assumption that cross-terms are omitted i.e., how the grain re-organization would affect the solid volume development, and vice versa.
From Equations (4) and (8) we may rewrite the bulk volume rate as:
where the pore volume at any time is given by the product of the porosity and the bulk volume (Vp = ϕVb), and the change in solid volume is given by the factor β calculated from Equation (14) using the solid volume changes reported in Tables 1, 2 divided by time. Assuming constant solid volume rate, we get 0.01 ml/day for the 130°C experiments and 0.005 ml/day for the 92°C experiment.
In Equation (20) the time-dependent variables are the bulk volume and the porosity. During compaction and primary creep the porosity is decreasing through time. The simplest possible conjecture would be to introduce a rate of change in porosity which is proportional to the porosity itself, such that the compaction is more rapid for high porosity than for smaller porosities. Since grain reorganization cannot continue until zero porosity, a terminal porosity ϕc is introduced. The parameter ϕc will act as a fix-point for the differential equation. Under the assumption that n > 0 a porosity evolution equation:
may be introduced. For n = 1 and ϕc = 0, we have that and an analytical solution:
exists for the bulk volume evolution. By using Equation (8) we obtain the creep function:
In this model the value of the parameter β is fixed from the experiments to (0.01 and 0.005 ml/day for the 130 and 92°C, respectively); while α remains a free variable. In Figure 8, the model described above is integrated numerically and matched (by hand) to the experimental data with values of n, α and ϕc as described in the caption for the two experiments performed at 92 and 130°C, with 12.3 MPa effective stress.
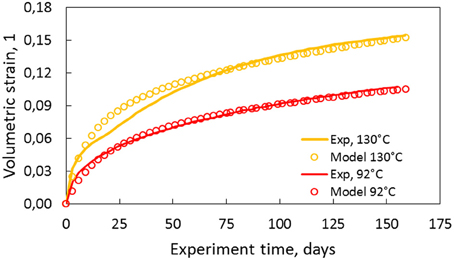
Figure 8. Volume strain observed in solid lines for 130 and 92°C at 12.3 MPa effective stress. The open circles are the model proposed in the text where the values of n = 3, α = 6, and ϕc = 0.375 were used to match the 92°C experiment, and n = 3, α = 7, and α = 0.355 were used to match the 130°C experiment. The value of β is used obtained from the experiment. α describes the exponential porosity evolution decay rate, and hence the rate of pore volume reduction.
Compaction Exposes Fresh Reactive Mineral Surfaces
Deformation by grain re-organization and pore collapse alters the local porosity field through the rock. Most likely the deformation is non-uniform as the material parameters may vary through the core. This depends upon the mesoscale dimensions that locally defines the material. As such, also the permeability field may change both with time and space within the core. Alterations in the permeability field change the flow pattern. Given that dissolution/precipitation is limited by the flow and not the chemical kinetics, the amount of fluid passing through a volume of the core within a time interval determine the degree of chemical alteration. Since the reactions under investigation here reduce the solid volume, a positive feed-back mechanism may be proposed. If the flow is, for some reason, focused within a region of the porous body, this leads to enhanced chemical reaction in this region. Now, if the chemical reaction leads to solid volume reduction (and a local porosity increase), this would lead to further focusing of the flow through this region. This positive feed-back mechanism is often termed worm-holing [44] and has, e.g., been used to understand the destruction of dams.
However, when compaction is taken into consideration, this is often localized to regions of the core with higher porosity, because the grains there may re-organize more easily. When the grain volumes are reduced with time, the local porosity increases and compaction becomes more likely within the next time-interval [45]. Such a negative feed-back mechanism would distribute the flow over a larger region and inhibit worm-holing to occur. With time, it is therefore likely that in the high-stress experiments the injected brine comes in contact with all the reactive surfaces in the core. This leads to enhanced chemical reactions, compared to the low stress experiments where worm-holing would focus the chemical alteration to localized areas.
An example of worm-holing can be seen on the inlet side of the core shown in Figure 9 for the experiment exposed to 130°C and 0.5 MPa effective stress. Since the injected brine is not in equilibrium with the rock, and since the brine is injected through holes in a drainage plate on the inlet side of the core, we have localized dissolution close to the inlet points, while the injected brine and the rock equilibrate chemically. Whether the spots seen on this image will grow or not, is determined by temperature, brine chemistry, and degree of compaction. When MgCl2 is injected at 130°C we often see areas of filled half-spheres where the rock structure has been altered, most likely due to dissolution and re-precipitation of Mg-bearing minerals. Other experiments performed within our laboratories indicate that when, on the other hand, NaCl-brine is injected, void half-spheres form around the inlet points.
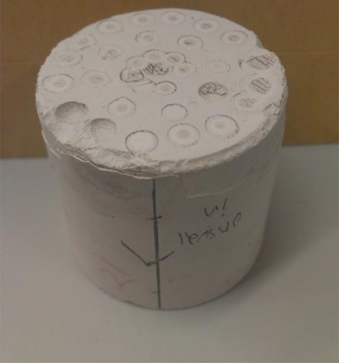
Figure 9. Inlet side of the 130°C and 0.5 MPa effective stress (OBSV21) core after the experiment completed. In this experiment the stresses are too low to induce compaction and grain re-organization, although the temperature is high such that dissolution/precipitation occurs at the entry-points of the injected MgCl2 fluids.
How Chemical Interactions Changes Rock Properties
In this section we present the rock observations that were made before and after the experiments were performed. The spatial dimensions of the plug were measured and the bulk volume was estimated. The axial to radial strain ratio for the different experiments was used to estimate the correction factor ξ (Equation 8). As can be seen in Tables 1, 2, the radial strains are less than the strain in the axial direction (i.e., ξ < 1). The bulk volume changes depend significantly on the creep stress. In addition, the saturated and dry masses were measured before and after the experiment. Similarly, the porosity was estimated to be the difference between the dry and saturated mass divided by the bulk volume. For the low stress experiments (with almost zero deformation), the porosity increased by 2.16 and 1.03% for the 130 and 92°C experiments, respectively. This indicates that the solid volume has been reduced. Since the total volume is given as the solid volume together with the pore volume, the dry mass and porosity can be re-combined to estimate the average mineral density. These results show that the mineral density increased from approximately 2.69–2.70 g/ml, before the experiment, to 2.72, 2.71, and 2.73 g/ml after for the 0.5, 3.5, and 12.3 MPa experiments, respectively (130°C). Such density changes are not seen for the 92°C experiments. Typically, pore volume estimates based on dry and saturated cores combined with the bulk volume measurements vary within 0.01–0.02 g/ml. These estimates are in agreement with the gas adsorption pycnometry data that is also shown in Tables 1, 2.
Interestingly, when comparing the dry mass of the core before and after the experiments, one observes a significant mass reduction. For the 130°C experiments, the mass losses are 3.72 g (3.1%), 4.34 g (3.4%), and 4.19 g (3.3%) for, respectively, the 0.5, 3.5, and 12.3 MPa experiments. The mass loss relative to the initial mass is given in parentheses. We see that more mass is lost for the high stress experiments (3.5 and 12.3 MPa) compared to the low-stress experiment (0.5 MPa). However, the relative mass loss measured on the scale is not seen to change significantly with stress, though the integrated CaCO3 dissolution from IC data is stress dependent. Additional experiments are required to quantify if these observations are significant. In the 92°C experiments the mass loss is 2.48 g (2.1%), 2.47 g (2.0%), 2.52 g (2.0%) for the 0.5, 3.5, and 12.3 MPa effective stress experiments, respectively. We observe from the rock measurements conducted that the chemical interactions depend on temperature and stress, which is in accordance with what was reported in Section Quantifying Primary Creep Dynamics, and typically, higher temperature and higher stress lead to enhanced chemical reactions. The loss of mass and increased mass density leads to changes in the solid volume.
The solid-volume changes during flow of MgCl2 brines in chalks have previously been shown to be related to the dissolution of CaCO3 and the precipitation of Mg2+-bearing minerals such as dolomite and magnesite (see e.g., [17, 21]). These minerals all have a density larger than calcium carbonate, which is in agreement with the gas adsorption measurements reported. For constant mass, this gives a reduction in the solid volume. When the mass is reduced, in addition to an increased density, this leads to a further decrease in solid volume.
Now, since the ion weight of Mg2+ and Ca2+ are 24.31 and 40.08 g/mol, respectively, any exchange between the production of Ca2+ and retention of Mg2+ would reduce the mass of the core. When integrating the amount of Mg2+ retained in the core (adds to the core weight) and the production of Ca2+ (reduces the core weight), we calculate a mass loss of 1.92, 1.50, and 1.20 g for the 92°C IC-data, and a loss of 1.66, 2.05, and 2.41 g for the 130°C experiments, for 0.5, 3.5, and 12.3 MPa effective stresses, respectively (see Table 6). These numbers can be compared to the mass loss measured by weighing the core on the scale after the experiment (see Tables 1, 2, 6). For the 92°C experiments, stoichiometry results are not perfectly satisfying, indicating that small amounts of CO are produced from the core. The discrepancy between the weight loss measured on the scale (dry weight) and the one estimated from the IC-data indicates that not only dissolution of calcium carbonate occurs but also precipitation of magnesium carbonate. The same mass loss discrepancy has been reported and discussed earlier by Nermoen et al. [17] for MgCl2 flow through Liège chalk. Equilibrium calculations indicate that the silicate minerals that are present in some of these chalks will dissolve when using MgCl2 brines at these pressure and temperature conditions [18, 19]. Thus, dissolution of silicates (clays, quartz etc.) are expected. Further geochemical analyses of the rock chemistry (such as e.g., X-ray diffraction and whole rock geochemistry) are required to understand the presented mass loss discrepancy in this case.
Porosity Development
In a porous material the porosity is defined as the ratio of the pore volume to the bulk volume. Using the constituency relation in Equation (4) any changes in the bulk volume are caused by either changes in the solid/mineral volume and/or changes of the pore volume, thus the porosity become:
where we have used Equation (5) for the changes in ΔVp. If we now divide by the initial bulk volume Vb, 0 and use the definition of the volumetric strain in Equation (8) we arrive at a porosity evolution equation that takes into account both changes to the bulk volumetric strain and the solid volume changes:
Since neither the volume of solids nor the bulk volumes are conserved in these experiments, the porosity displays a rather complex behavior. Higher hydrostatic stress is linked to more reduction in the bulk volume. Simultaneously, the experiments have shown that the solid volume changes also increase with stress. With respect to porosity, increased stresses lead to volumetric compaction that are more important than how the stress alters the solid volume. For the tests at 130°C, more dissolution/precipitation is observed at 3.5 and 12.3 MPa than at 0.5 MPa. However, at 12.3 MPa the volumetric compaction leads to a porosity reduction from 41.31 to 35.66%, since compaction dominates over dissolution/precipitation. At 3.5 MPa the chemical alteration and volumetric compaction are almost the same since the porosity only increases from 41.00 to 41.54%. At 0.5 MPa, compaction is insignificant compared to dissolution/precipitation since the porosity increases from 40.77 to 42.98%. In the experiments performed at 92°C the porosities change from 40.81% to 41.84%, 41.32% to 42.00%, and 40.52% to 35.84% for the 0.5, 3.5, and 12.3 MPa tests, respectively. When comparing the experiments performed for 3.5 MPa effective stress, the porosity increase is larger at 92°C than at 130°C (0.7 and 0.5% respectively). More dissolution and more strain are accumulated at 130°C than at 92°C, with volumetric compaction of 2.3 and 0.7 ml, and solid mass loss of 4.34 and 2.47 g respectively. For the 12.3 MPa experiment the situation is opposite with respect to temperature. Here, the porosity declined by −4.68% for the 92°C experiment while −5.65% for 130°C. Thus, when evaluating the porosity evolution during chemo-mechanical compaction both compaction, mass exchange and density alteration are tightly connected (see also [17]) as the relative importance of compaction and mass exchange are both temperature and stress dependent. See an overview in Table 7.
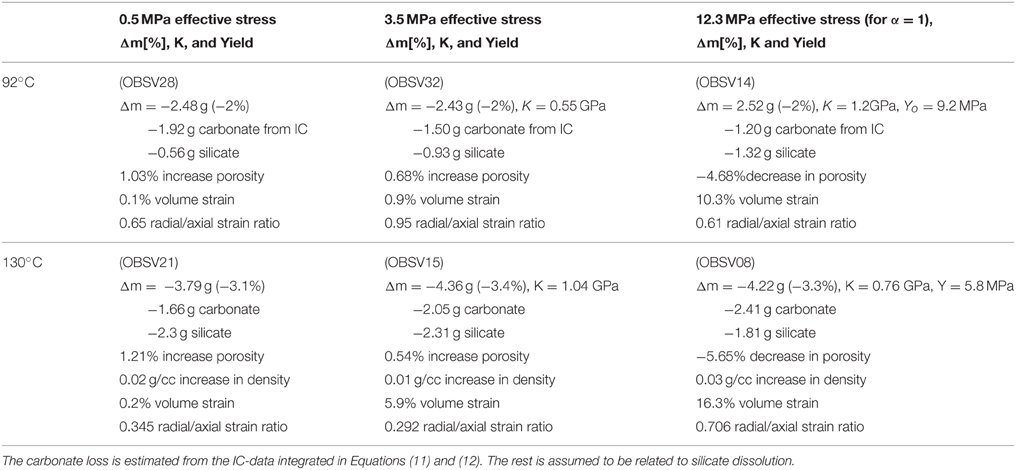
Table 7. Summary of the results of all experiments performed at the two temperatures and the three stresses.
Changes to the Produced Solute Concentration
The effluent concentration is affected by mineral dissolution and precipitation. From Equation (4.66) in [46] a general rate law for the reaction rate (R), in units mole/L/s, can be written as:
where the factor k is the specific rate (mole/m2/s), A0 is the initial total surface area of the solid (m2), V is the volume of the solution (i.e., pore volume, m3), and n∕n0 is the ratio of the current to initial moles of the reactive solids (i.e., CaCO3) at a given time. Here, g(C) depends on the distance from equilibrium, which incorporates the solution composition and the changes to the rock. The parameters above may evolve with time as the chemical components are transported through the core and hence lead to localized precipitation and dissolution. The primary result from the experiments is that the produced Ca-concentration is higher for the high-stress experiments than the low-stress experiments. In order to capture this observation we may simplify the physics described in Equation (25). In the high stress experiments, grain re-organization leads to reduction in the pore volume, and hence increased reaction rate, compared to the low-stress experiments. The pore volume at any given time is simply given by the product of the porosity evolution times the bulk volume from recasting Equation (8) into Vb = Vb0(1 − εb). Under the assumption that differences in, A0, m∕m0, n, and g(C) are small compared to the pore volume changes, we may re-scale Equation (25) to obtain the ratio of produced Ca- concentrations of the 12.3 MPa experiment to the concentrations in the 0.5 MPa experiment:
Please note that here we only address the effect of solute pore volume reduction and omit any differences in, e.g., n (which depends on the integrated concentrations). The comparison between the 0.5 and 12.3 MPa experiment is shown in Figure 10.
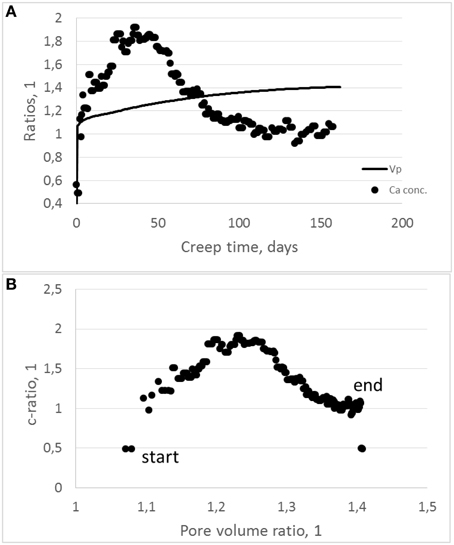
Figure 10. (A) The pore volume ratio for the 0.5 divided by the 12.3 MPa development (solid line) plotted together with the calcium concentrations ratios for the same experiments (dots) as function of test time. (B) Displaying the correlation between the ratio of the effluent Ca-concentration divided by the pore volume ratio. As can be seen, a positive correlation is seen the first 30 (or so) days. The peak concentration ratio occurs after 30–40 days, before a negative trend is observed.
Microstructural Observations
Scanning electron microscopy (SEM) and energy dispersive spectroscopy (EDS), performed at University of Stavanger display the changes to the microstructure morphology and the element concentrations. All the SEM-EDS that are reported have been performed approximately 0.8 cm into the core from the inlet and approximately 0.2 cm from the center axis. This is because Zimmermann et al. [21] has shown how the replacement reaction varied throughout the core. The microstructural morphology varies spatially and heterogeneities can be observed on a variety of scales, see also [17]. SEM images of tested cores (a, b, and c) and un-tested (d) chalk can be seen in Figure 11. Comparing (a) and (b) we can see the effect of compaction. As is shown in Table 7, the 0.5 MPa at 130°C increased its porosity by 1.21% while the porosity decreased by 5.65% for the 12.3 MPa at 130°C test. The foraminifers and coccolith rings that can be seen in (d) are still visual in the tested cores (a, b, and c), although the overall morphology of the mineral structure seem less ordered because of the precipitate nucleation and growth. To what extent the grains are dissolved at grain boundary contacts, cannot be conclusively observed from the reported SEM images.
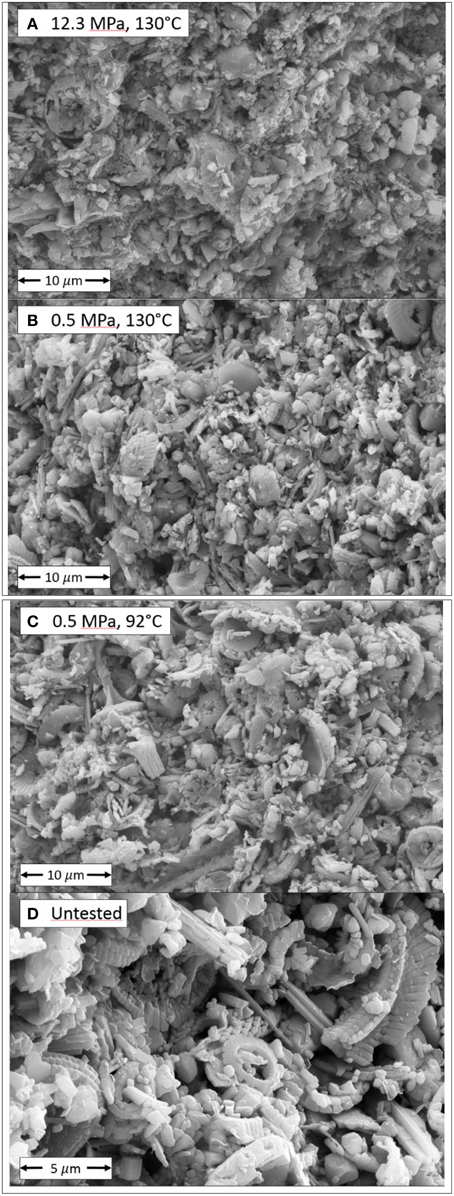
Figure 11. High resolution SEM images of the microstructure of tested cores at varying effective stress and test temperature. Scale bare is shown. Coccolith rings and foraminifers can be seen. In (A) the 130°C and 12.3 MPa experiment can be seen and compared to (B) in which the 130°C and 0.5 MPa experiment is observed. The microscopic morphology of the grain package seem denser at the high stress test (A) than the low stress test (B). In (C) the 0.5 MPa and 92°C experiment is shown. The tested material can be compared to the untested core material shown in (D).
Figure 12A displays the differences of the EDS diagram for the 92 and 130°C test without stress. As can be seen, more Mg is observed in the core at higher temperature. Each EDS-curve is an average of two measurements and the number of counts at any energy are divided by the total number such that a direct comparison of the count—numbers can be made. In Figure 12B the effect of stress can be seen. Again, the amount of replaced Mg is higher for the high-stress experiment. Even though the Mg—trends are as expected from the IC-data, shown in Figures 6A–C care should be taken in the interpretation due to the uncertainty of these EDS measurements. When it comes to the other measured elements (C, O, Al, Si, Cl) they are unchanged while the Pd arise from the coating (standard procedure in the preparation of the SEM samples). The Ca-concentration seems unchanged in the EDS spectra (Figure 12) even though Ca-ions were produced from the core.
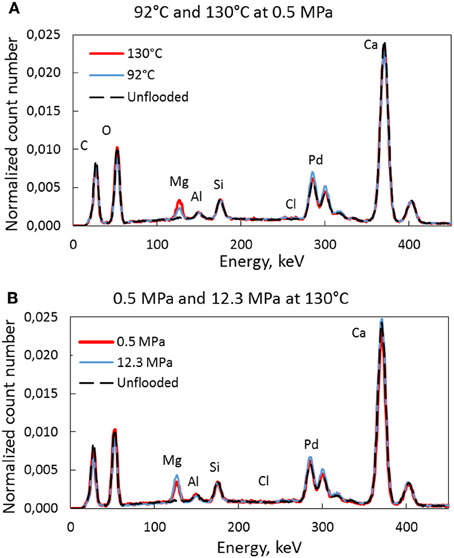
Figure 12. EDS spectra of the tested core material with peaks for the different elements. The effect of temperature is shown in (A) where more Mg is seen for the high temperature test. This is the same trend as for the high-stress experiment compared to the low stress experiment in (B).
Conclusions
The mechanical and chemical results from a series of flow-through experiments are reported. The test matrix consists of two temperatures (92 and 130°C) and three effective stresses (0.5, 3.5, and 12.3 MPa). The experiments have been performed on chalk obtained from a single chalk block from the Obourg Saint Vast quarry in Mons, Belgium. Twenty seven cores were produced and out of these, six cores of similar porosity were selected such that a one-to-one comparison could be made. The cores were continuously flooded with 0.219 M MgCl2 brine at a rate of one initial pore volume per day.
The experiments were loaded and allowed to creep over time and total test duration ranged from 153 to 165 days, Basic quantities such as dry mass lost (relative to the initial mass) and volumetric strain could therefore be compared for all experiments.
We have shown that the produced Ca2+-concentration vary with stress for the 130°C experiments. A similar stress dependency is not observed for the 92°C experiments. Mechanical deformation and stress may couple to the chemistry of mineral dissolution and precipitation in several ways. Several mechanisms have been discussed to explain the exact physicochemical mechanisms at play. A simplified creep model has been suggested based on a simple additive partitioning between the pore volume and solid volume development. Although, being simplified, this model paves the way for more realistic developments in the future where for instance full coupling between the two processes should be included: Chemical reactions trigger pore volume reduction, and stress conditions affects the rate of chemical reactions.
The perhaps most significant result from this paper is the documentation of how the effluent concentrations change with time for different stress and temperatures. Three mechanisms were suggested. First, we discussed the impact of pressure solution leading to dissolution in the stressed inter-granular contacts. We used the Biot stress coefficient to argue that the local stresses at grain contacts may be adequate for pressure solution to occur if the relevant thermodynamic pressure is the same as the skeleton stresses at grain contacts. Secondly, compaction and deformation alters the microscopic granular structure. This changes the way in which fluids are moving through the core. We believe that initially the flow is focused within volumes with the highest porosity, and within the next time interval, it is in these regions compaction and chemical effects occurs. The compaction by grain re-organization leads to local permeability loss, thereby diverting the fluids to other parts of the core. Thus, compaction would dynamically alter the fluid flow through the core such that the produced effluent concentrations are higher for the high-creep strain experiments. A third mechanism is related to how dissolution and precipitation alters the reactive surface area with time which is important for the effluent sample dynamics (see [17, 36]).
The integrated Mg2+/Ca2+ stoichiometry is almost perfectly conserved for the 130°C experiments, but not at 92°C where more Ca2+ is produced from the core than the amount of Mg2+ that is retained (see Table 6). Since the chalk contains non-carbonate minerals and since rock-fluid interactions are temperature dependent, different minerals are involved in the dissolution/precipitation process. The non-stoichiometry at 92°C indicates that, e.g., CO ions are produced. The observed discrepancy between the estimated mass loss (from IC data) and the mass loss measured on the scale strengthens the need for complete geochemical models such as those presented in [18]. More detailed geo-chemical investigations of the rocks, before and after experiments, are required to determine whether or not the production of non-carbonates, such as silicate bearing clays, can be at play. In Zimmermann et al. [21] they describe the compositional/mineralogical changes of a chalk for a MgCl2 flow-through experiment. ICP analyses of the effluent brines would help to quantify the production of additional ions such as Fe, Si, Al, etc. It is important to note that the stress dependency almost disappears when considering the mass loss measured on a scale. We have shown that the mass loss estimated from the Mg2+ and Ca2+ ion dynamics is stress dependent at 130°C for the first 100 days or so.
Author Contributions
All authors listed, have made substantial, direct and intellectual contribution to the work, and approved it for publication.
Conflict of Interest Statement
The authors declare that the research was conducted in the absence of any commercial or financial relationships that could be construed as a potential conflict of interest.
Acknowledgments
We would like to thank Larry M. Cathles for offering constructive criticism and valuable comments to this work. We also thank Mona Minde for the SEM-EDS measurements obtained at University of Stavanger, Norway. The authors acknowledge the Research Council of Norway and the industry partners; ConocoPhillips Skandinavia AS, BP Norge AS, Det Norske Oljeselskap AS, Eni Norge AS, Maersk Oil Norway AS, DONG Energy A/S, Denmark, Statoil Petroleum AS, GDF SUEZ E&P NORGE AS, Lundin Norway AS, Halliburton AS, Schlumberger Norge AS, Wintershall Norge AS of The National IOR Centre of Norway for support.
References
1. Fabricius IL. Burial stress and elastic strain of carbonate rocks. Geophys Prospect. (2014) 62:1327–36. doi: 10.1111/1365-2478.12184
2. Amitrano D, Helmstetter A. Brittle creep, damage, and time to failure in rocks. J Geophys Res Solid Earth (2006) 111:B11. doi: 10.1029/2005JB004252
4. Durand J. Sands, Powders and Grains—An Introduction to the Physics of Granular Materials. New York, NY: Springer (1997).
5. Nagel NB. Compaction and subsidence issues within the petroleum industry: from Wilmington to Ekofisk and Beyond. Phys Chem Earth (A) (2001) 26:3–14. doi: 10.1016/S1464-1895(01)00015-1
6. Preston C, Monea M, Jazrawi W, Brown K, Whittaker S, White D, et al. IEDA GHG Weyburn CO2 monitoring and storage project. Fuel Proces Technol. (2005) 86:1547–69. doi: 10.1016/j.fuproc.2005.01.019
7. Terzaghi KV. Die berechnung der durchassgikeitsziffer des tones aus dem Verlauf der hydrodynamishen Spannungserscheinungen. Sitzungsber Akad Wiss Wien Math Naturwiss Kl Abt. (1923) 2A:105.
8. Biot MA. General theory of three-dimensional consolidation. J Appl Phys. (1941) 12:155–64. doi: 10.1063/1.1712886
9. Nur A, Byerlee JD. An exact effective stress law for elastic deformation of rock with fluids. J Geophys Res. (1971) 76:6414–9.
10. Hermansen LK, Thomas JE, Sylte JE, Aasboe BT. Twenty five years of ekofisk reservoir management. In: SPE Annual Technical Conference and Exhibition. San Antonio, TX (1997). p. 873–85. doi: 10.2118/38927-MS
11. Thomas LK, Dixon TN, Evans CE, Vienot ME. Ekofisk waterflood pilot. J Pet Technol. (1987) 283:221–32.
12. Hermansen H, Landa GH, Sylte JE, Thomase, LK. Experiences after 10 years of waterflooding the Ekofisk Field, Norway. J Pet Sci Eng. (2000) 26:11–8.
13. Jensen TB, Harpole KJ, Østhus A. EOR Screening for Ekofisk. Paris: Society of Petroleum Engineers (2000).
14. Awan AR, Teigland R, Kleppe J. A survey of North Sea enhanced oil recovery projects initiated during the years of 1975 to 2005. SPE Reserv Eval Eng. (2008) 11:497–512. doi: 10.2118/99546-PA
15. Spencer AM, Briskeby PI, Dyrmose Christensen L, Foyn R, Kjølleberg F, Kvadsheim E, et al. Petroleum Geoscience in Norden—exploration, production and organization. Episodes (2008) 31:115–24.
16. Megawati M, Hiorth A, Madland MV. The impact of surface charge on the mechanical behaviour of high-porosity chalk. Rock Mechan Eng. (2012) 46:1073–90. doi: 10.1007/s00603-012-0317-z
17. Nermoen A, Korsnes RI, Hiorth A, Madland MV. Porosity and permeability development in compacting chalks during flooding of non-equilibrium brines - insights from long term experiment. J Geophys Res Solid Earth (2015) 120:2935–60. doi: 10.1002/2014JB011631
18. Hiorth A, Cathles L, Madland M. The impact of pore water chemistry on carbonate surface charge and oil wettability. Transp. Porous Med. (2010) 85:1–21. doi: 10.1007/s11242-010-9543-6
19. Madland M, Hiorth A, Omdal E, Megawati M, Hildebrand-Habel T, Korsnes R, et al. Chemical alterations induced by rock-fluid interactions when injecting brines in high porosity chalks. Transp Porous Med. (2011) 87:679–702. doi: 10.1007/s11242-010-9708-3
20. Cathles L. Eq-Alt-Equilibrium Chemical Alteration in Combined Physical and Chemical Geofluids Modeling. Windsor, ON: University of Windsor (2006).
21. Zimmermann U, Madland MV, Hildebrand-Habel NAT, Bertolino SAR, Hiorth A, Korsnes RI, et al. Evaluation of the compositional changes during flooding of reactive fluids using scanning electron microscopy, nano-secondary ion mass spectrometry, x-ray diffraction, and whole rock geochemistry. AAPG Bull. (2015) 99:791–805. doi: 10.1306/12221412196
22. Hellmann R, Renders PJN, Gratier J-P, Guiguet DR. Experimental pressure solution compaction of chalk in aqueous solutions. Part 1. Deformation behavior and chemistry the geochemical society, special publication. Water Rock Interact Depos Environ Geochem. (2002) 7:129–52.
23. Croize D, Rendard F, Gratier J-P. Compaction and porosity reduction in carbonates: a review of observations, theory and experiments. Adv Geophys. (2013) 54:181–238. doi: 10.1016/B978-0-12-380940-7.00003-2
24. Croize D, Renard F, Bjørlykke K, Dysthe DK. Experimental calcite dissolution under stress: evolution of grain contact microstructure during pressure solution creep. J Geophys Res. (2010) 115:B09207. doi: 10.1029/2010JB000869
25. Røyne A, Bisschop J, Dysthe DK. Experimental investigation of surface energy and subcritical crack growth in calcite. J Geophys Res. (2011) 116:B04204. doi: 10.1029/2010JB008033
26. Hjuler ML, Fabricius I. Engineering properties of chalk related to diagenetic variations in the Upper Cretaceous onshore and offshore chalk in the North Sea Area. J Petrol Sci Engin. (2009) 68:151–70. doi: 10.1016/j.petrol.2009.06.005
28. Fjær E, Holt RM, Horsrud P, Raaen AM, Risnes R. Petroleum Related Rock Mechanics, 2nd Edn. Amsterdam: Elsevier (2008). p. 491
29. Korsnes RI, Madland MV, Austad T, Haver S, Røsland G. The effects of temperature on the water weakening of chalk by seawater. J Petrol Sci Engin. (2008) 60:183–93. doi: 10.1016/j.petrol.2007.06.001
30. Omdal E. The Mechanical Behavior of Chalk Under Laboratory Conditions Simulating Reservoir Operations (Phd Thesis). Stavanger: University of Stavanger (2010).
32. Andersen MA, Foged N, Pedersen HF. The Rate-Type Compaction of Weak North Sea Chalk. Alexandria, VI: American Rock Mechanics Association (1992). 253–61 pp.
35. Stumpf MPH, Porter MA. Critical truths about power laws. Science (2012) 335:665–6. doi: 10.1126/science.1216142
36. Pedersen J, Vinningland JL, Jettestuen E, Madland, MV, Hiorth A. Pore scale modeling of brine dependent pore space evolution in carbonates. (2013) SPE 164849:1–10. doi: 10.2118/164849-ms
37. Karoussi O, Hamouda AA. Imbibition of sulfate and magnesium ions into carbonate rocks at elevated temperatures and their influence on wettability alteration and oil recovery. Energy Fuels (2007) 21:2138–46. doi: 10.1021/ef0605246
38. Hiorth A, Jettestuen E, Cathles LM, Madland MV. Precipitation, dissolution, and ion exchange processes coupled with a lattice Boltzmann advection diffusion solver. Geochim Cosmochim Acta (2013) 104:99–110. doi: 10.106/j.gca.2012.11.019
39. Andersen PO, Evje S, Madland MV, Hiorth A. A geochemical model for interpretation of chalk core flooding experiments. Chem Eng Sci. (2012) 84:218–41. doi: 10.1016/j.ces.2012.08.038
40. Nermoen A, Korsnes RI, Christensen HF, Trads N, Hiorth A, Madland MV. Measuring the Biot Stress Coefficient and Its Implications on the Effective Stress Estimate, Vol. 13–282. San Francisco: ARMA. (2013) 1–9 p.
41. Goren L, Toussaint R, Aharonov E, Sparks DW, Flekkøy E. A general criterion for liquefaction in granular layers with heterogeneous pore pressure. In: Fifth Biot Conference on Poromechanics Vienna (2013).
42. Niebling M, Flekkøy EG, Måløy KJ, Toussaint R. Mixing of a granular layer falling through a fluid. Phys Rev E (2010) 82:011301. doi: 10.1103/PhysRevE.82.011301
43. Alam MM, Fabricius IL, Christensen HF. Static and dynamic effective stress coefficient of chalk. Geophysics (2012) 77:2. doi: 10.1190/GEO2010-0414.1
44. Szymczak P, Ladd A. Wormhole formation in dissolving fractures. J Geophys Res. (2009) 114:B06203. doi: 10.1029/2008JB006122
45. Baud P, Wong T-F. Compaction localization in porous sandstones: spatial evolution of damage and acoustic emission activity. J Struct Geol. (2004) 26:603–24. doi: 10.1016/j.jsg.2003.09.002
Keywords: chalk, physicochemical processes, tri-axial, compaction, flow-through experiments
Citation: Nermoen A, Korsnes RI, Aursjø O, Madland MV, Kjørslevik TAC and Østensen G (2016) How Stress and Temperature Conditions Affect Rock-Fluid Chemistry and Mechanical Deformation. Front. Phys. 4:2. doi: 10.3389/fphy.2016.00002
Received: 15 May 2015; Accepted: 07 January 2016;
Published: 02 February 2016.
Edited by:
Daniel Koehn, University of Glasgow, UKReviewed by:
Renaud Toussaint, University of Strasbourg, FranceFrancois Renard, Joseph Fourier University, France
Copyright © 2016 Nermoen, Korsnes, Aursjø, Madland, Kjørslevik and Østensen. This is an open-access article distributed under the terms of the Creative Commons Attribution License (CC BY). The use, distribution or reproduction in other forums is permitted, provided the original author(s) or licensor are credited and that the original publication in this journal is cited, in accordance with accepted academic practice. No use, distribution or reproduction is permitted which does not comply with these terms.
*Correspondence: Anders Nermoen, aner@iris.no