P-Values: Misunderstood and Misused
 Bertie Vidgen
 Taha Yasseri
- Oxford Internet Institute, University of Oxford, Oxford, UK
P-values are widely used in both the social and natural sciences to quantify the statistical significance of observed results. The recent surge of big data research has made the p-value an even more popular tool to test the significance of a study. However, substantial literature has been produced critiquing how p-values are used and understood. In this paper we review this recent critical literature, much of which is routed in the life sciences, and consider its implications for social scientific research. We provide a coherent picture of what the main criticisms are, and draw together and disambiguate common themes. In particular, we explain how the False Discovery Rate (FDR) is calculated, and how this differs from a p-value. We also make explicit the Bayesian nature of many recent criticisms, a dimension that is often underplayed or ignored. We conclude by identifying practical steps to help remediate some of the concerns identified. We recommend that (i) far lower significance levels are used, such as 0.01 or 0.001, and (ii) p-values are interpreted contextually, and situated within both the findings of the individual study and the broader field of inquiry (through, for example, meta-analyses).
1. Introduction
P-values are widely used in both the social and natural sciences to quantify the statistical significance of observed results. Obtaining a p-value that indicates “statistical significance” is often a requirement for publishing in a top journal. The emergence of computational social science, which relies mostly on analyzing large scale datasets, has increased the popularity of p-values even further. However, critics contend that p-values are routinely misunderstood and misused by many practitioners, and that even when understood correctly they are an ineffective metric: the standard significance level of 0.05 produces an overall FDR that is far higher, more like 30%. Others argue that p-values can be easily “hacked” to indicate statistical significance when none exists, and that they encourage the selective reporting of only positive results.
Considerable research exists into how p-values are (mis)used, [e.g., 1, 2]. In this paper we review the recent critical literature on p-values, much of which is routed in the life sciences, and consider its implications for social scientific research. We provide a coherent picture of what the main criticisms are, and draw together and disambiguate common themes. In particular, we explain how the FDR is calculated, and how this differs from a p-value. We also make explicit the Bayesian nature of many recent criticisms. In the final section we identify practical steps to help remediate some of the concerns identified.
P-values are used in Null Hypothesis Significance Testing (NHST) to decide whether to accept or reject a null hypothesis (which typically states that there is no underlying relationship between two variables). If the null hypothesis is rejected, this gives grounds for accepting the alternative hypothesis (that a relationship does exist between two variables). The p-value quantifies the probability of observing results at least as extreme as the ones observed given that the null hypothesis is true. It is then compared against a pre-determined significance level (α). If the reported p-value is smaller than α the result is considered statistically significant. Typically, in the social sciences α is set at 0.05. Other commonly used significance levels are 0.01 and 0.001.
In his seminal paper, “The Earth is Round (p < .05)” Cohen argues that NHST is highly flawed: it is relatively easy to achieve results that can be labeled significant when a “nil” hypothesis (where the effect size of H0 is set at zero) is used rather than a true “null” hypothesis (where the direction of the effect, or even the effect size, is specified) [3]. This problem is particularly acute in the context of “big data” exploratory studies, where researchers only seek statistical associations rather than causal relationships. If a large enough number of variables are examined, effectively meaning that a large number of null/alternative hypotheses are specified, then it is highly likely that at least some “statistically significant” results will be identified, irrespective of whether the underlying relationships are truly meaningful. As big data approaches become more common this issue will become both far more pertinent and problematic, with the robustness of many “statistically significant” findings being highly limited.
Lew argues that the central problem with NHST is reflected in its hybrid name, which is a combination of (i) hypothesis testing and (ii) significance testing [4]. In significance testing, first developed by Ronald Fisher in the 1920s, the p-value provides an index of the evidence against the null hypothesis. Originally, Fisher only intended for the p-value to establish whether further research into a phenomenon could be justified. He saw it as one bit of evidence to either support or challenge accepting the null hypothesis, rather than as conclusive evidence of significance [5; see also 6, 7]. In contrast, hypothesis tests, developed separately by Neyman and Pearson, replace Fisher's subjectivist interpretation of the p-value with a hard and fast “decision rule”: when the p-value is less than α, the null can be rejected and the alternative hypothesis accepted. Though this approach is simpler to apply and understand, a crucial stipulation of it is that a precise alternative hypothesis must be specified [6]. This means indicating what the expected effect size is (thereby setting a nil rather than a null hypothesis)—something that most researchers rarely do [3].
Though hypothesis tests and significance tests are distinct statistical procedures, and there is much disagreement about whether they can be reconciled into one coherent framework, NHST is widely used as a pragmatic amalgam for conducting research [8, 9]. Hulbert and Lombardi argue that one of the biggest issues with NHST is that it encourages the use of terminology such as significant/nonsignificant. This dichotomizes the p-value on an arbitrary basis, and converts a probability into a certainty. This is unhelpful when the purpose of using statistics, as is typically the case in academic studies, is to weigh up evidence incrementally rather than make an immediate decision [9, p. 315]. Hulbert and Lombardi's analysis suggests that the real problem lies not with p-values, but with α and how this has led to p-values being interpreted dichotomously: too much importance is attached to the arbitrary cutoff α ≤ 0.05.
2. The False Discovery Rate
A p-value of 0.05 is normally interpreted to mean that there is a 1 in 20 chance that the observed results are nonsignificant, having occurred even though no underlying relationship exists. Most people then think that the overall proportion of results that are false positives is also 0.05. However, this interpretation confuses the p-value (which, in the long run, will approximately correspond to the type I error rate) with the FDR. The FDR is what people usually mean when they refer to the error rate: it is the proportion of reported discoveries that are false positives. Though 0.05 might seem a reasonable level of inaccuracy, a type I error rate of 0.05 will likely produce an FDR that is far higher, easily 30% or more. The formula for FDR is:
Calculating the number of true positives and false positives requires knowing more than just the type I error rate, but also (i) the statistical power, or “sensitivity,” of tests and (ii) the prevalence of effects [10]. Statistical power is the probability that each test will correctly reject the null hypothesis when the alternative hypothesis is true. As such, tests with higher power are more likely to correctly record real effects. Prevalence is the number of effects, out of all the effects that are tested for, that actually exist in the real world. In the FDR calculation it determines the weighting given to the power and the type I error rate. Low prevalence contributes to a higher FDR as it increases the likelihood that false positives will be recorded. The calculation for FDR therefore is:
The percentage of reported positives that are actually true is called the Positive Predictive Value (PPV). The PPV and FDR are inversely related, such that a higher PPV necessarily means a lower FDR. To calculate the FDR we subtract the PPV from 1. If there are no false positives then PPV = 1 and FDR = 0. Table 1 shows how low prevalence of effects, low power, and a high type I error rate all contribute to a high FDR.
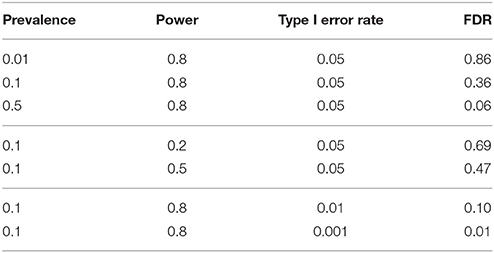
Table 1. Greater prevalence, greater power, and a lower Type I error rate reduce the FDR.
Most estimates of the FDR are surprisingly large; e.g., 50 [1, 11, 12] or 36% [10]. Jager and Leek more optimistically suggest that it is just 14% [13]. This lower estimate can be explained somewhat by the fact that they only use p-values reported in abstracts, and have a different algorithm to the other studies. Importantly, they highlight that whilst α is normally set to 0.05, many studies—particularly in the life sciences—achieve p-values far lower than this, meaning that the average type I error rate is less than α of 0.05 [13, p. 7]. Counterbalancing this, however, is Colquhoun's argument that because most studies are not “properly designed” (in the sense that treatments are not randomly allocated to groups and in RCTs assessments are not blinded) statistical power will often be far lower than reported—thereby driving the FDR back up again [10].
Thus, though difficult to calculate precisely, the evidence suggests that the FDR of findings overall is far higher than α of 0.05. This suggests that too much trust is placed in current research, much of which is wrong far more often than we think. It is also worth noting that this analysis assumes that researchers do not intentionally misreport or manipulate results to erroneously achieve statistical significance. These phenomena, known as “selective reporting” and “p-hacking,” are considered separately in Section 4.
3. Prevalence and Bayes
As noted above, the prevalence of effects significantly impacts the FDR, whereby lower prevalence increases the likelihood that reported effects are false positives. Yet prevalence is not controlled by the researcher and, furthermore, cannot be calculated with any reliable accuracy. There is no way of knowing objectively what the underlying prevalence of real effects is. Indeed, the tools by which we might hope to find out this information (such as NHST) are precisely what have been criticized in the literature surveyed here. Instead, to calculate the FDR, prevalence has to be estimated1. In this regard, FDR calculations are inherently Bayesian as they require the researcher to quantify their subjective belief about a phenomenon (in this instance, the underlying prevalence of real effects).
Bayesian theory is an alternative paradigm of statistical inference to frequentism, of which NHST is part of. Whereas, frequentists quantify the probability of the data given the null hypothesis (P(D|H0)), Bayesians calculate the probability of the hypothesis given the data (P(H1|D)). Though frequentism is far more widely practiced than Bayesianism, Bayesian inference is more intuitive: it assigns a probability to a hypothesis based on how likely we think it to be true.
The FDR calculations outlined above in Section 2 follow a Bayesian logic. First, a probability is assigned to the prior likelihood of a result being false (1 − prevalence). Then, new information (the statistical power and type I error rate) is incorporated to calculate a posterior probability (the FDR). A common criticism against Bayesian methods such as this is that they are insufficiently objective as the prior probability is only a guess. Whilst this is correct, the large number of “findings” produced each year, as well as the low rates of replicability [14], suggest that the prevalence of effects is, overall, fairly low. Another criticism against Bayesian inference is that it is overly conservative: assigning a low value to the prior probability makes it more likely that the posterior probability will also be low [15]. These criticisms not withstanding, Bayesian theory offers a useful way of quantifying how likely it is that research findings are true.
Not all of the authors in the literature reviewed here explicitly state that their arguments are Bayesian. The reason for this is best articulated by Colquhoun, who writes that “the description ‘Bayesian’ is not wrong but it is not necessary” [10, p. 5]. The lack of attention paid to Bayes in Ioannidis' well-regarded early article on p-values is particularly surprising given his use of Bayesian terminology: “the probability that a research finding is true depends on the prior probability of it being true (before doing the study)” [1, p. 696]. This perhaps reflects the uncertain position that Bayesianism holds in most universities, and the acrimonious nature of its relationship with frequentism [16]. Without commenting on the broader applicability of Bayesian statistical inference, we argue that a Bayesian methodology has great utility in assessing the overall credibility of academic research, and that it has received insufficient attention in previous studies. Here, we have sought to make visible, and to rectify, this oversight.
4. Publication Bias: Selective Reporting and P-Hacking
Selective reporting and p-hacking are two types of researcher-driven publication bias. Selective reporting is where nonsignificant (but methodologically robust) results are not reported, often because top journals consider them to be less interesting or important [17]. This skews the distribution of reported results toward positive findings, and arguably further increases the pressure on researchers to achieve statistical significance. Another form of publication bias, which also skews results toward positive findings, is called p-hacking. Head et al. define p-hacking as “when researchers collect or select data or statistical analyses until nonsignificant results become significant” [18]. This is direct manipulation of results so that, whilst they may not be technically false, they are unrepresentative of the underlying phenomena. See Figure 1 for a satirical illustration.
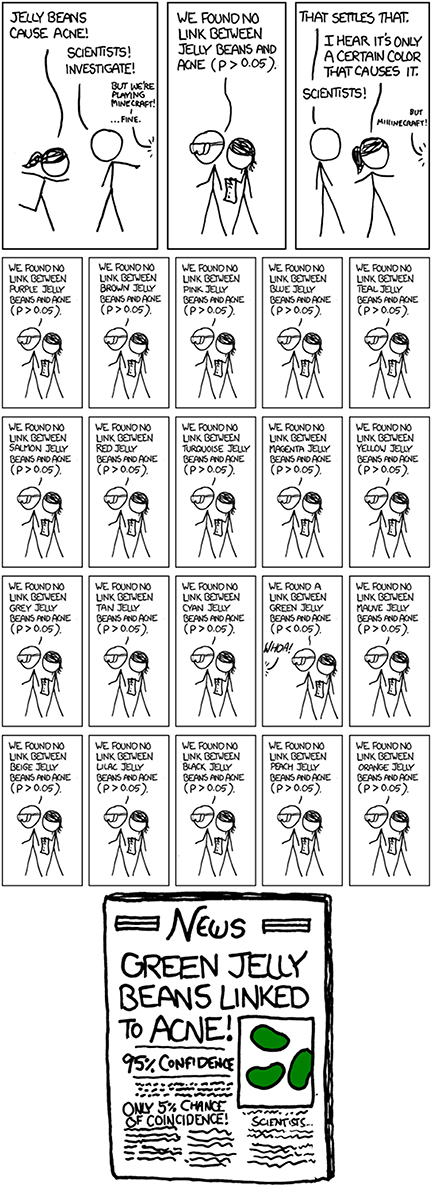
Figure 1. “Significant”: an illustration of selective reporting and statistical significance from XKCD. Available online at http://xkcd.com/882/ (Accessed February 16, 2016).
Head et al. outline specific mechanisms by which p-values are intentionally “hacked.” These include: (i) conducting analyse midway through experiments, (ii) recording many response variables and only deciding which to report postanalysis, (iii) excluding, combining, or splitting treatment groups postanalysis, (iv) including or excluding covariates postanalysis, (v) stopping data exploration if analysis yields a significant p-value. An excellent demonstration of how p-values can be hacked by manipulating the parameters of an experiment is Christie Aschwanden's interactive “Hack Your Way to Scientific Glory” [19]. This simulator, which analyses whether Republicans or Democrats being in office affects the US economy, shows how tests can be manipulated to produce statistically significant results supporting either parties.
In separate papers, Head et al. [18], and de Winter and Dodou [20] each examine the distributions of p-values that are reported in scientific publications in different disciplines. It is reported that there are considerably more studies reporting alpha just below the 0.05 significance level than above it (and considerably more than would be expected given the number of p-values that occur in other ranges), which suggests that p-hacking is taking place. This core finding is supported by Jager and Leek's study on “significant” publications as well [13].
5. What To Do
We argued above that a Bayesian approach is useful to estimate the FDR and assess the overall trustworthiness of academic findings. However, this does not mean that we also hold that Bayesian statistics should replace frequentist statistics more generally in empirical research [see: 21]. In this concluding section we recommend some pragmatic changes to current (frequentist) research practices that could lower the FDR and thus improve the credibility of findings.
Unfortunately, researchers cannot control how prevalent effects are. They only have direct influence over their study's α and its statistical power. Thus, one step to reduce the FDR is to make the norms for these more rigorous, such as by increasing the statistical power of studies. We strongly recommend that α of 0.05 is dropped as a convention, and replaced with a far lower α as standard, such as 0.01 or 0.001; see Table 1. Other suggestions for improving the quality of statistical significance reporting include using confidence intervals [7, p. 152]. Some have also called for researchers to focus more on effect sizes than statistical significance [22, 23], arguing that statistically significant studies that have negligible effect sizes should be treated with greater skepticism. This is of particular importance in the context of big data studies, where many “statistically significant” studies report small effect sizes as the association between the dependent and independent variables is very weak.
Perhaps more important than any specific technical change in how data is analyzed is the growing consensus that research processes need to be implemented (and recorded) more transparently. Nuzzo, for example, argues that “one of the strongest protections for scientists is to admit everything” [7, p. 152]. Head et al. also suggest that labeling research as either exploratory or confirmatory will help readers to interpret the results more faithfully [18, p. 12]. Weissgerber et al. encourage researchers to provide “a more complete presentation of data,” beyond summary statistics [24]. Improving transparency is particularly important in “big” data-mining studies, given that the boundary between data exploration (a legitimate exercise) and p-hacking is often hard to identify, creating significant potential for intentional or unintentional manipulation of results. Several commentators have recommended that researchers pre-register all studies with initiatives such as the Open Science Framework [1, 7, 14, 18, 25]. Pre-registering ensures that a record is kept of the proposed method, effect size measurement, and what sort of results will be considered noteworthy. Any deviation from what is initially registered would then need to be justified, which would give the results greater credibility. Journals could also proactively assist researchers to improve transparency by providing platforms on which data and code can be shared, thus allowing external researchers to reproduce a study's findings and trace the method used [18]. This would provide academics with the practical means to corroborate or challenge previous findings.
Scientific knowledge advances through corroboration and incremental progress. In keeping with Fisher's initial view that p-values should be one part of the evidence used when deciding whether to reject the null hypothesis, our final suggestion is that the findings of any single study should always be contextualized within the broader field of research. Thus, we endorse the view offered in a recent editorial of Psychological Science that we should be extra skeptical about studies where (a) the statistical power is low, (b) the p-value is only slightly below 0.05, and (c) the result is surprising [14]. Normally, findings are only accepted once they have been corroborated through multiple studies, and even in individual studies it is common to “triangulate” a result with multiple methods and/or data sets. This offers one way of remediating the problem that even “statistically significant” results can be false; if multiple studies find an effect then it is more likely that it truly exists. We therefore, also support the collation and organization of research findings in meta-analyses as these enable researchers to quickly evaluate a large range of relevant evidence.
Author Contributions
All authors listed, have made substantial, direct and intellectual contribution to the work, and approved it for publication.
Conflict of Interest Statement
The authors declare that the research was conducted in the absence of any commercial or financial relationships that could be construed as a potential conflict of interest.
Acknowledgments
For providing useful feedback on the original manuscript we thank Jonathan Bright, Sandra Wachter, Patricia L. Mabry, and Richard Vidgen.
Footnotes
1. ^In much of the recent literature it is assumed that prevalence is very low, around 0.1 or 0.2 [1, 10, 11, 12].
References
1. Ioannidis, J. Why most published research findings are false. PLoS Med. (2005) 2:e124. doi: 10.1371/journal.pmed.0020124
2. Ziliak, ST, McCloskey DN. The Cult of Statistical Significance: How the Standard Error Costs us Jobs, Justice, and Lives. Ann Arbor, MI: University of Michigan Press (2008).
4. Lew MJ. To P or not to P: on the evidential nature of P-values and their place in scientific inference. arXiv preprint arXiv:13110081 (2013).
5. Fisher RA. Statistical Methods for Research Workers. Edinburgh: Genesis Publishing Pvt. Ltd. (1925).
6. Sterne JA, Smith GD. Sifting the evidence–what's wrong with significance tests? BMJ (2001) 322:226–31. doi: 10.1136/bmj.322.7280.226
8. Berger JO. Could fisher, jeffreys and neyman have agreed on testing? Stat Sci. (2003) 18:1–32. doi: 10.1214/ss/1056397485
9. Hurlbert SH, Lombardi CM. Final collapse of the Neyman-Pearson decision theoretic framework and rise of the neoFisherian. Ann Zool Fenn. (2009) 46:311–49. doi: 10.5735/086.046.0501
10. Colquhoun D. An investigation of the false discovery rate and the misinterpretation of p-values. R Soc Open Sci. (2014) 1:140216. doi: 10.1098/rsos.140216
11. Biau DJ, Jolles BM, Porcher R. P value and the theory of hypothesis testing: an explanation for new researchers. Clin Orthop Relat Res. (2010) 468:885–92. doi: 10.1007/s11999-009-1164-4
12. Freedman LP, Cockburn IM, Simcoe TS. The economics of reproducibility in preclinical research. PLoS Biol. (2015) 13:e1002165. doi: 10.1371/journal.pbio.1002165
13. Jager LR, Leek JT. An estimate of the science-wise false discovery rate and application to the top medical literature. Biostatistics (2014) 15:1–12. doi: 10.1093/biostatistics/kxt007
14. Lindsay DS. Replication in psychological science. Psychol Sci. (2015). 26:1827–32. doi: 10.1177/0956797615616374
15. Gelman A. Objections to Bayesian statistics. Bayesian Anal. (2008) 3:445–9. doi: 10.1214/08-BA318
16. McGrayne SB. The Theory that Would not Die: How Bayes' Rule Cracked the Enigma Code, Hunted Down Russian Submarines, & Emerged Triumphant from Two Centuries of Controversy. New Haven, CT: Yale University Press (2011).
17. Franco A, Malhotra N, Simonovits G. Publication bias in the social sciences: unlocking the file drawer. Science (2014) 345:1502–5. doi: 10.1126/science.1255484
18. Head ML, Holman L, Lanfear R, Kahn AT, Jennions, MD. The extent and consequences of P-Hacking in science. PLoS Biol. (2015) 13:e1002106. doi: 10.1371/journal.pbio.1002106
19. Aschwanden C. Science Isn't Broken, Five Thirty Eight. Available online at: http://fivethirtyeightcom/features/science-isnt-broken/ (Accessed January 22, 2016), (2015).
20. de Winter JC, and Dodou D. A surge of p-values between 0.041 and 0.049 in recent decades (but negative results are increasing rapidly too). PeerJ (2015) 3:e733. doi: 10.7287/peerj.preprints.447v4
21. Simonsohn U. Posterior-Hacking: Selective Reporting Invalidates Bayesian Results Also. Philadelphia, PA: University of Pennsylvania, The Wharton School; Draft Paper (2014).
22. Coe R. It's the effect size, stupid: what effect size is and why it is important. In: Paper Presented at the British Educational Research Association Annual Conference. Exeter (2002).
23. Sullivan GM, Feinn, R. Using effect size-or why the P value is not enough. J Grad Med Educ. (2012) 4:279–82. doi: 10.4300/JGME-D-12-00156.1
24. Weissgerber TL, Milic NM, Winham SJ, Garovic VD. Beyond bar and line graphs: time for a new data presentation paradigm. PLoS Biol. (2015) 13:e1002128. doi: 10.1371/journal.pbio.1002128
25. Peplow M. Social sciences suffer from severe publication bias. Nature (2014). doi: 10.1038/nature.2014.15787. Available online at: http://www.nature.com/news/social-sciences-suffer-from-severe-publication-bias-1.15787
Keywords: p-value, statistics, significance, p-hacking, prevalence, Bayes, big data
Citation: Vidgen B and Yasseri T (2016) P-Values: Misunderstood and Misused. Front. Phys. 4:6. doi: 10.3389/fphy.2016.00006
Received: 25 January 2016; Accepted: 19 February 2016;
Published: 04 March 2016.
Edited by:
Matjaž Perc, University of Maribor, SloveniaReviewed by:
Haroldo Valentin Ribeiro, Universidade Estadual de Maringá, BrazilMegan Head, Australian National University, Australia
Copyright © 2016 Vidgen and Yasseri. This is an open-access article distributed under the terms of the Creative Commons Attribution License (CC BY). The use, distribution or reproduction in other forums is permitted, provided the original author(s) or licensor are credited and that the original publication in this journal is cited, in accordance with accepted academic practice. No use, distribution or reproduction is permitted which does not comply with these terms.
*Correspondence: Taha Yasseri, taha.yasseri@oii.ox.ac.uk