Analysis of the Heat Capacity for Pure CH4 and CH4/CCl4 on Graphite Near the Melting Point and Calculation of the T–X Phase Diagram for (CH3)CCl3+CCl4
 Hamit Yurtseven*
  Aygül Yilmaz
- Department of Physics, Middle East Technical University, Ankara, Turkey
We study the temperature dependence of the heat capacity Cp for the pure CH4 and the coadsorbed CH4/CCl4 on graphite near the melting point. The heat capacity peaks are analyzed using the experimental data from the literature by means of the power-law formula. The critical exponents for the heat capacity are deduced below and above the melting point for CH4 (Tm = 104.8 K) and CH4/CCl4 (Tm = 99.2 K). Our exponent values are larger as compared with the predicted values of some theoretical models exhibiting second order transition. Our analyses indicate that the pure methane shows a nearly second order (weak discontinuity in the heat capacity peak), whereas the transition in coadsorbed CH4/CCl4 is of first order (apparent discontinuity in Cp). We also study the T–X phase diagram of a two-component system of CH3CCl3+CCl4 using the Landau phenomenological model. Phase lines of the R+L (rhombohedral + liquid) and FCC+L (face-centered cubic + liquid) are calculated using the observed T–X phase diagram of this binary mixture. Our results show that the Landau mean field theory describes the observed behavior of CH3CCl3+CCl4 adequately. From the calculated T–X phase diagram, critical behavior of some thermodynamic quantities can be predicted at various temperatures and concentrations (CCl4) for a binary mixture of CH3CCl3+CCl4.
Introduction
Coadsorption systems involving a preadsorbed monolayer of a highly condensable material such as CCl4, SF6, or C6H12 with an inert gas species (Kr, CH4, or Xe), have been the subject of a number of studies [1–6]. Thermodynamic and structural characterization of krypton absorption at 79 K on [001] graphite preplated with CCl4 have been conducted by the volumetric measurements and X-ray diffraction [7]. Also, physisorption of xenon on the [0001] graphite covered with sulfur hexafluoride (SF6) has been studied between 80 and 112 K by a volumetric method [1]. Those systems exhibit displacement since the preadsorbate film is displaced off the graphite surface by the weakly interacting gas species [8].
Among those systems, CH4 on graphite with a saturated monolayer of CCl4 has been studied between 70 and 115 K [8]. Previously, the observed displacement of CCl4 by CH4 at 77 K has been obtained with the CH4 component reaching monolayer density continuously [3]. Thus, the displacement CCl4 occurs when the CH4 concentration continuously increases. There are several experimental techniques to study the coadsorption systems, such as volumetric isotherm and calorimetry measurements to detect phase transitions, and X-ray and neutron diffraction [3] to investigate the structure of the film. From the volumetric and calorimetry measurements, it has been observed that the characteristic heat capacity peaks fall along the phase boundary [8]. In many adsorbed systems, heat capacity peaks have been observed to occur near the triple-point temperature of the bulk adsorbate [9].
In the case of methane (CH4), the heat capacity Cp tends to exhibit less discontinuity or more continuous behavior prior to melting as it occurs in some molecular crystals such as CCl4 [10]. High–pressure measurements in the solid phase and in the melting zone of CCl4 have been reported previously [11]. Its rhombohedral modification is stable between the melting point and the transition temperature, namely, (CH3)nCCl4−n where n varies from 0 to 4 [12]. Crystalline carbon tetrachloride, CCl4 (n = 0), is orientationally disordered between its melting point (250 K) and 225 K [12]. Four phases of CCl4 have been identified experimentally [12–14] with the phase diagram of the melting curves [15, 16]. It has been observed experimentally that the thermodynamic quantities like the thermal expansion, isothermal compressibility, and the specific heat diverge as approaching the melting point in those molecular crystals, in particular, the thermal expansion of CCl4 at various pressures diverges close to the melting point, as observed experimentally, which is closely a second order transition prior the melting [10]. By analyzing the experimental data for the thermal expansion [10], we have examined the Pippard relations [17–19] and we have calculated the molar volume [20] for CCl4 in our earlier studies.
Phase transitions in methane (CH4) coadsorbed on graphite with a saturated monolayer of carbon tetrachloride (CCl4) has been studied experimentally by the calorimetric-volumetric measurements between 70 and 115 K [8], as stated above. At low temperatures, it has been observed that with the multilayer structure, the phase diagram shows measurable differences from the pure CH4 data, whereas at higher temperatures, a new first order transition has been observed for CH4/CCl4, and a phase diagram for CH4 on graphite coated with a saturated monolayer of CCl4 including pure CH4, mixed liquid phase, CCl4/CH4 mixture, and solid CCl4 monolayer has been proposed [8].
In regard to the two-component system of CCl4+CBrCl3, its phase diagram has been determined experimentally by X-ray powder diffraction and thermal analysis techniques from 200 K to the liquid state [21]. Similarly, T–X phase diagram of a two-component system of CH3CCl3+CCl4 (methyl chloroform + carbon tetrachloride) has been obtained from differential scanning calorimetric (DSC) measurements, consisting of two continuous solid solutions corresponding to stable and metastable mixed crystals [22]. Methylchloromethanes crystallize to the two orientationally disordered (OD) phases with two melting points, as obtained from the X-ray diffraction and DSC measurements [23, 24]. Both OD phases, namely, stable (rhombohedral) and metastable (face-centered cubic, FCC) phases have been studied by the measurements of optical birefringence [25], Raman [26], and Brillouin scattering [27, 28]. Birefringence measurements have also been conducted for the mixed non-cubic orientationally disordered (OD) crystals of CH3CCl3+CCl4 [29] and (CH3)2CCl2+CCl4 [30]. In particular, for the methyl chloroform—carbon tetrachloride by analyzing the concentration dependence of the birefringence the orientational order parameters of axially symmetric molecules have been calculated in this two-component plastic crystal [29]. Orientational order in this system has been studied by 1H NMR spectroscopy [31]. They calculated the order parameters from birefringence using a phenomenological theory developed by Vuks [32]. Also, observations in polarized light indicate that mixtures of CCl4 and methyl chloroform consist of solid solutions over all range of concentrations with the metastable cubic phase and the stable non-cubic phase [29]. When the CCl4 monolayer is preadsorbed on graphite, there occurs a phase transition before the CCl4 displacement in the CH4/CCl4 solid solution near the melting point similar to the commensurate-incommensurate transition occurring in a two-dimensional kyripton-CCl4 solid solution [7]. Also, methylchloroform—carbon tetrachloride (CH3CCl3+CCl4) exhibits phase transition with the two orientationally disordered (OD) phases near the melting points, as stated above. For both solid solutions, namely CH4/CCl4 and CH3CCl3+CCl4 phase transitions are usually of first order near the melting point. A first order transition occurring in those mixtures tends to be replaced by a second order one.
It is of interest to investigate the phase transitions in those mixtures in terms of the specific heat response when the disorder is present (CH4/CCl4), as also studied previously for smectic liquid crystals [33, 34]. The crossover behavior can be realized as the ordering increases below the critical temperature (Tc) when the temperature decreases for the mixtures of CH4/CCl4 and CH3CCl3+CCl4. Thermodynamic and structural characterization of CH4/CCl4 on graphite and of CH3CCl3+CCl4 can be studied. A first order transition in the mixture of CH4/CCl4 which becomes a weak first order or nearly second order transition in pure methane (CH4), can be detected. Also, thermodynamic and structural characterization of the solid solution CH3CCl3+CCl4 can be investigated by obtaining the phase lines (boundaries) in the phase diagram (T–X) in this mixture. For the characterization of the phase transition (first order or second order) in those two mixtures (CH4/CCl4 and CH3CCl3+CCl4), analysis of the experimental data can be conducted. In some earlier studies, different aspects of the phase transitions occurring in CH4/CCl4 coadsorption system and in a two-component system of CH3CCl3+CCl4 have been reported, as stated above. In the present work, by analyzing the experimental data reported in the literature, the first order or second order nature of the phase transition that those mixtures undergo is investigated. In the case of CH4/CCl4 mixture, this analysis is due the specific heat near the melting point. For CH3CC3+CCl4, the T–X phase diagram is calculated using the Landau phenomenological theory. By calculating the phase line equations of the phases studied in the T–X phase diagram in this two-component system, temperature and concentration dependence of some other thermodynamic quantities such as specific heat, thermal expansion, isothermal compressibility, order parameter, susceptibility etc. can be predicted. Then, the critical behavior of all those thermodynamic quantities near the critical or melting point can then characterize a first order or second order nature of the phase transitions in CH4/CCl4 and CH3CCl3+CCl4. This is the motivation of our study given here.
In order to investigate the phase transitions, in particular, coadsorption phase diagram for CH4/CCl4 on graphite and also for a two-component system of CH3CCl3+CCl4 as we study here, thermodynamic data provide a good deal of information at various temperatures and concentrations. Particularly, in the case of the CH4/CCl4 coadsorption system, measurements of the specific heat Cp lead to the construction of the chemical potential versus temperature phase diagram as studied previously [8]. In order to examine the kind of phase transition occurring in this coadsorption system, measurements of the heat capacity near the melting point can be analyzed. Also, the T–X phase diagram of the two-component system of CH3CCl3+CCl4 can be calculated with the orientationally disordered (OD) stable and metastable phases on the basis of the experimental phase diagram, as stated above. The phase boundaries of the two different structurally ordered mixed crystals which are formed by the same molecules, can be calculated with the stable rhombohedral (R) + liquid (L) and metastable face-centered cubic (FCC) + liquid (L) equilibria for the two-component system of CH3CCl3+CCl4.
Here, in the first part of our study, we analyze the observed heat capacity data [8] using a power-law formula near the melting point for CH4 on graphite coated with a saturated monolayer of CCl4 including pure CH4 and CH4/CCl4 mixture. Values of the critical exponents above and below the melting temperature for pure CH4 (Tm = 104.81 K) and for a mixture of CH4/CCl4 (Tm = 99.16 K), are deduced from our analysis. In the second part of our study, we calculate the T–X phase diagram of CH3CCl3+CCl4 using the experimental phase diagram [22] by means of the mean field theory.
Below, we give our analysis of the heat capacity in Section Analysis and Results. In Section Calculation of the T–X Phase Diagram for (CH3)CCl3+CCl4, calculation of the T–X phase diagram is given. In Section Discussion, we discuss our results. Finally, our conclusions are given in Section Conclusions.
Analysis and Results
The heat capacity Cp can be expressed as a function of temperature near the melting point according to a power-law formula,
where γ is a critical exponent for the heat capacity and A is the amplitude. Tm denotes the melting temperature. Equation (1) can be written in the logarithmic form as
The experimental Cp data [8] were analyzed at various temperatures for pure CH4 and CH4/CCl4 according to Equation (1) below (T < Tm) and above (T > Tm) the melting temperature (Tm = 104.80 K). We give in Figures 1, 2. ln Cp against ln (Tm − T) (Equation 2) below and above Tm, respectively for pure CH4. Table 1 gives the values of the critical exponent γ′ and the amplitude A′ (T < Tm) and, γ and A (T > Tm) within the temperature intervals indicated for pure CH4.
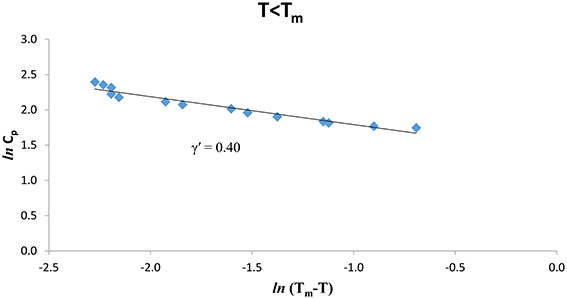
Figure 1. lnCp against ln(Tm – T) for T < Tm according to Equation (2) for pure CH4 using the experimental data [8].
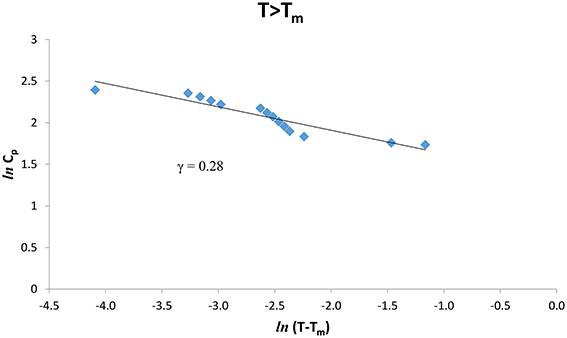
Figure 2. lnCp against ln(T − Tm) for T > Tm according to Equation (2) for pure CH4 using the experimental data [8].
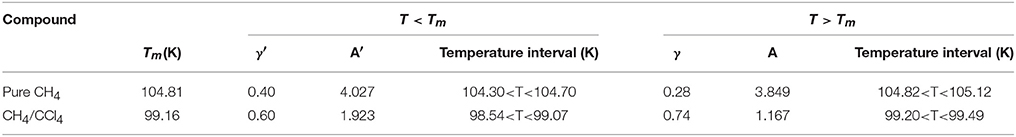
Table 1. Values of the critical exponent γ′ (T < Tm) and γ (T > Tm) with the amplitudes A′ and A, respectively, for the heat capacity Cp for pure CH4 and CH4/CCl4 within the temperature intervals indicated according to Equation (2) using the observed data [8].
We also analyzed the observed Cp data [8] of CH4/CCl4 as a function of the temperature below and above Tm (= 99.16°K), Figures 3, 4 give our lnCp vs. ln(T − Tm) plots for (T < Tm) and (T > Tm), respectively, according to Equation (2) for CH4/CCl4. In Table 1, values of the critical exponent γ′ and A′ (T < Tm) with those of γ and A (T > Tm) are given within the temperature intervals indicated for CH4/CCl4.
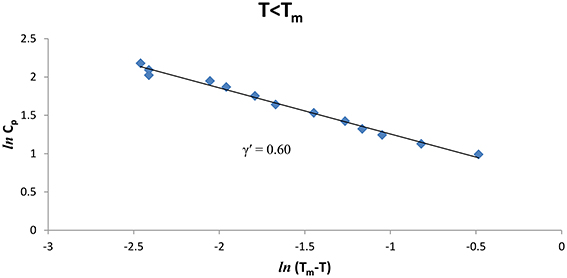
Figure 3. lnCp against ln(Tm − T) for CH4/CCl4 (T < Tm) using the experimental data [8].
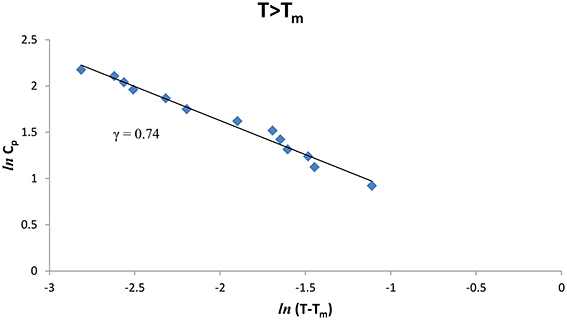
Figure 4. lnCp against ln(T − Tm) for CH4/CCl4 (T > Tm) using the experimental data [8].
Calculation of the T–X Phase Diagram for (CH3)CCl3+CCl4
The T–X phase diagram of a binary mixture of methylchloroform + carbontetrachloride, CH3CCl3+CCl4, can be calculated using the Landau mean field theory. By expanding the free energy in terms of the orientationally disordered (OD) parameter for the rhombohedral (R) phase and in terms of the orientationally ordered (OO) parameter of the face-centered-cubic (FCC) phase, the phase line equations can be obtained for CH3CCl3+CCl4. The temperature-concentration (CCl4) phase diagram of CH3CCl3+CCl4 can then be calculated using the experimentally observed [22] T–X phase diagram of this binary mixture.
The free energy in the liquid phase of CH3CCl3+CCl4 in terms of the orientationally disordered (OD) parameter and orientationally ordered (OO) parameter is zero (FL = 0) for this two-component system. Between liquid (L) and the rhombohedral (R) phases along the phase line (R+L) at higher temperatures, two-component system is stable whereas the phase line between the FCC and liquid (L) along the phase line (FCC+L) at lower temperatures, is metastable [22], as stated above.
By expanding the free energy of the R+L phase in terms of the orientationally disordered (OD) parameter ψ, we write
where a2 > 0, a4 < 0, and a6 > 0 for a first order transition between the rhombohedral and liquid phases. By minimizing the free energy FR+L with respect to the orientationally disordered parameter ψ with ∂F/∂ψ = 0, one obtains
When we insert Equation (4) into Equation (3), we get
Using the first order condition that
along the phase line (R+L), we find the phase line equation for the liquid (L)—rhombohedral (R) transition as
in CH3CCl3+CCl4. Similarly, the free energy of the FCC phase can be expanded in terms of the orientationally ordered (OO) parameter η as
where b2 > 0, b4 < 0, and b6 > 0 as before, for the first order transition between the FCC and the liquid phases for the two-component system of CH3CCl3+CCl4. Minimization (∂FFCC/∂η = 0) gives the order parameter η as
as for the order parameter ψ of the rhombohedral phase (Equation 4). Similar to Equation (7), we then obtain the phase line equation of FCC + L as
by substituting Equation (9) into Equation (8).
In order to obtain the T–X phase diagram of CH3CCl3+CCl4, we can choose a function f(t−x) as
where t = T − T0 and x = x − x0 with the constants α1, α2, and α3. Here, T0 denotes the temperature at zero concentration (x = x0 = 0) with a one-component system (CH3CCl3 only) as x denotes the concentration of CCl4. By writing Equation (11) in the form,
the coefficients α1, α2, and α3 can be determined. By fitting Equation (12) to the experimentally observed T–X data [22] for the R+L and FCC+L, separately, we determined the values of the α1, α2, and α3.
In Table 2 we give the values of the constants α1, α2, and α3 for this binary mixture. We plot in Figure 5 the T–X phase diagram calculated (Equation 12) for CH3CCl3+CCl4 along the R+L and FCC+L phase lines with the observed data [22].
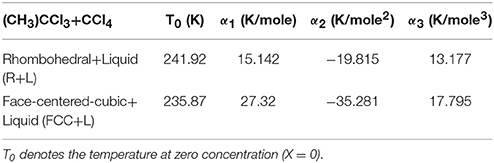
Table 2. Values of the coefficients α1, α2, and α3 according to Equation (12) using the experimental data [22].
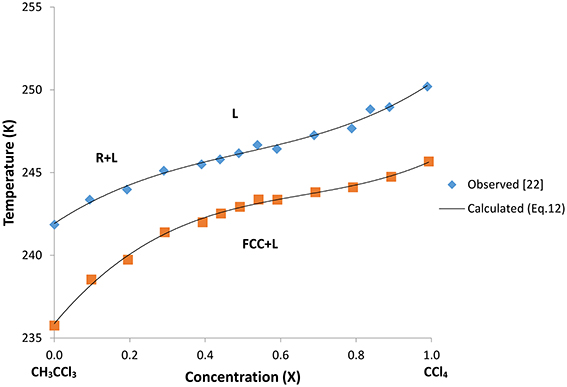
Figure 5. Calculated phase diagram (Equation 12) along the stable R+L (rhombohedral + liquid) and metastable FCC+L (face-centered-cubic + liquid) phase lines for the two-component system of CH3CCl3+CCl4. Observed data [22] are also given here.
Discussion
The temperature dependence of the heat capacity Cp was analyzed according to a power-law formula (Equation 1) for pure CH4 and CH4/CCl4 using the experimental data [8]. This analysis was performed in the vicinity of the melting temperature (Tm) within a temperature interval of 0.3 -0.4 K for pure CH4 and ~0.3–0.5 K for CH4/CCl4 (Table 1). The extracted values of the critical exponent α for the heat capacity Cp, are about 0.3–0.4 for pure CH4, whereas for CH4/CCl4 the exponent values are α = 0.6–0.7 below and above the melting temperature Tm (Table 1). Our values are much greater than the predicted values (α = 0, mean field theory and α = 0.12, Ising model) for a second order transition. This indicates that the phase transition for pure CH4 and CH4/CCl4 is weakly first order transition.
In fact, our α values for the coadsorbed CH4/CCl4, which are comperatively larger than those for the pure CH4 monolayer also indicate that the phase transition of the CH4/CCl4 system is closer to a first order transition since the heat capacity exhibits a sharp discontinuity at the melting point (Tm = 99.2 K) as observed experimentally [8]. At higher temperatures, the displacement transition has a tendency toward a more continuous one, which can occur for the pure CH4 at the melting temperature (Tm = 104.8 K), as also indicated from the volumetric and X-ray diffraction measurements [7].
This large heat capacity peak appearing at the melting point of coadsorbed CH4/CCl4, is associated with a first order transition favorably and the system moves along the phase boundary to resolve a density discontinuity between the two phases. With the non-zero latent heat when the density discontinuity vanishes, the phase boundary slope becomes infinite and the Clasius–Clapeyron equation can be used for a first order transition in coadsorbed CH4/CCl4 [8].
Also, as the CH4 coverage increases, the heat capacity increases with the melting temperature shifted to higher temperatures for the CH4/CCl4 mixture. This also indicates that CH4/CCl4 system exhibits closely a first order transition as the melting temperature is approached. Peaks in the heat capacity associated with the corresponding chemical potential have given the phase boundary points to obtain the CH4/CCl4 coadsorption phase diagram and they can also be correlated with the equation of state of the system [8].
As pointed out previously, when CCl4 monolayer is preadsorbed, CH4 adsorption occurs preferentially on graphite and consequently CH4 and CH4/CCl4 solid solution undergo phase transitions. As in the case of xenon on the graphite covered with sulfur hexafluoride (SF6) [1], CH4 adsorption is probably hindered by preadsorbed CCl4 and the phase transition occurs in pure CH4 and in the mixture of CH4/CCl4 under the temperature on graphite. Methane adsorption leads to the displacement on the preadsorbed CCl4 monolayer on graphite for the occurrence of a weak first order (or nearly second order) transition in pure CH4 and of a first order transition in CH4/CCl4. The transition temperature Tc for pure methane and CH4/CCl4 can depend on the CCl4 on graphine so that the presence of graphene can change Tc and also the character of the phase transition in those systems.
It has been pointed out that methane, argon and krypton all have solid surface tensions very nearly equal to the liquid surface tension at their respective triple point temperatures where the heat capacity peaks have been observed to occur in many adsorbed system [9].
This leads to the phase transition occurring for the pure CH4 and the coadsorbed CH4/CCl4 on graphite at the triple point (bulk methane triple point is 90.7 K) and also close to the melting point, as we studied here. Due to the coupling between surface-frozen and volume liquid crystal molecules [9], surface interactions can become significant in the mechanism of the phase transition of the solid solution, in particular, coadsorbed CH4/CCl4 on graphite. Also, dimensional crossover can change the phase behavior from the first order to the second order as we obtained for the coadsorbed CH4/CCl4 and pure methane (CH4), respectively, in this study.
We analyzed here the observed heat capacity associated with the transition for CH4 order within the mixed CH4/CCl4 phase present during displacement. Other transitions associated with pure CH4 on bare graphite when observed experimentally, can also be analyzed according to the power-law formula for the coadsorption system. Those transitions correspond to a second order solid-solid transition between commensurate and expanded phases and, a first-order melting transition with regard to the heat capacity peaks [35, 36]. Due to the first-order nature of the phase boundary and the heat capacity peak, a first-order coadsorption phase boundary may be associated with melting into a mixed liquid film phase, as indicated previously [8] at relatively lower temperatures as the CH4 impurity increases. Some accurate measurements are needed using various techniques such as calorimetry measurements which can detect the phase transitions to clarify the other transitions for the methane coadsorbed on graphite precoated with a saturated monolayer of carbon tetrachloride. From the heat capacity measurements of CH4/CCl4 on graphite, a power-law analysis can be conducted to describe the solid-solid transition and also a first-order melting transition in the coadsorbed system as studied here. Additionally, investigating the phase boundaries with the experimental measurements provides the displacement of the CH4 film and it also explains how the coadsorption occurs into a multilayer CH4 film.
The T–X phase diagram for the two-component system was also calculated using the mean field theory for CH3CCl3+CCl4 by expanding the free energy in terms of the order parameters ψ (Equation 3) and η (Equation 8). As stated above, the stable rhombohedral (R) phase has the orientationally disordered (OD) parameter of the axially symmetric molecules which occurs at higher temperatures for a two-component system of CH3CCl3+CCl4 with the concentration x of CCl4 (x = 0 is the CH3CCl3 component and x = 1 is the CCl4 only). The metastable phase-centered-cubic (FCC) has the orientationally ordered (OO) parameter of symmetric molecules, which occurs at lower temperatures for this mixture of CH3CCl3+CCl4. The orientational ordering of axially symmetric molecules in a non-cubic uniaxial plastic crystal and also in liquid crystals, can be defined as [37]
where, θ is the angle between the molecular symmetry axis and the optic axis of the crystal. If the molecular polarizability anisotropy is known [38, 39], the order parameter S can be determined in one-component system and also in two-component crystals [29]. In our treatment regarding the orientationally disordered (OD) parameter (ψ) of the rhombohedral (R) phase and the orientationally ordered (OO) parameter (η) of the FCC phase of the two-component system (CH3CCl3+CCl4), we considered only the amplitudes of the order parameters (ψ and η). In general, by defining the complex order parameter as
the phase ϕ determines the symmetry broken in the phase transition since the amplitude ψ0 determines the degree of a nearly established order [40]. Due to the fact that in the case of CH3CCl3+CCl4 mixture, we calculated the phase lines of stable R+L (rhombohedral + liquid) and metastable FCC+L (face-centered-cubic + liquid) as a first order transition according to the Landau phenomenological theory, in the intermediate range of concentrations x (CCl4) the symmetry is broken as a discontinuous change from the liquid to the rhombohedral (R) and FCC phases when this mixture solidifies with decreasing temperature (Figure 5). Thus, the discontinuous symmetry in the orientational disordering (rhombohedral + liquid) and in the orientational ordering (face-centered-cubic + liquid) is broken in the two-component mixture of CH3CCl3+CCl4.
As shown in Figure 5, a cubic polynomial (Equation 12) was fitted to the experimental data [22] very well along the R+L and FCC+L phase lines. By choosing the temperature and concentration dependences of the coefficients a2, a4, and a6 (or constant), the phase line equation (Equation 7) for the R+L phase line can be obtained as a cubic polynomial in the form of Equation (12). Similarly, by choosing the temperature and concentration dependences of the b2, b4, and b6 (or constant), the phase line equation (Equation 10) for the FCC+L phase line can be obtained in the form of Equation (12). This then provides calculation of the coefficients a2, a4 and a6 in the free energy expansion FR (Equation 3) using the values of α1, α2, and α3 (Table 2). Similarly, b2, b4, and b6 in the free energy expansion FFCC (Equation 8) can be obtained from the values of α1, α2, and α3 (Table 2). This then leads to the temperature and concentration dependences of the orientationally disordered (OD) parameter ψ (Equation 4) in terms of a2, a4 and a6 for the rhombohedral (R) phase and those dependences of the orientationally ordered (OO) parameter η for the FCC in the same form of Equation (9) in terms of the coefficients b2, b4, and b6. Thus, the critical behavior of the order parameters ψ and η as a function of temperature at zero concentration of CCl4 (CH3CCl3 only) and also at various concentrations of CCl4 for this two-component system of CH3CCl3+CCl4 can be obtained.
Also, the thermodynamic quantities such as the specific heat Cp, thermal expansion αp and the isothermal compressibility κT can be predicted from the free energies of FR (Equation 3) and FFCC (Equation 8) for the phases of R+L and FCC+L, respectively, of CH3CCl3+CCl4 (Figure 5), as stated above. Thus, those thermodynamic quantities (Cp, αp, and κT) can be calculated as a function of temperature using the Landau mean field theory for a constant concentration x of CCl4. Along the phase boundaries (R+L and FCC+L), the critical behavior of Cp, αp, and κT can be predicted for various temperatures and concentrations by the Landau mean field theory using the temperature and concentration dependence of the coefficients a2, a4, and a6 in FR (Equation 3) and, the coefficients b2, b4, and b6 in FFCC (Equation 8) for a two-component system of CH3CCl3+CCl4. The predicted thermodynamic quantities can then be compared with the measurements along the R+L and FCC+L phase boundaries when the experimental data are available in the literature. This then examines whether the Landau mean field theory can be applied to a two-component system of CH3CCl3+CCl4.
Conclusions
Analysis of the heat capacity for the pure methane (CH4) and CH4/CCl4 on graphite was performed close to the melting point using the experimental data according to a power-law formula. The values of the critical exponent α which we extracted for the heat capacity Cp indicate that the pure methane exhibits closer to a continuous (second order) transition, whereas the transition for the coadsorbed CH4/CCl4 mixture is of nearly first order (discontinuity). Our exponent values are not in close agreement with the predictions of the theoretical models (mean field theory and an Ising model), which undergo mainly second order transitions. Our analysis given here explains adequately the observed behavior of the heat capacity for pure CH4 and CH4/CCl4 system on graphite. This shows that the solid-solid transitions and first order melting transition in pure CH4 and coadsorbed CH4/CCl4 system can be investigated by analyzing the specific heat Cp. Similar analysis can also be performed for some other coadsorbed systems as the CH4/CCl4 system studied here, when accurate experimental data are available in the literature.
T–X phase diagram was also calculated in this study by using Landau phenomenological theory for the phase boundaries of the stable R+L (rhombohedral + liquid) and metastable FCC+L (face-centered cubic + liquid) phases of a two-component system of CH3CCl3+CCl4. By fitting the phase line equations derived from the free energies of the solid phases to the observed T–X phase diagram in this mixture, the coefficients were determined, which can be related to those given in the free energy expansion. We find that our predicted T–X phase diagram as obtained from the Landau mean field theory, describes the observed behavior of the binary mixture of CH3CCl3+CCl4. Using the coefficients determined, the temperature and concentration dependence of some other thermodynamic quantities can be predicted close to the phase transitions in this binary mixture.
Author Contributions
In this work, the author AY has contributed to the paper by analyzing the experimental data for the specific heat and also fitting the phase line equations to the observed T–X phase diagram. The author HY has constructed the power-law formula for the analysis and derived the expressions for the T–X phase diagram using the mean field theory
Conflict of Interest Statement
The authors declare that the research was conducted in the absence of any commercial or financial relationships that could be construed as a potential conflict of interest.
References
1. Menaucourt J, Bockel C. Déplacement par le xénon, du film d'hexafluorure de soufre préalablement adsorbé sur la face (0001) du graphite. J Phys. (1990) 51:1987–2003. doi: 10.1051/jphys:0199000510170198700
2. Razafitianamaharavo A, Convert P, Coulomb J, Croset B, Dupont-Pavlovsky N. Structural characterization of krypton physisorption on (0001) graphite pre-plated with cyclohexane. J Phys. (1990) 51:1961–9. doi: 10.1051/jphys:0199000510170196100
3. Dupont-Pavlovsky N, Abdelmoula M, Rakotozafy S, Coulomb JP, Croset B, Ressouche E. Adsorption on pre-plated graphite: displacement transition for the (krypton-cyclohexane) and (methane-carbon tetrachloride) films. Surf Sci. (1994) 317:388–96. doi: 10.1016/0039-6028(94)90294-1
4. Asada H, Takechi M, Sciyama H. Displacement transition in Kr/cyclohexane adsorbed on graphite: what is the driving force? Surf Sci. (1996) 346:294–9. doi: 10.1016/0039-6028(95)00924-8
5. Castro MA, Thomas RK. An X-ray diffraction study of sulphur hexafluoride-krypton mixtures on graphite. Surf Sci. (1998) 399:212–8. doi: 10.1016/S0039-6028(97)00819-4
6. Weber WJ, Goodstein DL. Coadsorption phase diagram for Kr/CCl4 on graphite. Phys Rev B (2002) 66:165419. doi: 10.1103/PhysRevB.66.165419
7. Abdelmoula M, Ceva T, Croset B, Dupont-Pavlovsky N. Krypton adsorption on (0001) graphite preplated with carbon tetrachloride. Surf Sci. (1992) 272:167–71. doi: 10.1016/0039-6028(92)91434-D
8. Weber WJ, Goodstein DL. Coadsorption phase diagram for CH4/CCl4 on graphite. Phys Rev B (2006) 73:195424. doi: 10.1103/PhysRevB.73.195424
9. Lysek MJ, LaMadrid M, Day PK, Goodstein DL. The melting of unsaturated capillary condensate. Langmuir (1993a) 9:1040–5. doi: 10.1021/la00028a027
10. Pruzan PH, Liebenberg DH, Mills RL. Experimental evidence for a second-order transformation prior to melting in ammonia, organic compounds and ice I. J Phys Chem Solids (1986) 47:949–61. doi: 10.1016/0022-3697(86)90107-1
11. Wood SD, Bean VE. (1984). High pressure science and technology. In: Homan C, MacCrone RK, Whalley E, editors. Materials Research Society Symposia Proceedings (New York, NY) Vol. 22. p. 29.
12. Rudman R, Post B. Carbon tetrachloride: a new crystalline modification. Science (1966) 154:1009–12. doi: 10.1126/science.154.3752.1009
13. Piermarini GJ, Braun A. Crystal and molecular structure of CCl4-III A high pressure polymorph at 10kbar. J Chem Phys. (1973) 58:1974–82. doi: 10.1063/1.1679460
14. Cohen S, Powers R, Rudman R. Polymorphism of the crystalline methylchloromethane compounds. VI. The crystal and molecular structure of ordered carbon tetrachloride. Acta Cryst B (1980) 35:1670–4. doi: 10.1107/S0567740879007366
15. Bean VE, Wood SD. The dual melting curves and metastability of carbon tetrachloride. J Chem Phys. (1980) 72:5838–41. doi: 10.1063/1.439107
16. Maruyama M, Kawabata K, Kuribayashi N. Crystal morphologies and melting curves of CCl4 at pressures up to 330 MPa. J Cryst Growth (2000) 220:161–5. doi: 10.1016/S0022-0248(00)00826-5
17. Kaya Kavruk D, Yurtseven H. Pippard relations studied for the solid phase of carbon tetrachloride close to the melting point. High Temp Mater Process. (2007) 26:397–401. doi: 10.1515/HTMP.2007.26.5-6.397
18. Yurtseven H, Kavruk D. Linear variations of the thermodynamic quantities in the liquid phase of carbon tetrachloride close to the melting point. J. Mol. Liq (2008) 139:117–20. doi: 10.1016/j.molliq.2007.11.010
19. Yurtseven H, Dildar Y. Calculation of thermodynamic quantities for carbon tetrachloride (CCl4) close to the III–IV phase transition. Korean J Chem Eng. (2011) 28:252–5. doi: 10.1007/s11814-010-0320-6
20. Yurtseven H, Kavruk D. Calculation of the molar volume in the solid and liquid phases of CCl4. Mod Phys Lett B (2010) 24:75–80. doi: 10.1142/S0217984910022184
21. Barrio M, Pardo LC, Tamarit JLI, Negrier P, Lopez DO, Salud J, et al. The two-component system CCl4 + CBrCl3. Inference of the lattice symmetry of phase II of CBrCl3. J Phys Chem B (2004) 108:11089–96. doi: 10.1021/jp048553+
22. Pardo LC, Barrio M, Tamarit JLI, Lopez DO, Salud J, Negrier P, et al. Miscibility study in stable and metastable orientational disordered phases in a two-component system (CH3)CCl3+CCl4. Chem Phys Lett. (1999) 308:204–10. doi: 10.1016/S0009-2614(99)00627-2
23. Rudman R. Polymorphism of the crystalline methylcholoromethane compounds, II. Mol Cryst Liq Cryst. (1969) 6:427–9. doi: 10.1080/15421407008083479
24. Silver L, Rudman R. Polymorphism of the crystalline methylchloromethane compounds. A differential scanning calorimetric study. J Chem Phys. (1970) 74:3134–9. doi: 10.1021/j100710a019
25. Koga Y, Morrison JA. Polymorphism in solid CCl4. J Chem Phys. (1975) 62:3359–61. doi: 10.1063/1.430920
26. Anderson A, Torrie BH, Tse WS. Raman and far infrared spectra of the solid phases of carbon tetrachloride. Chem Phys Lett. (1979) 61:119–23. doi: 10.1016/0009-2614(79)85100-3
27. Djabourov M, Levy-Manneheim C, LeBlond J, Papon P. Light scattering in carbon tetrachloride: liquid and plastic crystal phases. J Chem Phys. (1977) 66:5748–56. doi: 10.1063/1.433850
28. Zuk J, Kiefte H, Clouler MJ. Elastic constants of the orientationally disordered phase Ib of CCl4 by Brillouin spectroscopy. J Chem Phys. (1991) 95:1950–4. doi: 10.1063/1.460991
29. Struts AV, Bezrukov OF. The study of birefringence in mixed plastic methylchloromethanes. Chem Phys Lett. (1995) 232:181–5. doi: 10.1016/0009-2614(94)01331-O
30. Akimov MN, Bezrukov OF, Chikunov OV, Struts AV. Orientational order in two−component plastic crystals 2,2−dichloropropane–carbon tetrachloride. J Chem Phys. (1991) 95:22–8. doi: 10.1063/1.461480
31. Struts AV, Veracini CA, Bezrukov OF. The study of water diffusion in the lamellar phase of water-ammonium perfluorononanoate mixtures. Chem Phys Lett. (1996) 263:228–34. doi: 10.1016/S0009-2614(96)01161-X
32. Vuks MF. Determination of optical anisotropy of aromatic molecules from double refraction in crystals. Optics Spectry (1966) 20:361–8.
33. Cordoyiannis G, Kralj S, Nounesis G, Kutnjak Z, Zumer, S. Pretransitional effects near the smectic-A–smectic-C* phase transition of hydrophilic and hydrophobic aerosil networks dispersed in ferroelectric liquid crystals. Phys Rev E Stat. Nonlinear Soft Matter Phys. (2007) 75:021702–3. doi: 10.1103/PhysRevE.75.021702
34. Kutnjak Z, Kralj S, Lahajnar G, Zumer S. Influence of finite size and wetting on nematic and smectic phase behavior of liquid crystal confined to controlled-pore matrices. Phys Rev E Stat. Nonlinear Soft Matter Phys. (2004) 70:51703–4. doi: 10.1103/PhysRevE.70.051703
35. Kim HK, Zhang QM, Chan MHW. Thermodynamic study of monolayer methane on graphite. Phys Rev B (1986) 34:4699–709. doi: 10.1103/PhysRevB.34.4699
36. Lysek MJ, LaMadrid MA, Goodstein DL. Heat capacity of multilayer methane on graphite: phase transitions in the first four layers. Phys Rev B (1993b) 47:7389–7400. doi: 10.1103/PhysRevB.47.7389
37. Tsvetkov V. On molecular order in the anisotropic liquid phase. Acta Physicochim USSR. (1942) 16:132–47.
38. Akimov MN, Bezrukov OF, Vuks MF, Struts AV. Birefringence and orientational order in the plastic phase of II-tretbutylbromide. Sov Phys Crystallogr. (1990a) 35:761–4.
39. Akimov MN, Bezrukov OF, Vuks MF, Struts AV. Molecular crystals and liquid crystals incorporating nonlinear optics. Mol Cryst Liq Cryst. (1990b) 192:197–201.
Keywords: heat capacity, CH4 and CH4/CCl4, melting point, T–X phase diagram, CH3CCl3+CCl4
Citation: Yurtseven H and Yilmaz A (2016) Analysis of the Heat Capacity for Pure CH4 and CH4/CCl4 on Graphite Near the Melting Point and Calculation of the T–X Phase Diagram for (CH3)CCl3+CCl4. Front. Phys. 4:24. doi: 10.3389/fphy.2016.00024
Received: 18 March 2016; Accepted: 24 May 2016;
Published: 15 June 2016.
Edited by:
Yang Zhang, University of Illinois at Urbana-Champaign, USACopyright © 2016 Yurtseven and Yilmaz. This is an open-access article distributed under the terms of the Creative Commons Attribution License (CC BY). The use, distribution or reproduction in other forums is permitted, provided the original author(s) or licensor are credited and that the original publication in this journal is cited, in accordance with accepted academic practice. No use, distribution or reproduction is permitted which does not comply with these terms.
*Correspondence: Hamit Yurtseven, hamit@metu.edu.tr