Lifetime Autler-Townes Splitting of Dressed Multi-Order Fluorescence in Pr3+:YSO
 Imran Ali1,2 Changbiao Li1* Abdulkhaleq Hasan1 Garuma Abdisa1 Zongchen Liu1 Feng Ma1
  Yanpeng Zhang1*
- 1Key Laboratory for Physical Electronics and Devices of the Ministry of Education and Shaanxi Key Lab of Information Photonic Technique and School of Science, Xi'an Jiaotong University, Xi'an, China
- 2Pillar of Engineering Product Development, Singapore University of Technology and Design, Singapore, Singapore
HIGHLIGHTS
• We observed Autler-Townes splitting of single peak into two and three peaks in two-level, and three-level systems, respectively.
• We reported primary and secondary Autler-Townes splitting are caused by double cascaded dressing in time domain.
• We observed Autler-Townes splitting of multi-order fluorescence in time domain is more obvious than that of in spectral domain.
For first time, we study primary and secondary Autler-Townes (AT) splitting of multi-order fluorescence (FL) in time domain. The AT-splitting of multi-order FL signals are controlled by changing power, detuning, and polarization of single and double dressing in a heteronuclear-like molecule system of Pr+3:YSO. The primary and secondary AT-splitting are caused by double cascaded dressing in time domain. The AT-splitting of multi-order FL in time domain is more sensitive than that of in spectral domain. Such results have potential applications in quantum communication and optical information processing on photonic chip.
Introduction
Recently, quantum coherence excitation and coherence transfer have been thoroughly studied in rare-earth ion doped crystals (like Pr3+:Y2SiO5) which exhibit various advantages of coherent excitation. The recent research progresses related to atomic coherence in solid-state materials include electromagnetically induced transparency in solid materials [1], optical velocity reduction [2], all-optical routing based on optical storage [3], coherent storage of light pulses [4], and controllable erasing of optically stored information [5]. The EIT processes can be controlled by selecting different transitions among Zeeman sublevels via the polarization states of the laser beams [6]. The polarization dependences of four-wave mixing (FWM) and the enhanced FWM have been studied [7, 8]. The atomic Autler–Townes (AT) splitting was first observed on an rf transition [9] and then in calcium atoms [10]. Here we study AT-splitting of fluorescence (FL) in time domain, which exhibit several applications in all-optical communication and optical information processing on photonic chip.
The aim of this paper is to investigate primary and secondary AT-splitting of FL by changing power, detuning, and polarization of laser beams in Pr3+:Y2SiO5 crystal. We also compare AT-splitting of FL in time domain and frequency domain, which is controlled by multi-parameters. The polarization states of generating fields and dressing fields are achieved by half-wave-plate (HWP) and quarter-wave plate (QWP).
Experimental Setup and Theory
To implement this experiment, the sample is held in a cryostat (CFM-102) with a temperature 77 K. The Y2SiO5 crystal is doped with rare-earth Pr3+ ion with doping concentration of 0.05% to form Pr3+: Y2SiO5. Under the action of crystal field of YSO, the triplet energy-level 3H4 and singlet energy-level 1D2 split into nine and five stark components, respectively. The Pr3+ impurity ions occupy two non-equivalent cation sites (denoted as sites I and II) in YSO crystal lattice where the energy-level of site I is labeled without asterisk and the one for site II is labeled with an asterisk. Two tunable dye lasers (with a 0.04 cm−1 line-width) pumped by an injection locked single-mode Nd:YAG laser (Continuum Powerlite DLS 9010, 10 Hz repetition rate, 5 ns pulse width) are used to generate the pumping fields Ea (ω1, Δ1) and Eb (ω2, Δ2) with frequency detuning Δi = Ωmn–ωi, where Ωmn is the transition frequency between level |m〉 and |n〉, Ea drives |0〉↔|1〉 transition and Eb drives |0〉↔|2〉, respectively, as shown in Figure 1B. The controlled results are monitored by two photomultiplier tubes (PMTs) with a fast gated integrator. These laser beams are in xy-plane as shown in Figure 1A.
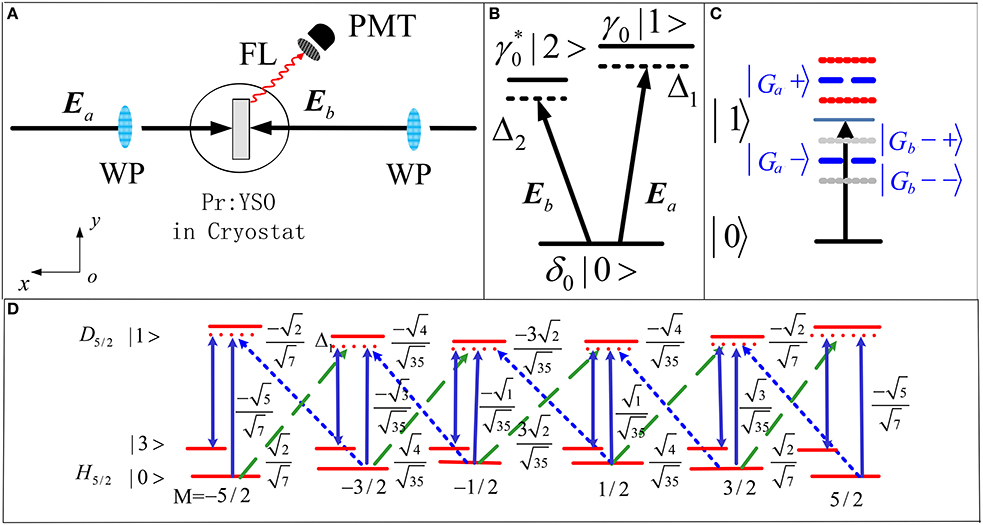
Figure 1. (Color on-line) (A) experimental setup scheme, where Photomultiplier tube (PMT) and wave plate (WP) are used. (B) V-type system (|0〉↔|1〉↔|2〉). (C) Shows dressed state picture for V-type system. (D) Zeeman energy-levels and transition paths at different polarization states. Solid lines: transitions for the linearly polarized beam; dotted lines: transitions for the left circularly polarized beam; dashed-lines: transitions for the right circularly polarized beam.
In this experiment, we use HWP and QWP to change polarization state of Ea and Eb. The propagation direction of vertically polarized beams Ea and Eb are opposite as shown in Figure 1A. A PMT is used to detect FL signals. We can obtain spectral signals by scanning laser frequency and time domain signals by fixing laser frequency.
For understanding the influences of the incident beams on AT-splitting of multi-order FL, we report the corresponding experimental observations, which can be effectively controlled by the polarization states of the pumping laser beams by HWP and QWP. Due to the periodic change of the polarization states of the pumping beam, the intensity of the beam also changes periodically. Figure 1D shows transition paths and Clebsch-Gordan (CG) coefficients at different laser polarization states. The HWP is used to investigate dressing effect in different level systems i.e., two-level system (single dressing) and V-type system (double dressing). In quantum theory, the FL signal intensity can be described by the diagonal density matrix elements. In V-type system, when fields Ea and Eb are open simultaneously, the fourth-order (or multi-order) FL can be generated, which can be defined by perturbation chain . Where ρaa is probability of diagonal density matrix element at |0>. When Ea and Eb are open simultaneously, Eb excitation from |0> to |2> in ket site, represented by off-diagonal density matrix () in perturbation chain, is also called coherence. In perturbation chain (Ea)* and (Eb)* are complex conjugate of Ea and Eb, respectively. The Ea beam excitation from |0> to |1> in ket site, represented by in perturbation chain [11]. Considering the dressing effect of Ea and Eb the diagonal density matrix element is given by
Equation (1) shows density matrix element without polarization. Equation (2) shows density matrix element, when polarization of incident beam Ea (or Eb) is changed. Theta θ2 (or θ4) is used when Ea (or Eb) polarization is changed by HWP. Equations (3) and (4) show density matrix element for linear polarization and for circular polarization by QWP, respectively. We use θ1 (or θ3) when Ea (or Eb) polarization is changed by QWP. Here, and for horizontal and vertical polarizations of Eb, respectively, and dba = Γba + iΔ1, dca = Γca + iΔ2, dbc = Γbc + i(Δ1 − Δ2), dcb = Γcb + i(Δ2 − Δ1), , , , , , dbMaM = ΓbMaM + iΔ1, dcMaM = ΓcMaM + iΔ2, , , , , , , , , and Gi = −μijEi/ℏ is the Rabi frequency of Ei with the electric dipole moment μij between levels |i〉 and |j〉, and Γij is the transverse decay rate. Next, we will discuss the AT-splitting results in two-level and three-level system.
Results and Discussion
In Figure 2 we investigate the AT-splitting of FL in time domain. We obtain time domain FL signals by fixing Ea frequency at resonant point with different powers (P1) of Ea and with different QWP polarization (θ1) of Ea as illustrated in Figures 2A,B, respectively, in two-level system. With increasing power of Ea from bottom to top we can see in Figure 2A the right peak shifts toward right (shown by dashed line in Figure 2A) and left peak intensity increases first (due to effect of Ea power) then it decreases due to dressing effect. The total intensity can be written as and there is a competition between the SP-FWM and FL [8]. In the total process, increases first with the increasing of the |Ga|2 and gradually vanishes due to dressing effect of |Ga|2/Γbb (refer to Equation 1). At first, the power of the pumping field Ea is too little (1 mW) to split |1〉 into |Ga±〉, so we cannot see right peak appear in Figure 2a1. With the increasing of the power (≈8 mW) of Ea, the energy level |1〉 splits into |Ga±〉 and right peak appears can be seen in Figure 2a5. We can explain increasing of the splitting distance by observing the Hamiltonian , when we set |1〉 at the frequency reference point. From the equation H|Ga±〉 = λ±|Ga±〉, we can obtain λ± = [Δ1±(4|Ga|2)1/2]/2. The splitting distance between |Ga+〉 and |Ga−〉 is when Δ1 = 0. The obvious splitting distance of the right peak in Figure 2A is caused by the residual particles in |Ga+〉 transferring to |Ga−〉 through phonon-assisted non-radiative transition which is mainly determined by acoustic phonons at low temperature. The AT-splitting distance is proportional to the distance between |Ga+〉 and |Ga−〉. With increasing of the Ga, Δa keeps increasing which leads to the increasing of the splitting distance of the right peak. Furthermore, we can say that the left and right peaks of the FL signal correspond to the dressed states |Ga+〉 and |Ga−〉, respectively (Figure 1C). Here, second peak (right) is moving toward right while first peak (left peak) is not moving horizontally (see Figure 2A). The curve (in Figure 2E) shows that AT-splitting distance corresponding to Figure 2A which is measured from zero delay time to right peak. AT-splitting distance increases as power increases. Figures 2B,F can be defined with same reason as in Figures 2A,E, respectively but here we use QWP. We change QWP polarization of Ea (θ1) from right-circular polarization (45°) to linear polarization state (90°) corresponding Figure 2B from bottom to top. Although there are several transition paths for the FL signals, considering the population of each level, the optical transition from the lowest crystal-field level |±5/2〉 is the dominant one shown in Figure 1D. The Rabi frequency for right-circularly polarized states is smaller than linearly polarized states , so Δa is smaller which makes the delay time of the right peak smaller at 45° than at 90°. Due to decrease in Rabi frequency the AT-splitting increases from to refer to Equation (4) and Equation (3), respectively. As polarization states approach horizontal then decreases, which determines the reducing of the right peak intensity and increasing AT-splitting distance as shown in Figure 2B. The reason for AT-splitting distance can be given with help of Hamiltonian similarly as Figure 2A. In Figures 2C,D, we investigate the AT-splitting of FL obtained by changing HWP and QWP polarization, respectively in time domain two-level system (using two beams), where we change polarization state of input polarized beam Ea by HWP (θ2) and QWP (θ1) as illustrated in Figures 2C,D the evolution of the FL is similar as Figure 2B. The reason is also similar with two-level system using QWP in Figure 2B but here the |Ga+〉 is further split by Eb. Therefore, Hamiltonian can be written as where and through the equation H′|Gb−±〉 = λ−±|Gb−±〉, we can obtain λ−± = [Δ2±(4|Gb|2)1/2]/2. When Δ2 ~ 0, we can know that the increasing of the |Gb| can lead to the increasing of the |λ−| in the cascaded situation here. The splitting distance between |Gb−〉 and |Ga+〉 can be expressed as Δb = 2(|Ga|2+|Gb|2)1/2 when Δ1 = Δ2 = 0. So when we change the polarization angle of Eb from vertical polarization to horizontal polarization, the Rabi frequency of the Eb changes from to refer to Equation (2) which leads to the increasing of the Δb and the delay time of the right peak. As the dressing increases from to (refer to Equation 2). In Figure 2D describe two-level system using two beams, it also has double cascaded dressing, primary dressing can be described similarly as in two-level system single beam (in Figure 2B) and secondary dressing can be given by terms to for circular and linear polarization states, refer to Equation (4) and Equation (3), respectively which determines the increasing of AT-splitting distance from bottom to top due to increasing of dressing effect as shown in Figure 2D. In Figure 2D when Ea primary dressing is changed, the second and third peaks are moving together toward right, however, the distance between second and third peak is not changing because such distance in time domain is only determined by secondary dressing Eb. Furthermore, we can say that coupling field Ea dresses the state |−> and splits it in to two secondary dressed states |−+> and |−−>. The three peaks in the FL time domain signal (Figure 2d5), from left to right, can be corresponded to the primary dressed state |+>, the secondary dressed states |−+> and |−−>, respectively, shown in Figure 1C. On the other hand, second peak is smaller because of near double resonance dressing at Δ1 ~ Δ2 ~ 0 [12]. Next, we will study time domain and spectral domain FL AT-splitting in V-type system by changing power and detuning as shown in Figure 3.
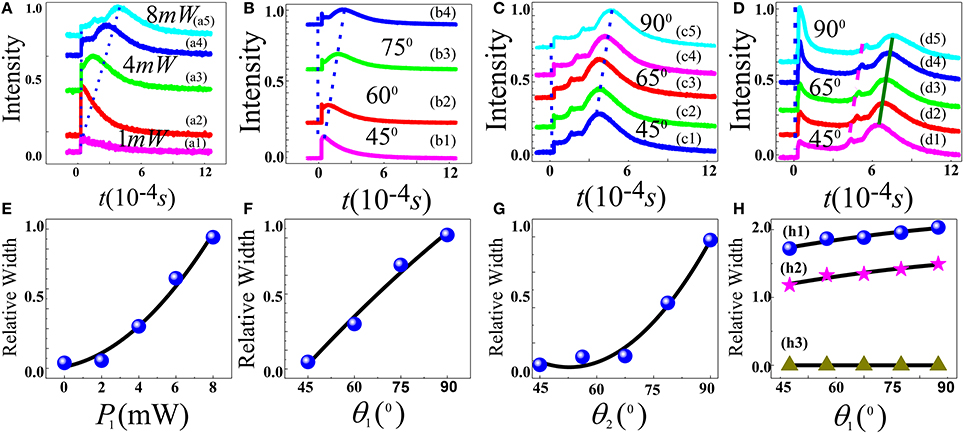
Figure 2. (Color on-line) (A–D) show intensity of the composite FL signals in two-level system at Δ1 = 0 in time domain. Curves (a1–5) obtained by increasing power of Ea from 1 mW (bottom) to 2–4 mW, and then to 8 mW (top), respectively. Curves (b1–4) obtained by changing and scanning Ea polarization from 45° to 60° to 75°, and then to 90° by QWP, respectively, in two-level system. Curves (c1–5) obtained by changing Ea polarization from 45 to 55° to 65 to 75°, and then to 90° by HWP, respectively, and scanning Eb. Curves (d1–5) have similar conditions as curves (c1–5) but by QWP. Here, first, second, and third peaks are guided by short dashes, short dash-dot, and solid line, respectively. (E–G) Share same scale and show relative AT-splitting distance corresponding to (A–C). (H) Shows distance between three peaks in (D) with respect to (w.r.t) polarization. The curve with circles (h1) shows distance between first peak and third peak of (D) w.r.t polarization. The curve with asterisk (h2) shows distance between first peak and second peak of (D) w.r.t polarization, and finally curve with triangles (h3) shows distance between second peak and third peak of (D) w.r.t polarization.
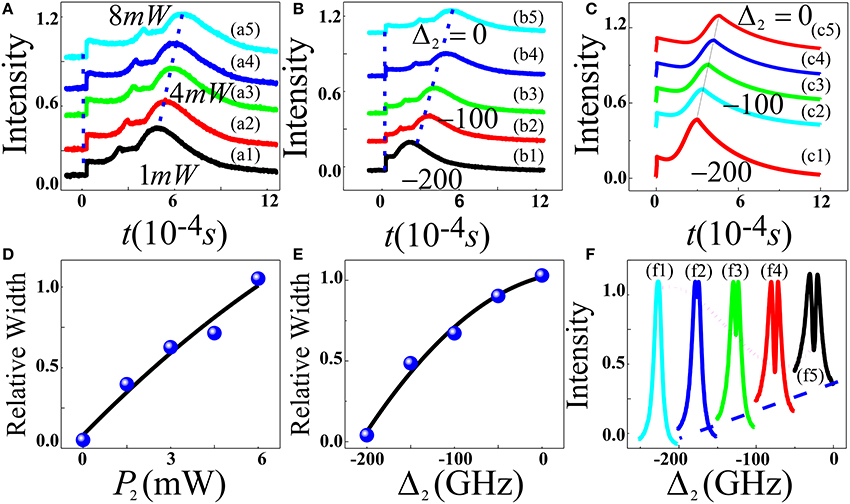
Figure 3. (A,B) are V-type system intensity of the composite FL signal at Δ2 = 0 in the time domain. (a1–5) by changing Eb power from 1, 2, 4, 6 mW, and then to 8 mW, respectively, while scanning Ea. (B) similar as (A) but changing Eb detuning from −200, −150, −100, −50, and 0 GHz, respectively. (C) Theoretical prediction corresponding to (B). (D,E) Share same scale are relative AT-splitting distance corresponding to (A,B), respectively. (F) Similar as (B) but showing FL spectral signals.
Figures 3A,B show the variation of composite FL signals intensity at Δ2 = 0 in the time domain by opening Ea and Eb in V-type system. The power (P2) of Eb is changed in Figure 3A while Eb detuning (Δ2) is changed in Figure 3B. Figure 3A shows the variation of composite FL signals intensity at Δ2 = 0 in the time domain by increasing Eb power from 1 mW (bottom curve) to 8 mw (top curve), and scanning Ea. The V-type level system contains two dressing fields (Eb primary dressing and Ea secondary dressing). The dressings can be explained similar as in two-level two beams system as in Figure 2C, however, due to Δ2 = 0 therefore, Eb became primary dressing. In Figure 3A level |1〉 is already split into |Gb±〉 by Eb with increasing power of Ea will split into |Ga−±〉 with dressing effect of (|Ga|2/Γbb refer to (1)). Therefore, the splitting distance between |Gb−−〉 and |Ga+〉 can be expressed by Δb = 2(|Ga|2+|Gb|2)1/2 at Δ2 = 0. Furthermore, three peaks theory in time domain can be explained similar as two-level system Figure 2D. Figure 3B shows the variation of composite FL signals intensity at Δ2 = 0 in time domain V-type system, where Eb detuning is changed. We can see that by changing detuning from −200 GHz to resonant point (0 GHz) of Eb, we can see that the right peak shifts toward right from bottom to top (shown by dashed line in Figure 3B). Here, level |1〉 is already split into |Ga±〉 by Ea and when Eb detuning approaches to resonant point then |Ga−〉 will further split into |Gb−±〉 with dressing effect of (|Gb|2/Γbb refer to (1). Figure 3C shows theoretical predications of time domain FL signals corresponding to Figure 3B. It can be clearly seen that experimental results match theoretical predication. Figures 3D,E show AT-splitting distance of V-type level system by changing power, and detuning corresponding to Figures 3A,B, respectively. In Figure 3F we discussed AT-splitting of FL in spectral. Here, initially Δ2 (−200 GHz) is far away from the resonant region, the FL signal has no AT-splitting and is nearly not affected by Ea as shown in Figures 3f1,2). As Δ2 get closer to the resonant point, the baseline (dashed-curve) raises gradually due to the competed excitations of the particles by Ea and Eb. At the two peaks of AT-splitting of the FL signal profile, Ea dominates the competition and dresses the FL signal. At the near-resonant region, the competition of Eb on particles increases gradually until Δ1 ~ 0 due to the self-dressing effect of the FL signal. However, the dressing effect of Ea on the FL signal increases gradually and the AT-splitting depth (doted-line in Figure 3F) reaches the maximum at Δ1 ~ Δ2 ~ 0. Such mutual interaction between self-dressing FL signals and extra-dressing FL signals can be well-interpreted refer to Equation (1) and can shown by Figure 3f4, and Figure 3f5 at Δ2 = −50 GHz, and 0 GHz, respectively. Furthermore, in Figure 3f5 FL spectral signals should have three peaks like time domain signals (Figure 3A) at near resonance stage. The two peaks in the FL spectral signal (Figure 3f5) can be seen clearly while central peak is very small, which cannot seen because of near double resonance dressing at Δ1 ~ Δ2 ~ 0 [12]. Thus, the time domain (Figure 3A) AT-splitting is more sensitive than spectral (Figure 3F) [10].
Figure 4A shows the variation of composite FL signal intensity at Δ2 = 0 in the time domain by changing QWP polarization of Eb (θ3) from circular to linear polarization states (bottom to top) and scanning Ea. We can observe that when Ea polarization approaches to right circular then right peak appears, which can be seen clearly in Figure 4a4, and Figure 4a5 at θ3 = 75°, and 90°, respectively. The QWP polarization can be described similarly as two-level (Figure 2D). Figure 4B can be explained similarly as two-level system (Figure 2C). Figure 4B shows the variation of composite FL signal intensity at Δ2 = 0 in the time domain V-type system, where Eb polarization (θ4) is changed by HWP from vertical to horizontal shown from bottom to top. Therefore, suppression increases, the right peak moves to right and AT-splitting also increases as shown in Figure 4B. The increasing of |Ga| due to change in polarization state can also lead to the increasing of |λ−|. When Δ1 = Δ2 = 0, the splitting distance between |Gb−−〉 and |Ga+〉 is Δb = 2(|Ga|2+|Gb|2)1/2. Figure 4C shows the FL signals in V-type three-level (double dressing) system, where polarization angle (θ4) of the dressing field Eb is changed by HWP. That can be explained with same reason as in Figure 3F. Figures 4D,E show AT-splitting distance corresponding to Figures 4A,B, respectively. In Figure 4B we use high power Ea and Eb beams. Therefore, when we change polarization of beam Eb by HWP from vertical to horizontal then particles are transferring from ground state to excited state and then a situation will reach, when there will be no particles to transfer from ground state to excited state, that situation is called saturation state can be seen in Figure 4B. The AT-splitting distance saturation can be seen in Figure 4E. The saturation is resulted from the balance between and refer to (5).
Figure 4F shows theoretical predications of frequency domain FL signals corresponding to Figure 4C. It can be clearly seen that experimental results match theoretical predication.
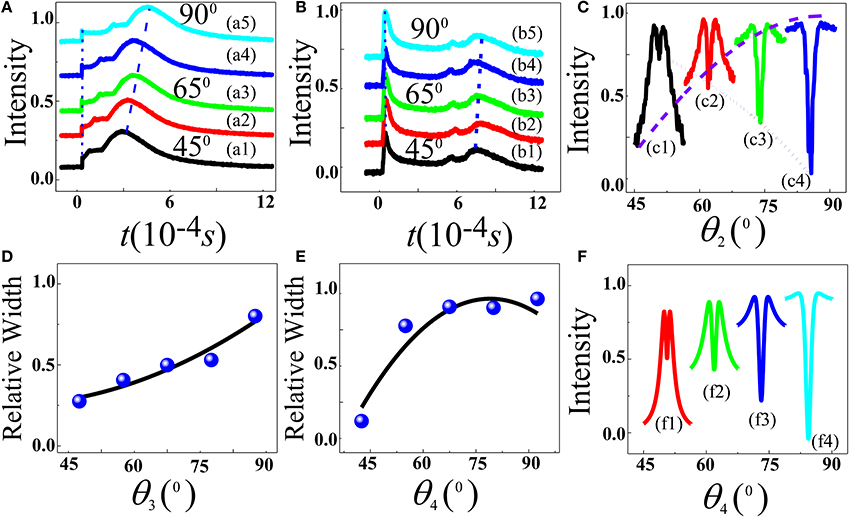
Figure 4. (A,B) are V-type level system, the intensity of composite FL signal at Δ2 = 0 in time domain. (A) By changing Eb polarization from 45° to 60° to 75°, and then to 90°, respectively, by QWP while scanning Ea. (B) Similar as (A) but using HWP. (C) Shows intensity of FL spectral signals by changing Eb polarization by HWP from 45° to 60° to 75°, and then to 90°, respectively, while scanning Ea. (D,E) Correspond the AT-splitting distance of (A,B), respectively. (F) Theoretical prediction of (C).
Conclusion
It is concluded that AT-splitting of multi-order FL signals can be controlled by changing power, detuning, and polarization of single and double dressing in Pr3+:YSO. The primary and secondary AT-splitting are caused by double cascaded dressing in time domain. The AT-splitting of multi-order FL in time domain is more sensitive than that of in spectral domain. Such results have potential applications in quantum communication.
Author Contributions
All authors listed, have made substantial, direct and intellectual contribution to the work, and approved it for publication.
Funding
This work was supported by the 973 Program (2012CB921804), KSTIT of Shaanxi Province (2014KCT-10), NSFC (11474228, 61308015, and 61205112).
Conflict of Interest Statement
The authors declare that the research was conducted in the absence of any commercial or financial relationships that could be construed as a potential conflict of interest.
References
1. Beil F, Klein J, Nikoghosyan G, Halfmann T. Electromagnetically induced transparency and retrieval of light pulses in a Λ-type and a V-type level scheme in Pr3+:Y2SiO5. J Phys B Atomic Mol Opt Phys. (2008) 41:074001. doi: 10.1088/0953-4075/41/7/074001
2. Sabooni M, Li Q, Rippe L, Mohan RK, Kroll S. Spectral engineering of slow light, cavity line narrowing, and pulse compression. Phys Rev Lett. (2013) 111:183602. doi: 10.1103/PhysRevLett.111.183602
3. Wang H-H, Li A-J, Du D-M, Fan Y-F, Wang L, Kang Z-H, et al. All-optical routing by light storage in a Pr3+:Y2SiO5 crystal. Appl Phys Lett. (2008) 93:221112. doi: 10.1063/1.3041645
4. Turukhin AV, Sudarshanam VS, Shahriar MS, Musser JA, Ham BS, Hemmer. Observation of ultraslow and stored light pulses in a solid. Phys Rev Lett. (2002) 88:023602. doi: 10.1103/PhysRevLett.88.023602
5. Wang H-H, Kang Z-H, Jiang Y, Li Y-J, Du D-M, Wei X-G, et al. Erasure of stored optical information in a Pr3+:Y2SiO5 crystal. Appl Phys Lett. (2008) 92:1105. doi: 10.1063/1.2828984
6. Phillips MC, Wang H, Rumyantsev I, Kwong NH, Takayama R, Binder R. Observation of ultraslow and stored light pulses in a solid. Phys Rev Lett. (2002) 88:023602. doi: 10.1103/PhysRevLett.88.023602
7. Zheng H, Zhang X, Zhang Z, Tian Y, Chen H, Li C, Zhang Y. Parametric amplification and cascaded-nonlinearity processes in common atomic system. Sci. Rep. (2013) 3:1885. doi: 10.1038/srep01885
8. Lan H, Li C, Lei C, Zheng H, Wang R, Xiao M, Zhang Y. Competition between spontaneous parametric four-wave mixing and fluorescence in Pr3+:YSO. Laser Phys Lett. (2015) 12:015404. doi: 10.1088/1612-2011/12/1/015404
9. Autler SH, Townes CH. Stark effect in rapidly varying fields. Phys Rev. (1955) 100:703. doi: 10.1103/PhysRev.100.703
10. Walker B, Kaluza M, Sheehy B, Agostini P, DiMauro LF. Observation of continuum-continuum Autler-Townes splitting. Phys Rev Lett. (1995) 75:633. doi: 10.1103/PhysRevLett.75.633
11. Zhang Y, Gan C, Xiao M. Modified two-photon absorption and dispersion of ultrafast third-order polarization beats via twin noisy driving fields. Phys Rev A (2006) 73:053801. doi: 10.1103/PhysRevA.73.053801
Keywords: lifetime Autler-Townes splitting, multi-order fluorescence, YSO crystal, double cascaded dressing, coherence control
Citation: Ali I, Li C, Hasan A, Abdisa G, Liu Z, Ma F and Zhang Y (2016) Lifetime Autler-Townes Splitting of Dressed Multi-Order Fluorescence in Pr3+:YSO. Front. Phys. 4:32. doi: 10.3389/fphy.2016.00032
Received: 19 April 2016; Accepted: 08 July 2016;
Published: 27 July 2016.
Edited by:
Qiyin Fang, McMaster University, CanadaReviewed by:
Yutaka Shikano, Institute for Molecular Science, JapanMahmood Sabooni, Institute for Quantum Computing, Canada
Copyright © 2016 Ali, Li, Hasan, Abdisa, Liu, Ma and Zhang. This is an open-access article distributed under the terms of the Creative Commons Attribution License (CC BY). The use, distribution or reproduction in other forums is permitted, provided the original author(s) or licensor are credited and that the original publication in this journal is cited, in accordance with accepted academic practice. No use, distribution or reproduction is permitted which does not comply with these terms.
*Correspondence: Changbiao Li, cbli@xjtu.edu.cn
Yanpeng Zhang, ypzhang@mail.xjtu.edu.cn