Subnetworks of Percolation Backbones to Model Karst Systems Around Tulum, Mexico
 Martin Hendrick
 Philippe Renard
- Centre for Hydrogeology and Geothermics, University of Neuchâtel, Neuchâtel, Switzerland
Karstic caves, which play a key role in groundwater transport, are often organized as complex connected networks resulting from the dissolution of carbonate rocks. In this work, we propose a new model to describe and study the structures of the two largest submersed karst networks in the world. Both of these networks are located in the area of Tulum (Quintana Roo, Mexico). In a previous work [1] we showed that these networks behave as self-similar structures exhibiting well-defined scaling behaviors. In this paper, we suggest that these networks can be modeled using substructures of percolation clusters (θ-subnetworks) having similar structural behavior (in terms of fractal dimension and conductivity exponent) to those observed in Tulum's karst networks. We show in addition that these θ-subnetworks correspond to structures that minimize a global function, where this global function includes energy dissipation by the viscous forces when water flows through the network, and the cost of network formation itself.
1. Introduction
In a previous paper [1], we studied the fractal properties of the Ox Bel Ha and Sac Actun karstic networks in the region of Tulum, Mexico using real space renormalization and numerical simulations. We found that both networks have similar structures with well defined fractal dimension df ≈ 1.5, conductivity exponent , and walk dimension dw ≈ 2.4. We also observed that these exponents are related by the Einstein relation.
Here we build on this work and propose a new model allowing the description of those systems, and study how their structures may emerge from general energy dissipation principles.
Previous authors have proposed several models for describing the geometry of karstic networks. The most comprehensive are based on a full mathematical description of the physical and chemical processes leading to the dissolution of carbonates (for example 2–4). They provide a detailed and deterministic description of the formation of underground cave networks and allow the time scales of these processes to be estimated. However, they require large, complex, and highly non-linear sets of partial differential equations to be solved. Simplifications and approximations of these processes were also proposed to enable the generation of stochastic networks that resemble actual networks [5–7]. Even simpler models are based on the statistical resampling of existing data sets and allow stochastic networks to be generated which reproduce the main statistical characteristics of the training networks [8]. Amongst these studies, Ronayne and Gorelick [9] and Ronayne [10] used the invasion percolation model of Stark [11] and investigated its large scale flow and transport properties. A weakness of these existing models is that they consider only networks having the structure of a tree, while our observations in Tulum show that the actual networks contain a significant amount of loops. Therefore, there is a need for a model better suited to our case. Karst networks including numerous loops (called anastomotic structures [12]), are also observed in other locations, thus requiring the investigation of improved models that include loops.
Many natural systems exhibit fractal properties and can be modeled as critical phenomena [13] using different frameworks. For example, the structure of river basins can be analyzed and modeled using self-organized criticality [14], landscape erosion was modeled considering a Kardar–Parisi–Zhang like equation [15], or flow through porous media was described using the backbone of critical percolation clusters [16].
Here we adopt the framework of percolation theory that is recognized as particularly well-suited to study connected structures [17], and conductivity and diffusion behavior of percolation clusters are well-known (random resistor network theory) [18]. We propose using subnetworks of percolation clusters, and show that these structures exhibit a similar fractal dimension, walk exponent and conductivity exponent to those observed. We also show how these subnetworks correspond to structures that minimize a function, where one term relates to energy dissipation from viscous flow and the other relates to the energy cost of creating the network. We discuss this minimization principle by analogy with dynamical models of river networks [19] and early karst development [20].
2. Materials and Methods
2.1. Materials: The Karst Networks of Tulum
For clarity, we provide here a brief summary of previous findings [1].
The Ox Bel Ha and Sac Actun coastal karstic systems (Figure 1) are located around the city of Tulum (Quintana Roo, Mexico). They are the two largest submerged karst networks in the world. Each network is comprised of more than 200 km of connected conduits [21] and covers an area of about 10 × 10 km2 with a limited vertical extension (average conduit depth is approximately 12 m). They formed within a horizontal layer of a relatively young carbonate platform and is relatively homogeneous in comparison to the network extension. These two remarkable properties (large extension and homogeneous geology) make these networks ideal for study. Due to the flat topography of the area, the hydraulic head gradient is small and ranges from 1 to 10 cm/km [22].
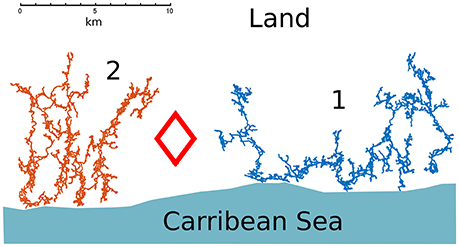
Figure 1. Cave divers' maps of (1) the Sac Actun system and (2) Ox Bel Ha. The diamond symbol represents the location of the town of Tulum and the coastline is sketched.
In Hendrick and Renard [1], we analyzed these systems as spatial graphs embedded in the plane and characterized their properties. Figure 1 shows the maps of the two networks that were acquired by cave divers. A conduit is mapped as N points (nodes) linked by N−1 lines (links) in such a way that the degree of the inner nodes is 2 and, at the extremities where conduits meet, nodes are of degree >2. Nodes located at dead ends of the networks have degree 1. The length of the links is roughly the size of the ruler used to map the network. These karst systems are quite homogeneous networks, characterized by a mean of degree distribution around 2.35 and a maximum node degree of 5.
Both Ox Bel Ha and Sac Actun have fractal dimension df ≈ 1.5, and exhibit the same conductivity scaling behavior. For each network, the conductivity σ between two nodes scales with the Euclidean distance L that separates them, i.e., . Both networks are characterized by a conductivity exponent . They also share a similar diffusion behavior. Diffusion is anomalous, the mean square displacement of a walker is given by with a walk exponent dw ≈ 2.4. It was also found that this set of exponents is in agreement with the (2-dimensional) Einstein relation .
2.2. Methods: Computation of df, dw, and
In the following, we study the fractal dimension, conductivity exponent, and walk exponent of subnetworks of backbones using a large number of numerical simulations. The fractal dimension is computed using the Maximum-Excluded-Mass-Burning algorithm, described in Song et al. [23]. Figure 2 illustrates one step during the renormalization procedure that is used to investigate the scaling properties of the networks. Details on this procedure are provided in Hendrick and Renard [1].
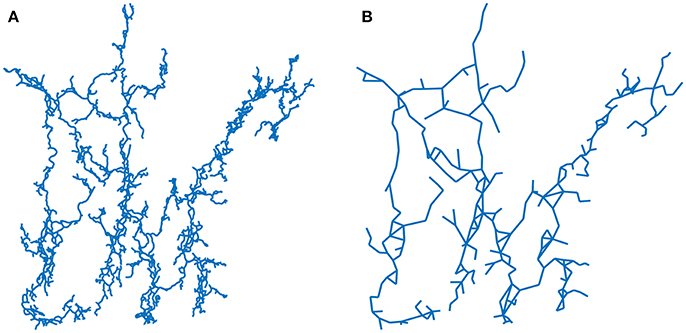
Figure 2. Renormalization of Ox Bel Ha using the Maximum-Excluded-Mass-Burning algorithm [23]. Main orientation conduits are highlighted by renormalization. Main flow paths occurs from inland (upper part of the network) to the sea (bottom part). The Ox Bel Ha network (A) and a renormalized version (B).
The conductivity exponent is obtained evaluating the relation for pairs of randomly sampled nodes (imposing for each sample pairs the same inflow rate). More precisely, we solve the Kirchhoff's circuit laws equations on the subnetwork connecting the two sampled nodes assuming, on each link, a flow described by the Hagen-Poiseuille law [24]. The resistance of each link is taken as unity [in the following, we work on square grids, thus link (conduit) length is fixed and we assume the same radius for each link]. The walk exponent is computed by evaluating the mean square displacement of random walkers for different initial nodes.
3. Karst Networks as Subnetworks of the Percolation Backbone
3.1. Percolation Theory: Background Considerations
The model is based on percolation theory that provides a standard framework for studying connected structures. The percolation model is that a fraction p of randomly chosen sites is occupied of a 2D square lattice. A cluster is a set of occupied sites connected to their nearest neighbors. When p is small, the clusters are isolated, while as p increases so do the size of the clusters. At the percolation threshold p = pc (pc ≈ 0.593 for a square lattice), a cluster spans the lattice (and would also span an infinite lattice). The correlation length ξ (the characteristic size of clusters) depends on p and diverges at p = pc as , with ν an universal exponent (independent of the lattice geometry) equal to 4/3 in two dimensions.
In our numerical simulations, the lattices are finite and the infinite cluster is defined as the largest cluster that connect the lattice's boundaries. We call this the the percolation cluster.
At criticality, i.e., at p = pc, the percolation cluster is self-similar on all length scales (for an infinite lattice). Here we focus on the backbone of the percolation cluster, defined as the conducting part (i.e., links of the percolation cluster carrying non-zero flow rates) of the percolation cluster. The fractal dimension, walk exponent and conductivity exponent of the critical infinite percolation cluster and critical backbone are known [17]. Table 1 summarizes these values and compares them with the values measured for the karstic systems in Tulum. Since we observe quite different exponents we cannot simply use the percolation cluster or its backbone directly as a relevant model for karst networks.
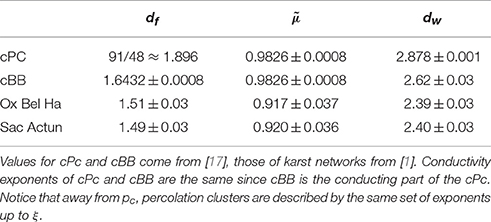
Table 1. Fractal dimension df, conductivity exponent and walk exponent dw of critical percolation cluster (cPC), critical backbone percolation cluster (cBB) and Tulum karst networks.
The probability P∞ that a node of a percolation cluster belongs to the infinite spanning cluster is zero for p<pc and is given by a power law close to and above pc, with a universal exponent β = 5/36 in 2 dimensions. The percolation model is an archetype model for continuous phase transition. The probability P∞ is the order parameter that distinguishes the disconnected phase to the connected phase. At the critical point p = pc, a collective behavior emerges at all length scales since the correlation length ξ diverges.
3.2. Proposed Model Using Subnetwork of Percolation Backbone
Karst networks are structures connecting inlets to outlets to allow the transport of water in heterogeneous media. Therefore, percolation theory is a natural starting point to model such of systems.
We consider networks in a busbar configuration where a fixed flux is prescribed between two parallel edges (Figure 3). We equally distribute the imposed total inflow rate between the nodes connected to the upstream edge. This geometry is adapted to the study of karst networks around Tulum since the real networks transport groundwater from inland, where precipitation is recharging the system, toward the discharge area (the Caribbean Sea). The overall flux traversing the system is imposed by the climatic conditions. Thus, the total water flow rate traversing a karst network is time varying. We restrict our study to a prescribed fixed flux representing the average of the total flow rate over the year. We do not consider a fixed water height constraint. The sea level is a water head boundary. However, there is not an upstream structure, such as a lake, that may constitute a water height constraint for the networks of Tulum. Thus, we focus on systems experiencing a prescribed fixed flux.
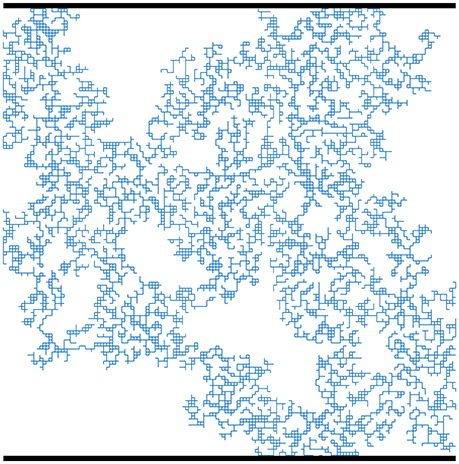
Figure 3. Illustration of the busbar geometry. A fixed flux is imposed between the two edges (represented by the black thick lines).
In the remainder of this work, we always consider the (largest) percolation cluster that connects the two edges of the busbar configuration.
The proposed modeling procedure consists of numerically generating a percolation cluster for a given value of p (greater or equal to pc). A prescribed flux is imposed on this network as a boundary condition between the edges of the busbar configuration. Water flows in the percolation cluster from the upstream edge to the downstream edge. The magnitude of the flow is computed by solving numerically Kirchhoff equation (using the Hagen-Poiseuille equation and a resistance of one for each link). It is then assumed that the karst network grows along the links of the percolation cluster that carry the strongest flow rates and that form a connected network that spans the two edges. Thus, we study karst networks as subnetworks of backbones of the percolation clusters.
We take as parameter θ = Qt/Qmax with Qt the imposed threshold flow rate (i.e., minimal flow rate allowed for a link to be part of the karst network). with 〈i, j〉 links of the percolation cluster and Qij the flow rate on the link 〈i, j〉1. The connected network of links carrying a flow rate above θ and which connect the two edges of the busbar geometry, are named θ-subnetwork. Examples of θ-subnetworks are illustrated in Figure 4.
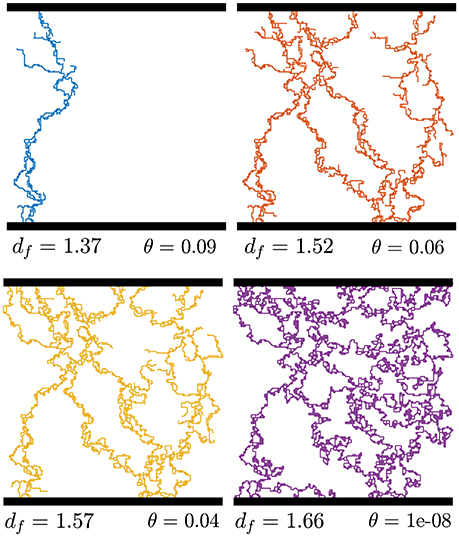
Figure 4. Illustration of θ-subnetworks extracted from a percolation cluster of site occupation probability p = 0.60. Notice that the size of largest loops grow from θ = 10−8 to θ = 0.06 and then reduces.
3.3. Properties of θ-Subnetworks
We investigate, through numerical simulations, the properties of θ-subnetworks for different site occupation probabilities at the critical point and above. We consider p = 0.593, 0.60, 0.61 and p = 0.62. For each probability, we generate 100 percolation clusters. From each percolation cluster, we extract2 6 θ-subnetworks taking θ ∈ [0.01, 0.1]. The effective fractal dimension, conductivity exponent and walk exponent are computed for each θ-subnetworks. The results of the numerical experiments are reported in Figure 5. The curves represent averages of all realizations for a given value of p. The percolation clusters are generated on a square lattice containing 150 × 150 nodes. We work with site percolation for computational convenience. The percolation network is built by creating links between first nearest neighbors (nodes separated by a maximal distance equal to the lattice parameters).
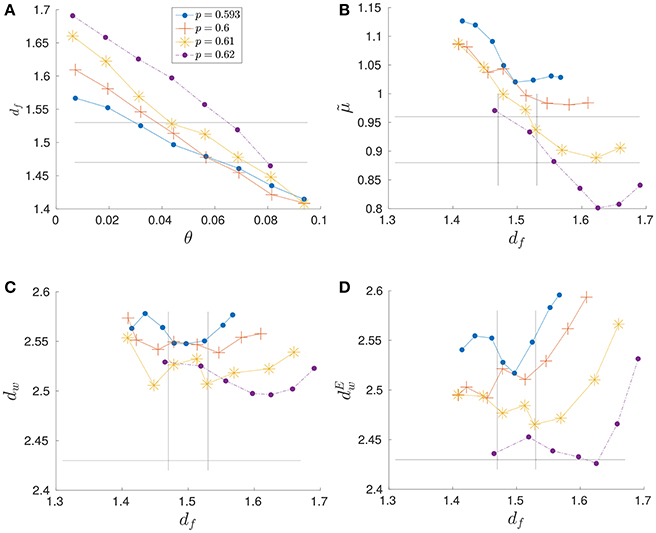
Figure 5. (A) Fractal dimension df, (B) conductivity exponent , (C) walk exponent dw, and (D) walk exponent computed using the Einstein relation of θ-subnetworks of percolation clusters generated using threshold probabilities p = pc = 0.593, p = 0.60, p = 0.61, and p = 0.62. Zones delimited by lines represents exponents, with the error intervals, of observed karst networks (Table 1). In (C,D) only the upper allowed value of dw is represented by a line.
Dimensionally speaking, a karst network can be a θ-subnetwork of a critical backbone, as the fractal dimension of the backbone is larger than the fractal dimension of observed karst network (Table 1). However, at criticality, the conductivity and the walk exponents of θ-subnetworks are, on average, too large (the curves p = 0.593 in Figure 5). Thus, we have to consider percolation clusters above the critical probability.
Figure 5A shows that the fractal dimension is a decreasing function of θ. For a given θ, the fractal dimension of the generated structures generally increases with the percolation probability p. Meanwhile, the conductivity exponent (Figure 5B), for a given df, decreases with the percolation probability p. The same remarks hold for the walk exponents (Figure 5C). The behaviors of and dw can be understood intuitively by considering that, as p increases, the number of links of the percolation clusters increases. Thus, on average, the resistance of the percolation cluster decreases and hence decreases. The walk exponent dw decreases as p increases, since, at a large scale, the percolation clusters are statistically more homogeneous (i.e., dw → 2).
We notice that for p ≥ 0.61, the θ-subnetworks have a fractal dimension df ≈ 1.5 and also have conductivity exponent close to the one observed for the networks of Tulum (Figure 5B). However, the walk exponents of the generated structures are slightly higher compared to the one of Tulum's karst networks (Figure 5C).
There is no guarantee that the generated structures respect the Einstein relation. We examine the validity of this relation as a hallmark since this one is satisfied by the karst networks of Tulum and for homogeneous fractal structures such as percolation cluster or the Sierpinski gasket. It is noteworthy that, even if the relation is not fulfilled exactly with the proposed model, the behavior of the walk exponent computed via the Einstein relation is similar to the one computed directly by random walk simulation (Figure 5D) taking into consideration that the exponents df, dw, and are computed using independent measures. As a further step, we study the deviation from the Einstein relation, i.e., (Figure 6). The relation is better satisfied close to pc and for small θ (i.e., large df). This is not surprising because critical percolation clusters and their backbones satisfy the Einstein relation up to the scale of the lattice size.
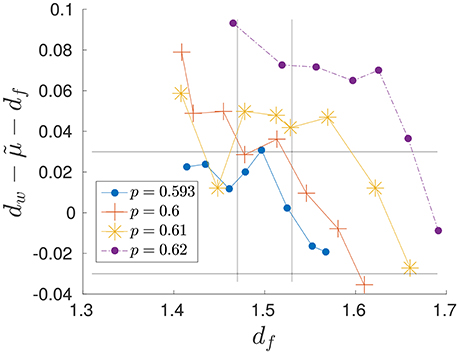
Figure 6. Deviation from the Einstein relation. Vertical lines represent Tulum's karst networks fractal dimension, given the confidence interval. Horizontal lines are confidence interval given exponents (df, dw, and ) computed on Tulum's karst networks (Table 1).
3.4. Remark on Expected Scale Behaviors of θ-Subnetworks
If we consider θ-subnetworks of percolation clusters above pc, we lose self-similarity at the large scale. The typical size of percolation clusters is given by the correlation length . Above and below pc, clusters are self similar up to the correlation length (ξ correspond to the typical finite size of finite clusters). Above pc, ξ corresponds also to the size of largest holes on the infinite spanning cluster. If we consider p>pc, ξ is reduced and percolation looks more and more homogeneous (the size of largest holes of infinite spanning cluster are reduced). However, here we consider only θ-subnetworks which are sparser structures than backbones. The holes (loops) sizes vary non-monotonically with θ. Holes size grows with θ until the θ-subnetwork collapses into a small structure only containing small loops (Figure 4). Therefore, the correlation length scale ξ of the substrate (the percolation cluster) is not the correlation length scale ξθ of its θ-subnetworks. Nonetheless, ξ and ξθ correspond for small θ, i.e., close to the backbone. This observation aims to clarify why proper scaling behavior is expected for θ-subnetwork even above criticality.
4. Karst Networks and the Minimization of Dissipated Energy and Formation Cost
Karst networks are natural systems. Therefore, it is reasonable to assume that they grow in a manner such that the resulting structures minimize the dissipation of energy related to the transport of underground water.
4.1. Definition of the Energy and Calculation
To investigate whether this assumption holds, we compute the (rate of) energy E dissipated by the viscous forces on the θ-subnerworks. Letting Rij be the resistance associated to the link 〈i, j〉 and Qij its flow rate, the dissipated energy (assuming a laminar flow described by the Hagen-Poiseuille equation) is given by (see for example [25]).
The networks generated by our model, whose structures tend to approach the characteristics of real karst networks, are rather different than backbones. However, the backbone of a percolation cluster is the subnetwork that, by maximizing the number of conducting links, minimizes E. Thus, one could expect karst networks to develop until they reach a backbone structure.
Our model is static, meaning we work with a steady state flow and do not allow conduit radii to change over time. Consequently, we cannot study how a karst evolves from its early stage to its maturity. What we can do is to compare the θ-subnetworks with each other to try to understand the structure of observed karst networks.
Our very first hypothesis is that karst systems develop along links carrying the strongest flow rates. One can argue that a strong flow rate is needed to create a link and keep it open. A limiting process of the physics of dissolution is the mass transport. When water dissolves limestone, it saturates in calcite and hence, if there is not a sufficient flux to flush out dissolved calcite, the dissolution process stops. In this way, to guarantee a sufficient water pressure gradient along each links, the network has to concentrate the water flow by limiting the number of conduits. Hence, we are led to consider θ-subnetworks that optimize the dissipated energy for a limited size. Therefore, we make the assumption that karst networks are structures that minimizes
with f(N) a cost function depending on the number of nodes N of the network. The simplest choice is f(N) = αN with α a constant. We are interested in how C varies with θ. We set the constant to be α ≡ Emax/Nmax, with , and , which has interesting implications. While α looks arbitrary, it is the ratio of two natural constants of percolation clusters. The maximum of N is realized for θ → 0 by the backbone, whereas the maximum of E is realized by the smallest (in terms of number of nodes N) existing θ-subnetworks which tend to be the shortest path of percolation clusters connecting the two edges of the busbar geometry.
4.2. Results
Figure 7A illustrates the behavior of the energy terms for θ-subnetworks extracted from a percolation cluster at p = 0.60. When θ increases, the dissipated energy E rises, while the cost of dissolution proportional to N reduces. The overall cost C has a minimum for θ ≈ 5 · 10−2. When these results are plotted as a function of df (Figure 7B), one can see that the dissipated energy E varies abruptly around df ≈ 1.52. The minimum of C is also obtained with this model for df ≈ 1.52.
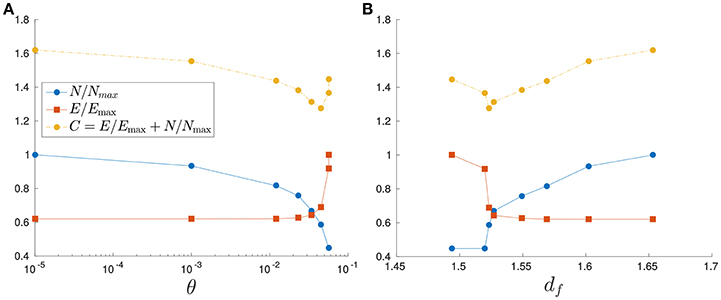
Figure 7. Behaviors of the dissipated energy E, the number of nodes N and the function C of θ-subnetwork extracted from a percolation cluster of percolation probability p = 0.60. The curves are plotted with respect to θ (A) and df (B).
To refine the understanding of the links between the structure and the overall energy dissipated in the system, the minimum of C is computed as a function of θ for each set of 6 θ-subnetworks extracted from 400 percolation clusters (100 percolation clusters for each considered p, we work with the same set of θ subnetworks we employ for the Figure 5). The average properties of the structures minimizing C are summarized in Table 2. The fractal dimensions, conductivity exponents and walk exponents of the structures that minimize C depend on p. The structures exhibiting a similar scaling behavior than Tulum's karst networks and minimizing C correspond to p = 0.61 (excepted the walk exponent, which is too high). For p > 0.61, the properties of the structure of θ-subnetworks deviate significantly from real karst networks.
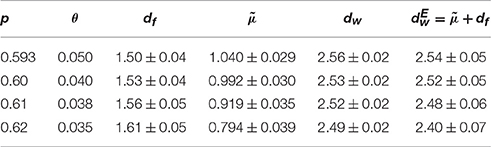
Table 2. Exponents of θ-subnetworks minimizing C.
4.3. Discussion about the Minimization of C
4.3.1. Analogy with Rivers Networks
In Rodríguez-Iturbe and Rinaldo [14], the authors make a static model of river networks, the Optimal Channel Network (OCN). They assume that a river network develops until it minimizes a functional representing its dissipated energy. The proposed network model minimizes the dissipated energy, and is shown to be statistically similar to real river networks. Since real rivers are not static but rather develop over long time scales, a dynamical model is needed to asses the evolution of river networks. In Banavar et al. [26], a partial differential equation describing the erosion of an elevation field that represents the landscape is derived. River networks are the drainage directions over the elevation field. It is shown that the stationary solutions of the elevation field equation corresponds to an OCN. The numerical simulations reveal that the model is characterized by a very short time scale, called the freezing time, followed by a much longer time scale, the relaxation time. After the freezing time, the structure of the river network, i.e., its drainage directions, does not evolve any more. During the relaxation time, the elevation field is modified but without changing the drainage directions until it reaches a stable configuration characterized by a drainage network dissipating a minimal amount of energy, an OCN. The fact that the system involves in such a short period followed by a much longer relaxation time that does not change network structure provides an explanation to why river networks of different ages exhibit similar statistical properties. A review concerning these concepts is provided in Rinaldo et al. [19].
It is temping to assume an analog dynamical scenario for the description of the development of karst networks: during the short freezing time period, the structure of a karst system quickly takes on the observed structure (described by the minimum of C), and then dissolution widen the conduits over a long period (the relaxation time).
It results from this discussion that the study of the structure of young karst systems, in comparison with mature networks, may support or deny the freezing time hypothesis. However, young karst networks are generally characterized by conduits of small apertures and thus are not directly observable. Therefore, their properties should be studied through dynamical models of dissolution.
4.3.2. Early Development of Karst Networks
Siemers and Dreybrodt [20] presented a numerical dynamical model of karst network evolution. The dissolution process is studied on networks of fractures that are modeled as percolation clusters above pc. A busbar configuration is assumed and a prescribed water head difference is imposed between the edges. The percolation networks were built on a 30 × 30 square lattice. This model shows that the early development stage (that occurs under laminar flow), corresponding to widening of the fractures, determines the structure of the mature karst network. This initial period is brief compared to the entire evolution of the network toward its maturity. The authors show that preferentially dissolved fractures correspond to those forming the pathways offering the least resistance to the flow. However, for percolation probabilities p > 0.67, calcite under saturation mechanisms also play an important role in the selection of preferentially dissolved fractures3. For percolation probability close to pc, there is a small number of pathways offering small resistances to the flow, and these pathways are decisive for the resulting karst network structure and the details of the under saturation process is not important.
The model of Siemers and Dreybrodt [20] was designed to study the development of predominantly vertical karst networks. The dissolution process acts from the upper edge to the bottom edge, with the results that the water saturates in calcite while it enters in the network. However, the networks of Tulum are extended horizontal structures on which it is expected that rainfall water contributes to the injection of non saturated (in calcite) water over the catchment areas. In addition, the dissolution process of Tulum's karst networks is also highly determined by the sea water intrusion. Therefore, the analogies with this model has some limitations.
To conclude, in the work of Siemers and Dreybrodt [20], we recover the notion of the freezing time which is a short period at the early development of the networks during which the final structure of the karst networks is determined. Moreover, for percolation probability p ≲ 0.67, they show that the pathways of least resistance (which corresponds in our model to the θ-subnetworks) determines the network structure. This is an additional argument that indicates that our proposed model and global minimization principle are reasonable.
5. Conclusion
The model presented here aimed to reproduce the observed exponents (fractal dimension, conductivity exponent, and walk exponent) of karst networks of the area of Tulum. We studied the dissipated energy due to viscosity E and the cost (proportional to the number of nodes N) associated to the formation of the structures (θ-subnework) generated by the model.
We showed that for ranges of site occupation probability close to pc, the generated structures minimizing C = E + αN exhibit similar scaling behavior to the Tulum karst networks. The precise value of the constant α determines the minimum of C. Using physical arguments, we introduced a cost function that prevents the system from becoming too extended with the aim to keep the dissolution process active. However, more work is needed to better define the functional C.
A study of statistical properties of the structure of younger karst networks, and the set up of a dynamical model of dissolution adapted to Tulum's karst networks, could provide interesting additional information to assess the freezing time hypothesis, and may ultimately reinforce our approach.
Although, our model reproduced the fractal dimension and conductivity exponent of karst networks quite well, it failed to reproduce the walk exponent accurately. Improvement of the measure of dw, using for example the probability of first-passage time of random walk, should be considered. The results may confirm or deny the violation of the Einstein relation by the generated structures.
Others percolation models such as directed percolation [27] and percolation with long-range correlation [28] provide interesting features for karst modeling. A cluster generated by directed percolation exhibits a spatial anisotropy such as the one observed looking at the main conduits orientation of Tulum's karst networks (see Figure 2). Percolation with long-range correlations generate spatially correlated clusters in a similar way as dissolution creates correlated voids in rocks. However, fractal properties of the generated structures of both percolation models differ from those of the networks we want to model.
The multifractal properties of moments of flow rate (current) distribution is an important research topic for characterizing random resistor networks [18, 29]. Here we studied flow rate distributions truncated by the parameter θ. A more detailed study of their properties could help improve the understanding of the properties of the θ-subnetworks and constitute a possible direction for future research.
Finally, our model relies on the fine tuning of the percolation probability p and on the flow rate threshold θ. However, a karst network is a natural system and it is expected that it develops naturally toward the observed self-similar structure in a generic way (i.e., as a system having a critical point as an attractor of its dynamics without needing to tune any parameter in a precise manner). Generic scaling behaviors are features of self-organized criticality [30] or the Kardar-Parisi-Zhang equation [31] (among others). In our model, the minimum of the function C characterizes the attractor because karst networks are expected to be structures that minimize C. Thus, to avoid fine tuning, a dynamic stochastic equation for karst networks that evolves, in a generic way, to the minimum of C should be considered.
Author Contributions
MH conducted this work. MH and PR wrote the paper. PR initiated the study and participated in the discussion.
Funding
This work was funded by the Swiss National Science Foundation under the contract nb. 200021L_141298.
Conflict of Interest Statement
The authors declare that the research was conducted in the absence of any commercial or financial relationships that could be construed as a potential conflict of interest.
Acknowledgments
The authors are grateful to James G. Coke IV, Bil Phillips, and Robbie Schmittner of Quintana Roo Speleological survey for having provided the data at the basis of this study, as well as James Thornton and Stephen A. Miller for having revised the final version of this manuscript.
Footnotes
1. ^Indices i and j are labels of two linked nodes.
2. ^The largest θ at which there exists a θ-subnetwork varies between percolation clusters. Therefore, the interval of θ in which we sample the 6 θ-subnetworks differs from one percolation cluster to another. We do not sample at fixed θ's to avoid biased results or empty samples. Therefore, we extract 6 values of θ equally distributed on the interval [0.01, θmax], with θmax being the maximum value of θ for which a θ-subnetwork exists.
3. ^In Siemers and Dreybrodt [20] a bond percolation model is used to generate the fracture networks. For bond percolation on a square lattice, the critical probability is , with pb the bond percolation probability. The authors show that the details about the dissolution of calcite is determining for final network structure when pb > 0.6 which correspond to p ≳ 0.67 for site percolation.
References
1. Hendrick M, Renard P. Fractal dimension, walk dimension and conductivity exponent of karst networks around Tulum. Front Phys. (2016) 4:27. doi: 10.3389/fphy.2016.00027
2. Groves CG, Howard AD. Early development of karst systems 1. Preferential flow path enlargement under laminar flow. Water Resour Res. (1994) 30:2837–46.
3. Dreybrodt W, Gabrovsek F, Romanov D. Processes of Speleogenesis: A Modeling Approach. Carsologica. Editions Zalozba (2002).
4. Liedl R, Sauter M, Hückinghaus D, Clemens T, Teutsch G. Simulation of the development of karst aquifers using a coupled continuum pipe flow model. Water Resour Res. (2003) 39:1057. doi: 10.1029/2001WR001206
5. Jaquet O, Siegel P, Klubertanz G, Benabderrhamane H. Stochastic discrete model of karstic networks. Adv Water Resour. (2004) 27:751–60. doi: 10.1016/j.advwatres.2004.03.007
6. Borghi A, Renard P, Jenni S. A pseudo-genetic stochastic model to generate karstic networks. J Hydrol. (2012) 414–415:516–29. doi: 10.1016/j.jhydrol.2011.11.032
7. Collon-Drouaillet P, Henrion V, Pellerin J. An algorithm for 3D simulation of branchwork karst networks using Horton parameters and A* Application to a synthetic case. In: Garland J, Neilson JE, Laubach SE, Whidden KJ, editors. Advances in Carbonate Exploration and Reservoir Analysis. vol. Special Publications, 370. London: Geological Society. (2012). p. 295–306.
8. Pardo-Iguzquiza E, Dowd PA, Xu CS, Duran-Valsero JJ. Stochastic simulation of karst conduit networks. Adv Water Resour. (2012) 35:141–50. doi: 10.1016/j.advwatres.2011.09.014
9. Ronayne MJ, Gorelick SM. Effective permeability of porous media containing branching channel networks. Phys Rev E Stat Nonlin Soft Matter Phys. (2006) 73(2 Pt 2):026305. doi: 10.1103/PhysRevE.73.026305
10. Ronayne MJ. Influence of conduit network geometry on solute transport in karst aquifers with a permeable matrix. Adv Water Resour. (2013) 56:27–34. doi: 10.1016/j.advwatres.2013.03.002
13. Sornette D. Critical Phenomena in Natural Sciences: Chaos, Fractals, Selforganization and Disorder: Concepts and Tools. Berlin; Heidelberg: Springer Science & Business Media (2006).
14. Rodríguez-Iturbe I, Rinaldo A. Fractal River Basins: Chance and Self-Organization. Cambridge, UK: Cambridge University Press (2001).
15. Pastor-Satorras R, Rothman DH. Scaling of a slope: the erosion of tilted landscapes. J Stat Phys. (1998) 93:477–500.
16. Stanley HE, Coniglio A. Flow in porous media: the “backbone” fractal at the percolation threshold. Phys Rev B (1984) 29:522.
17. ben-Avraham D, Havlin S. Diffusion and Reactions in Fractals and Disordered Systems. Cambridge, UK: Cambridge University Press (2000).
18. Redner S. Fractal and multifractal scaling of electrical conduction in random resistor networks. In: Meyers RA, editor. Mathematics of Complexity and Dynamical Systems. New York, NY: Springer (2012). p. 446–62.
19. Rinaldo A, Banavar JR, Maritan A. Trees, networks, and hydrology. Water Resour Res. (2006) 42:06D07. doi: 10.1029/2005WR004108
20. Siemers J, Dreybrodt W. Early development of karst aquifers on percolation networks of fractures in limestone. Water Resour Res. (1998) 34:409–19.
21. Kambesis PN, Coke IV JG. Overview of the controls on eogenetic cave and karst development in Quintana Roo, Mexico. In: Lace MJ and Mylroie JE, editors. Coastal Karst Landforms. Springer (2013). p. 347–73.
22. Bauer-Gottwein P, Gondwe BR, Charvet G, Marín LE, Rebolledo-Vieyra M, Merediz-Alonso G. Review: the Yucatán Peninsula karst aquifer, Mexico. Hydrogeol J. (2011) 19:507–24. doi: 10.1007/s10040-010-0699-5
23. Song C, Gallos LK, Havlin S, Makse HA. How to calculate the fractal dimension of a complex network: the box covering algorithm. J Stat Mech. (2007) 2007:P03006. doi: 10.1088/1742-5468/2007/03/P03006
25. Renard P, De Marsily G. Calculating equivalent permeability: a review. Adv Water Resour. (1997) 20:253–78.
26. Banavar JR, Colaiori F, Flammini A, Maritan A, Rinaldo A. Scaling, optimality, and landscape evolution. J Stat Phys. (2001) 104:1–48. doi: 10.1023/A:1010397325029
27. Hinrichsen H. Non-equilibrium critical phenomena and phase transitions into absorbing states. Adv Phys. (2000) 49:815–958. doi: 10.1080/00018730050198152
28. Prakash S, Havlin S, Schwartz M, Stanley HE. Structural and dynamical properties of long-range correlated percolation. Phys Rev A (1992) 46:R1724.
29. Stenull O, Janssen HK. Noisy random resistor networks: Renormalized field theory for the multifractal moments of the current distribution. Phys Rev E Stat Nonlin Soft Matter Phys. (2001) 63:036103. doi: 10.1103/PhysRevE.63.036103
30. Pruessner G. Self-Organised Criticality: Theory, Models and Characterisation. Cambridge: Cambridge University Press (2012).
Keywords: karst network, scaling behavior, percolation model, percolation backbone, optimal network
Citation: Hendrick M and Renard P (2016) Subnetworks of Percolation Backbones to Model Karst Systems Around Tulum, Mexico. Front. Phys. 4:43. doi: 10.3389/fphy.2016.00043
Received: 13 July 2016; Accepted: 17 October 2016;
Published: 02 November 2016.
Edited by:
Zbigniew R. Struzik, University of Tokyo, JapanReviewed by:
Gunnar Pruessner, Imperial College London, UKMichael Ronayne, Colorado State University, USA
Franci Gabrovšek, Karst Research Institute, Slovenia
Copyright © 2016 Hendrick and Renard. This is an open-access article distributed under the terms of the Creative Commons Attribution License (CC BY). The use, distribution or reproduction in other forums is permitted, provided the original author(s) or licensor are credited and that the original publication in this journal is cited, in accordance with accepted academic practice. No use, distribution or reproduction is permitted which does not comply with these terms.
*Correspondence: Martin Hendrick, martin.hendrick@unine.ch