RFEA Measurements of High-Energy Electrons in a Helicon Plasma Device with Expanding Magnetic Field
 Njål Gulbrandsen
 Åshild Fredriksen
- Department of Physics and Technology, University of Tromsø-The Arctic University of Norway, Tromsø, Norway
In the inductively coupled plasma of the Njord helicon device we have, for the same parameters as for which an ion beam exists, measured a downstream population of high-energy electrons emerging from the source. Separated measurements of energetic tail electrons was carried out by Retarding Field Energy Analyzer (RFEA) with a grounded entrance grid, operated in an electron collection mode. In a radial scan with the RFEA pointed toward the source, we found a significant population of high-energy electrons just inside the magnetic field line mapping to the edge of the source. A second peak in high-energy electrons density was observed in a radial position corresponding to the radius of the source. Also, throughout the main column a small contribution of high-energy electrons was observed. In a radial scan with a RFEA biased to collect ions a localized increase in the plasma ion density near the magnetic field line emerging from the plasma near the wall of the source was observed. This is interpreted as a signature of high-energy electrons ionizing the neutral gas. Also, a dip in the floating potential of a Langmuir probe is evident in this region where high-energy electrons is observed.
1. Introduction
An electric double-layer forming spontaneously in a helicon plasma source with an expanding magnetic field was first measured by Charles and Boswell [1]. It was named current-free double layer (CFDL), as it formed self-consistently without external current forcing. The CFDLs formed in these experiments have later been repeated in a number of helicon devices [2–9]. As a result of a potential the drop set up between the source and the diffusion chamber an ion beam is formed. As no external current is necessary to form this ion beam, the free electrons in the CFDL in the downstream plasma, play an important role in balancing the ion current in the beam.
To understand the underlying physics of characteristic parameters of CFDLs it is thus important to obtain information about the electrons and their energy distribution. Previously, Takahashi et al. [10] observed, in a similar experiment, high-energy electrons at a magnetic field line mapping to the edge of the source by measuring the electron energy distribution function (EEDF) with a RF compensated Langmuir probe.
Some theoretical models and numerical simulations have been carried out [11] and may indicate the role of electrons in the formation of the CFDL. The first one-dimensional modeling [12] and 1D PIC simulations [13] were able to reproduce the potential drops and an ion beam was produced in the simulations. However, these models are only one-dimetional and do not include the full effect of the expanding magnetic field.
Later, others [14–17] have pointed out the 2D nature of the CFDL, in that the electrons follow the magnetic field lines and escape toward the side walls, while the non-magnetized ions follow a straight path from the source into the expansion chamber [18]. A curved 2D CFDL potential structure [19, 20] and the conics of enhanced plasma density along the outermost magnetic fields emerging from the source region [21] has been observed. Takahashi et al. [10] and Charles [21] has proposed that the enhanced plasma density along the last field line is produced by an additional ionization from the high-energy electrons transported from the source along the field line. On the other hand Saha et al. [22] has argued that the electric field set up between the positively charged ion beam region and the electrons following the field lines will accelerate the ion beam also radially giving rise to an oscillation that is responsible for the higher densities at the edges.
Still, more complete measurements of the high-energy electrons remain to be carried out. In this paper, we report the first measurements of energetic electrons in the downstream region of the CFDL in the Njord device, applying a Retarding Field Energy Analyzer (RFEA). By inverting the grids of an RFEA, the probe can be applied to measure the flux of the high-energy tail of electrons [23–26]. In Section 2, the experimental setup and diagnostics is explained, and the measured distributions of energetic electrons are reported and discussed in Section 3.
2. Experimental Setup
The Njord device (Figure 1) at the University of Tromsø (UiT) is an inductively coupled helicon plasma device [9, 27]. The source consists of a 30 cm long, 13 cm diameter Pyrex tube with a Boswell type [28] saddle antenna wrapped around it, coupling up to 1000 W of RF-power at 13.56 MHz to the argon gas. Two magnetic field coils are placed around the source tube. In this study we used 5 A in the first coil and 6 A in the second coil to produce a maximum magnetic field of 200 G in the source. The plasma expands through a 20 cm diameter and 8 cm long port into a 120 cm long and 60 cm diameter expansion chamber. A turbomolecular pump connected to the expansion chamber keeps the base pressure at 10−6 Torr. The outer edge of the first source coil defines z = 0 and positive z is in the direction of the gas flow, from the source to the expansion chamber. The source itself starts at z = 4 cm.
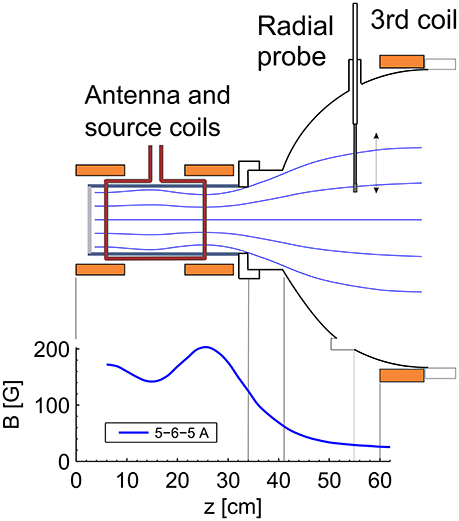
Figure 1. The experimental setup and magnetic field configuration in Njord.
A third field coil placed at z = 60 cm is used with a current of 5 A to provides a downstream magnetic field of about 30G. This field prevents electrons from the near wall region of the source from being lost at the walls of the large port.
Argon gas is fed to the source through an inlet in a grounded aluminum end plate of the source at z = 4 cm in Figure 1. The gas flow is controlled by an Omega flow controller and was kept at 2.0 sccm in this study, giving rise to pressures of 0.34 mTorr in the expansion chamber.
A radial probe feedthrough, at z = 55 cm, indicated in Figure 1, can be fitted with either an RFEA, an RF-compensated Langmuir probe or an emissive probe.
The control parameters and some typical plasma parameters for the Njord device are given in Table 1.
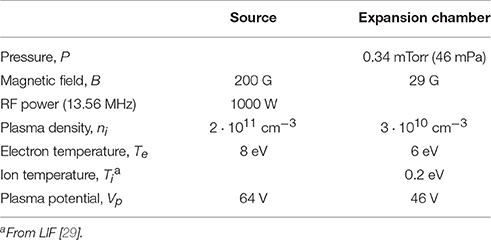
Table 1. Typical parameters for the Njord device.
The RFEA had a grounded brass housing with a cylindrical shape, a diameter of 16 mm and a thickness of 10 mm. The probe had four grids, three made from stainless steel mesh with a transmission factor of 44%, wire diameter of 0.050 mm and mesh openings of 0.100 mm while a fourth, the second from the aperture, was made of a nickel mesh with transmission of 67%, wire diameter of 0.024 mm and mesh openings of 0.100 mm. The distance between the grids was 0.7 mm, the front aperture was 2 mm and the diameter of the collector area was 3 mm.
Figure 2A shows the grid configuration for ion measurements. The repeller, R, was biased to −80 V and the discriminator, D, was scanned from 0 to 100 V. S is the secondary electron repeller and was kept at −18 V. The collector was kept at −9 V. The ion RFEA measurements is further described in Gulbrandsen et al. [29].
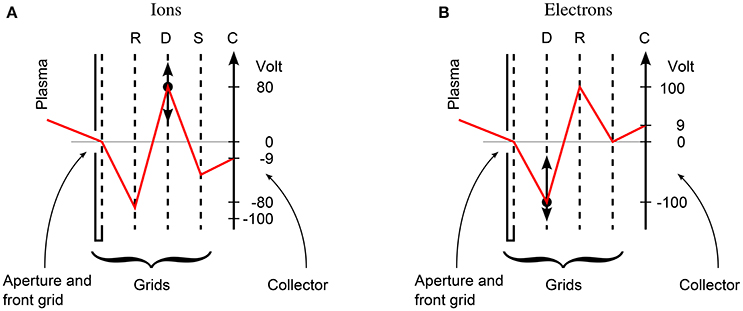
Figure 2. RFEA grid configurations for (A) ion measurements and (B) electron measurements.
Figure 2B shows the grid configuration for electron measurements. D is the discriminator grid and was scanned from 0 to −120 V, R is the repeller grid biased at +100 V and C is the collector kept at +9 V. The innermost grid was not needed in this configuration and was therefore grounded. This grid configuration with the discriminator in front of the repeller is similar to the one used by Gahan et al. [24, 30]. Only the electrons with energies high enough to overcome the sheath potential in front of the probe will be recorded, so that the RFEA detects only the high-energy tail of the EEDF [30]. The high-energy electron-tail temperature can be extracted from a linear fit to a plot of the logarithm of collector current [31]:
The derivative of the collector current is proportional to the EEDF for energies high enough to enter the probe [24].
An RF-compensated Langmuir probe [32] and a floating emissive probe were used to measure some of the background parameters of the plasma. For the emissive probe, we used the floating potential method where the floating potential at saturation is taken as the plasma potential [33, 34]. When the emission current exceeds the electron saturation current, the emissive probe will float close to the plasma potential. We used a filament current of 2.9 A. This method is expected to give a potential slightly lower than the plasma potential with an accuracy of the order of Te/e [35, 36].
3. Results and Discussion
Figure 3A shows an example of a logarithmic plot of collector current vs. discriminator voltage from the electron-RFEA in Njord at r = −7 cm. As only electrons overcoming the plasma potential barrier are collected, no saturation current is expected at the most positive voltage bias. The voltage axis runs from positive toward negative values, such that the electrons with lowest energy appears at the left. For the first 15 V a plateau where the collector current is changing very little is observed. From −15 to −30 V the collector current drops exponentially and a linear fit to the logarithm of the current using equation (1), reveals a tail-temperature of about 7.3 eV. For voltages lower than −30 V the collector current is higher than expected from the temperature fit. This high-energy tail indicates an electron population with even higher energies.
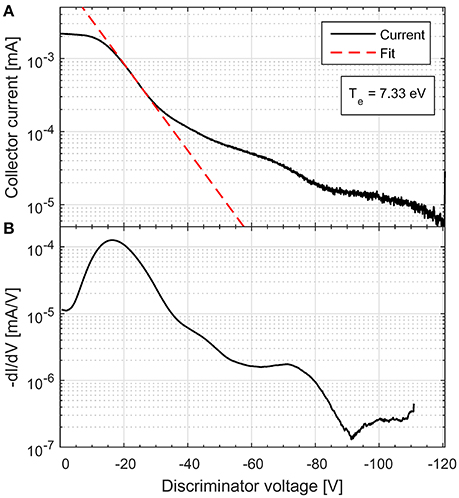
Figure 3. An electron-RFEA measurement form r = −7 in Njord. (A) The collector current, (B) the derivative of the collector current.
Figure 3B shows a logarithmic plot of the derivative of the collector current as a function of discriminator voltage. The derivative was found by applying a 151 point, 4 degree Savitzky-Golay filter [37] to the collector current. This derivative should be proportional to the EEDF for energies high enough to enter the probe [24]. In this case the plasma potential was around 40 V, so that the electron energies in the plasma would be about 40 eV higher than what the discriminator voltage shows.
Figure 4A shows radial profiles of RFEA Ion Distribution Functions (IDF) [29] measured at z = 55 cm. A beam can be seen at around 60 V. The beam flux decreases with radius and disappear around r = 12 cm. The background distribution (around Vb = 40 V) has a maximum in the center (r = 0 cm) and another peak at r = 14 cm. The ion beam RFEA measurements are further discussed in Gulbrandsen et al. [29].
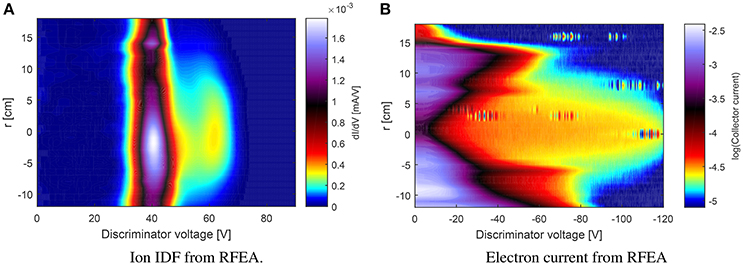
Figure 4. RFEA measurements of (A) ions and (B) electrons in Njord at 2.0 sccm flow and 5-6-5 A magnetic field.
In Figure 4B the logarithm of the collector current of the RFEA in electron measurement configuration is plotted vs. discriminator voltage and radial position. The high-energy electrons seen at ±7 cm correspond to the width of the source and the width of the ion beam, while the high-energy electrons at r = 14 cm corresponds well with a magnetic field line emerging from the edge of the source [29]. We have already seen increased ion densities in this position (Figure 4A), possibly due to ionization from the high-energy electrons. The yellow plateau in the figure indicates a small density of electrons with energies larger than 100 eV near the center of the plasma column. Saha et al. [22] has earlier measured electrons with energies more than 100 eV in the center of the plasma in a similar experiment using a RFEA with a floating front grid and a fixed voltage electron repeller. The radial profile they obtained looks similar to the one we have for energies higher than 100 ev (less than −100 V).
Some selected profiles of the electron currents from Figure 4B along with their derivatives are shown in Figure 5. Figure 5A shows an electron measurement from the background plasma of the outer parts of the expansion chamber (r = 18 cm), shielded from the source. We observe what appears to be a part of a low density single Maxwellian electron population with a temperature around 6 eV. A small plateau of the collector current is observed for the first 5 V of the scan.
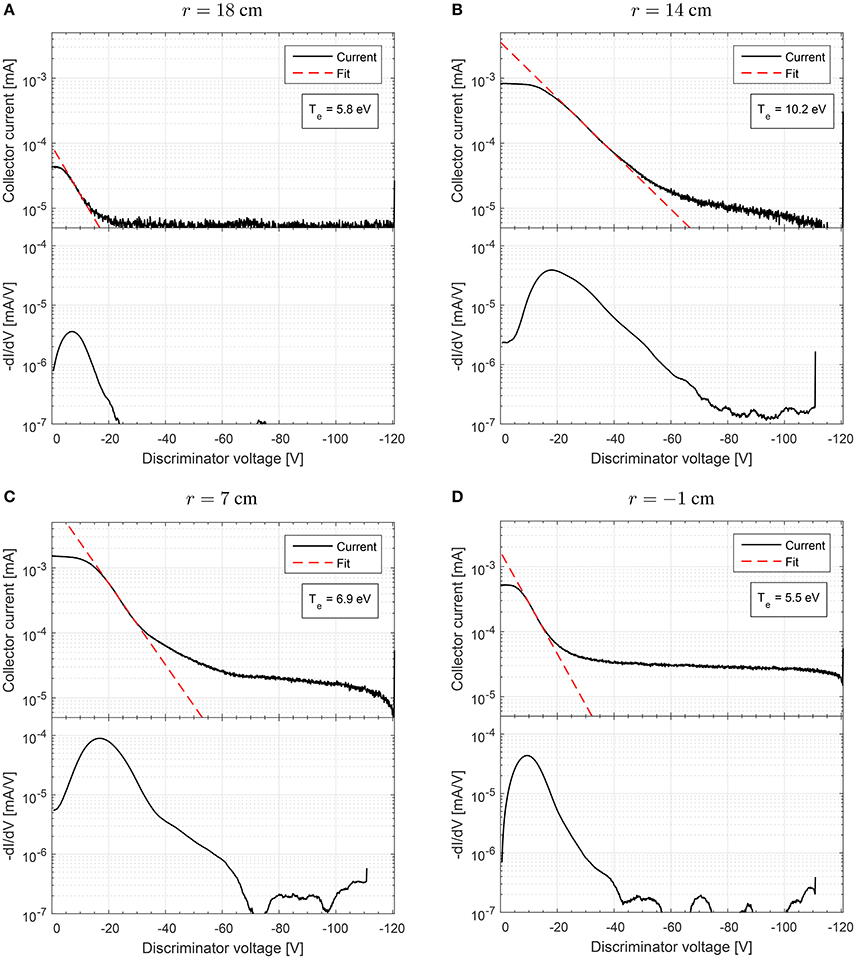
Figure 5. Electron-RFEA measurement from Njord from four different positions, (A) in the background plasma, (B) at the other most magnetic field line coming from the source, (C) at the edge of the ion beam and (D) in the middle of the ion beam.
Figure 5B is from r = 14 cm and shows a higher density. A larger plateau is visible in the beginning of the scan. The main population observed seems to have an apparent temperature of 9.6 eV, but there is an indication of an even higher energy tail from −80 V to −100 V.
Figure 5C from r = 7 cm shows several populations of electrons. Between −20 and −40 V a Maxwellian electron distribution is found with an apparent temperature of 6.5 eV. Then there is indications of an other population between −40 and −80 V, and then a high-energy tail below −80 V.
Figure 5D is near from the center of the expansion chamber. Here we see parts of a single Maxwellian electron distribution with temperature of 5.3 eV. In addition there is a long plateau in the collector current going from −20 V and to the end of the scan which indicates the existence of a few electrons with an even higher energy.
Next we compared parameters derived from the RFEA with equivalent parameters obtained with Langmuir and emissive probes. Figure 6A shows the plasma potential from an RF-compensated Langmuir probe [32] (dots), floating emissive probe (circles), ion RFEA facing the source (crosses) and ion RFEA pointing 90° away from the source (triangles). The plasma potential from the RFEA measurements corresponds well with the Langmuir probe within a couple of volt, while the plasma potential from the emissive probe was about 7–8 V higher. Earlyer simulations have shown that the plasma potential measured with an RFEA could be as much as 5 V lower than the real plasma potential [38, 39]. It is also of interest to notice that the potential from the emissive probe has peaks near r = ±10 cm while the Langmuir probe and the RFEA has minima at the same place, which indicates that the emissive probe responds differently to energetic electrons. These measurements are not carried out at the same time so it might be that the Langmuir probe and the RFEA was affecting the plasma and reducing the plasma potential. Normally the potential from a floating emissive probe is expected to be slightly lower than the plasma potential with about 2Te/e [36].
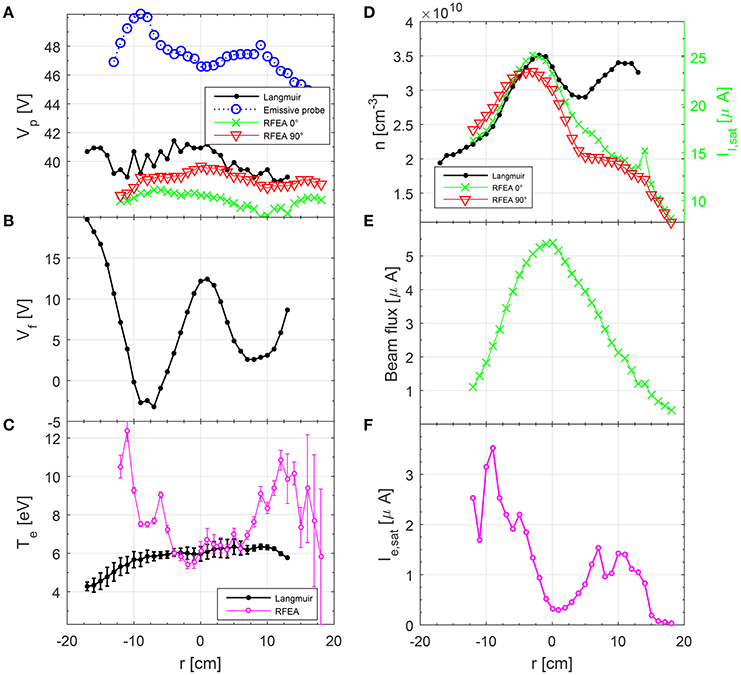
Figure 6. 2.0 sccm 5-6-5A 1000W. (A) Plasma potential from Langmuir probe (dots), emissive probe (circles) and RFEA facing the source (crosses) and 90° away from the source (triangles). (B) Floating potential form Langmuir probe. (C) Electron temperature form Langmuir probe (dots) and tail-temperature from electron-RFEA (crosses). The error bars represents the estimated uncertanty. (D) Ion density from Langmuir probe (dots), ion saturation current from the RFEA facing the source (crosses) and ion saturation current from the RFEA facing 90° away from the source (triangles). (E) Beam flux (in units of current) from ion-RFEA. (F) Electron saturation current from electron-RFEA.
In Figure 6B the floating potential from the Langmuir probe shows distinct minima around r = ±8 cm, which can be expected from the fact that the higher electron flux from the energetic electrons will contribute to a reduced the floating potential. This behavior of the floating potential is similar to the one observed by Takahashi et al. [16].
Figure 6C shows electron temperature from Langmuir probe (dots) and electron-RFEA (crosses). The electron temperature was extracted from the current-voltage characteristic of the RFEA as shown in Figure 5. Only the the high-energy tail of the EEDF is detected [24]. In the center the RFEA and Langmuir probe corresponds well, but at the edges the RFEA detected a higher temperature indicating a high-energy population of electrons. This resembles the two-temperature distributions Takahashi et al. [6] found in a similar device measuring electron energy probability functions (EEPF) using a RF-compensated Langmuir probe.
Figure 6D shows the ion density from the Langmuir probe and the ion flux to the RFEA facing the source, 0°, and 90° away from the source. Both the density and the ion flux had a peak in the center corresponding to the region where the beam was detected. The density also had a peak around r = +10 cm that was not observed for r = −10, and it is also not observed in the ion flux. Instead, we observe a small peak in the ion flux at r = 14 cm when the RFEA is facing the source that is not observed when the probe is turned 90° away from the source. The asymmetry in the density profile might be explained at least in part by the fact that for negative r the probe shaft is crossing the center of plasma and this might affect the plasma somewhat. It might also be that a slight asymmetry in the source antenna or the power deposition can create an asymmetry in the plasma density.
In Figure 6E the total integrated ion beam flux has a peak in the center and then decreases toward the edges. Using the half-value width the beam radius is around r1/2 = 7 cm.
Figure 6F shows the electron saturation current from the electron-RFEA, wich is proportional to the energetic electron flux to the RFEA. The profile is “hollow” and has a minimum in the center and peaks at r = 7, 10, −5 and −9 cm.
At a first look the plateau observed in the first few volts of electron RFEA-measurements (Figures 3, 4B, 5) resembles an electron beam. But as we have seen from Figures 4B, 5 it is to a larger or smaller degree found on all the electron RFEA-measurments, also the ones of the background plasma (r = 18 cm) where we expect no high-energy electrons, because it was shielded from the source by the walls of the port. As can be seen in Figure 5 the size of this plateau seems to vary fairly systematic with the total electron current to the RFEA-probe. When we compare the derived temperatures from the electron-RFEA with RF-compensated Langmuir probe in Figure 6C we find that the electron-RFEA temperatures matches well with the Langmuir probe temperatures in the center (r = −4 to 6 cm) and at the end (r = 18) indicating that the RFEA sees the high-energy part of the same Maxwellian electron distribution as the Langmuir probe. We conclude that this plateau seen for the first 5 to 20 V of each scan is not a feature of the electron distribution in the plasma, but rather an effect of the probe. It might be related to the RF-oscillations in the sheath in front of the probe since the probe surface was grounded or it might be some kind of saturation effect in the probe due to a high electron flux. If we neglect this plateau, the rest of the measurements make good sense and we manage to match the temperature with the Langmuir probe in the areas where we see less high-energy electrons.
To summarize we take a closer look at the positions of the shown features with respect to the magnetic field and source geometry. Figure 7 shows the magnetic field lines originating in the source of Njord as calculated from the axial magnetic field. The three magnetic coils are marked as orange boxes. The vertical dotted line at z = 55 cm marks the axial position of the probes. The horizontal dashed lines at r = ±7 cm represent the observed width of the beam [29]. This type of ion detachment from magnetic field lines has earlier also been observed by Takahashi et al. [18] and Cox et al. [20].
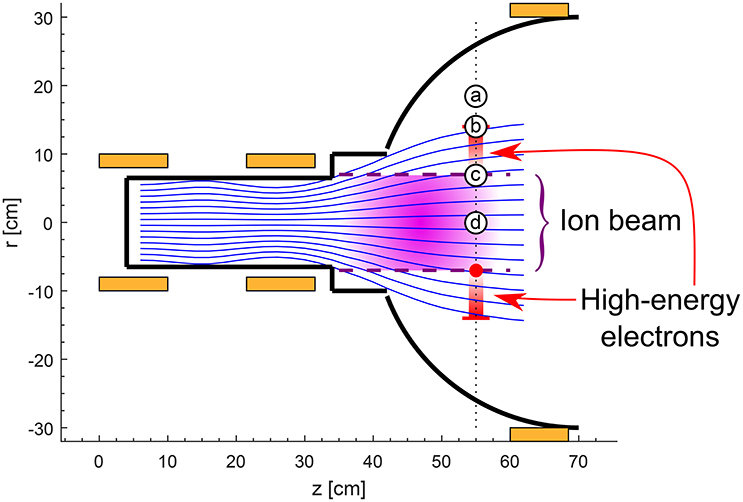
Figure 7. Positions of observed features with respect to the magnetic field. The letters “a,b,c,d” refers to the different profiles in Figure 5.
With the electron-RFEA we see peaks in the electron current at the outer edges of the beam (marked with a red dot). The red marks crossing the line at z = 55 cm and r = ±14 cm are the locations of the small maximum seen in the ion RFEA measurements (Figure 4A). These marks fits well with the calculated outermost magnetic field line coming from the source and they are in the same area where we observe high electron temperatures and high electron currents with the RFEA. The letters “a,b,c,d” refers to the different profiles in Figure 5. Where (a) is in the background plasma, (b) is at the outermost magnetic field line from the source, (c) is at the edge of the ion beam and (d) is in the middle of the beam.
4. Conclusion
Direct measurements of high-energy electrons have been performed with a RFEA set up for detection of energetic electrons. We found significant maxima in energetic electron densities, positioned just inside the magnetic field emerging from the edge of the source. In addition we observe a second maxima corresponding to the width of the source, indicating that some electrons might detach from the magnetic field line and continue strait forward along the edges of the ion beam. Electron temperatures deduced from the electron IV-characteristic show Te maxima about 10 eV from the energetic electron population at the magnetic field line emerging from the edge of the source. In the center of the plasma column the deduced Te agrees with that of the Langmuir probe. These findings corresponds well with the “two-temperature” distributions seen by Takahashi et al. [10] in EEPFs from Langmuir probe.
In support of the direct measurements, signatures of high-energy electrons downstream of the DL have been observed as a small peak in the ion saturation current at a magnetic field line emerging from the edge of the source. This indicates additional ionization by high-energy electrons. A dip in the floating potential just inside this magnetic field line, but outside the radius of the source also indicate a high-energy electron flux.
In total our findings supports the idea that high-energy electrons are transported from the source along the magnetic field emerging from the edge of the source and contribute to the ionization of the neutral gas downstream.
Author Contributions
All authors contributed as a team effort. The measurements where conducted and analyzed by NG under the supervision of ÅF.
Funding
This study was entirely funded by UiT.
Conflict of Interest Statement
The authors declare that the research was conducted in the absence of any commercial or financial relationships that could be construed as a potential conflict of interest.
The handling Editor declared a past co-authorship with one of the authors ÅF and states that the process nevertheless met the standards of a fair and objective review.
References
1. Charles C, Boswell R. Current-free double-layer formation in a high-density helicon discharge. Appl Phys Lett. (2003) 82:1356–8. doi: 10.1063/1.1557319
2. Cohen SA, Siefert NS, Stange S, Boivin RF, Scime EE, Levinton FM. Ion acceleration in plasmas emerging from a helicon-heated magnetic-mirror device. Phys Plasmas (2003) 10:2593–8. doi: 10.1063/1.1568342
3. Sun X, Cohen SA, Scime EE, Miah M. On-axis parallel ion speeds near mechanical and magnetic apertures in a helicon plasma device. Phys Plasmas (2005) 12:103509. doi: 10.1063/1.2121347
4. Plihon N, Corr CS, Chabert P. Double layer formation in the expanding region of an inductively coupled electronegative plasma. Appl Phys Lett. (2005) 86:091501. doi: 10.1063/1.1869533
5. Sutherland O, Charles C, Plihon N, Boswell RW. Experimental evidence of a double layer in a large volume Helicon reactor. Phys Rev Lett. (2005) 95:205002. doi: 10.1103/PhysRevLett.95.205002
6. Takahashi K, Shida Y, Fujiwara T, Oguni K. Supersonic ion beam driven by permanent-magnets-induced double layer in an expanding plasma. Plasma Sci IEEE Trans. (2009) 37:1532–6. doi: 10.1109/TPS.2009.2024342
7. Scime EE, Biloiu IA, Carr J, Thakur SC, Galante M, Hansen A, et al. Time-resolved measurements of double layer evolution in expanding plasmaa). Phys Plasmas (2010) 17:055701. doi: 10.1063/1.3276773
8. Popescu S, Ohtsu Y, Fujita H. Current-free double-layer formation in inductively coupled plasma in a uniform magnetic field. Phys Rev E (2006) 73:066405. doi: 10.1103/PhysRevE.73.066405
9. Byhring HS, Charles C, Fredriksen Å, Boswell RW. Double layer in an expanding plasma: simultaneous upstream and downstream measurements. Phys Plasmas (2008) 15:102113. doi: 10.1063/1.3002396
10. Takahashi K, Charles C, Boswell R, Cox W, Hatakeyama R. Transport of energetic electrons in a magnetically expanding helicon double layer plasma. Appl Phys Lett. (2009) 94:191503. doi: 10.1063/1.3136721
11. Baalrud SD, Lafleur T, Boswell RW, Charles C. Particle-in-cell simulations of a current-free double layer. Phys Plasmas (2011) 18:063502. doi: 10.1063/1.3594565
12. Lieberman MA, Charles C. Theory for formation of a low-pressure, current-free double layer. Phys Rev Lett. (2006) 97:045003. doi: 10.1103/PhysRevLett.97.045003
13. Meige A, Boswell RW, Charles C, Boeuf JP, Hagelaar G, Turner MM. One-dimensional simulation of an ion beam generated by a current-free double-Layer. Plasma Sci IEEE Trans (2005) 33:334–5. doi: 10.1109/TPS.2005.844956
14. Charles C, Boswell RW, Hawkins R. Oblique double layers: a comparison between terrestrial and auroral measurements. Phys Rev Lett. (2009) 103:095001. doi: 10.1103/PhysRevLett.103.095001
15. Takahashi K, Fujiwara T. Observation of weakly and strongly diverging ion beams in a magnetically expanding plasma. Appl Phys Lett. (2009) 94:061502. doi: 10.1063/1.3080205
16. Takahashi K, Igarashi Y, Fujiwara T. Plane and hemispherical potential structures in magnetically expanding plasmas. Appl Phys Lett. (2010) 97:041501. doi: 10.1063/1.3467857
17. Singh N. Current-free double layers: a review. Phys Plasmas (2011) 18:122105. doi: 10.1063/1.3664321
18. Takahashi K, Itoh Y, Fujiwara T. Operation of a permanent-magnets- expanding plasma source connected to a large-volume diffusion chamber. J Phys D Appl Phys. (2011) 44:015204. doi: 10.1088/0022-3727/44/1/015204
19. Saha SK, Raychaudhuri S, Chowdhury S, Janaki MS, Hui AK. Two-dimensional double layer in plasma in a diverging magnetic field. Phys Plasmas (2012) 19:092502. doi: 10.1063/1.4752074
20. Cox W, Charles C, Boswell RW, Hawkins R. Spatial retarding field energy analyzer measurements downstream of a helicon double layer plasma. Appl Phys Lett. (2008) 93(7):071505. doi: 10.1063/1.2965866
21. Charles C. High density conics in a magnetically expanding helicon plasma. Appl Phys Lett. (2010) 96:051502. doi: 10.1063/1.3309668
22. Saha SK, Chowdhury S, Janaki MS, Ghosh A, Hui AK, Raychaudhuri S. Plasma density accumulation on a conical surface for diffusion along a diverging magnetic field. Phys Plasmas (2014) 21:043502. doi: 10.1063/1.4870758
23. Gahan D, Daniels S, Hayden C, Sullivan DO, Hopkins MB. Characterization of an asymmetric parallel plate radio-frequency discharge using a retarding field energy analyzer. Plasma Sour Sci Technol. (2012) 21:015002. doi: 10.1088/0963-0252/21/1/015002
24. Gahan D, Dolinaj B, Hopkins MB. Comparison of plasma parameters determined with a Langmuir probe and with a retarding field energy analyzer. Plasma Sour Sci Technol. (2008) 17:035026. doi: 10.1088/0963-0252/17/3/035026
25. Conway GD, Perry AJ, Boswell RW. Evolution of ion and electron energy distributions in pulsed helicon plasma discharges. Plasma Sour Sci Technol. (1998) 7:337. doi: 10.1088/0963-0252/7/3/012
26. Lafleur T, Charles C, Boswell RW. Electron temperature characterization and power balance in a low magnetic field helicon mode. J Phys D Appl Phys. (2011) 44:185204. doi: 10.1088/0022-3727/44/18/185204
27. Fredriksen Å, Mishra LN, Gulbrandsen N, Miloch WJ. On the measurement of subsonic flow in a capacitively coupled helicon plasma source. J Phys. (2010) 257:012019. doi: 10.1088/1742-6596/257/1/012019
28. Boswell RW. Very efficient plasma generation by whistler waves near the lower hybrid frequency. Plasma Phys Control Fusion (1984) 26:1147. doi: 10.1088/0741-3335/26/10/001
29. Gulbrandsen N, Fredriksen Å, Carr J, Scime E. A comparison of ion beam measurements by retarding field energy analyzer and laser induced fluorescence in helicon plasma devices. Phys Plasmas (2015) 22:033505. doi: 10.1063/1.4913990
30. Gahan D, Daniels S, Hayden C, Scullin P, O'Sullivan D, Pei YT, et al. Ion energy distribution measurements in rf and pulsed dc plasma discharges. Plasma Sour Sci Technol. (2012) 21:024004. doi: 10.1088/0963-0252/21/2/024004
31. Ingram SG, Braithwaite NSJ. Ion and electron energy analysis at a surface in an RF discharge. J Phys Appl Phys. (1988) 21:1496. doi: 10.1088/0022-3727/21/10/005
32. Sudit ID, Chen FF. RF compensated probes for high-density discharges. Plasma Sour Sci Technol. (1994) 3:162. doi: 10.1088/0963-0252/3/2/006
33. Kemp RF, Sellen JM. Plasma potential measurements by electron emissive probes. Rev Sci Instr. (1966) 37:455–61. doi: 10.1063/1.1720213
34. Wang EY, Hershkowitz N, Intrator T, Forest C. Techniques for using emitting probes for potential measurement in rf plasmas. Rev Sci Instr. (1986) 57:2425–31. doi: 10.1063/1.1139088
35. Ye MY, Takamura S. Effect of space-charge limited emission on measurements of plasma potential using emissive probes. Phys Plasmas (2000) 7:3457–63. doi: 10.1063/1.874210
36. Sheehan JP, Raitses Y, Hershkowitz N, Kaganovich I, Fisch NJ. A comparison of emissive probe techniques for electric potential measurements in a complex plasma. Phys Plasmas (2011) 18:073501. doi: 10.1063/1.3601354
37. Magnus F, Gudmundsson JT. Digital smoothing of the Langmuir probe I-V characteristic. Rev Sci Instr. (2008) 79:073503. doi: 10.1063/1.2956970
38. Miloch WJ, Gulbrandsen N, Mishra LN, Fredriksen Å. Ion velocity distributions in the sheath and presheath of a biased object in plasma. Phys Plasmas (2011) 18:083502. doi: 10.1063/1.3614520
Keywords: low-temperature plasmas, plasma expansion, electron energy distribution function, retarding field energy analyzer, high-energy electrons, ion beam, helicon plasma device
Citation: Gulbrandsen N and Fredriksen Å (2017) RFEA Measurements of High-Energy Electrons in a Helicon Plasma Device with Expanding Magnetic Field. Front. Phys. 5:2. doi: 10.3389/fphy.2017.00002
Received: 24 October 2016; Accepted: 11 January 2017;
Published: 26 January 2017.
Edited by:
Roderick William Boswell, Australian National University, AustraliaReviewed by:
Bill Amatucci, United States Naval Research Laboratory, USAKazunori Takahashi, Tohoku University, Japan
Alan A. Howling, École Polytechnique Fédérale de Lausanne, Switzerland
J. P. Sheehan, University of Michigan, USA
Copyright © 2017 Gulbrandsen and Fredriksen. This is an open-access article distributed under the terms of the Creative Commons Attribution License (CC BY). The use, distribution or reproduction in other forums is permitted, provided the original author(s) or licensor are credited and that the original publication in this journal is cited, in accordance with accepted academic practice. No use, distribution or reproduction is permitted which does not comply with these terms.
*Correspondence: Njål Gulbrandsen, njal.gulbrandsen@uit.no