13C MRS Studies of the Control of Hepatic Glycogen Metabolism at High Magnetic Fields
 Corin O. Miller
 Jin Cao1
  He Zhu
 Li M. Chen
 Richard Kennan
 John C. Gore
- 1Translational Imaging Biomarkers, Merck & Co., Inc., Kenilworth, NJ, United States
- 2Institute of Imaging Science, Vanderbilt University, Nashville, TN, United States
Introduction: Glycogen is the primary intracellular storage form of carbohydrates. In contrast to most tissues where stored glycogen can only supply the local tissue with energy, hepatic glycogen is mobilized and released into the blood to maintain appropriate circulating glucose levels, and is delivered to other tissues as glucose in response to energetic demands. Insulin and glucagon, two current targets of high interest in the pharmaceutical industry, are well-known glucose-regulating hormones whose primary effect in liver is to modulate glycogen synthesis and breakdown. The purpose of these studies was to develop methods to measure glycogen metabolism in real time non-invasively both in isolated mouse livers, and in non-human primates (NHPs) using 13C MRS.
Methods: Livers were harvested from C57/Bl6 mice and perfused with [1-13C] Glucose. To demonstrate the ability to measure acute changes in glycogen metabolism ex-vivo, fructose, glucagon, and insulin were administered to the liver ex-vivo. The C1 resonance of glycogen was measured in real time with 13C MRS using an 11.7T (500 MHz) NMR spectrometer. To demonstrate the translatability of this approach, NHPs (male rhesus monkeys) were studied in a 7 T Philips MRI using a partial volume 1H/13C imaging coil. NPHs were subjected to a variable IV infusion of [1-13C] glucose (to maintain blood glucose at 3-4x basal), along with a constant 1 mg/kg/min infusion of fructose. The C1 resonance of glycogen was again measured in real time with 13C MRS. To demonstrate the ability to measure changes in glycogen metabolism in vivo, animals received a glucagon infusion (1 μg/kg bolus followed by 40 ng/kg/min constant infusion) half way through the study on the second study session.
Results: In both perfused mouse livers and in NHPs, hepatic 13C-glycogen synthesis (i.e., monotonic increases in the 13C-glycogen NMR signal) was readily detected. In both paradigms, addition of glucagon resulted in cessation of glycogen synthesis and induction of glycogen breakdown. In the perfused liver, inclusion of insulin was able to dose-dependently block the effect of glucagon.
Conclusion: Hepatic glycogen synthesis, as well as acute hormonally-induced changes thereof, can be measured using 13C MRS at high magnetic fields both ex-vivo and in vivo. Measurements of this process represent novel, translatable biomarkers of glucagon action, and additionally may be useful for pharmacological targets which modulate glycogen metabolism.
Introduction
Glycogen, the branched polymeric form of glucose (Figure 1), is the primary intracellular storage form of carbohydrates. While in most organs (e.g., muscle, brain) glycogen stores can only supply fuel to local tissue, hepatic glycogen serves as the primary short term energy reserve for the entire body as it can be broken down and released into the blood as glucose. This process occurs in a precisely regulated fashion to maintain appropriate circulating glucose levels, and to supply other tissues with glucose in response to energetic demands.
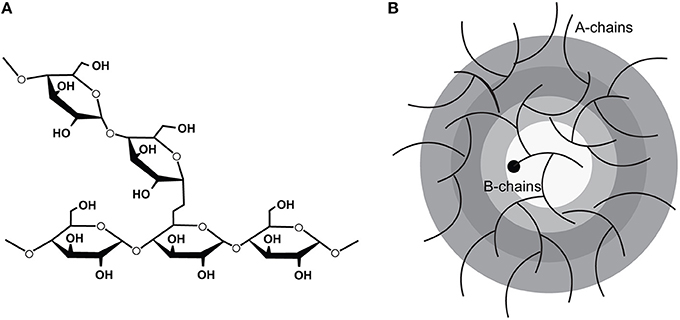
Figure 1. The molecular structure of glycogen showing (A) the 1,4 linkages which polymerize the glucose moieties and the 1,6 linkages which confer the branch points and (B) the arrangement of the polymerized glucose into tiers. (Adapted from Roach et al. [1]).
The metabolism of hepatic glycogen is controlled by several physiological factors and has been reviewed extensively elsewhere [2]. As glucose is the primary substrate for hepatic glycogen synthesis, the circulating glucose concentration is a key determinant of hepatic glycogen synthesis/breakdown. Indeed, the activities of the hepatic glucose transporter (GLUT2) and the hepatic glucose-phosphorylating enzyme (glucokinase) are highly glucose dependent, with little glucose uptake and metabolism below concentrations of 5 mM, and maximal uptake and metabolism above 15 mM [3, 4]. The route of glucose delivery to the liver also plays a key role in glycogen metabolism. A positive differential in glucose concentration between the portal vein and hepatic artery, as results from feeding, increases hepatic glycogen synthesis. This so-called “portal signal” [5] has been observed in several species [6, 7] and has been shown to be likely neurally mediated [8]. Lastly, hepatic glycogen synthesis is under tight hormonal control. The hormones insulin and glucagon are the primary regulators of hepatic glycogen metabolism. They regulate glucose delivery to the circulation by converting glucose to and from glycogen, respectively. However, other hormones such as cortisol and epinephrine have been shown to also play a role under certain conditions [9].
As glycogen is completely confined to the intracellular space, robust, and reliable measurements of liver glycogen content have been a challenge. A tissue biopsy followed by biochemical assay of glycogen is the oldest measurement method [10]. The clinical utility of this approach, however, is limited by its invasive nature along with the potential confounding factor of regional variation within the liver [11]. The initial work demonstrating the feasibility of non-invasive detection of hepatic glycogen with 13C MRS was published in humans ~30 years ago [12]. Subsequent studies demonstrated 100% NMR visibility of glycogen [13], which was somewhat surprising given glycogen's macromolecular structure and many associated proteins. Additional work demonstrated the ability to detect changes in hepatic and muscle glycogen levels in real time (i.e., glycogen metabolism) [14]. These imaging and spectroscopic methods paved the way for key in vivo studies of glycogen metabolism which produced valuable insight into both the hormonal control of glycogen metabolism, and the role that defects in this process play in the pathophysiology of diabetes mellitus (see 15, for review).
Early application of 13C MRS in vivo helped delineate the mechanisms by which glucose and insulin control hepatic glycogen breakdown [16], and also revealed the tight regulation of hepatic glycogen metabolism by insulin and glucagon [17]. Further application of 13C MRS to diabetic humans revealed insight into the defects of glycogen metabolism associated with types I and II diabetes. Measurement of muscle glycogen synthesis under conditions which simulated that following a meal showed that this pathway was a major route of glucose disposal, and was defective in type II diabetic patients [18]. This observation was recapitulated in a more acute paradigm where an increase in plasma free fatty acid levels from a lipid infusion similarly reduced muscle glycogen synthesis in healthy subjects [19], and implicated muscle glucose transport and phosphorylation as the locus of this defect. Similar findings of defective glycogen synthesis in liver following a mixed meal challenge were reported in both type I [20], and type II diabetics [21]. Taken together, the results from these initial studies demonstrated that glycogen metabolism is under exquisite control by many factors in vivo, and that defects in these controls are present in both type I and II diabetes.
Underscoring the importance of hepatic glycogen metabolism in whole body glucose homeostasis, recent work in the pharmaceutical industry has demonstrated that modulation of processes involved in hepatic glycogen metabolism can elicit therapeutic benefits (i.e., reductions) in the elevated blood glucose levels (hyperglycemia) associated with T2DM. For example, the development of glucagon receptor antagonists [22], glycogen phosphorylase inhibitors [23], and hepato-selective glucokinase activators [24] have all achieved proof of concept (POC) for reduction of hyperglycemia either in the clinic, or in preclinical models of T2DM. For all these pharmacological targets, hepatic glycogen represents a proximal, functional biomarker of target engagement. Thus, techniques allowing for the measurement of hepatic glycogen in vivo would be valuable in the development of these therapies, as they would likely yield superior measures of target engagement compared to the standard practice of measuring circulating glucose alone.
The aim of these studies, therefore, was to develop measurements of hepatic glycogen metabolism at UHF, both ex vivo (11.7 T) and in vivo (7 T). Furthermore, we sought to use varying experimental conditions such as with or without glucagon interference, to allow for the detection of changes in hepatic glycogen metabolism in real time. This work demonstrates POC for the use of these MR based measurements as translatable biomarkers.
Methods
Perfused Liver Studies
Animals were studied under the purview of Institutional Animal Care and Use Committee (IACUC) of Merck & Co., Inc., Kenilworth, NJ USA, and all applicable regulations and laws pertaining to the use of laboratory animals were followed. Initial studies were performed in isolated perfused mouse livers to gain a better understanding of the inherent characteristics of hepatic glycogen synthesis in the absence of external hormonal input. A detailed description of the perfused liver technique can be found elsewhere [25]. Briefly, lean, C57/Bl6 mice (20–30 weeks old) were anesthetized (Pentobarbital IP, 100 mg/kg), the portal vein was cannulated and tied off, and the liver was excised and perfused with a pre-oxygenated Krebs-bicarbonate buffered solution. The liver was then placed into a 20 mm NMR tube and the combined assembly was inserted into a 11.7 T (500 MHz) wide bore NMR spectrometer (Bruker, Billerica, MA) equipped with a 20 mm 1H/13C/31P TXO probe (Figure 2). 31P NMR spectra were initially obtained in each study to measure levels of ATP and inorganic phosphate (Pi) as an overall check of liver viability. For selected studies, a 31P NMR spectrum was also acquired at the end of the study and used to verify the following: (1) <10% change in the intensity of the ATP resonances and (2) a lack of upfield shift of the chemical shift of the Pi resonance (which would indicate a decrease in intracellular pH and poor liver viability).
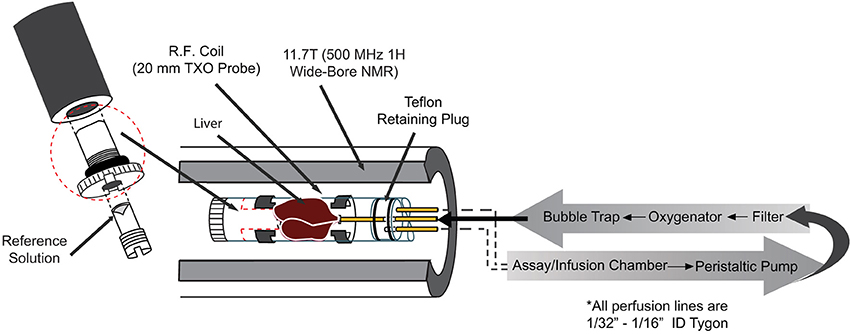
Figure 2. Essential components of the perfused liver apparatus.
To understand the effects of the circulating glucose concentration on hepatic glycogen metabolism, varying concentrations of [1-13C] Glucose were presented in the perfusate to the livers for 50–60 min for each concentration, using multiple concentrations within a single study (Figure 3B, for example). Consecutive 13C NMR spectra were acquired using the following parameters: 30° pulse, TR = 560 ms, NS = 800 averages, broadband GARP 1H decoupling, 11 min/spectrum. Spectral processing was performed using zero filling and exponential filtering with 20 Hz line broadening, and the conversion of [1-13C] Glucose (96.8 ppm) to [1-13C] glycogen (100.6 ppm), and [6-13C] glycogen (61.6 ppm) (via the so-called direct and indirect pathways, respectively) was detected in real time via an increase of the glycogen 13C NMR resonances. The integrals of the 13C-glycogen and 13C-glucose NMR signals were then calculated by fitting the resonances to a Lorentzian line shape model using in house developed curve fitting routines in Matlab (The Mathworks Inc., R2016a, Natick, MA). These areas were converted to absolute units (μmoles) by comparison to integrals from 13C NMR spectra of standard solutions acquired under identical conditions. The slope of the 13C-glycogen signals vs. time was then used to calculate the rate of glycogen synthesis. To demonstrate the ability to detect increases in glycogen synthesis, the above protocol was repeated with 1 mM (unlabeled) fructose in the perfusate. Fructose has been previously shown to increase hepatic glucose uptake and glycogen synthesis via increases in cytosolic glucokinase [26].
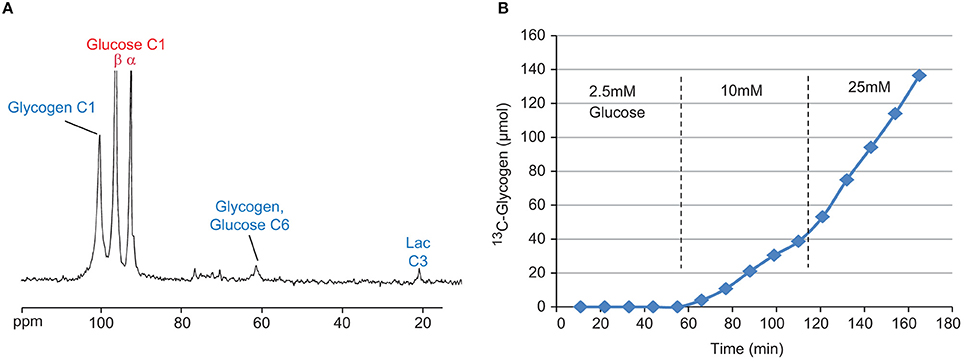
Figure 3. Sample 13C NMR spectrum (A) of perfused liver after 50 min with 20 mM [1-13C] Glucose. Visible signals include [1-13C] Glycogen (100.6 ppm), [1-13C] Glucose (β-anomer 96.8 ppm, α-anomer 93 ppm), [6-13C] Glucose (61.6 ppm) from indirect glycogen synthesis, and [3-13C] Lactate (21.1 ppm) from glycolysis. Time course (B) of 13C-glycogen from a single perfused liver study under three different concentrations of [1-13C] glucose, 2.5, 10, and 25 mM.
To demonstrate the ability to detect glycogen breakdown as well as the acute, direct effects of hormones thereof, the above protocol was modified as follows: For 60 min the liver was presented with 20 mM [1-13C] glucose, then this was switched to either 5 mM [1-13C] glucose alone, 5 mM [1-13C] glucose plus 10 pM glucagon, or 5 mM [1-13C] glucose plus 10 pM glucagon plus varying concentrations of insulin for another 60 min. Sample data from individual studies for each of these cases is shown in Figure 5A. Rates of glycogen breakdown were calculated as the average (negative) slope of the time course of 13C-glycogen following glucagon administration. This approach assumes a “last in, first out” model of glycogen synthesis and degradation and has been previously confirmed in the perfused liver system (unpublished observations) by showing that independent measurements of total perfusate glucose following complete glucagon-induced 13C-glycogen breakdown, and liver 13C-glycogen just prior to glucagon administration yield the similar values (i.e., for the time scale in Figure 5A, only the 13C-glycogen is degraded, not endogenous glycogen).
NHP Studies
All procedures were approved by the Institutional Animal Care and Use Committee of Vanderbilt University. To demonstrate the potential for translation of this approach into larger species, two NHPs (male rhesus macaques, 14–17 kg) were studied in a 7 T whole body MRI scanner (Philips Healthcare, Best, the Netherlands) using a dual-tuned partial volume 1H/13C imaging coil (25 cm W × 18 cm L × 11 cm D). Subjects were initially sedated with a ketamine/atropine mixture, and then anesthetized with 1–1.5% isoflurane delivered with pure oxygen. Before the imaging session, the subjects were intubated, and three IV lines were placed in superficial leg veins for fluid support and infusate administration and sampling. The subjects were then transported to the MRI, and placed on a ventilator with 1–2% isoflurane anesthesia over oxygen. Coil placement to image the liver was accomplished using a sagittal fast gradient echo multi-slice sequence (256 × 256, 20 slices, flip angle = 30°, TE/TR = 5/175 ms, scan time = 45 s). Each subject was studied during two separate sessions and coil position was marked on each subject. In the first session, an IV infusion of [1-13C] glucose (20 mg/kg/min for 10 min, followed by a variable infusion to maintain blood glucose at 3-4x basal), along with a constant infusion of fructose (1 mg/kg/min) was performed for 150 min (See Section Discussion for the rationale behind this choice of conditions). In the second session, the same protocol was used, but with the addition of a glucagon infusion (1 μg/kg bolus followed by 40 ng/kg/min constant infusion) starting ~90 min into the study. Increases in the C1 resonance of glycogen (100.6 ppm) were measured in real time with a pulse-acquire 13C sequence (70° flip angle, TR = 0.5 s, narrow band 1H decoupling, NSA = 1,024, 10 min total). Absolute quantification of [1-13C] glycogen was accomplished using a 250 ml reference solution of 250 mM glycogen dissolved in phosphate-buffered saline (pH = 7.4). This solution was placed in the imaging coil at the approximate position of the liver and NMR spectra were acquired using identical parameters to that used in vivo. Additional saline bags were placed around the glycogen phantom to mimic coil loading in vivo.
Blood glucose was measured in real time every 15–20 min for adjustment of the [1-13C] glucose infusion with an iStat blood chemistry analyzer. Circulating glucagon was measured at the same time points via radioimmunoassay kit (Millipore GL-32K).
Results
Perfused Liver Studies
Kinetics of Glycogen Synthesis
A sample 13C NMR spectrum, as well as the time course of the [1-13C] glycogen signal from a typical study, is shown in Figures 3A,B, respectively. Despite the close proximity of the signals from the α and β anomers of [1-13C] glucose (93 and 96.8 ppm, respectively) to the signal from [1-13C] glycogen (100.6 ppm), the high magnetic field used in this study allowed for very good resolution of the peaks (Figure 3A). Figure 3B clearly demonstrates the glucose-dependent nature of hepatic glycogen synthesis. For this particular study, the slope of the 13C-glycogen vs. time curve (i.e., the glycogen synthesis rate) is negligible at 2.5 mM [1-13C] Glucose, 0.36 μmol/g/min at 10 mM and 0.95 μmol/g/min at 25 mM. This approach is an efficient way to study hepatic glycogen synthesis since multiple concentrations of glucose can be investigated in a single study.
The titration of the hepatic glycogen synthesis rate vs. the concentration of [1-13C] Glucose with (red) and without (blue) 1 mM fructose is shown in Figure 4. A sigmoidal fit of this data results in EC50 values of 6.9 and 10.9 mM glucose with and without fructose, respectively, and Vmax (i.e., maximal glycogen synthesis rate) values of 1.05 and 0.94 μmol/g/min, respectively. This demonstrates that the inclusion of fructose in the perfusate increases hepatic glycogen synthesis in the physiological range of glucose concentrations (5–15 mM), resulting in a left shift of the titration (i.e., reduced EC50). Fructose, however, did not appear to significantly affect Vmax, the maximal glycogen synthesis rate.
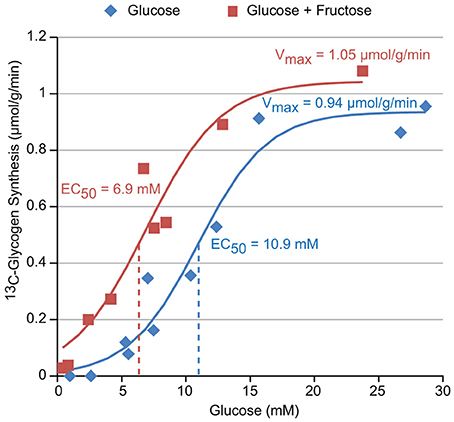
Figure 4. The glucose dependence of glycogen synthesis in perfused liver with and without 1 mM fructose in the perfusate.
Acute Effectors of Glycogen Synthesis
The ability to acutely modulate and detect changes in hepatic glycogen metabolism with the hormones glucagon and insulin is demonstrated in Figure 5A. When the perfusate concentration of [1-13C] glucose is changed from 20 to 5 mM at T = 0 (green), the hepatic glycogen synthesis rate (i.e., slope) decreases as expected from Figure 4. When 10 pM glucagon is added to the perfusate in addition to changing to 5 mM [1-13C] glucose (black), glycogen synthesis stops and shifts to glycogen breakdown. When 0.3 nM insulin is added to the perfusate in addition to the 10 pM glucagon (red), much of this glycogen breakdown is reversed. A plot of the titration of glycogen breakdown rate vs. insulin concentration (using 10 pM glucagon is all cases to stimulate glycogen breakdown) is shown in Figure 5B. This data demonstrates that insulin has an approximate EC50 of 0.3 nM and a steep dose titration with its entire effect being manifest over the 0.1–1 nM range. The overall pharmacology shown in Figure 5 is consistent with what is known about the control of hepatic glycogen metabolism by insulin and glucagon in vivo. Note that adding insulin alone during the 5 mM 13C-glucose period (green) has minimal effect on 13C-glycogen synthesis as insulin only increases hepatic glycogen synthesis in the presence of hyperglycemia and/or a portal signal.
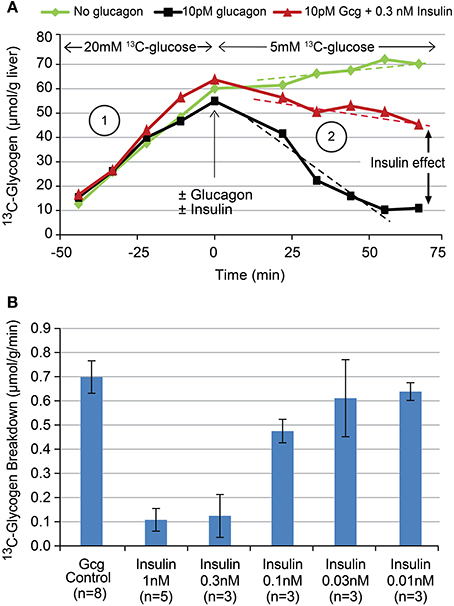
Figure 5. Time courses (A) of 13C-glycogen from three sample individual studies showing the effect of changing glucose concentrations (green), the addition of 10 pM glucagon (black), and the addition of 10 pM glucagon plus 0.3 nM insulin (red). The titration (B) of insulin's effect on glucagon stimulated glycogen breakdown using the experimental paradigm depicted in (A).
NHP Studies of Glycogen Synthesis In vivo
A stacked plot of spectra from a sample NHP study is shown in Figure 6A. Here, the 13C-glycogen signal is undetectable at T = 0 (i.e., before the infusion of [1-13C] glucose) and increases over the next 2–3 h. Despite the incomplete 1H decoupling, the glycogen-C1 resonance maintained the same apparent triplet shape throughout the study and was sufficiently resolved from the coupled glucose-C1 β and α signals, which increased rapidly following the initial bolus of [1-13C] glucose, and then remained constant for the rest of the study. The integral of the [1-13C] glycogen signal increases linearly with time as shown for subject #1 in Figure 6B. The slope of this line for Study 1, and for the time before glucagon addition in Study 2, represents the average hepatic 13C-glycogen synthesis rate for each study. These values were ~2 mg/kg/min for each study. The acute effect of glucagon added for the final 60 min of the study for each subject is shown in Figure 7, along with average circulating levels of glucose and glucagon before and after the glucagon infusion. In both cases, glucagon markedly reduced hepatic glycogen synthesis. In subject #2, glycogen breakdown was observed, likely caused by the higher observed circulating glucagon levels than in subject #1. Accordingly, circulating glucose levels in Subject #2 were higher than in subject #1 during the glucagon infusion portion of the study. While it was not possible to perform a quantitative comparison of spectra between our data and earlier studies [12, 14], a visual comparison shows a significant gain in SNR with our data at 7 T vs. the original data at 2.1 T.
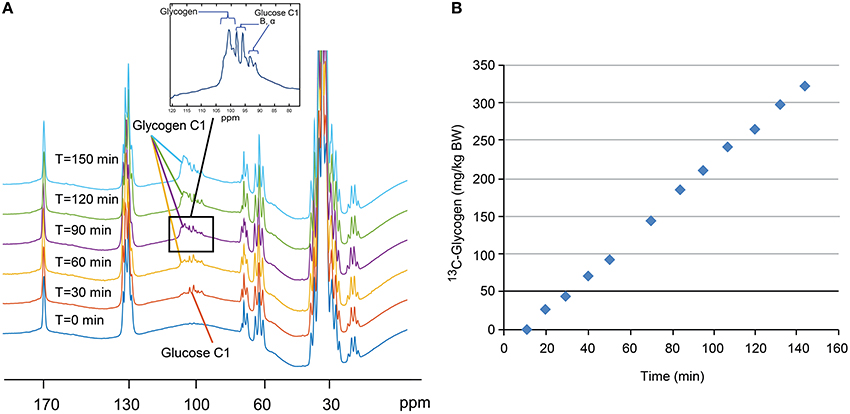
Figure 6. Stacked plot (A) of 13C NMR spectra from a sample single NHP study. Note the absence of 13C-glycogen signal at T = 0 min and the increase over the next 2–3 h. Time course (B) of the integral of the 13C-glycogen signal for this single study showing a linear increase in time.
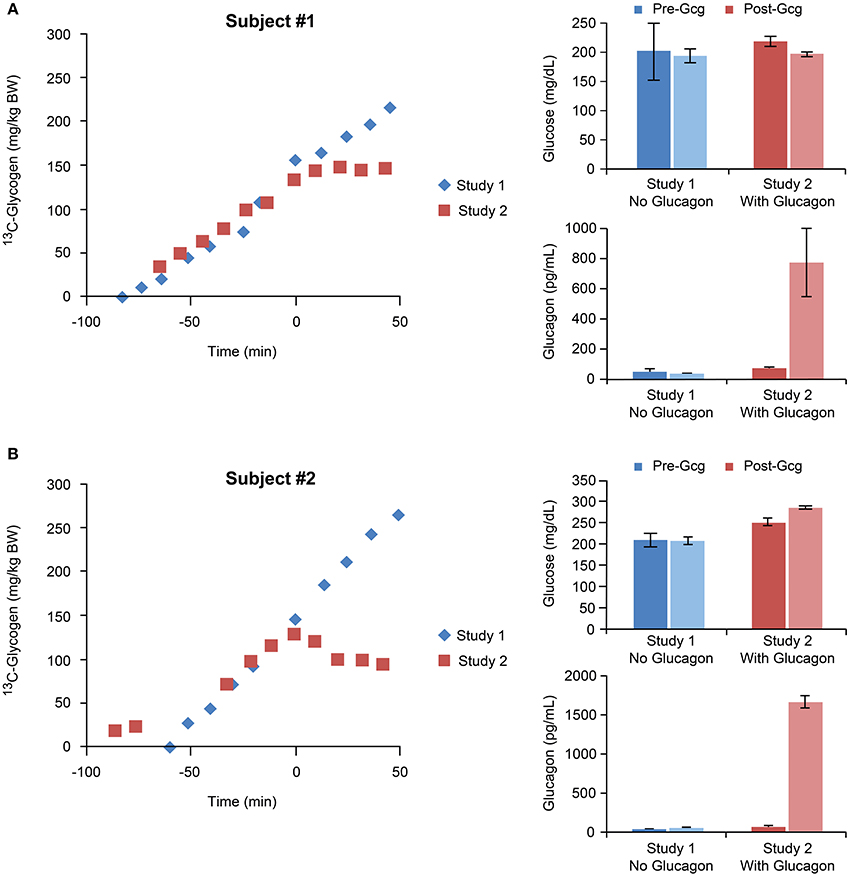
Figure 7. Time courses of 13C-glycogen and corresponding average values of circulating glucose and glucagon for individual studies performed with and without glucagon infusions for subject #1 (A) and subject #2 (B). In both subjects, the glucagon infusion resulted in marked increases in circulating glucagon levels, and accordingly, suppression of hepatic glycogen synthesis.
Discussion
To develop an ex vivo system allowing for the investigation of hepatic glycogen metabolism, we used a perfused liver approach combined with 13C MRS at 11.7 T. The high SNR and spectral dispersion associated with the UHF used in these studies allowed for accurate resolution of the [1-13C] glycogen resonance from the [1-13C] glucose resonances, and also detection of the [6-13C] glycogen and [3-13C] lactate resonances (Figure 3). The time resolution of ~10 min/spectrum used here could easily be improved to capture more complex kinetics in other experimental paradigms. Additionally, while not totally visible in Figure 3 due to the truncated Y-axis scale, the high SNR of the [1-13C] glucose signal allowed for measurement of net hepatic glucose uptake via the decrease in this signal. This is noteworthy since the expected maximal change of this signal over each of the 11 min acquisitions is only ~1% (15 mM of glucose in a perfusate volume of 70 ml = 1,050 umol, and a maximal rate of glucose uptake of 1 umol/g/min for a 1 g liver for 10 min = 10 umol, or ~1%). Indeed, comparison of the net decrease in the [1-13C] glucose signal with the sum of the signals from [1-13C] glycogen, [6-13C] glycogen, and [3-13C] lactate (i.e., all the detectable disposal products of [1-13C] glucose) in each perfused liver experiment generally yielded consistent results (data not shown).
The perfused liver platform captured the essential features of glycogen metabolism and its hormonal controls. The perfused liver was able to capture the inherent glucose-responsive nature of hepatic glycogen synthesis as demonstrated by the sigmoidal titration of glycogen synthesis vs. perfusate [1-13C] glucose concentration. Maximal observed rates of hepatic glycogen synthesis (Figure 4, Vmax) were ~1 μmol/g/min which is consistent with published rates from in vivo studies [5], assuming a typical liver to body weight ratio of 2–3%. The Vmax and EC50 of this relationship are consistent with the kinetic properties of the glucose transport (GLUT2) and phosphorylating enzyme (glucokinase) in the liver [3, 4].
The effects of compounds known to increase and decrease hepatic glycogen synthesis were also recapitulated in the perfused liver system. Inclusion of fructose (1 mM) in the perfusate increased glycogen synthesis while inclusion of glucagon (10 pM) suppressed glycogen synthesis and stimulated glycogen breakdown. Both of these effects occurred at perfusate concentrations consistent with values shown to be effective in vivo. Additionally, the direct effect of insulin in the perfused liver was captured in this system. Perfusate insulin concentrations of 100 pM and above were able to block the effects of glucagon to stimulate glycogen breakdown, and consistent with in vivo data [5], the titration of insulin effect on the liver was very steep, transitioning from no effect to maximal effect over only one order of magnitude concentration range (Figures 5A,B). These observations relating to the behavior of insulin are noteworthy as in many in vitro systems, the effect of insulin on hepatocytes or other liver-derived cell lines is observed only at supra-physiological concentrations [27, 28], or sometimes not at all [29]. In summary, we were able to use 13C MRS at UHF to develop a perfused liver model capable of measuring hepatic glycogen synthesis in real time and observing modulation of glycogen synthesis due to known effectors at physiological plausible concentrations. The results acquired from this model mirrored those of in vivo studies but with a more economical experimental setup to facilitate drug development.
To demonstrate the ability to measure in vivo hepatic glycogen metabolism in higher species, and the effects of modulators thereof, we used 13C MRS in NHPs combined with infusions of [1-13C] glucose and glucagon at 7 T. As with the perfused liver studies, UHF resulted in excellent SNR and resolution of the [1-13C] glycogen signal, despite the inability to achieve complete 1H decoupling (Figure 6A). Nonetheless, we are confident that the partially decoupled 13C-glycogen signal accurately reflects total liver 13C-glycogen for the following reasons: (1) In spectra obtained from reference glycogen phantoms, we observed the exact same pattern of partial decoupling, (2) The integral of this partially decoupled signal was the same as the integral of the 13C-glycogen signal with decoupling turned off, (3) The coupled [1-13C] glucose signals appear quickly following the start of the 13C-glucose infusion and remain steady for the duration of the study, further allowing us to distinguish these signals from 13C-glycogen. Thus, the lack of complete decoupling did not result in any errors in the detection or calculation of the integral of the 13C-glycogen signal. Future work could focus on the optimization of decoupling schemes at UHF to further improve the SNR and spectral resolution of the 13C-glycogen resonance. Improved coil design may be useful as well, as complete decoupling of the glycogen C1 NMR signal, along with improved resolution from the two glucose C1 signals has was recently reported using a modified coil design [30].
In order to achieve maximal rates of hepatic glycogen synthesis, we aimed to design our experimental protocol to satisfy three essential conditions: (1) increased blood glucose; (2) increased circulating insulin; (3) a portal signal (see Section Introduction and 8). Elevated blood glucose levels were achieved via clamping glucose at 3-4x basal (~60 mg/dl; Figure 7). Lean, healthy, and non-diabetic subjects were used so their normal homeostatic response to hyperglycemia ensured an increase in pancreatic insulin secretion. While we could not provide a portal signal to the liver because our infusions were peripheral IV only (a portal signal would have required surgical manipulation for the additional infusion of glucose directly into the portal vein), we chose to include a high dose of fructose in the infusion, which has been shown previously to stimulate hepatic glucose uptake and glycogen synthesis [26], as does the portal signal. The slope of 13C-glycogen vs. time for each subject for all of study 1, and for the time before glucagon addition in study 2, represents the average hepatic 13C-glycogen synthesis rate for each study. These values were ~2 mg/kg/min. Note that to calculate the total hepatic glycogen synthesis rate, measurements of the 13C enrichment in blood glucose are needed. While we did not make these measurements, we predict an approximate value of 75% enrichment based on studies using similar 13C-glucose infusion protocols [17–19]. This predicts a total glycogen synthesis rate of 2.5–3 mg/kg/min, which is in line with measurements made in other studies in humans [21] and large animals [31] allowing for differences in experimental conditions such as initial fasting status, inclusion of a portal signal (i.e., glucose and fructose infused directly in to the portal vein), and control of hormonal concentrations.
To demonstrate the ability to acutely modulate and detect changes in hepatic glycogen metabolism, we infused glucagon on the second study date for each subject. Our high dose of glucagon resulted in plasma levels much higher than those previously reported in other hyperglucagonemic studies [32]. These studies, however, were done under basal glucose and insulin conditions without the inclusion of fructose, whereas our studies were done under conditions of elevated glucose, insulin, and fructose, all of which served to increase glycogen synthesis and provide a higher than usual barrier to show the effects of glucagon. Future studies could focus on modifying this protocol to include a return to basal glucose levels prior to the glucagon infusion which would allow for the use of lower, more physiologically relevant doses of glucagon. However, that we were able to detect changes in hepatic glycogen metabolism in real time in vivo is significant as this demonstrates the ability to use this paradigm to develop non-invasive, translatable biomarkers for pharmacological effectors of glycogen metabolism. Additionally, the application of recently reported 1H-based MRI approaches to measure glycogen, such as chemical exchange saturation transfer (CEST) [33, 34] and spin-lattice relaxation in the rotating frame (T1ρ) [35], may allow for mapping of glycogen synthesis rates within the liver, and regional variations thereof. These techniques can also be readily incorporated into most clinical scanners and thus may also lead to increased availability of these measurements.
Conclusions
We have shown that it is possible to use 13C MRS at UHF to measure hepatic glycogen synthesis in real time, and to investigate the acute changes in hepatic glycogen metabolism produced by different hormonal and experimental conditions. We were able to recapitulate the essential features of these measurements made ex vivo in perfused mouse livers in a non-invasive fashion in NHPs, thus demonstrating overall translatability for the measurement of hepatic glycogen metabolism with 13C MRS. These techniques should be applicable to the evaluation of novel pharmacological targets whose mechanism of action is to ameliorate Diabetes via modulation of hepatic glycogen metabolism. In summary, measurements of hepatic glycogen metabolism represent a translatable biomarker whose measurement via 13C MRS is well-suited for high magnetic fields due to the increased SNR and spectral dispersion.
Author Contributions
CM designed and performed perfused liver studies, designed and performed NHP studies, analyzed the data, and wrote the manuscript. JC performed perfused liver studies. HZ designed and performed NHP studies. LC designed and performed NHP studies, GW performed NHP Studies, RK designed perfused liver and NHP studies, JG designed NHP studies.
Ethics Statement
Perfused mouse liver study protocols were approved by the Institutional Animal Care and Use Committee of Merck & Co., Inc., Kenilworth, NJ, USA. NHP study protocols were approved by the Institutional Animal Care and Use Committee of Vanderbilt University. All applicable regulations and laws pertaining to the use of laboratory animals were followed.
Conflict of Interest Statement
CM, JC, and RK were employees of Merck & Co., Inc. at the time this work was performed. Merck & Co., Inc. funded the NHP studies performed at VUIIS.
The other authors declare that the research was conducted in the absence of any commercial or financial relationships that could be construed as a potential conflict of interest.
Acknowledgments
We acknowledge the VUMC Hormone Assay and Analytical Services Core (supported by NIH grants DK059637 and DK020) for providing support for the circulating glucagon measurements.
References
1. Roach PJ, Depaoli-Roach AA, Hurley TD. Tagliabracci VS. Glycogen and its metabolism: some new developments and old themes. Biochem J. (2012) 441:763–87. doi: 10.1042/BJ20111416
2. Roach PJ, Skurat AV, Harris RA. Chapter 19: Regulation of glycogen metabolism. In: Pollock DM, editor. Handbook of Physiology, The Endocrine System, The Endocrine Pancreas and Regulation of Metabolism. Wiley (2011) 609–647.
3. Thoren B. GLUT2, glucose sensing and glucose homeostasis. Diabetologia (2015) 58:221–32. doi: 10.1007/s00125-014-3451-1
4. Bustos DM, Iglesias AA. The kinetic properties of liver glucokinase and its function in glucose physiology as a model for the comprehensive study of enzymes' kinetic parameters and reversible inhibitors. Biochem Mol Biol Educ. (2000) 28:332–7. doi: 10.1111/j.1539-3429.2000.tb00186.x
5. Cherrington AD. Control of glucose uptake and release by the liver in vivo. Diabetes (1999) 48:1198–214. doi: 10.2337/diabetes.48.5.1198
6. Ogihara N, Kawamura W, Kasuga K, Hayashi Y, Arakawa H, Kikuchi M. Characterization of the portal signal during 24-h glucose delivery in unrestrained, conscious rats. Am J Physiol Endocrinol Metab. (2004) 286:E932–40. doi: 10.1152/ajpendo.00511.2002
7. Chueh F, Malabanan C, McGuinness OP. Impact of portal glucose delivery on glucose metabolism in conscious, unrestrained mice. Am J Physiol Endocrinol Metab. (2006) 291:E1206–11. doi: 10.1152/ajpendo.00608.2005
8. Moore MC, Coate KC, Winnick JJ, An Z, Cherrington AD. Regulation of hepatic glucose uptake and storage in vivo. Adv Nutr. (2012) 3:286–94. doi: 10.3945/an.112.002089
9. Goldstein RE, Abumrad NN, Lacy DB, Wasserman DH, Cherrington AD. Effects of an acute increase in epinephrine and cortisol on carbohydrate metabolism during insulin deficiency. Diabetes (1995) 44:672–81. doi: 10.2337/diab.44.6.672
10. Keppler D, Decker K. Glycogen: determination with amyloglucosidase. In Methods of Enzymatic Analysis. (1974). 1127–1131.
11. Moore MC, Cherrington AD, Cline G, Pagliassotti MJ, Jones EM, Neal DW, et al. Sources of carbon for hepatic glycogen synthesis in the conscious dog. J Clin Invest. (1991) 88:578–87. doi: 10.1172/JCI115342
12. Jue T, Lohman JAB, Ordidge RJ, Shulman RG. Natural abundance 13C NMR spectrum of glycogen in humans. Mag Res Med. (1987) 5:377–9. doi: 10.1002/mrm.1910050410
13. Gruetter R, Magnusson I, Rothman DL, Avison MJ, Shulman RG, Shulman GI. Validation of 13C NMR measurements of liver glycogen in vivo. Mag Res Med. (1994) 31:583–8. doi: 10.1002/mrm.1910310602
14. Jue T, Rothman DL, Tavatian BA, Shulman RG. Natural abundance 13C NMR study of glycogen repletion in human liver and muscle. Proc Natl Acad Sci USA. (1989) 86:1439–42. doi: 10.1073/pnas.86.5.1439
15. Roden M, Petersen KF, Shulman GI. Nuclear magnetic resonance studies of hepatic glucose metabolism in humans. Recent Prog Horm Res. (2001) 56:219–37. doi: 10.1210/rp.56.1.219
16. Petersen KF, Laurent D, Rothman DL, Cline GW, Shulman GI. Mechanism by which glucose and insulin inhibit net hepatic glycogenolysis in humans. J Clin Invest. (1988) 101:1203–9. doi: 10.1172/JCI579
17. Roden M, Perseghin G, Petersen KF, Hwang JH, Cline GW, Gerow K, et al. The roles of insulin and glucagon in the regulation of hepatic glycogen synthesis and turnover in humans. J Clin Invest. (1996a) 97:642–8. doi: 10.1172/JCI118460
18. Shulman GI, Rothman DL, Jue T, Stein P, DeFronzo RA, Shulman RG. Quantitation of muscle glycogen synthesis in normal subjects and subjects with non-insulin-dependent diabetes by 13C nuclear magnetic resonance spectroscopy. N Engl J Med. (1990) 322:223–8. doi: 10.1056/NEJM199001253220403
19. Roden M, Price TB, Perseghin G, Petersen KF, Rothman DL, Cline GW, et al. Mechanism of free fatty acid-induced insulin resistance in humans. J Clin Invest. (1996b) 97:2859–65. doi: 10.1172/JCI118742
20. Hwang JH, Perseghin G, Rothman DL, Cline GW, Magnusson I, Petersen KF, et al. Impaired net hepatic glycogen synthesis in insulin-dependent diabetic subjects during mixed meal ingestion. A 13C nuclear magnetic resonance spectroscopy study. J Clin Invest. (1995) 95:783–7. doi: 10.1172/JCI117727
21. Krssak M, Brehm A, Bernroider E, Anderwald C, Nowotny P, Man CD, et al. Alterations in postprandial hepatic glycogen metabolism in Type 2 diabetes. Diabetes (2004) 53:3048–56. doi: 10.2337/diabetes.53.12.3048
22. Sloop KW, Michael MD, Moyers JS. Glucagon as a target for the treatment of Type 2 diabetes. Expert Opin Ther Targets (2005) 9:593–600. doi: 10.1517/14728222.9.3.593
23. Oikonomakos NG. Glycogen phosphorylase as a molecular target for type 2 diabetes therapy. Curr Protein Pept Sci. (2002) 3:561–86. doi: 10.2174/1389203023380422
24. Nakamura A, Terauchi Y. Present status of clinical deployment of glucokinase activators. J Diabetes Investig. (2015) 6:124–32. doi: 10.1111/jdi.12294
25. Cohen SM. 13C and 31P NMR study of gluconeogenesis: utilization of 13C-labeled substrates by perfused liver from streptozotocin-diabetic and untreated rats. Biochemistry (1987) 26:563–72. doi: 10.1021/bi00376a031
26. Winnick JJ, An Z, Moore MC, Ramnanan CJ, Farmer B, Shiota M, et al. A physiological increase in the hepatic glycogen level does not affect the response of net hepatic glucose uptake to insulin. Am J Physiol Endocrinol Metab. (2009) 297:E358–66. doi: 10.1152/ajpendo.00043.2009
27. Pilar López M, Gómez-Lechón MJ, Castell JV. Role of glucose, insulin, and glucagon in glycogen mobilization in human hepatocytes. Diabetes (1991) 40:263–8. doi: 10.2337/diab.40.2.263
28. Kaibori M, Kwon A, Teshima S, Nakanishi H, Kitano T, Kamiyama Y, et al. Hepatocyte growth factor inhibits insulin-stimulated glycogen synthesis in primary cultured hepatocytes. J Hepatol. (2003) 38:407–13. doi: 10.1016/S0168-8278(02)00455-5
29. Krause U, Bertrand L, Maisin L, Rosa M, Hue L. Signaling pathways and combinatory effects of insulin and amino acids in isolated rat hepatocytes. Eur J Biochem. (2002) 269:3742–50. doi: 10.1046/j.1432-1033.2002.03069.x
30. Serés Roig E, Magill AW, Donati G, Meyerspeer M, Xin L, Ipek O, et al. A double-quadrature radiofrequency coil design for proton-decoupled carbon-13 magnetic resonance spectroscopy in humans at 7T. Mag Res Med. (2015) 73:894–900. doi: 10.1002/mrm.25171
31. Winnick JJ, An Z, Ramnanan CJ, Smith M, Irimia JM, Neal DW, et al. Hepatic glycogen supercompensation activates AMP-activated protein kinase, impairs insulin signaling, and reduces glycogen deposition in the liver. Diabetes (2011) 60:398–407. doi: 10.2337/db10-0592
32. Ramnanan CJ, Edgerton DS, Kraft G, Cherrington AD. Physiologic action of glucagon on liver glucose metabolism. Diabetes Obes Metab. (2011) 13(Suppl. 1):118–25. doi: 10.1111/j.1463-1326.2011.01454.x
33. van Zijl PCM, Jones CK, Ren J, Malloy CR, Sherry AD. MRI detection of glycogen in vivo by using chemical exchange saturation transfer imaging (glycoCEST). Proc Natl Acad Sci USA. (2007) 104:4359–64. doi: 10.1073/pnas.0700281104
34. Miller CO, Cao J, Chekmenev EY, Damon BM, Cherrington AD, Gore JC. Noninvasive measurements of glycogen in perfused mouse livers using chemical exchange saturation transfer NMR and comparison to 13C NMR spectroscopy. Anal Chem. (2015) 87:5824–30. doi: 10.1021/acs.analchem.5b01296
Keywords: glycogen, 13C MRS, liver, glucagon, insulin
Citation: Miller CO, Cao J, Zhu H, Chen LM, Wilson G, Kennan R and Gore JC (2017) 13C MRS Studies of the Control of Hepatic Glycogen Metabolism at High Magnetic Fields. Front. Phys. 5:21. doi: 10.3389/fphy.2017.00021
Received: 24 March 2017; Accepted: 29 May 2017;
Published: 14 June 2017.
Edited by:
Antonio F. Miguel, University of Évora, PortugalReviewed by:
Michael Roden, Heinrich Heine Universität Düsseldorf, GermanyMartin Krssak, Medical University of Vienna, Austria
Copyright © 2017 Miller, Cao, Zhu, Chen, Wilson, Kennan and Gore. This is an open-access article distributed under the terms of the Creative Commons Attribution License (CC BY). The use, distribution or reproduction in other forums is permitted, provided the original author(s) or licensor are credited and that the original publication in this journal is cited, in accordance with accepted academic practice. No use, distribution or reproduction is permitted which does not comply with these terms.
*Correspondence: Corin O. Miller, corin_miller@merck.com