Time-Dependent Diffusion MRI in Cancer: Tissue Modeling and Applications
 Olivier Reynaud
- Centre d'Imagerie Biomédicale, Ecole Polytechnique Fédérale de Lausanne, Lausanne, Switzerland
In diffusion weighted imaging (DWI), the apparent diffusion coefficient (ADC) has been recognized as a useful and sensitive surrogate for cell density, paving the way for non-invasive tumor staging, and characterization of treatment efficacy in cancer. However, microstructural parameters, such as cell size, density and/or compartmental diffusivities affect diffusion in various fashions, making of conventional DWI a sensitive but non-specific probe into changes happening at cellular level. Alternatively, tissue complexity can be probed and quantified using the time dependence of diffusion metrics, sometimes also referred to as temporal diffusion spectroscopy when only using oscillating diffusion gradients. Time-dependent diffusion (TDD) is emerging as a strong candidate for specific and non-invasive tumor characterization. Despite the lack of a general analytical solution for all diffusion times/frequencies, TDD can be probed in various regimes where systems simplify in order to extract relevant information about tissue microstructure. The fundamentals of TDD are first reviewed (a) in the short time regime, disentangling structural and diffusive tissue properties, and (b) near the tortuosity limit, assuming weakly heterogeneous media near infinitely long diffusion times. Focusing on cell bodies (as opposed to neuronal tracts), a simple but realistic model for intracellular diffusion can offer precious insight on diffusion inside biological systems, at all times. Based on this approach, the main three geometrical models implemented so far (IMPULSED, POMACE, VERDICT) are reviewed. Their suitability to quantify cell size, intra- and extracellular spaces (ICS and ECS) and diffusivities are assessed. The proper modeling of tissue membrane permeability—hardly a newcomer in the field, but lacking applications—and its impact on microstructural estimates are also considered. After discussing general issues with tissue modeling and microstructural parameter estimation (i.e., fitting), potential solutions are detailed. The in vivo applications of this new, non-invasive, specific approach in cancer are reviewed, ranging from the characterization of gliomas in rodent brains and observation of time-dependence in breast tissue lesions and prostate cancer, to the recent preclinical evaluation of new treatments efficacy. It is expected that clinical applications of TDD will strongly benefit the community in terms of non-invasive cancer screening.
Introduction
By probing the water molecule displacement at the microscopic scale, Diffusion Weighted Imaging (DWI) is well established as a powerful non-invasive MRI technique to characterize tissue order—or disorder. Since diffusion gradients sensitize the overall MR signal to potential fine changes occurring at cellular level, DWI has been extensively used to study the abnormal cellular growth characterizing cancer development [1] and/or predict therapeutic outcome [2].
The apparent diffusion coefficient (ADC)—a hallmark of DWI—has been recognized as a useful and sensitive surrogate for cell density [3, 4], paving the way for non-invasive tumor staging and characterization of treatment efficacy in cancer [5]. However, sensitivity does not equate with specificity, generating confusion when attempting to interpret diffusion changes in a meaningful manner. Cell size, density and/or compartmental diffusivities can all affect ADC measurements so that changes in the diffusion signal cannot be unambiguously attributed to specific tissue properties.
Diffusion is in general not Gaussian. While the reasons tissue complexity cannot be reduced to a single indirect diffusion metric are manifold, two particular aspects of non-gaussian diffusion deserve our special attention.
For a given diffusion time, the full diffusion signal S description can be written as a Taylor series, also known as cumulant expansion [6, 7]: , where D is the diffusion coefficient and K the kurtosis. The first-order approximation therefore only holds for bD ≪ 1/K, i.e., small b-values (b < 1 ms/μm2 in vivo). The estimation of the full kurtosis tensor can help characterize tissue structure more specifically, at the cost of extended scan time. Successful examples in cancer can be found in Jensen and Helpern [7] and Szczepankiewicz et al. [8] but fall outside the scope of this review.
Alternatively, this review focuses on time-dependent diffusion (TDD), i.e., the manifestation of tissue complexity through the dependence of the metrics previously introduced with diffusion time t: D = D(t) (and K = K(t)), sometimes also referred to as temporal diffusion spectroscopy [9]. The objective of this review is to provide the interested reader with all the keys and tools required to design a TDD experiment in which tissue microstructure parameters can be judiciously and non-ambiguously estimated.
The main issue with TDD is that, for a biological system, there is no analytical solution for the diffusion time-dependence in general.
Starting on a positive note, there are two extreme time domains where an exact solution exists. Diffusion in the infinitely short time regime is well defined for any system, and disentangle geometric from purely diffusive tissue properties [10]. Alternatively, diffusion in the infinitely long time regime can be characterized based on universal classes of tissue disorder [11].
In-between, a simple geometrical model, for which intracellular diffusion can be conveniently derived for any given time/frequency [12, 13], is presented. For a biological system and/or cancer cells, the range of cell size to which it can be applied is discussed.
Using these results, the main models used to characterize tumor tissue using TDD are reviewed: IMPULSED [14], POMACE [15], and VERDICT [16]. Modeling cells as impermeable spheres, additional assumptions are made to describe the ECS, and finally estimate diffusivities, cell size and volume fraction ex vivo and in vivo. Non-geometrical models [17, 18] are also discussed.
Membrane permeability is a key parameter often neglected during tissue characterization. Using time dependence, we discuss how this parameter—likely to vary in tumors—can be estimated in particular time regimes [17, 19] or via novel modeling [20].
Potential issues to keep in mind when modeling tumor tissue are also discussed. Experiments should be carefully designed in order to justify any modeling assumption, avoid overfitting and optimize the fit accuracy and precision.
At last, the growing impact of TDD in the preclinical and clinical setting is reviewed. A distinction is made between highly sensitive but non-specific results, often lacking the rigor of proper tumor tissue modeling, and specific yet less sensitive studies, whose conclusions are not always backed up by different methodologies. Issues regarding clinical scanners, as well as the perspectives and potential of TDD regarding new avenues of cancer research is finally discussed.
Time Dependent Diffusion: Fundamental Issues and Concept
There is in general no analytical solution for the time dependence of diffusion. The problem only simplifies in three particular regimes: at infinitely short times, at infinitely long times (also known as tortuosity limit), and near the long time regime. We will briefly summarize how diffusion behaves in these three time domains.
The Short Time Regime
The universal behavior of diffusion measured with Pulsed Gradient Spin Echo (PGSE, Figure 1A) at short times t was initially derived in porous media by Mitra et al. [10]. In a medium with free diffusivity D0, the overall diffusion coefficient D can be written as:
with d the number of dimensions along which molecules can diffuse and S/V the surface-to-volume ratio of the barriers/walls/cellular membranes. A similar formula was derived for Oscillating Gradient Spin Echo (OGSE, Figure 1B) using a cosinusoidal waveform acquired at frequency ω [21]:
The correction factor c(N) depends on the number of oscillations N and rapidly converges toward 1 [22].
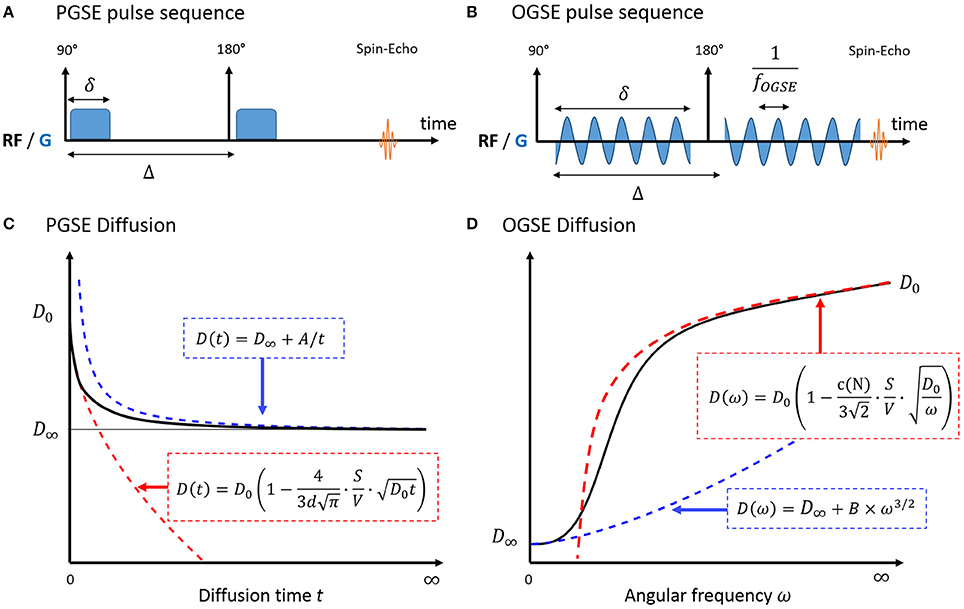
Figure 1. Pulse sequence diagram for PGSE (A) and OGSE (B) and diffusion in a biological system, measured with PGSE (C) and OGSE (D). In the short time regime (red), diffusion is fully characterized by the medium free diffusivity D0 and the surface-to-volume ratio S/V. At long times (blue), diffusion reaches its tortuosity limit D∞ with 1/t (PGSE) or ω3/2 (OGSE). There is no exact solution for the time dependence of diffusion in-between. A and B are geometry-dependent constants.
Interestingly, this regime unambiguously decouples the medium diffusive properties D0 from the purely geometric restrictions embedded in S/V. The linearity of diffusion vs. t1/2/ω−1/2 remain valid for a typical biological system consisting of intra- and extracellular water molecules, if the short time regime is reached in both compartments.
The validity of surface-to-volume ratio estimates was first verified experimentally using stimulated echo acquisition mode (STEAM) measurements on sedimentary rocks [23, 24] and large size beads [25]. It was later verified in smaller structures [26] and solutions of packed beads of various size (radius 1–400 μm) using OGSE [27].
The short time regime is only valid if the typical restriction scale R far exceeds the NMR diffusion length [10]. For small in vivo structures (R < 10 μm), only OGSE can achieve sufficient diffusion strength to probe this regime, by accumulating contrast over N oscillations: btotal = N × bN = 1 [27]. The linearity of D with ω−1/2 was recently demonstrated for f = ω/2π > 90 Hz in mice brain glioma [18] with large cellular radius (GL261, Rcell ~ 5 μm). The quadratic inequality rapidly becomes impossible to satisfy for smaller structures (healthy brain tissue, astrocytes, neurons, with R~1 μm). For these applications, dedicated and strong custom-built diffusion gradients should be used [27, 28].
The Tortuosity Limit
At very long times, diffusion lengths exceed the typical length of restriction within the medium to approach the macroscopic “tortuosity” limit D(t) = D∞ (Figure 1C). Diffusion becomes Gaussian, and time dependence and fine microstructural details are lost. For a non-exchanging multi-compartment system, each compartment cannot be distinguished from a homogeneous medium, and multi-exponential behavior is observed as a result. Various models used to describe white matter in this regime are detailed and reviewed in Ferizi et al. [29] and Panagiotaki et al. [30].
In a totally confined geometry, D(t) = 〈x2(t)〉/2t < 2R2/t. The diffusion inside closed impermeable structures converges to D∞ = 0 as 1/t.
Approaching the Long Time Regime
A perturbative solution to the time-dependence of diffusion exists near the tortuosity limit [11, 31]. In this regime, Novikov et al. [11] demonstrated that the diffusion depends on large scale structural fluctuations via the power law:
with ϑ = (p + d)/2, p and d being respectively the discrete structural exponent and spatial dimensionality of the problem, as in Equations (1) and (2) in Novikov et al. [11]. The exponent p characterizes global structural complexity, opposing regular lattices (p = ∞) to highly disordered media (p < 0). The case p = 0 corresponds to short-range disorder, when restrictions are uncorrelated or exhibit finite correlation length. Outside three dimensional dilute structures lacking long range order, such as cancer cells, PGSE and OGSE diffusion can then be expressed as Novikov et al. [11] and deSwiet and Sen [32]:
The previous equations highlight that there is no one-to-one correspondence between diffusion time and oscillation frequency. This becomes apparent when combining OGSE and PGSE measurements on similar graphs [28, 33]. A common approach when combining PGSE and OGSE is to use a single PGSE measurement as a surrogate for a diffusion measurement with zero frequency [27, 33–35]. This should be avoided as the PGSE time dependence cannot be neglected, as illustrated in Figure 5.
For all the Rest of Time
Both the extent of the intermediate regime and the diffusion behavior in that regime are in general unknown (Figures 1C,D). As an alternative, a Padé approximation [36] was considered in several studies to interpolate between the short and long time regime. Excellent agreement was found between S/V estimates from the Padé approximant and microscopy performed on monosized sphere packs [17, 37]. To date, this non-specific approach has not been applied to the characterization of cancer cells.
Tumor Tissue Modeling: Various Approaches
A Simple Model for Intracellular Diffusion
A practical solution to characterize tissue structure using TDD is to (a) model the cellular microenvironment using simple geometries, where an analytical solution for the intracellular diffusion Dics exists, and (b) consider the extracellular contribution in one of the aforementioned regimes (short/long/tortuosity limit). The case of impermeable spheres, that represent the simplest three-dimensional geometrical model for characterizing cells—and therefore cancer cells (Figure 2)— is detailed here.
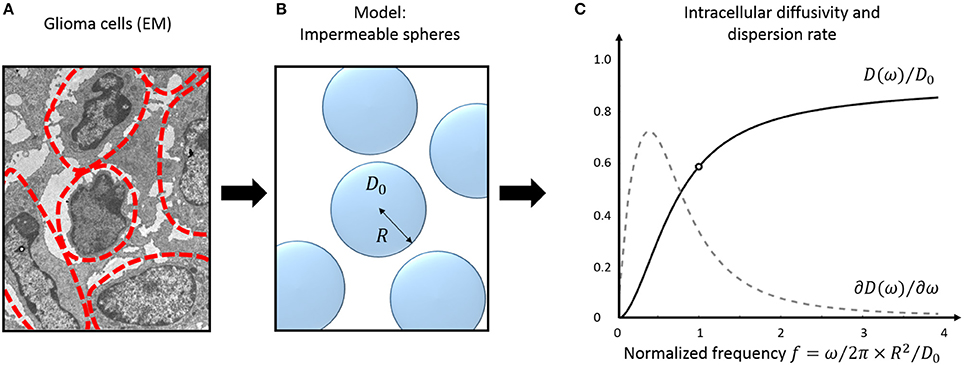
Figure 2. Tumor tissue modeling: intracellular diffusion. Electron micrograph (EM) of murine glioblastoma GL261 cells (A). The approximate cell contours are delineated in red. (B) Simple three-dimensional geometrical model for tumor cells. Cells are assumed perfectly spherical, homogeneous in size and fully impermeable. (C) Diffusivity inside impermeable spheres (black) and its frequency- derivative: the instantaneous dispersion rate (gray, arbitrary units). Oscillations frequencies are normalized to the tissue characteristic frequency . The EM was extracted from the dataset used for cell size measurement in Reynaud et al. [15].
Diffusion Inside Impermeable Spheres
The signal attenuation inside impermeable spheres was first derived for PGSE by Murday and Cotts [12] and for OGSE by the Vanderbilt group [13]. The PGSE intracellular diffusion is expressed as:
Here R is the cell radius, δ and Δ the gradient and inter-gradient duration, and the characteristic diffusion time of the cell (). μn is numerically estimated as the nth root of ∂j1(μ)/∂μ, where is the spherical Bessel function of the first kind. For the PGSE experiment in the narrow pulse regime, the diffusion time t equates the inter-gradient duration Δ. Finite pulse widths δ act as low-pass filter on the velocity autocorrelation function [38, 39], potentially impacting the functional form of the diffusion time–dependence (see for instance Equation 8 vs. Equation 9 in Fieremans et al. [40]—an axon study).
For OGSE, using the same formalism:
The diffusion behavior inside impermeable spheres is illustrated in Figure 2C, most changes happening around the tissue characteristic frequency .
The complete list of TDD studies and models used to characterize tissue structure based on this geometry are detailed in another section of the manuscript. In addition to the unrealistic case of infinite impermeable membranes already described by Tanner and Stejskal [41], similar expressions were derived for diffusion inside spherical shells [42] and infinite cylinders [43]. The former, in order to represent cellular nuclei and cytoplasm, adds two extra degrees of freedom to a problem already prone to overfitting [15]. The latter was shown successful in estimating the size of small cylinders in the absence of an extracellular medium [44] and could be promising for axonal size estimation but is of little use for MR in cancer.
Oscillation Frequency vs. Cell Size
Depending on cell size, the tissue characteristic frequency can remain out of reach using OGSE and conventional diffusion gradients, thus preventing a good sampling of the diffusion time-dependence. Figure 3A highlights the diffusion behavior over a realistic range of cellular size radii (R = 1–10 μm) and ICS free diffusivity (D0 = 2 μm2/ms). Without a dedicated gradient insert, the only oscillation frequencies that can be probed with sufficient diffusion contrast on commercial scanners are restricted to the far left side of the spectrum (fOGSE < 300 Hz), insufficient to explore diffusion inside small structures (R = 1–2 μm). On the other hand, the short-time limit—characterized by the linear relationship between D and ω−1/2–is already within reach for larger cells (R = 5–10 μm, see Figure 3B), as demonstrated in vivo in Reynaud et al. [18].
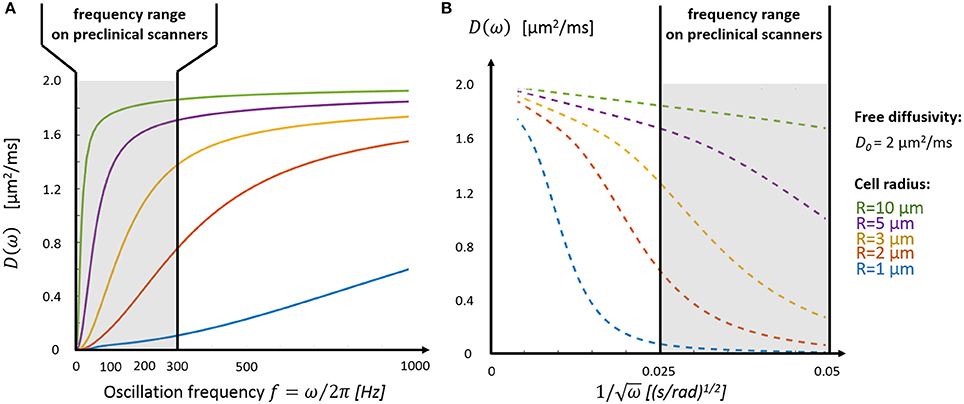
Figure 3. Intracellular diffusivity and cell size. (A) The oscillation frequency range available on preclinical scanners (fOGSE < 300 Hz, gray area) is most suited to characterize the diffusion time-dependence inside large structures (R > 3 μm). (B) The short time regime, characterized by a linear dependence between D and ω−1/2 (Equations 1 and 2), is only accessible for very large cells (R > 5 μm). Plots were adapted from the equations derived in Xu et al. [13].
Modeling Impermeable Tumor Tissue
A commonly used picture to describe tumor tissue is a non-exchanging multi-compartmental model distinguishing intracellular from extracellular diffusivity.
Impermeable Spheres within the Extracellular Space
At least four independent parameters (cell radius R, ICS/ECS free diffusivities, intracellular volume fraction f ) are needed to describe the system {impermeable spheres + ECS compartment}. Additional parameters are required to describe the ECS diffusion outside the tortuosity limit (D = cste) and short-time regime (Equations 1–2), or to model additional compartments, such as vasculature with VERDICT [16]. In practice, multiple PGSE [16, 45] or a combination of PGSE and OGSE [14, 15] measurements are combined in order to probe diffusion in a specific or over several frequency/time domains.
The IMPULSED model
The IMPULSED (imaging microstructural parameters using limited spectrally edited diffusion) model combines multiple low-frequency OGSE measurements (fOGSE < 150 Hz) and a single PGSE acquisition in the long time regime (Figure 4A) to quantify the characteristic size of restriction and ICS fraction [14, 46].
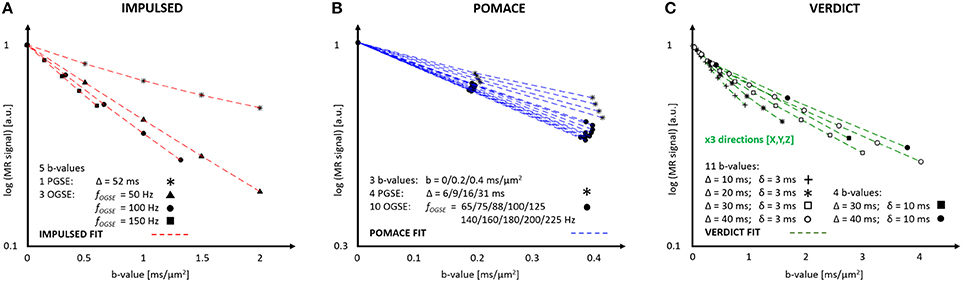
Figure 4. MR parameters and diffusion signal for three geometrical models: IMPULSED (A), POMACE (B) and VERDICT (C). Only 20 measurements (5 b-values, 4 diffusion times) are required to fit the diffusion signal with IMPULSED (red). With POMACE (blue), 42 points are acquired (3 b-values, 14 diffusion times), strictly restricted to the DTI regime (b < 0.5 ms/μm2). The full implementation of VERDICT (green) requires 44 measurements repeated along three orthogonal axes (X/Y/Z), plus acquisitions at b = 0. Note the different scale of b-value along the horizontal axis. The plots illustrate the protocols described in Reynaud et al. [15], Panagiotaki et al. [16], Jiang et al. [46].
This approach was shown successful in estimating cancer cell size in vitro in the range (5–10) μm using only a small subset of measurements on murine (MEL) and human leukemia cells (K562) [14]. In vivo, the correlation between histology and IMPULSED-based cellularities were found superior than between histology and conventional PGSE measurements, in three different colorectal cancer xenograft tumor models (DiFi, HCT116, and SW620) [46].
This model assumes that the ECS diffusion varies linearly with frequency fOGSE in the range 50–150 Hz. This assumption was motivated by (i) the empirical linear behavior of the overall ADC (intra- and extracellular) measured in the healthy mouse brain [34] and (ii) simulations in extra-axonal space derived from histology samples [43]. Unfortunately, this would only be valid of a two-dimensional problem (d = 2 in Equation 3) and the correct formula for the ECS diffusion around spheres at long times is given by Equation (5) instead. However, the linear approximation can be considered as an approximation in a narrow frequency range, with little impact on estimated parameters.
The POMACE model
The POMACE (Pulsed and oscillating gradient MRI for assessment of cell size and extracellular space) model combines multiple OGSE and PGSE measurements in different time domains (Figure 4B). Microstructural parameter estimation is performed in two steps. The surface-to-volume ratio and free diffusivity are first evaluated using high-frequency OGSE in the short-time regime [18] using Equation (2). These values are then used as constraints when fitting the low-frequency OGSE and PGSE data (Figure 5, fOGSE < 88 Hz) to a model of impermeable spheres bathing in ECS [15].
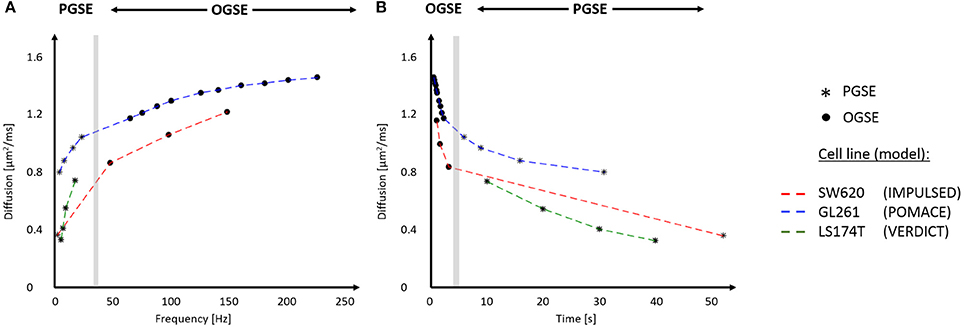
Figure 5. In vivo time-dependent diffusion in tumors plotted vs. frequency (A) and diffusion time (B). Synthetic data for different cell lines (SW620, GL261, and LS174T) were generated using the best fits for the diffusion signals respectively reported in Reynaud et al. [15], Panagiotaki et al. [16], Jiang et al. [46]. The range of frequencies and diffusion times probed with IMPULSED (red), POMACE (blue) and VERDICT (green) can be appreciated in (A,B). The gray area delineates the limit between OGSE (circles) and PGSE (stars) datapoints. For display purposes, PGSE and OGSE measurements were attributed the equivalent frequency fOGSE and diffusion time t according to , as discussed in Novikov et al. [79].
Using a dedicated histology coil [47], the validity of POMACE was tested ex vivo. ICS maps correlated well with optical microscopy performed on the same samples used for MRI [15]. In vivo, ICS estimates were found in agreement with ECS estimates from an effective medium theory [25], while cell sizes matched electron microscopy measurements in mice gliomas (GL261).
The POMACE framework was later applied to the in vivo assessment of treatment response in GL261 gliomas and 4T1 mammary carcinomas [48]. Following tumor treatment with 5FU and bevacizumab, a significant ECS decrease was observed with POMACE, while the absence of impact on S/V or cell radius suggested partial membrane deterioration and/or a decrease of the apparent restrictive surface due to increased cell packing in both cell lines.
The VERDICT model
VERDICT (vascular, extracellular, and restricted diffusion for cytometry in tumors) is the only model to consider the impact of tumor vasculature on the directionality of diffusion (Figure 4C). Cancer cells are modeled by spheres, the extracellular diffusivity by an isotropic diffusion tensor, and the vascular compartment by an additional highly anisotropic tensor [16], although its precise form can vary depending on the application [49].
This more complex modeling comes at the expense of a large number of parameters to estimate. To ensure fit robustness, the free diffusivities in the ICS and ECS are fixed. Six independent parameters are estimated: intracellular and extracellular volume fractions fics and fecs, cell size R, the pseudo-diffusion coefficient of water inside blood vessels P, and two angles characterizing the directionality of the vascular compartment. The intravascular fractions is then calculated as fv = 1 − fics − fecs.
This model successfully differentiated two human colorectal carcinoma cell lines based on their vascular fraction [16]: SW1222 xenografts exhibited dense perfusion (fv = 0.22) while LS174T (Figure 5) were properly categorized as densely packed (fecs < 0.05) with low perfusion (fv = 0.12). In addition, significant changes in intravascular and intracellular volume fractions were observed in response to a chemotoxic agent leading to cell apoptosis (gemcitabine), as confirmed by flow cytometry [16].
Focusing on PGSE acquired at several diffusion times (10–40 ms), diffusion contrast is plentiful and VERDICT can be easily adapted to a clinical setting. After preliminary work on model selection, the previous model was modified to (i) consider the vascular compartment as isotropic and (ii) fix the free diffusivities and pseudo-diffusion coefficient to 2 and 8 μm2/ms, respectively. In vivo, the new model (with only three independent parameters) was able to distinguish tumor from benign prostatic areas in eight patients at 3T under acceptable scan times (35 min) [49].
A prospective study—INNOVATE [50]—recently started combining the VERDICT framework with novel blood and urine sampling based potential biomarkers in an attempt to affine patient screening and promote the use of multi-parametric MRI before biopsy for the diagnosis of prostate cancer. Patient follow-up is needed before assessing the potential improvement in patient care by diagnosing early aggressive prostate cancer.
ADC dispersion rate
A linear increase of ADC vs. OGSE frequency was reported in the ex vivo mouse brain in the range 0–150 Hz [34]. Regions of large ADC changes (Δf ADC) colocalized well with Nissl staining and densely packed neuronal regions, suggesting a link between ADC dispersion and ICS volume and/or cell size.
A theoretical justification for this effect can be found in Equation (7) and Figure 3. At low frequency OGSE, the intracellular diffusion in small structures (R ≤ 5 μm) does not approach the asymptotic short-time limit and can be considered linear with fOGSE, as a first approximation in a narrow frequency range. Fixing D0, the slope of this linear relationship increases with cell size (Figure 3A) and ICS volume, assuming slower diffusion time-dependence in the ECS.
The ADC dispersion rate averaged in the range 50–250 Hz was shown sensitive to treatment of colorectal tumor SW620 with barasertib (AZD1152) [51], known to induce the formation of new chromosomic structures at subcellular level, increased cell size and eventually apoptosis [52].
A closer look on Figure 2C highlights that the instantaneous dispersion rate ∂D/∂f is non-monotonous with OGSE frequency. A maximum is reached around, suggesting potential for characterizing the tissue characteristic restriction scale. This was demonstrated in vitro using two cell lines with different radius (R = 5/10 μm for MEL/K562) with significantly different instantaneous dispersion rate around 60 Hz [53].
Although ex vivo experiments performed on kidney and liver tissue highlighted very little contrast with dispersion rate compared to conventional ADC [53], these result are dependent on sample preparation and fixation, and should be reproduced in vivo. Larger diffusivities might shift the oscillation frequency range of interest.
Impermeable Model-Free Approaches
Non-geometrical models can also be used to describe tumor microstructure. Systems can indeed simplify in a specific time regime, where geometry is partly irrelevant, such as the very short or long time regime. This results almost always in a more accurate estimation of a certain tissue parameter, at the expense of another.
The short time regime
As discussed in the first section, the universal behavior of short-time diffusion is described for PGSE and OGSE by Equations (1) and (2). In this regime, any system can be considered made of two spin populations. Regardless of the particular geometry, some random walkers will never experience the cell walls (and freely diffuse with D0) while the displacement of the population within diffusion length of the wall (with volume fraction: ) will be restricted. At such short times, neither the curvature nor the permeability of the cell walls impact diffusion [10, 19].
The validity of the short diffusion-time regime was demonstrated in vivo and ex vivo in mice gliomas (GL261, R~5 μm) in the range 88 Hz ≤ fOGSE ≤ 225 Hz [18]. The decoupling of diffusive and geometric properties was assessed ex vivo by varying the sample temperature, only impacting the term D0 in Equation (2). Parametric maps of S/V and D0 were easily accessible in vivo, paving the way for robust—thanks to linear fitting—and unambiguous interpretation of TDD in tumors.
Potential applications in a clinical setting include characterization of breast cancer. Recently, this regime was demonstrated in vivo at 3T in healthy breast tissue using STEAM and diffusion times in the range 80–900 ms [54], following up on muscular studies [55, 56] with similar restriction scale (hundreds of microns).
Effective medium theory at long times
On the other side of the spectrum, the effective medium theory (EMT) only focuses on the macroscopic properties of tissue. At long times, molecules have diffused around and inside each structure, so that microscopic information such as cell size is lost. Using an EMT analogous to that of conductivity in porous media, the long time limit of diffusion in a biological system {permeable spheres + ECS} was derived [17]. In the impermeable case, Equation (2) from Latour et al. [17] becomes:
where f is the ICS volume fraction and D0 the free extracellular diffusivity. Since microstructural information is lost, changing cell shapes should not affect Equation (8).
This EMT establishes the well-known relationship between PGSE measurements at long times and cellularity for a simple system [3, 4]. Provided the cell size is of little interest, estimating the tortuosity limit with multiple PGSE in the long time regime (Figure 1C) is indeed an alternative way of estimating the size of the ICS. A priori knowledge on D0 is however required to quantify f using Equation (8). Additional information on D0 can be gathered in the short-time regime using Equations (1) and (2).
An EMT approach was successfully demonstrated in mice gliomas using only four diffusion times (6–31 ms) [15]. ICS estimates were found in excellent agreement with that of POMACE, fewer acquisitions were required, and fit estimates found very robust. Unfortunately, cell sizes could not be estimated using this technique.
Current Research Gaps and Pitfalls
Modeling Issues
In this section are detailed problems commonly encountered when modeling and fitting tissue microstructure. Potential solutions are discussed when available. The objective is not to compare the various fitting frameworks, but rather to discuss common flaws when modeling biological tissue.
Accuracy and Precision of Fitting
Albeit simplistic, geometrical models require the simultaneous estimation of at least four independent parameters: cell size R, ICS volume fraction f, and intra- and extracellular diffusivities Dics and Decs. Additional parameters are required for modeling time-dependence in the ECS [14] and/or a vasculature compartment [16]. In practice, the narrow range of diffusion times available in most scanners (Figure 5) prevents the completely unambiguous estimation of all model parameters.
Accuracy
Accuracy represents the closeness of fit estimates compared to the ground truth. In the absence of a ground truth, a commonly used approach is to generate synthetic data based on the model, add noise, and compare the “noisy” fit outputs to the initial “clean” input. For preclinical brain studies, typical in vivo SNR values range were reported between 100 and 150 [15].
We consider here the case of impermeable spheres within the ECS. As in POMACE, the ECS is modeled in the tortuosity limit for low-frequency measurements, and in the short time regime for high-frequency OGSE acquisitions. The problem is further simplified by initiating the fitting algorithm from the ground truth in order to minimize the influence of local minima when estimating parameters. Synthetic data is generated from the parameters best describing TDD in murine glioblastoma [15].
Without PGSE, a large range of solutions emerge from noise propagation (Figure 6A) despite high SNR (SNR = 120) and multiple OGSE time-points (10 fOGSE steps from 60 to 225 Hz). This model is obviously not well suited to characterize tumor microstructure accurately, its solutions are not centered on the ground truth.
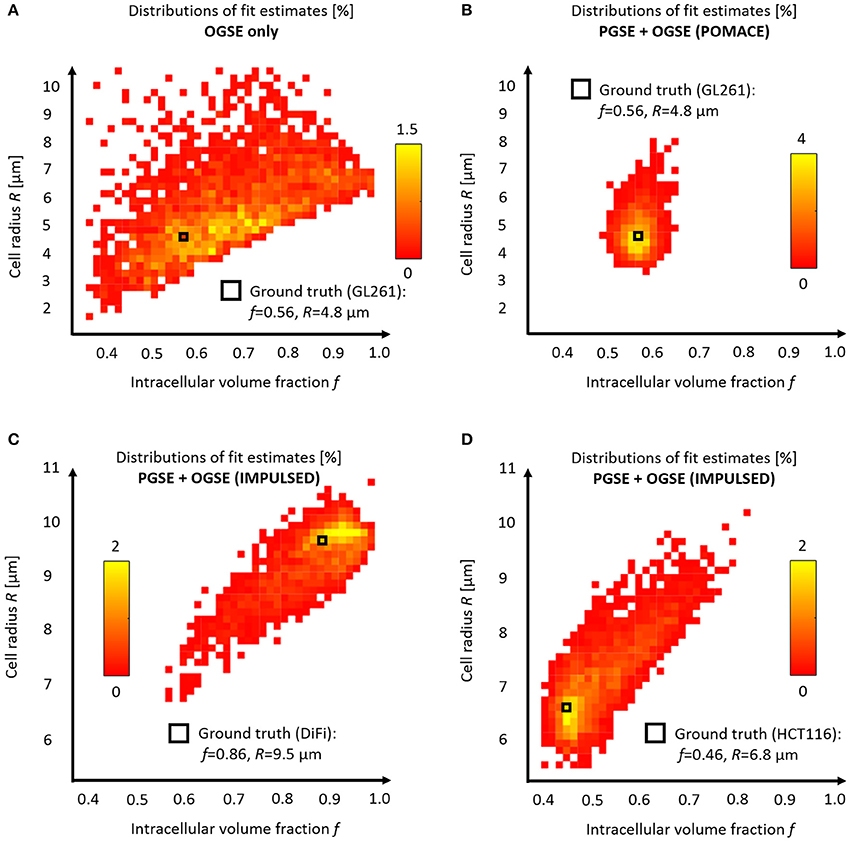
Figure 6. Model accuracy and precision. Distributions of intracellular volume fractions and cell radius estimates on noisy data (synthetic GL261 glioma signal, SNR = 120, n = 2,500) using (A) OGSE measurements in the range (65–225) Hz, or (B) a combination of PGSE (Δ6/9/16/31 ms) and OGSE data as in POMACE [15]. Fit estimates distribution when characterizing tumor microstructure in vivo inside DiFi (C) and HCT116 (D) colorectal tumors with IMPULSED [46]. The ground truth is indicated by a black square. For each framework, the full list of fit estimates can be found in Table 1. The matlab code used to generate synthetic tumor data and plot parameter accuracy with POMACE and IMPULSED is readily available for download at https://github.com/oreynaud/FIT_TDD.
This issue can be resolved here by increasing the SNR or incorporating additional data points (b-values and/or diffusion times), for instance PGSE measurements. Incorporating a priori knowledge on the system—by fixing one parameter—will also help by reducing the degree of freedom of the problem. A combination of the last two approaches was chosen to improve the robustness of the POMACE framework [15], as can be seen in Figure 6B. Another “angle” can be to use the directionality of diffusion, only useful when properly accounted for in tissue modeling [16].
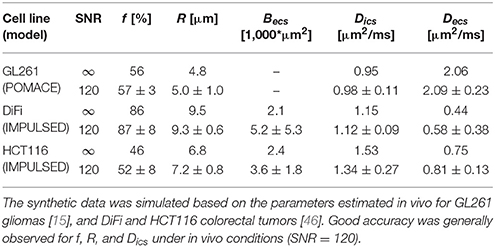
Table 1. Accuracy and precision of all fit estimates (average ± std, n = 2,500).
Similarly, synthetic diffusion data was generated using the IMPULSED framework [46] in order to mimic TDD in colorectal tumors (see Table 1). Multiple instances of gaussian noise (typical in vivo SNR = 120, n = 2,500) were added to the signal before fitting. Although the distribution of fit estimates were not found normal (Figures 6C,D), average fit estimates matched the ground truth (SNR = ∞) with good accuracy for most parameters (Table 1, relative bias below 3/13% for f, R, Dics for DiFi/HCT116 cell lines). The matlab code used to generate synthetic tumor data and plot parameter accuracy with POMACE and IMPULSED is readily available for download at https://github.com/oreynaud/FIT_TDD.
Precision
The primary objective behind the development of TDD was to attribute the changes in the diffusion signal to specific microstructural metrics, without ambiguity. Even if the fit is accurate, microstructural variations—in space or time—can only be reliably estimated if they exceed the fit precision, defined by the reproducibility of parameter estimation.
Small changes in volume fraction are likely to be picked up by POMACE (Figure 6B and standard deviations in Table 1), due to the large amount of data acquired in the long time regime. On the other hand, the IMPULSED framework is well suited to detect small variations in cell size (Table 1) and would benefit from a reduced scan time. Results might depend on the particular microstructure, as illustrated by the different precision available on diffusivities estimates between the two colorectal cell lines.
In general, it appears unreasonable to attempt to detect variations below the following thresholds: Δf min = 3% and ΔRmin = 0.5 μm. Since low image SNR is extremely detrimental to the fit precision, smoothing and/or averaging the signal within regions of interest might be preferred to raw single-voxel parametric mapping in order to enhance the robustness and specificity of the analysis. Special care should however be taken in very heterogeneous tumors.
Fixing Parameters
Because of model over-parametrization, most TDD frameworks resort to fixing one or several parameters in order to improve the fit stability and precision. This comes at the expense of accuracy, because errors on fixed parameters can propagate into the remaining fit estimates.
In the first VERDICT framework, the ICS and ECS diffusivities were fixed based on fit optimization performed on preliminary data [16], and found consistent with values derived from ex vivo studies with high SNR [57]. To further improve the fit robustness, the pseudo-diffusion coefficient of the water inside blood vessels was also fixed when characterizing prostatic tissue lesions in vivo in a later study [49].
In POMACE, the extracellular free diffusivity was also fixed ( μm2/ms in vivo/ex vivo) and used as an additional constrain to reduce the degree of freedom to three parameters, using short time limit measurements [15].
Despite being central to the fit accuracy and precision, it is not always clear how other frameworks deal with these practical issues. Data and code sharing, a good example of which can be found in Panagiotaki et al. [16], would help increase the transparency so desperately needed when dealing with complex modeling.
Diffusion Is Not Constant in the ECS
The main three geometrical models (IMPULSED, POMACE, VERDICT) all assume that the extracellular diffusion is in the tortuosity limit for PGSE [14, 16] and/or low-frequency OGSE [15].
However, in the long time regime, Equations (6) and (7) degenerate into DPGSE, ics(t)∝1/t and . Therefore, the ECS time-dependence, supposedly varying as 1/t or ω3/2 using Equations (4) and (5), is not negligible when t → ∞ or ω → 0. Neglecting the ECS time-dependence is in general wrong (see Figures 1C,D) and should be carefully justified, depending on the application.
This problem can be resolved by estimating a lower and upper bound for the extracellular diffusivity in the range where it is assumed constant. If ECS diffusion variations cannot be neglected, prior knowledge on typical restriction scales can be used to justify that intracellular changes are expected to dominate the overall time-dependence. Obviously, the validity of such an approach would only hold in a certain time/frequency range, and for a specific application.
Microscopic Heterogeneity
To date, all geometrical models have considered that each component of tissue microstructure (compartment size, diffusivities…) could be properly modeled by a single metric per voxel, fully depicting the value of a particular parameter. This can potentially lead to substantial bias, since tumor heterogeneity—revealed with histopathology—is present both at macroscopic and microscopic scale.
Because the relationship between the different estimated parameters and the resulting MR signal is not linear (see Equations 6 and 7), the various outputs of the fit procedure are likely not to represent neither the average nor the median value of any physical metric that could be measured using a more direct imaging method (electron/optical/fluorescence microscopy).
Interestingly, DWI can be used to probe intra-voxel parameter variance using conventional kurtosis imaging [7] and/or the recently introduced kurtosis-based DIVIDE technique [8]. These techniques can be used as safeguards to delineate areas of strong heterogeneity in order to minimize parameter bias with TDD due to strong intra-voxel variance. In their absence, most parameters shall be regarded as indexes, rather than specific precise markers of tumor microstructure.
Accounting for Tissue Permeability
All the models introduced so far consider cells to be fully impermeable. The present section will focus on (a) how to properly model membrane permeability κ at short and long times, (b) whether it impacts parameter estimation using geometrical models and (c) alternative models that attempted to account for permeability, using TDD and/or filter exchange imaging.
The short time limit
Cell permeability does not impact diffusion measurements at very short times: Equations (1) and (2) are always valid regardless of cell permeability κ. However, as time increases, diffusion departs from the previous equation and can be expressed as in Sen [19] and Sen [58]:
Here ρ is the surface relaxivity, and Di, Si/Vi, and Ri the free diffusivity, surface-to-volume ratio, and radius of curvature of compartment i = {1,2}. A similar expression describes the diffusion in the second compartment, by interchanging the subscripts {1,2} and the sign of the last term representing the average inverse curvature radius over the interior surface.
The models simplifies under two assumptions: ρ ≪ κ (true for most biological systems) and D1 = D2. The curvature terms cancel each other in the overall diffusion D = fD1 + (1 − f)D2. From there follow that the linear dependence of the diffusion directly represents the influence of permeability κ. Estimates are weighted by the surface-to-volume ratio counted twice, as random walkers explore the walls both from inside and outside the cells.
Using the diffusivity and permeability calculated for packed erythrocytes (red blood cells) in Latour et al. [17], Sen [19] estimated that permeability only becomes a relevant model parameter when diffusion times approach or exceed 60 ms.
Since in vivo diffusion deviates from the short-time limit regime around fOGSE = 88 Hz for cancer cells [18], one could wonder whether permeability might already impact low-frequency diffusion measurements. However, the mismatch between experimental data and Equation (2) could not be fitted by a linear relationship with fOGSE.
The long time regime
The impact of permeability on diffusion at long times can be derived using the EMT proposed by Latour et al. [17]:
Equation (10) was successfully used to estimate membrane permeability in bovine red blood cell samples around 6.3 × 10⁻³ cm/s [17]. Diffusion results were found well in agreement with extensive literature in red blood cell permeability [59, 60].
This equation simplifies for f = 1 (i.e., no ECS) to the well-known equation derived by Tanner [61] for a stack of flat layers with characteristic length R: . This approximation was later used to accurately measure cells permeability in yeast suspensions [62].
Permeability and geometrical models
The lesser tortuosity expected from permeable cells according to Equation (10) was observed experimentally on human leukemia K562 cells treated with saponin [63], for the multiple diffusion times and oscillation frequency available on preclinical scanners.
The impact of non-zero permeability on parameter estimation was simulated using a finite difference method within the IMPULSED framework [64]. The robustness of most fit estimates (f, R, Dics) was demonstrated under two conditions: the image SNR must remain large (≥50) and the water exchange time τ–related to permeability via – must exceed 100 ms.
Such results would in all likelihood hold for other frameworks, provided tissue exchange times exceed the longest diffusion times used to probe diffusion. In cancer, water residency times were estimated around hundreds of milliseconds [65–67], suggesting that permeability could bias but not severely impact parameter estimation performed using PGSE and OGSE. However, changes of cell permeability due to treatment during longitudinal studies could impair the specificity of the model via the apparent variation of other microstructural estimates, such as cell size and ICS diffusivity.
Empirical “permeable planes/spheres” models
The analytical solutions for the diffusion inside impermeable spheres Dspheres(R, D0) or between planes Dplanes(R, D0) predict D = 0 at infinite times. Rather than evaluating the contribution of a second—extracellular—compartment, a handful of studies attributed the disparity between these models and the observed diffusion (D∞ ≠ 0) to membrane permeability, and modeled the TDD of a biological system using empirical formulas such as: D = D∞ + Dplanes/spheres(R, D0 − D∞) [28, 35]. It should be noted that permeability cannot be estimated using those models.
Such models can be used to sensitize MRI to small tissue changes thanks to a restricted number of fit parameters, and were shown useful in assessing tumor treatment efficacy in two ovarian human cell lines (OVCAR-8 and NCI/ADR-RES) [35].
However, interpretation of the results is limited as only a mere qualitative insight into tissue structural changes is possible. Without ECS, the pseudo-intracellular diffusivity D0 − D∞ is void of physical meaning. At best, R can represent a “restriction index”, based on D0 − D∞ and the characteristic oscillation frequency (Figure 2C).
The random permeable barrier model (RBPM)
In cancer, randomly oriented flat membranes represent a more realistic model than a stack of flat layers, for which a solution accounting for permeability can be derived [20]. Using the EMT formalism for the diffusion signal proposed in Novikov and Kiselev [31], D(t) is related to the dispersive diffusivity via:
and , for random permeable barriers, is described by Novikov et al. [20]:
where ξ represents the effective volume fraction of membranes via ξ = S/V × D0/2κd in d dimensions, and is a dimensionless frequency.
Although never applied in tumors, the RBPM geometry is well suited for muscle studies [56], and tissue permeability and cell size were recently estimated in vivo and on clinical scanners [68]. This approach could provide an interesting approach to characterizing sarcomas using TDD in the near future.
Filter exchange imaging (FEXI)
A promising alternative to TDD for characterizing cell permeability might lie in apparent exchange rate/filter exchange imaging (FEXI) [69, 70]. In FEXI, a stimulated-echo double diffusion encoding sequence uses two PGSE diffusion blocks separated by a mixing time td, during which exchange between intra- and extracellular compartments (where diffusion is assumed to be approximately Gaussian) occur. The water exchange rate is estimated by measuring a mono-exponential decay of diffusion with mixing time td [69].
The clinical potential of FEXI was first assessed in the brain, in both healthy and brain cancer patients, where viable and necrotic parts of the tumor could be clearly differentiated based on exchange rate [70]. More recently, FEXI was shown capable of differentiating two brain cancer types (astrocytomas vs. meningiomas) in vivo based on exchange rate using only a small sample size (5–10 subjects) [71]. In breast cancer, FEXI could differentiate between multiple cell lines in vitro, while its potential for in vivo imaging was also demonstrated [72].
Time and Hardware Issues
Acquisition Time
A typical TDD experiment relies on the acquisition of multiple diffusion measurements performed when varying the diffusion time/oscillation frequency. Multiple diffusion times are required to extract relevant microstructural information from variable molecular restriction via Equations (6) and (7). It is also recommended to acquire a large range of b-values due to the large amount of parameters to estimate when fitting diffusion data to a specific model for tissue microstructure. The multiplicity of scans considerably lengthens the acquisition time dedicated to TDD.
Long scanning times are detrimental for the translation of newly-derived frameworks in a clinical setting. In that view, efforts are being made to shorten the number of measurements [46, 49].
This issue can be magnified for anisotropic media, where some compartments should be characterized by a tensor. Tissue lesions are often considered isotropic for convenience and practicality [49], potentially at the expense of specificity [57].
Frequency Range and Cell Size
The apparent mismatch between preclinical and clinical applications originates from restricted scanner capabilities.
Preclinical scanners
For a given gradient strength and duration, for cosine OGSE [27]. As a result, reasonable contrast at large oscillation frequencies can only be achieved by compensating the lesser temporal window allow for molecular diffusion by stronger dephasing, i.e., stronger gradient strength.
This sets an upper bound limit for the frequency of OGSE measurements around 300–350 Hz (using bOGSE = 0.4 ms/μm2 and typical echo times) on preclinical scanners equipped with diffusion-friendly gradients (1 T/m). This in turns sets a lower limit for the range of restriction scales that can be probed using TDD around ~ 2 μm.
As a result, most preclinical applications of TDD so far have focused on relatively large structures, such as brain glioma or colorectal cells (R ~ 4–20 μm). An obvious downside is that—in the brain—the comparison of diffusion-based tumor microstructural metrics with healthy tissue remains out of reach, since TDD is not adapted to characterize normal brain tissue structure (white/gray matter).
Although sinusoidal OGSE exhibit larger b-values than their cosine counterpart, a DC component is introduced into the frequency spectrum, effectively mixing conventional PGSE and OGSE measurements [27]. Compared to cosine OGSE, the gain in diffusion contrast does not originates from the frequencies of interest.
Clinical scanners
The situation worsens for clinical scanners, where fOGSE = 100 Hz can only be achieved with b < 120 s/mm2 (3T, gradient strength 80 mT/m). While intra-voxel incoherent motion effects [73] do not affect cosine modulated OGSE or other sequences with no sensitivity to the zero frequency of the diffusion spectrum relating to translation, this results in poor diffusion contrast. In addition, diffusion is in that range already highly restricted in small structures, and microstructural information cannot be retrieved using diffusion time-dependence [74]. The development and availability of high gradients systems is crucial to the eventual translation of the full TDD potential to the clinic.
On the contrary, clinical diffusion—using STEAM and PGSE—is already well adapted to characterizing breast and muscle tissues, where the restriction scale approaches hundreds of microns. TDD applications in sarcomas and breast cancer are well within reach of the current hardware systems, and are expected to flourish over the next few years.
In addition, the potential success of the INNOVATE study [50] on a large cohort could represent a tremendous springboard for prostate cancer characterization using TDD, as well as a major billboard for promoting TDD applied to various forms of cancer.
Applications of Time-Dependent Diffusion in Cancer and Future Developments
Range of Applications
The full list of studies combining TDD with in vivo MR of cancer can be found in Table 2.
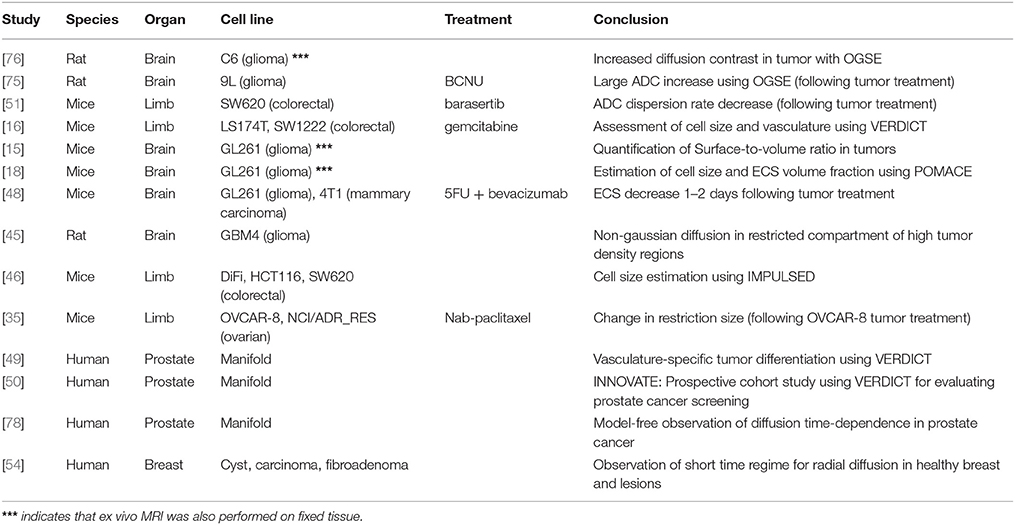
Table 2. List of in vivo applications of time-dependent diffusion in cancer.
At preclinical level, in vivo time-dependent studies have focused on brain gliomas using rat [45, 75, 76] and mice models [15, 18, 48], as well as mice xenografts models of colorectal [16, 46, 51] and ovarian cancer [35].
On the other hand, human in vivo applications have targeted prostatic tissue [49, 50, 77, 78] and breast lesions [54], while its potential in muscle was shown in Sigmund et al. [56].
Tumor Treatment
A distinction is made between two classes of studies. On one hand, sensitive metrics can be derived from TDD experiments without proper tissue modeling, by benefiting from a small number of degrees of freedom. Alternatively, the diffusion frameworks based on geometrical modeling and multi-compartmental approaches provide specific insight into tumor structure. This comes at the expense of parameter accuracy and precision due to the large number of estimates to quantify.
Sensitive Markers
The impact of tumor treatment on TDD measured with OGSE was first observed in vivo in the rat brain following the injection of BCNU in 9L gliomas [75]. A significant increase in contrast (tumor vs. healthy brain) was obtained from ADC maps at high oscillation frequencies (fOGSE = 240 Hz).
From the same group, Xu et al. [51] acquired the diffusion signal for a wide range of oscillation frequencies 2 and 4 days after chemotherapeutic treatment on SW620 colorectal tumors grafted in mice limbs. Results differed from the previous experiment in that the treated tumor ADC decreased for high frequencies, but still increased for PGSE and low-frequency OGSE. These observations, consistent with a decrease in cell density simultaneous to an increase in cell size following the barasertib treatment, highlighted the necessity to probe diffusion on a large time scale. Based on these findings, the ADC dispersion rate—averaged over the range 50–250 Hz—was proposed as a promising sensitive (but unspecific) marker for treatment efficacy [51].
Recently, Jiang et al. [35] evaluated the potential of an empirical model—of the type D = D∞ + Dplanes/spheres(R, D0 − D∞)–to study ovarian cancer cells (OVCAR-8 and NCI/ADR-RES) undergoing mitotic arrest. As already discussed, such models can be used to sensitize MRI to small tissue changes thanks to a restricted number of fit parameters. Significant changes of the “restriction index” and “free diffusivity” were reported following treatment of OVCAR-8 with Nab-paclitaxel [35].
In summary, TDD has been successfully used to observe a small trend in ADC and ADC dispersion rate, or using simplistic modeling. Although sensitive, the reported results remain difficult to interpret due to the non-physical origin of the measured metrics. Changes in diffusivities, compartments and cell size cannot be efficiently disentangled from the estimation of a small number of non-physical parameters.
Specific Markers
The influence of cell apoptosis on TDD was assessed in vivo using the VERDICT model on LS174T colorectal xenografts treated with gemcitabine [16]. The changes in cell size observed in vitro (on the order of 5%) were not found significant with VERDICT, likely the result of insufficient precision on fit estimates. However, significant changes in vascular and intracellular volume fractions were found. These results were found consistent with cell apoptosis, providing for once a specific insight into changes at microstructural level based on diffusion.
The POMACE framework was recently used to measure the in vivo microstructural changes associated with chemotherapeutic therapy on GL261 and 4T1 cell lines [48]. A small ECS decrease (−10%) was measured 2 days after injection. Interestingly, surface–to-volume ratio estimates in the short time regime did not vary significantly following 5FU treatment, likely the result of a simultaneous—but small—increase in cell size that could not be detected with POMACE.
In summary, applying the geometrical models detailed in this review often suffer from a lack of sensitivity to detect and/or reliably quantify the relatively small changes happening at microstructural level. Validation is also impaired by the difficulty of confirming MRI measurements with other imaging modalities. To date, the clear measurement of a specific change in microstructure (f, R, S/V) or medium property (Dics, Decs) following tumor treatment—and fully consistent with histology and/or electron microscopy - has yet to be demonstrated and reported.
Future Developments
Although TDD has demonstrated great potential for non-invasive yet specific cancer characterization, many challenges remain before the technique can be suitable integrated into a clinical setting. Some of the questions the community will need to answer are non-specific to the field of TDD in cancer.
In the short term, future areas of research shall include the integration of permeability into geometrical models of cancer, a cautious assessment of the sensitivity and utility of each processing framework, and proper and successful validation of TDD in cancer using multimodality (MRI/microscopy/fluorescence imaging/Electron Micrography) imaging of the same tissues both ex vivo and in vivo.
Addressing the specificity issue is also of prime importance—here lies the real advantage of performing TDD compared to conventional DWI, and the number of fixed parameters shall be kept to a minimum, potentially by combining TDD with additional measurements in specific extra short/long time regimes.
The added benefit of performing TDD in terms of diagnosis and/or therapeutic follow-up shall be investigated as well. Results from the INNOVATE study will inform further about the potential of TDD in a clinical setting. Time-dependent measurements in muscle and breast are equally promising, as they can easily be performed in the clinic using the hardware (i.e., magnetic field gradients) commercially available today.
The following questions should also be addressed. How can we model healthy tissue so that we can extract meaningful parameters and compare them to those of control regions at individual level? Will TDD ever be applied for human brain cancer mapping in vivo? Can we find an optimal unifying framework to perform TDD?
Conclusion
TDD is slowly emerging as a strong contender for non-invasive tumor characterization. Despite the lack of a general analytical solution, diffusion can be probed in various regimes where systems simplify to extract relevant information about tissue microstructure. If modeling is thought adequate, Equations (1)–(8) describe how to properly model diffusion in both intracellular and extracellular compartments, or in a combined system. When it cannot be neglected, permeability should be accounted for in the short and long time regime using Equations (9) and (10), or within specific models, as seen in muscle studies. To date, preclinical TDD applications include amongst others the characterization of rodent brain gliomas, and murine xenografts of colorectal or ovarian cancer. This approach has indeed proven successful in estimating tumor intra- and extracellular volume fraction and cell size, as well as treatment efficacy. In the clinic, although probing such small restriction scales is practically impossible due to hardware constraints, it is expected that human applications on breast and prostate cancer will strongly benefit the community in terms of non-invasive cancer screening.
Author Contributions
OR: Substantial contributions to the conception or design of the work; acquisition, analysis, or interpretation of data for the work; drafting the work or revising it critically for important intellectual content; final approval of the version to be published; agreement to be accountable for all aspects of the work in ensuring that questions related to the accuracy or integrity of any part of the work are appropriately investigated and resolved.
Conflict of Interest Statement
The author declares that the research was conducted in the absence of any commercial or financial relationships that could be construed as a potential conflict of interest.
Abbreviations
ADC, apparent diffusion coefficient; DWI, diffusion-weighted imaging; ECS, extracellular space; ICS, intracellular space; IMPULSED, imaging microstructural parameters using limited spectrally edited diffusion; OGSE, oscillating gradient spin echo; PGSE, pulsed gradient spin echo; POMACE, pulsed and oscillating gradient MRI for assessment of cell size and extracellular space; RBPM, random barrier permeable model; STEAM, stimulated echo acquisition mode; VERDICT, vascular, extracellular, and restricted diffusion for cytometry in tumors; TDD, time-dependent diffusion.
Acknowledgments
This work was supported by Centre d'Imagerie BioMédicale (CIBM) of the UNIL, UNIGE, HUG, CHUV, EPFL and the Leenaards and Jeantet Foundations. The author would also like to thank Dr. Sungheon G. Kim, Dmitry S. Novikov, and Ileana O. Jelescu for stimulating discussions on the matter.
References
1. Ross BD, Moffat BA, Lawrence TS, Mukherji SK, Gebarski SS, Quint DJ, et al. Evaluation of cancer therapy using diffusion magnetic resonance imaging. Mol Cancer Ther. (2003) 2:581–7.
2. Moffat BA, Chenevert TL, Meyer CR, McKeever PE, Hall DE, Hoff BA, et al. The functional diffusion map: an imaging biomarker for the early prediction of cancer treatment outcome. Neoplasia (2006) 8:259–67. doi: 10.1593/neo.05844
3. Guo AC, Cummings TJ, Dash RC, Provenzale JM. Lymphomas and high-grade astrocytomas: comparison of water diffusibility and histologic characteristics. Radiology (2002) 224:177–83. doi: 10.1148/radiol.2241010637
4. Sugahara T, Korogi Y, Kochi M, Ikushima I, Shigematu Y, Hirai T, et al. Usefulness of diffusion-weighted MRI with echo-planar technique in the evaluation of cellularity in gliomas. J Magn Reson Imaging (1999) 9:53–60. doi: 10.1002/(SICI)1522-2586(199901)9:1<53::AID-JMRI7>3.0.CO;2-2
5. Padhani AR, Liu G, Koh DM, Chenevert TL, Thoeny HC, Takahara T, et al. Diffusion-weighted magnetic resonance imaging as a cancer biomarker: consensus and recommendations. Neoplasia (2009) 11:102–25. doi: 10.1593/neo.81328
6. Basser PJ, Mattiello J, LeBihan D. Estimation of the effective self-diffusion tensor from the NMR spin echo. J Magn Reson Ser. B (1994) 103:247–54. doi: 10.1006/jmrb.1994.1037
7. Jensen JH, Helpern JA. MRI quantification of non-Gaussian water diffusion by kurtosis analysis. NMR Biomed. (2010) 23:698–710. doi: 10.1002/nbm.1518
8. Szczepankiewicz F, van Westen D, Englund E, Westin CF, Ståhlberg F, Lätt J, et al. The link between diffusion MRI and tumor heterogeneity: mapping cell eccentricity and density by diffusional variance decomposition (DIVIDE). Neuroimage (2016) 142:522–32. doi: 10.1016/j.neuroimage.2016.07.038
9. Gore JC, Xu J, Colvin DC, Yankeelov TE, Parsons EC, Does MD. Characterization of tissue structure at varying length scales using temporal diffusion spectroscopy. NMR Biomed. (2010) 23:745–56. doi: 10.1002/nbm.1531
10. Mitra PP, Sen PN, Schwartz LM. Short-time behavior of the diffusion coefficient as a geometrical probe of porous media. Phys Rev B (1993) 47:8565–74. doi: 10.1103/PhysRevB.47.8565
11. Novikov DS, Jensen JH, Helpern JA, Fieremans E. Revealing mesoscopic structural universality with diffusion. Proc Natl Acad Sci USA. (2014) 111:5088–93. doi: 10.1073/pnas.1316944111
12. Murday JS, Cotts RM. Self-diffusion coefficient of liquid lithium. J Chem Phys. (1968) 48:4938–45. doi: 10.1063/1.1668160
13. Xu J, Does MD, Gore JC. Quantitative characterization of tissue microstructure with temporal diffusion spectroscopy. J Magn Reson. (2009a) 200:189–97. doi: 10.1016/j.jmr.2009.06.022
14. Jiang X, Li H, Xie J, Zhao P, Gore JC, Xu J. Quantification of cell size using temporal diffusion spectroscopy. Magn Reson Med. (2016b) 75:1076–85. doi: 10.1002/mrm.25684
15. Reynaud O, Winters KV, Hoang DM, Wadghiri YZ, Novikov DS, Kim SG. Pulsed and oscillating gradient MRI for assessment of cell size and extracellular space (POMACE) in mouse gliomas. NMR Biomed. (2016a) 29:1350–63. doi: 10.1002/nbm.3577
16. Panagiotaki E, Walker-Samuel S, Siow B, Johnson SP, Rajkumar V, Pedley RB, et al. Noninvasive quantification of solid tumor microstructure using VERDICT MRI. Cancer Res. (2014) 74:1902–12. doi: 10.1158/0008-5472.CAN-13-2511
17. Latour LL, Svoboda K, Mitra PP, Sotak CH. Time-dependent diffusion of water in a biological model system. Proc Natl Acad Sci USA. (1994) 91:1229–33. doi: 10.1073/pnas.91.4.1229
18. Reynaud O, Winters KV, Hoang DM, Wadghiri YZ, Novikov DS, Kim SG. Surface-to-volume ratio mapping of tumor microstructure using oscillating gradient diffusion weighted imaging. Magn Reson Med. (2016b) 76:237–47. doi: 10.1002/mrm.25865
19. Sen PN. Time-dependent diffusion coefficient as a probe of geometry. Concepts Magn Reson Part A Bridg Educ Res. (2004a) 23:1–21. doi: 10.1002/cmr.a.20017
20. Novikov DS, Fieremans E, Jensen JH, Helpern JA. Random walk with barriers. Nat Phys. (2011) 7:508–14. doi: 10.1038/nphys1936
21. Novikov DS, Kiselev VG. Surface-to-volume ratio with oscillating gradients. J Magn Reson. (2011) 210:141–5. doi: 10.1016/j.jmr.2011.02.011
22. Sukstanskii AL. Exact analytical results for ADC with oscillating diffusion sensitizing gradients. J Magn Reson. (2013) 234:135–40. doi: 10.1016/j.jmr.2013.06.016
23. Fordham EJ, Gibbs SJ, Hall LD. Partially restricted diffusion in a permeable sandstone: observations by stimulated echo PFG NMR. Magn Reson Imaging (1994) 12:279–84. doi: 10.1016/0730-725X(94)91536-9
24. Hürlimann MD, Helmer KG, Latour LL, Sotak CH. Restricted diffusion in sedimentary rocks. Determination of surface-area-to-volume ratio and surface relaxivity. J Magn Reson Ser A. (1994) 111:169–78. doi: 10.1006/jmra.1994.1243
25. Latour LL, Mitra PP, Kleinberg RL, Sotak CH. Time-dependent diffusion coefficient of fluids in porous media as a probe of surface-to-volume ratio. J Magn Reson Ser A (1993) 101:342–46. doi: 10.1006/jmra.1993.1056
26. Schachter M, Does M, Anderson A, Gore J. Measurements of restricted diffusion using an oscillating gradient spin-echo sequence. J Magn Reson. (2000) 147:232–7. doi: 10.1006/jmre.2000.2203
27. Parsons EC, Does MD, Gore JC. Temporal diffusion spectroscopy: theory and implementation in restricted systems using oscillating gradients. Magn Reson Med. (2006) 55:75–84. doi: 10.1002/mrm.20732
28. Portnoy S, Flint JJ, Blackband SJ, Stanisz GJ. Oscillating and pulsed gradient diffusion magnetic resonance microscopy over an extended b-value range: implications for the characterization of tissue microstructure. Magn Reson Med. (2013) 69:1131–45. doi: 10.1002/mrm.24325
29. Ferizi U, Schneider T, Witzel T, Wald LL, Zhang H, Wheeler-Kingshott CAM, et al. White matter compartment models for in vivo diffusion MRI at 300mT/m. Neuroimage (2015) 118:468–83. doi: 10.1016/j.neuroimage.2015.06.027
30. Panagiotaki E, Schneider T, Siow B, Hall MG, Lythgoe MF, Alexander DC. Compartment models of the diffusion MR signal in brain white matter: a taxonomy and comparison. Neuroimage (2012) 59:2241–54. doi: 10.1016/j.neuroimage.2011.09.081
31. Novikov DS, Kiselev VG. Effective medium theory of a diffusion-weighted signal. NMR Biomed. (2010) 23:682–97. doi: 10.1002/nbm.1584
32. deSwiet TM, Sen PN. Time dependent diffusion coefficient in a disordered medium. J Chem Phys. (1996) 104:206–9. doi: 10.1063/1.470890
33. Van AT, Holdsworth SJ, Bammer R. In vivo investigation of restricted diffusion in the human brain with optimized oscillating diffusion gradient encoding. Magn Reson Med (2014) 71:83–94. doi: 10.1002/mrm.24632
34. Aggarwal M, Jones MV, Calabresi PA, Mori S, Zhang J. Probing mouse brain microstructure using oscillating gradient diffusion MRI. Magn Reson Med. (2012) 67:98–109. doi: 10.1002/mrm.22981
35. Jiang X, Li H, Zhao P, Xie J, Khabele D, Xu J, et al. Early detection of treatment-induced mitotic arrest using temporal diffusion magnetic resonance spectroscopy. Neoplasia (2016c) 18:387–97. doi: 10.1016/j.neo.2016.04.006
36. Bender C, Orszag S. Advanced Mathematical Methods for Scientists and Engineers: Asymptotic Methods and Perturbation Theory. (1999) Springer.
37. Mair RW, Sen PN, Hürlimann MD, Patz S, Cory DG, Walsworth RL. The narrow pulse approximation and long length scale determination in xenon gas diffusion NMR studies of model porous media. J Magn Reson. (2002) 156:202–12. doi: 10.1006/jmre.2002.2540
38. Kiselev VG. Fundamentals of diffusion MRI physics. NMR Biomed. (2017) 30:e3602. doi: 10.1002/nbm.3602
39. Lee HH, Burcaw LM, Veraart J, Fieremans E, Novikov DS. Low-pass filter effect of finite gradient duration on time-dependent diffusion in the human brain. in Proceedings of International Society for Magnetic Resonance in Medicine, Vol. 23. Toronto (2015). p. 2777.
40. Fieremans E, Burcaw LM, Lee HH, Lemberskiy G, Veraart J, Novikov DS. In vivo observation and biophysical interpretation of time-dependent diffusion in human white matter. Neuroimage (2016) 129:414–27. doi: 10.1016/j.neuroimage.2016.01.018
41. Tanner JE, Stejskal EO. Restricted self-diffusion of protons in colloidal systems by the pulsed-gradient, spin-echo method. J Chem Phys. (1968) 49:1768–77. doi: 10.1063/1.1670306
42. Xu J, Does MD, Gore JC. Sensitivity of MR diffusion measurements to variations in intracellular structure: effects of nuclear size. Magn Reson Med. (2009b) 61:828–33. doi: 10.1002/mrm.21793
43. Xu J, Li H, Harkins KD, Jiang X, Xie J, Kang H, et al. Mapping mean axon diameter and axonal volume fraction by MRI using temporal diffusion spectroscopy. Neuroimage (2014) 103:10–9. doi: 10.1016/j.neuroimage.2014.09.006
44. Li H, Gore JC, Xu J. Fast and robust measurement of microstructural dimensions using temporal diffusion spectroscopy. J Magn Reson. (2014) 242:4–9. doi: 10.1016/j.jmr.2014.02.007
45. Hope TR, White NS, Kuperman J, Chao Y, Yamin G, Bartch H, et al. Demonstration of non-gaussian restricted diffusion in tumor cells using diffusion time-dependent diffusion-weighted magnetic resonance imaging contrast. Front. Oncol. (2016). 6:179. doi: 10.3389/fonc.2016.00179
46. Jiang X, Li H, Xie J, McKinley ET, Zhao P, Gore JC, et al. In vivo imaging of cancer cell size and cellularity using temporal diffusion spectroscopy. Magn. Reson. Med. (2016a) 78:156–64. doi: 10.1002/mrm.26356
47. Hoang DM, Voura EB, Zhang C, Fakri-Bouchet L, Wadghiri YZ. Evaluation of coils for imaging histological slides: signal-to-noise ratio and filling factor. Magn Reson Med. (2014) 71:1932–43. doi: 10.1002/mrm.24841
48. Reynaud O, Zhang J, Winters KV, Novikov DS, Kim SG. Time-dependent diffusion for assessment of treatment response in GL261 murine glioma model. In: Proceedings of International Society for Magnetic Resonance in Medicine. (Singapore) (2016c). p. 1229.
49. Panagiotaki E, Chan RW, Dikaios N, Ahmed HU, O'Callaghan J, Freeman A, et al. Microstructural characterization of normal and malignant human prostate tissue with vascular, extracellular, and restricted diffusion for cytometry in tumours magnetic resonance imaging. Invest. Radiol. (2015) 50:218–27. doi: 10.1097/RLI.0000000000000115
50. Johnston E, Pye H, Bonet-Carne E, Panagiotaki E, Patel D, Galazi M, et al. INNOVATE: a prospective cohort study combining serum and urinary biomarkers with novel diffusion-weighted magnetic resonance imaging for the prediction and characterization of prostate cancer. BMC Cancer (2016) 16:816. doi: 10.1186/s12885-016-2856-2
51. Xu J, Li K, Smith RA, Waterton JC, Zhao P, Chen H, et al. Characterizing tumor response to chemotherapy at various length scales using temporal diffusion spectroscopy. PLoS ONE (2012) 7:e41714. doi: 10.1371/journal.pone.0041714
52. Moroz MA, Kochetkov T, Cai S, Wu J, Shamis M, Nair J, et al. Imaging colon cancer response following treatment with AZD1152: a preclinical analysis of [18F]fluoro-2-deoxyglucose and 3???-deoxy-3???-[18F]fluorothymidine imaging. Clin Cancer Res. (2011). 17:1099–10. doi: 10.1158/1078-0432.CCR-10-1430
53. Li H, Jiang X, Wang F, Xu J, Gore JC. Structural information revealed by the dispersion of ADC with frequency. Magn Reson Imaging. (2015a) 33:1083–90. doi: 10.1016/j.mri.2015.06.009
54. Teruel JR, Cho GY, Moccaldi RTM, Goa PE, Bathen TF, Feiweier T, et al. Stimulated echo diffusion tensor imaging (STEAM-DTI) with varying diffusion times as a probe of breast tissue. J Magn Reson Imaging (2017) 45:84–93. doi: 10.1002/jmri.25376
55. Marschar AM, Kuder TA, Stieltjes B, Nagel AM, Bachert P, Laun FB. In vivo imaging of the time-dependent apparent diffusional kurtosis in the human calf muscle. J Magn Reson Imaging (2015) 41:1581–90. doi: 10.1002/jmri.24743
56. Sigmund EE, Novikov DS, Sui D, Ukpebor O, Baete S, Babb JS, et al. Time-dependent diffusion in skeletal muscle with the random permeable barrier model (RPBM): application to normal controls and chronic exertional compartment syndrome patients. NMR Biomed. (2014) 27:519–28. doi: 10.1002/nbm.3087
57. Liang S, Panagiotaki E, Bongers A, Shi P, Sved P, Watson G, et al. Information-based ranking of 10 compartment models of diffusion-weighted signal attenuation in fixed prostate tissue. NMR Biomed. (2016) 29:660–71. doi: 10.1002/nbm.3510
58. Sen PN. Erratum: Time-dependent diffusion coefficient as a probe of permeability of the pore wall (Journal of Chemical Physics (2003) 119 (9871)). J. Chem. Phys. (2004b) 119:9871–76. doi: 10.1063/1.1756575
59. Benga G, Pop VI, Popescu O, Borza V On measuring the diffusional water permeability of human red blood cells and ghosts by nuclear magnetic resonance. J Biochem Biophys Methods (1990) 21:87–102. doi: 10.1016/0165-022X(90)90057-J
60. Benga G, Borza T. Diffusional water permeability of mammalian red blood cells. Comp Biochem Physiol- B Biochem. (1995) 112:653–9. doi: 10.1016/0305-0491(95)00116-6
61. Tanner JE. Transient diffusion in a system partitioned by permeable barriers. Application to NMR measurements with a pulsed field gradient. J Chem Phys. (1978) 69:1748–54. doi: 10.1063/1.436751
62. Suh K-J, Hong Y-S, Skirda VD, Volkov VI, Lee C-YJ, Lee C-H. Water self-diffusion behavior in yeast cells studied by pulsed field gradient NMR. Biophys Chem. (2003) 104:121–30. doi: 10.1016/S0301-4622(02)00361-7
63. Li H, Jiang X, Xie J, McIntyre JO, Gore JC, Xu J. Time-dependent influence of cell membrane permeability on MR diffusion measurements. Magn. Reson. Med. (2015b) 75:1927–34. doi: 10.1002/mrm.25724
64. Li H, Jiang X, Xie J, Gore JC, Xu J. Impact of transcytolemmal water exchange on estimates of tissue microstructural properties derived from diffusion MRI. Magn. Reson. Med. (2016) 77:2239–49. doi: 10.1002/mrm.26309
65. Meier C, Dreher W, Leibfritz D. Diffusion in compartmental systems. II. Diffusion-weighted measurements of rat brain tissue in vivo and postmortem at very large b-values. Magn. Reson. Med. (2003) 50:510–4. doi: 10.1002/mrm.10558
66. Pfeuffer J, Bröer S, Bröer A, Lechte M, Flögel U, Leibfritz D. Expression of aquaporins in Xenopus laevis oocytes and glial cells as detected by diffusion-weighted 1H NMR spectroscopy and photometric swelling assay. Biochim Biophys Acta Mol Cell Res. (1998) 1448:27–36. doi: 10.1016/S0167-4889(98)00111-6
67. Quirk JD, Bretthorst GL, Duong TQ, Snyder AZ, Springer CS, Ackerman JJH, et al. Equilibrium water exchange between the intra- and extracellular spaces of mammalian brain. Magn Reson Med. (2003) 50:493–9. doi: 10.1002/mrm.10565
68. Fieremans E, Lemberskiy G, Veraart J, Sigmund EE, Gyftopoulos S, Novikov DS. In vivo measurement of membrane permeability and myofiber size in human muscle using time-dependent diffusion tensor imaging and the random permeable barrier model. NMR Biomed. (2017) 30:e3612. doi: 10.1002/nbm.3612
69. Lasic S, Nilsson M, Lätt J, Stahlberg F, Topgaard D. Apparent exchange rate mapping with diffusion MRI. Magn Reson Med. (2011) 66:356–65. doi: 10.1002/mrm.22782
70. Nilsson M, Lätt J, Van Westen D, Brockstedt S, Lasič S, Ståhlberg F, et al. Noninvasive mapping of water diffusional exchange in the human brain using filter-exchange imaging. Magn Reson Med. (2013) 69:1573–81. doi: 10.1002/mrm.24395
71. Lampinen B, Szczepankiewicz F, van Westen D, Englund E, Sundgren PC, Latt J, et al. Optimal experimental design for filter exchange imaging: apparent exchange rate measurements in the healthy brain and in intracranial tumors. Magn. Reson. Med. (2017) 77:1104–14. doi: 10.1002/mrm.26641
72. Lasič S, Oredsson S, Partridge SC, Saal LH, Topgaard D, Nilsson M, et al. Apparent exchange rate for breast cancer characterization. NMR Biomed. (2016) 29:631–9. doi: 10.1002/nbm.3504
73. Le Bihan D, Breton E, Lallemand D, Grenier P, Cabanis E, Laval_Jeantet M. MR imaging of intravoxel incoherent motions: application to diffusion and perfusion in neurologic disorders. Radiology (1986) 161:401–7. doi: 10.1148/radiology.161.2.3763909
74. Nilsson M, Lasič S, Drobnjak I, Topgaard D, Westin C-F. Resolution limit of cylinder diameter estimation by diffusion MRI: the impact of gradient waveform and orientation dispersion. NMR Biomed. (2017) 30:e3711. doi: 10.1002/nbm.3711
75. Colvin DC, Loveless ME, Does MD, Yue Z, Yankeelov TE, Gore JC. Earlier detection of tumor treatment response using magnetic resonance diffusion imaging with oscillating gradients. Magn. Reson. Imaging (2011) 29:315–23. doi: 10.1016/j.mri.2010.10.003
76. Colvin DC, Yankeelov TE, Does MD, Yue Z, Quarles C, Gore JC. New insights into tumor microstructure using temporal diffusion spectroscopy. Cancer Res. (2008) 68:5941–7. doi: 10.1158/0008-5472.CAN-08-0832
77. Bourne R, Panagiotaki E. Limitations and prospects for diffusion-weighted MRI of the prostate. Diagnostics (2016) 6:21. doi: 10.3390/diagnostics6020021
78. Lemberskiy G, Rosenkrantz AB, Veraart J, Taneja SS, Novikov DS, Fieremans E. Time-dependent diffusion in prostate cancer. Invest. Radiol. (2017) 52:405–11. doi: 10.1097/RLI.0000000000000356
Keywords: diffusion, diffusion magnetic resonance imaging, temporal diffusion spectroscopy, diffusion time dependence, diffusion time, PGSE, OGSE, MRI of cancer
Citation: Reynaud O (2017) Time-Dependent Diffusion MRI in Cancer: Tissue Modeling and Applications. Front. Phys. 5:58. doi: 10.3389/fphy.2017.00058
Received: 19 July 2017; Accepted: 31 October 2017;
Published: 15 November 2017.
Edited by:
Julien Valette, Commissariat à l'Energie Atomique et aux Energies Alternatives (CEA), FranceReviewed by:
Henrik Lundell, Danish Research Centre for Magnetic Resonance (DRCMR), DenmarkMarkus Nilsson, Lund University, Sweden
Copyright © 2017 Reynaud. This is an open-access article distributed under the terms of the Creative Commons Attribution License (CC BY). The use, distribution or reproduction in other forums is permitted, provided the original author(s) or licensor are credited and that the original publication in this journal is cited, in accordance with accepted academic practice. No use, distribution or reproduction is permitted which does not comply with these terms.
*Correspondence: Olivier Reynaud, oli.reynaud@gmail.com