Dynamic Microsimulation Model of Impoverishment Among Elderly Women in Japan
 Seiichi Inagaki
- Education Center, International University of Health and Welfare, Otawara, Japan
The increasing poverty rate for elderly women is a growing concern in Japan and is generally due to their lifestyle changes and the public pension system based on the pre-1980s (old) lifestyle. At that time, women were expected to get married and become homemakers. Therefore, the public pension system is generous for married women and widows but not for never-married and divorced women. Using a dynamic microsimulation model, the Integrated Analytical Model for Household Simulation (INAHSIM), previous research has shown that poverty rates for elderly people will increase significantly in the future due to changes in nuptiality behavior after the 1980s. However, this approach is an indirect method, and the mechanism of impoverishment remains unclear. This study uses the same dynamic microsimulation model but attempts a more direct approach to interpret the effects of these behavioral changes on poverty rates for elderly women. Specifically, under the baseline scenario, it makes future projections on key distributions related to poverty by marital status and illustrates how they will face the poverty problem. It shows the future projections of (1) the distribution of pension amounts by gender and marital status, (2) poverty rates for elderly women by marital status, and (3) poverty rates for elderly people by gender. After the 1980s in Japan, the marriage rate decreased and the divorce rate increased significantly. Nevertheless, society still suffers from wage inequality between men and women. As a result, the number of never-married or divorced women will increase and these women will receive poor pension benefits due to an unfavorable public pension system. In addition, they have a higher risk of living in a single-person household because they have no or very few children. In the end, they will face the risk of poverty and raise the overall poverty rate.
Introduction
The increasing poverty rate for elderly women1 is a growing concern in Japan and is generally due to lifestyle changes and an inadequate public pension system for those women. Using a dynamic microsimulation model for Japan, the Integrated Analytical Model for Household Simulation (INAHSIM), Inagaki [1] projected that poverty rates by gender for elderly people will increase significantly in the future and showed that changes in nuptiality behaviors after the 1980s will affect poverty rates for elderly women but not for elderly men.
His approach was an indirect method. He assumed alternative scenarios in which nuptiality behaviors return to those before the 1980s and compared future trends in poverty rates by gender with those of the baseline scenario2. The simulation results indicated that if nuptiality behaviors return to the 1980s scenario in the future, then the poverty rate for women will be much lower than that for the baseline scenario while that for men will not change. Based on these simulation results, he concluded that behavioral changes will raise the poverty rates for elderly women in the future.
Normally, it should show what would happen in the poverty rates in the future if nuptiality behaviors had not changed after the 1980s. However, the initial population used in the INAHSIM is the population in 2004, and it is difficult to simulate the population backward. In other words, it is difficult to simulate the population using the assumption that nuptiality behaviors from 1980 to 2004 were the same as those in the 1970s. Therefore, he took an indirect approach.
This study uses the same dynamic microsimulation model but attempts a more direct approach to interpret the effects of these behavioral changes on poverty rates in elderly women. Specifically, under the baseline scenario, it makes future projections of (1) the distribution of pension amounts by gender and marital status, (2) poverty rates for elderly women by marital status, and (3) poverty rates for elderly people by gender. Then, it clarifies the mechanism of their impoverishment based on these results. Marital status is the key to understanding the impoverishment of elderly women.
The rest of this paper proceeds as follows. Section Public Pension System in Japan illustrates the public pension system in Japan. Section Method outlines the dynamic microsimulation model used to estimate poverty rates and related indicators for elderly women in the future by their marital status. Section Results presents the results of the future estimates and discusses why elderly women will be impoverished. Section Conclusion concludes3.
Public Pension System in Japan
Japan achieved dramatic economic growth from 1954 to 1973. At that time, people's lifestyles were uniform, and families were often referred to as “post-war families.” The various kinds of social systems in Japan today developed during this period of high economic growth. These systems were established based on standard households and the division of gender roles. The public pension system is one of those systems.
Gender roles were as follows: (1) most women resigned from their jobs during their twenties; (2) women got married, had children, and took care of their families as homemakers; and (3) women were generally employed to do simple clerical work, with restrictions on their advancement. Therefore, the social systems, including the public pension system, are very generous for homemakers.
Japan's public pension scheme, depicted in Figure 1, is a two-tier system that consists of a flat-rate benefit called the basic pension and an earnings-related pension for regular employees (Category 2 subscribers). Category 2 subscribers receive both the basic pension and earnings-related pension, whereas subscribers to Categories 1 and 3 receive only the basic pension. Category 1 subscribers include self-employed workers, non-regular employees, and the unemployed. Category 2 subscribers include regular employees. Category 3 subscribers include the dependent spouses of Category 2 subscribers.
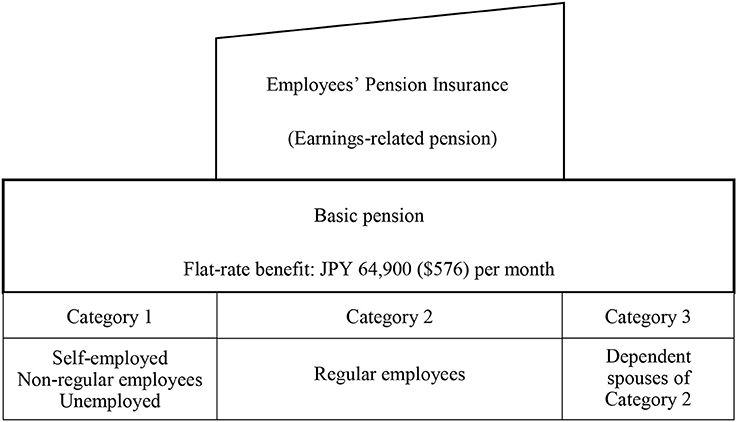
Figure 1. Public pension scheme in Japan. Source: Inagaki [2]. The amount of pension benefit is recalculated pursuant to the National Pension Act.
Table 1 summarizes the contributions and benefits by category in 2017. Category 1 subscribers pay a monthly contribution of JPY16,490 ($146)4 in exchange for receiving a basic pension of JPY64,900 ($576). However, if they do not pay their contributions for any period, their basic pensions are reduced according to the length of the non-payment period.
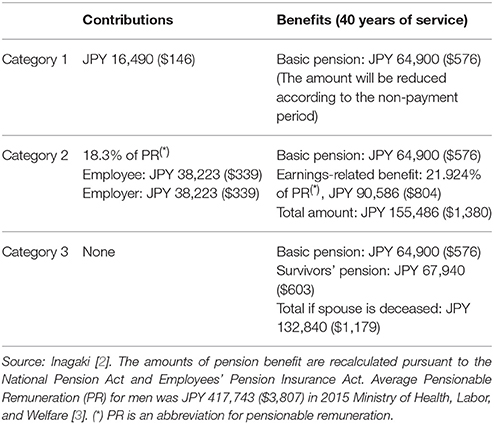
Table 1. Contributions and benefits (per month).
The basic pension contributions for Category 2 subscribers are included in the insured person's contribution to the Employees' Pension Insurance (EPI). The 2017 contribution is 18.3% of a Category 2 subscriber's pensionable remuneration, for which the employer and employed are liable in equal amounts. The average monthly employee contribution is JPY38,223 ($339) in exchange for receiving pension benefits totaling JPY155,486 ($1,380). Employers deduct employees' contributions from their salaries and pay those contributions to the insurers. Therefore, the problem of the reduction of pension benefits due to non-payment, as in the case of Category 1 subscribers, does not exist.
Category 3 subscribers do not have to contribute to the basic pension, but they are deemed to have paid their contributions; thus, they are entitled to full basic pensions. In addition, if their spouse dies, they will be entitled to the survivors' pension, which amounts to three-quarters of the spouse's earnings-related pension benefit. The total amount of the basic pension and survivors' pension is JPY132,840 ($1,179) on average.
As illustrated above, the public pension system is particularly generous toward dependent spouses (mainly homemakers) and widows/widowers. From the viewpoint of the public pension system, men and women are treated equally. However, the division of gender roles remains, and wage inequality between men and women still exists. Consequently, there exists inequality in pension benefits between men and women because the wage inequality leads to inequality in pension benefits.
Table 2 shows the difference in employment by gender. The percentages of regular employees are 72.9% for men and 44.0% for women. Category 2 subscribers receive the earnings-related pension and the basic pension, whereas Category 1 subscribers receive only the basic pension (at most, JPY64,900 [$146] per month). The basic pension for Category 1 subscribers may be reduced according to the non-payment period. In addition, a significant difference exists in the pensionable remuneration (PR) that affects the earnings-related pension. The average PR for men is JPY417,743 ($3,807) while the average PR for women is JPY273,645 ($2,429). As a result, it is anticipated that women who are never married or divorced will suffer from low pension benefits. Married women or widows will not face this problem because married women will live with their husbands and share their pension benefits and widows will receive survivor pension benefits.
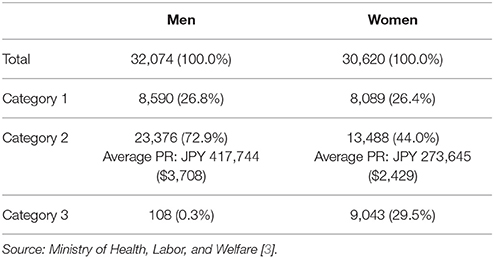
Table 2. Numbers of subscribers by gender and category (in thousands).
Currently, elderly people enjoy their pension benefits because they are married and seldom get divorced. Their lifestyle in their working-age was the “post-war family” that the current pension system supposes. On the contrary, future elderly people or current working-age people's lifestyles are diversified. If their lifestyle is the “post-war family,” they can receive an adequate amount of pension benefits. If not, they may be unable to receive an adequate amount of pension benefits.
Sustainability and adequacy are important points for a pension system. Because Japan is a super-aging society, a discussion on the public pension system focuses mainly on its sustainability. The discussion on its adequacy is paid less attention and is focused on post-war families only. According to the reported 2009 actuarial valuation [4], the current pension system ensured a replacement rate of 50% at the age of 65, newly awarded the pension, for a specific single-income couple5 covered by the EPI.
Methods
The method used in this study is the INAHSIM dynamic microsimulation model. The INAHSIM was originally developed in the early 1980s as a household simulation model tailored to Japanese society [5]. The first version was a tool for household simulation that only incorporated demography and household changes after demographic events. It continues to be upgraded, and the current version of INAHSIM 3.8 is a comprehensive model for Japanese society. As illustrated in Figure 2, it can simulate not only individual incomes but also living arrangements with one's family.
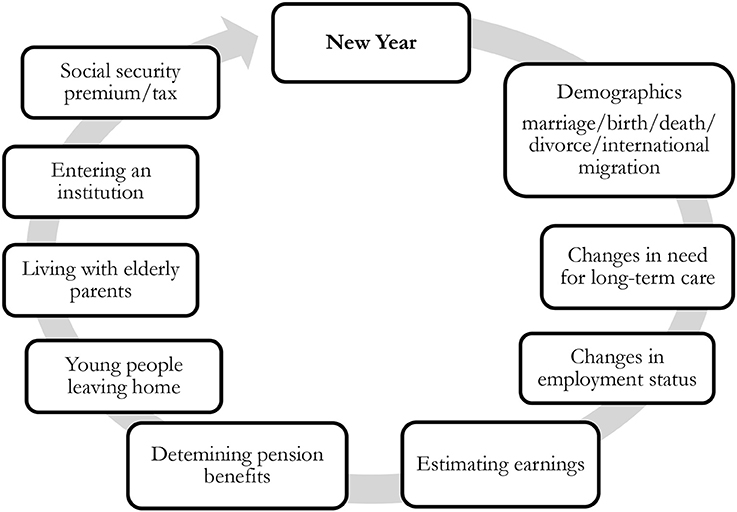
Figure 2. INAHSIM simulation cycle. Source: Inagaki [2].
The first version of INAHSIM includes only three elements—“demography,” “young people leaving home,” and “living with elderly parents.” However, these are both necessary and sufficient for simulation for families and households in Japan.
“Demography” includes not only demographic events but also household changes following demographic events such as (1) Newborn babies adding to their mother's households; (2) Couples deciding to live with the groom's or the bride's parents or starting a new household, after marriage; (3) the divorced husband or wife deciding to return to his/her parents' household or form a new household, in the event of a divorce and once custody is settled.
The transition probabilities in the first version of the model were based on people's behavior in the early 1980s. Those of the current version are determined based on people's behaviors in the early 2,000s.
Regarding household changes (2), the probabilities used in the first version were 58% that the couple lives with the groom's parents, 25% that they live with the bride's parents, and 17% that they form a new household. In contrast, those used in the current version are 20, 5, and 75%, respectively. One sees that the probability that the couple forms a new household has increased dramatically.
Regarding custody, the first version assumes that 69% of wives obtain custody rights. The corresponding figure in the current version is 80%. Regarding household changes (3), the first version assumes that 50% of divorced wives return to their parents' household, and 50% of divorced husbands return to their parents' household. The corresponding figures for the current version are 35 and 43%, respectively.
Although, overall, the marriage rates have decreased significantly, it is difficult to compare the two versions. This is because marriage rates in the current version are controlled by employment status, in addition to age and sex. Again, although divorce rates have increased significantly, it is difficult to compare the two versions. This is because divorce rates in the current version are controlled by whether the couple has dependent children.
“Young people leaving home” refers to young people leaving their parents' households for higher education, to find employment, or to change jobs. The probability of unmarried men aged 20–24 leaving home in the first version is about 4%. Although this is lower in the current version, it is difficult to compare with the first version because the probabilities are controlled by employment status in the current version6.
“Living with elderly parents” refers to those situations in which children move in with their elderly parents to take care of them. This is an important event to secure the life of the elderly in Japan. These probabilities in the first version are 10% for those aged 70 and over. In contrast, those in the current version are controlled by age and sex, and are 1.5–20.7% for those aged 65 and over.
The current version adds “Changes in the need for long-term care,” “Changes in employment status,” “Estimating earnings,” “Determining pension benefits,” “Entering an institution,” and “Social security premium/tax”7. These new elements help estimate the poverty rates for elderly people.
In Japan, there are few dynamic microsimulation models other than INAHSIM. Shiraishi [6] developed a model for pension benefits, and Koshio [7] developed one for long-term care needs. However, their models simulate pension benefits or long-term care needs at a personal level, not a family or household level.
Studies that use INAHSIM are also few. The initial population of INAHSIM is based on micro data of the Comprehensive Survey of Living Conditions (CSLC) conducted by the Ministry of Health, Labor, and Welfare. However, the use of micro data from government surveys is very restricted, and only a few studies can use them. In addition, the computer program of INAHSIM8 is too complicated for the average researcher. Only Fukawa [8] estimated health and long-term expenditure using INAHSIM. Although he revised the second version of INAHSIM for simulations without using micro data of the CSLC [9], this is also not used extensively.
The poverty rate is the ratio of the number of people whose income falls below the poverty line. One-half of the median household income of the total population is typically used as the poverty line. This household income is adjusted by household size; specifically, the household income is divided by the square root of the household size. However, a minimum standard of living varies in household composition. For example, the minimum standard of living differs between elderly couple households and single-mother families. Livelihood assistance is determined based on household size; the composition of the household, e.g., ages and characteristics of members; and place of residence. Therefore, this study uses livelihood assistance as the poverty line to evaluate poverty more properly. The amounts of the livelihood assistance in 2012 for some specified households in Japan are shown in Table 3.
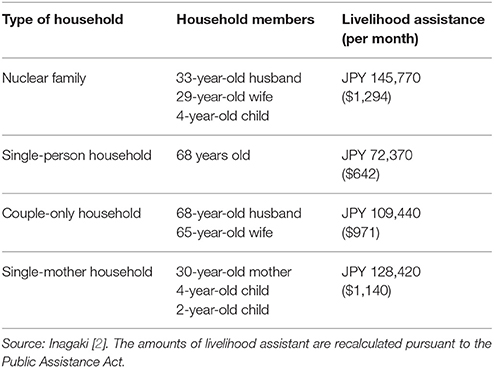
Table 3. Amounts of livelihood assistance (2012).
To analyze poverty, it is necessary to simulate not only individual incomes but also living arrangements with one's family to measure the poverty rate. In other words, it is necessary to simulate people's life events, such as demographic events (e.g., birth, death, marriage, divorce, and international migration), employment status, earnings, and pension amounts simultaneously and individually. INAHSIM is a suitable tool for this kind of simulation.
Individual incomes, household income, and living arrangements are necessary to evaluate poverty rates. The life events of changes in employment status, estimating earnings, determining pensions, and social security premium affect people's incomes. Demographic changes, such as young people leaving home and residing in an institution, affect people's living arrangements. In addition, there are many mutual interactions among life events, e.g., employment status affects household changes and the number of children affects demographic events. INAHSIM incorporates these mutual interactions. Inagaki [1, 10–12] summarized these life events and transition probabilities considering those interactions.
The initial population is prepared using micro data from the 2004 Comprehensive Survey of Living Conditions (CSLC)9 conducted by the Ministry of Health, Labor, and Welfare. As in the previous studies, the initial population includes 126,570 household members in 49,307 private households and 1,212 elderly people in institutional households. The initial population reflects Japan's society on a 1/1,000 scale. All results take an average of 100 simulation runs, and the stochastic errors can be small. Inagaki [11] estimated the stochastic error as derived from the Monte Carlo method, and pointed out that the standard error rates for the number of elderly people is only 0.2%. In other words, its 95% confidence interval is about plus minus 0.4%10.
Results
Distribution of Public Pension Amounts by Gender and Marital Status
Figure 3 compares the distribution of pension amounts in 2012 between men and women. There are two peaks of 0.75–0.99 and 1.75–1.99 million yen for men. For elderly men, Category 1 subscribers comprise the first peak and Category 2 subscribers form the second peak.
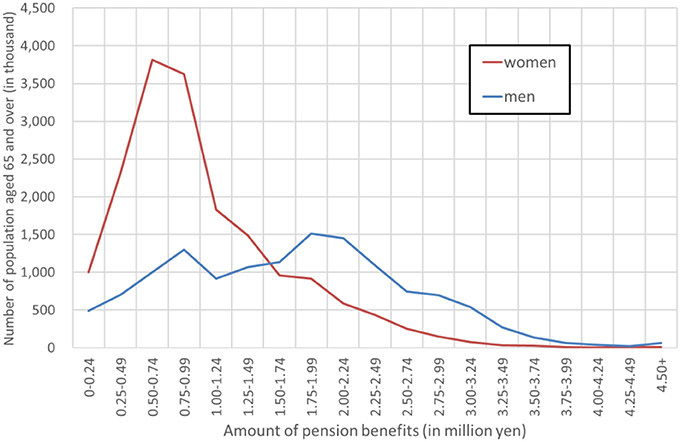
Figure 3. Distribution of pension amounts by gender (2012). Simulation results.
On the other hand, there is one peak only of 0.50–0.74 million yen for women. The peak is formed by elderly women in Categories 1 or 3. The second peak is not formed because the percentage of Category 2 subscribers for women is much lower than that for men. In addition, women do not continue to work over lengthy periods and their wages are relatively low. As a result, the women's earnings-related pensions are not high enough to form a peak.
Figure 4 compares the distribution of pension amounts in 2030 between men and women. The shape of the distributions is similar to those in 2012. However, the distributions will shift to the left because an automatic pension amount reduction system is incorporated to ensure the sustainability of the public pension system. This reduction system, called the “macroeconomic slide system,” reduces about 1% of the pension benefits every year until the financial equilibrium is achieved. According to the 2009 actuarial valuation, the reduction will last until 2038.
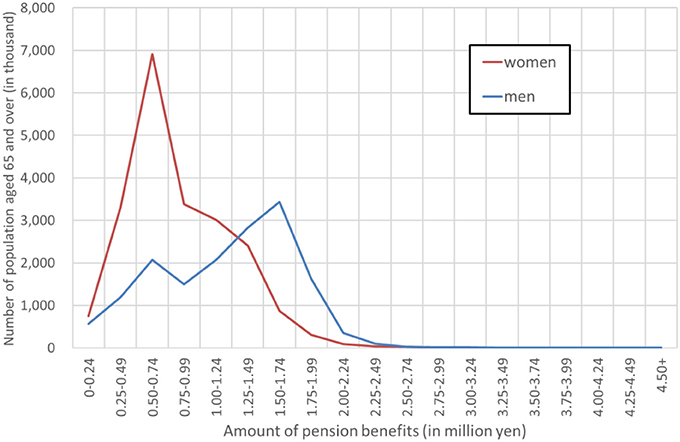
Figure 4. Distribution of pension amounts by gender (2030). Simulation results.
Figure 5 shows the trends in the quartiles of pension amounts by gender. The median of women's pension amounts will be lower than the first quartile of men's. The median will be 0.7 million yen, and the first quartile will be 0.5 million yen. These are only 15 or 11% of average disposable wages for men. This means most elderly women may be unable to live alone.
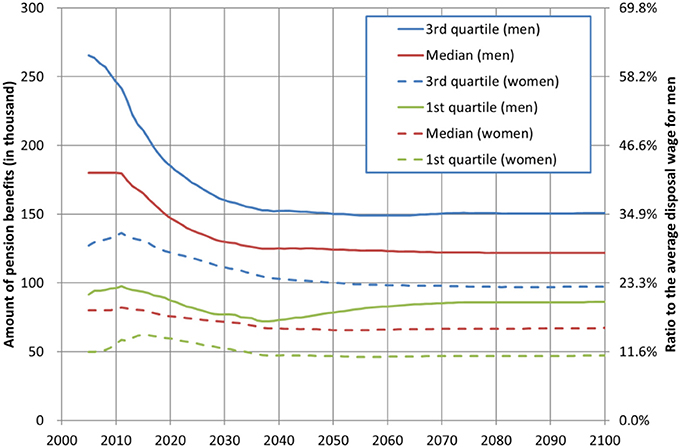
Figure 5. Trends in quartiles of pension amounts by gender. Simulation results.
Figure 6 shows the trends in the first quartiles of pension amounts for women by marital status. Married women usually live with their husbands; thus, the first quartile is calculated using half of couples' pension amounts. A significant difference exists in the pension amounts among marital statuses. Married women and widows will receive a higher amount of pension benefits than never-married and divorced women.
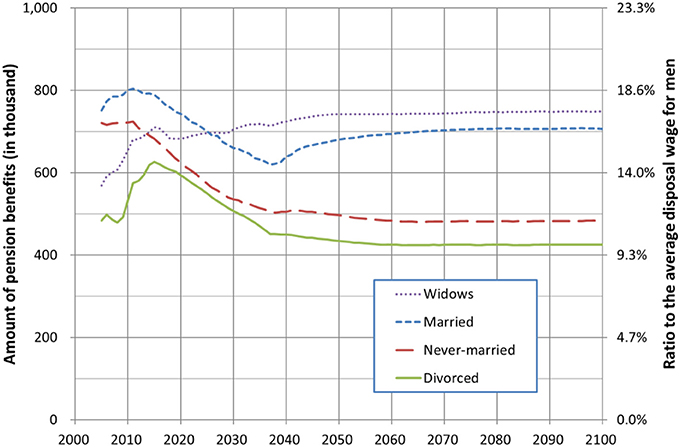
Figure 6. Trends in first quartiles of pension amounts for women by marital status. Simulation results.
Poverty Rates for Elderly Women by Marital Status
In addition to their lower amounts of pension benefits, never-married or divorced women will have a higher risk of living in a single-person household. After the death of their parents, they will be more likely to live alone because they have no or very few children.
Figure 7 shows the trends in the percentages of single-person households (including institutional households) for elderly women by marital status. Never-married women will be most likely to live in a single-person household, and divorced women will be the second most likely after they reach old age. There will be a small difference in the percentage between divorced women and widows, but most widows will receive survivors' pension benefits while divorced women will receive only their own pension benefits.
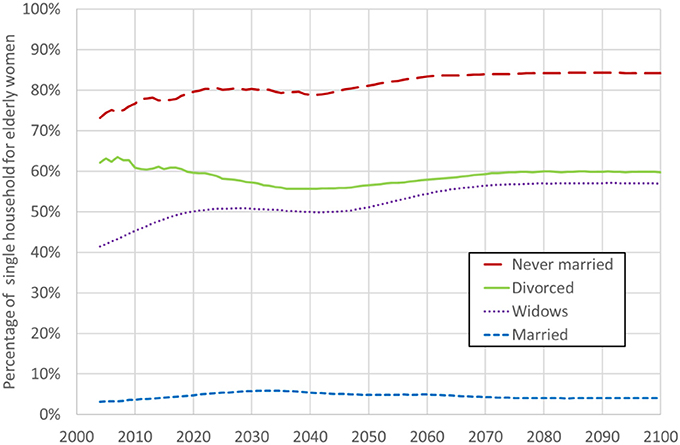
Figure 7. Trends in percentages of single-person households for elderly women by marital status. Simulation results.
In simpler terms, never-married and divorced women will receive lower pension benefits and will be more likely to live in single-person households than married women and widows. As a result, never-married and divorced women are more likely to live in poverty when they reach old age. Figure 8 shows the trends in poverty rates for elderly women by marital status. As anticipated, their poverty rates will reach around 50% in the future.
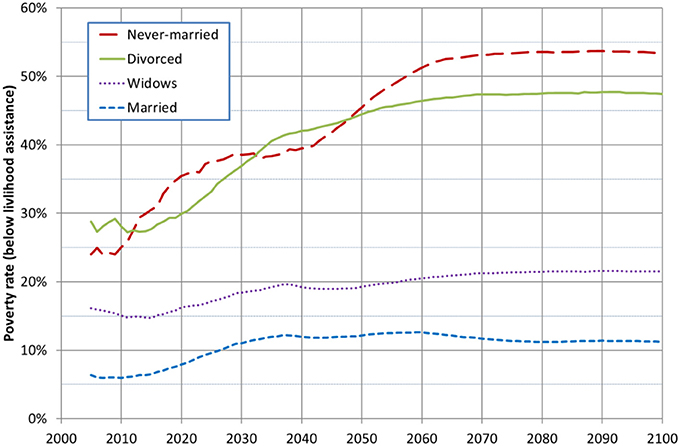
Figure 8. Trends in poverty rates of elderly women by marital status. Simulation results.
Poverty Rates for Elderly People by Gender
There are significant differences in poverty rates among elderly women by marital status. However, if the percentage of never-married and divorced women is small, then the poverty rate for elderly people will not be high. According to the Population Census 2010, the percentages of never-married and divorced women among elderly women were only 4.0 and 4.7%, respectively. Therefore, the poverty rates for elderly people in 2010 were 6.1% for men and 11.1% for women. The poverty problem is not serious currently.
As Inagaki [1] estimated, the percentages of never-married and divorced women among elderly women will increase significantly to 15.4 and 11.9% in 2050 and 17.6 and 12.7% in 2100, respectively. This is due to the changes in nuptiality behaviors that occurred among young people after the 1980s. It takes time for such behaviors to affect the percentages of marital statuses for elderly women. The effect of the changes on the marital statuses of elderly women will appear after two or three decades.
Figure 9 shows trends in poverty rates for elderly people by gender. Those for elderly women will increase by around 25%. This is due to the increase in the percentages of never-married or divorced women, who are very likely to live in poverty. If the poverty rate is low, then the problem is limited, and those people's lives can be secured by social assistance programs. Of course, if their pension benefits are adequate for their lives, the problem is also limited. However, the public pension system is not generous for women such as homemakers or widows.
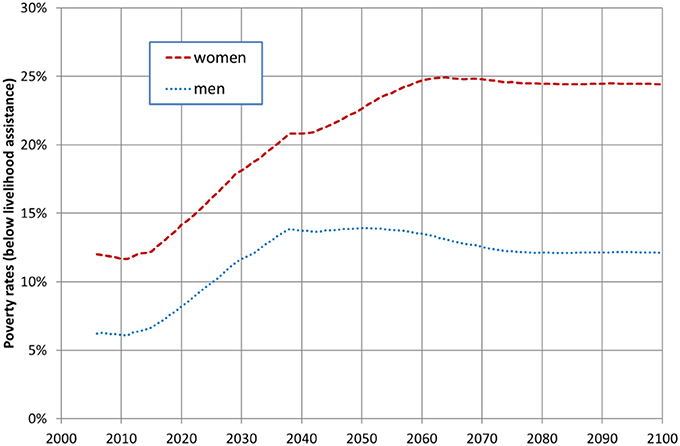
Figure 9. Trends in poverty rates by gender. Simulation results.
Conclusion
Increasing poverty rates for elderly women is a growing concern in Japan. Inagaki [1] quantitatively projected future poverty rates using a dynamic microsimulation model (INAHSIM). He then pointed out that changes in nuptiality behaviors after the 1980s will cause the increase.
However, his approach is an indirect method, and the mechanism of impoverishment has remained unclear. This study attempts to reveal this problem more directly. Specifically, it breaks down the simulation results into key factors such as individual pension benefits and incomes and living arrangements by marital status. The results showed that marital status is the most important factor that will lead to poverty for the elderly in the future.
One reason behind this is the concept of the public pension system in Japan. The public pension system was established in the mid-1980s as a social insurance system based on the division of gender roles established during the period of high economic growth from 1954 to 1973. The system is very generous for dependent wives and widows but not for never-married or divorced women. At that time, most women resigned from their jobs during their twenties, got married, and became homemakers.
However, after the period of high economic growth, nuptiality behaviors, and lifestyles changed completely. Nevertheless, the division of gender roles remains, and wage inequality between men and women still exists. Consequently, inequality exists in pension benefits between men and women because the wage inequality leads to inequality in pension benefits. Thus, never-married and divorced women will suffer from poverty when they reach old age.
Using a dynamic microsimulation model, this study makes future projections of (1) the distribution of pension amounts by gender and marital status, (2) poverty rates for elderly women by marital status, and (3) poverty rates for elderly people by gender. The results indicate a huge difference in poverty rates among elderly women by their marital status and illustrate the mechanism by which the poverty rate for elderly women will increase significantly.
At this moment, this poverty problem is hidden and not very serious because many in this cohort live with their parents. However, when they reach old age, the poverty problem will come to the surface because their parents will pass away and their public pensions will not be enough to sustain them. These problems will become apparent to everyone in the near future. Pension reform for a super-aging society is important. However, it is also urgent to reform the public pension system to be consistent with people's current behaviors.
Author Contributions
The author confirms being the sole contributor of this work and approved it for publication.
Conflict of Interest Statement
The author declares that the research was conducted in the absence of any commercial or financial relationships that could be construed as a potential conflict of interest.
Acknowledgments
This work was supported by JSPS KAKENHI Grant Number JP15548069, JP15649809, JP17921805 and Health Labour Sciences Research Grant Number H27-seisaku-ippan-004.
Footnotes
1. ^In this article, “elderly people” is defined as those aged 65 and over.
2. ^The baseline scenario assumes that current people's behaviors will continue in the future.
3. ^An ethics approval was not required as per institutional and national guidelines and all data used are publicly available or have been provided to the authors in a de-identifiable format.
4. ^The exchange rate was $1 = JPY112.67 on October 10, 2017.
5. ^In the post-war family, the husband is covered by the EPI from 20 to 59 years and the wife, who is the same age as her husband, has always been dependent on him.
6. ^The probabilities in the first version are controlled by sex and age but those in the current version are controlled by sex, age, and employment status.
7. ^See Aoi et al. [5], $Inagaki [10], Inagaki [11], Inagaki [12], and Inagaki [1] for details.
8. ^Published in Inagaki [11].
9. ^The data used in this study were made available to the author by the Ministry of Health, Labor, and Welfare of Japan, notice No. 0531-2, dated May 31, 2016.
10. ^The stochastic error of the poverty rates estimated in this article should be larger than this. This is left to future research.
References
1. Inagaki S. The effect of changes in nuptiality behavior after the 1980s on the poverty rate for the elderly in Japan—Analysis using a dynamic microsimulation model. Rev Socionetw Strat. (2014) 8:1–18. doi: 10.1007/s12626-014-0040-1
2. Inagaki S. The effect of the introduction of mandatory Category 3 contributions on the poverty rate for the elderly in Japan. In: IAA Colloquium in OSLO. Norway (2015).
3. Ministry of Health, Labor, and Welfare. The 2015 Annual Report for Employees' Pension Insurance and National Pension. e-Stat, Ministry of Internal Affairs and Communications (2017). Available online at: http://www.e-stat.go.jp/SG1/estat/List.do?lid=000001187963
4. Ministry of Health, Labor, and Welfare. The 2009 Actuarial Report. Ministry of Health, Labor and Welfare (2010) (in Japanese). Available online at: http://www.mhlw.go.jp/topics/nenkin/zaisei/zaisei/report2009/mokuji.html
5. Taikoji T, Hanada K, Ito T, Kadowaki T, et al. Household Projections Using Integrated Analytical Model for Household Simulation (INAHSIM), Life Span, Jumyogaku Kenkyukai (1986).
6. Shiraishi K. Microsimulation of public pension reform. Zaisei Kenkyu (2009) 5:184–99 (Tokyo: in Japanese).
7. Koshio A. Projecting long term care needs in Japan? Microsimulation modeling for super aged society. In: 4th General Conference of the International Microsimulation Association. College of Business and Economics, Australian National University, Canberra, ACT (2013).
8. Fukawa T. Health and long-term care expenditures of the elderly in Japan using a micro-simulation model. Jpn J Soc Secur Policy (2007) 6:199–206.
9. Fukawa T. Household projection and its application to health/long-term care expenditure in Japan using INAHSIM-II. Soc Sci Comput Rev. (2010) 29:52–66. doi: 10.1177/0894439310370097
10. Inagaki S. Projections of the Japanese socio-economic structure using a microsimulation model (INAHSIM). In: IPSS Discussion Paper Series 2005-03, National Institute of Population and Social Security Research (2005).
Keywords: microsimulation, poverty rate, public pension, nuptiality, marital status, family, household
Citation: Inagaki S (2018) Dynamic Microsimulation Model of Impoverishment Among Elderly Women in Japan. Front. Phys. 6:22. doi: 10.3389/fphy.2018.00022
Received: 24 October 2017; Accepted: 19 February 2018;
Published: 14 March 2018.
Edited by:
Isamu Okada, Soka University, JapanReviewed by:
Rajagopalan Srinivasan, Indian Institute of Technology Madras, IndiaBenoit Gaudou, Université fédérale de Toulouse, France
Copyright © 2018 Inagaki. This is an open-access article distributed under the terms of the Creative Commons Attribution License (CC BY). The use, distribution or reproduction in other forums is permitted, provided the original author(s) and the copyright owner are credited and that the original publication in this journal is cited, in accordance with accepted academic practice. No use, distribution or reproduction is permitted which does not comply with these terms.
*Correspondence: Seiichi Inagaki, s.inagaki@iuhw.ac.jp