Unavowed Abstention Can Overturn Poll Predictions
 Serge Galam
- CEVIPOF - Centre for Political Research, Sciences Po, Centre National de la Recherche Scientifique, Paris, France
I revisit the 2017 French Presidential election which opposed the far right National Front candidate Marine Le Pen against the center candidate Emmanuel Macron. While voting intentions for Le Pen stuck below 50% and polls kept predicting her failure, I warned on the emergence of a novel phenomenon I defined as unavowed abstention, which could suddenly reverse the ranking at Le Pen benefit on the voting day. My warning got a massive media coverage. She eventually lost the runoff at a score worse than predicted by the polls. Using a quantitative mathematical framing, which reveals the existence of tipping points in respective turnouts, I show that the predicted phenomenon of unavowed abstention did happen. But instead of shattering the expected outcome, against all odds it occurred at Le Pen expense, therefore without impact on the final outcome. The results shed a new light on other national cases such as Obama and Trump victories in the US.
Introduction
The French Presidential system obeys a non-compulsory two-round voting, which for the 2017 election were scheduled to be held on April 23 and May 7 Sundays respectively. However, it is of importance to underline the fact that this election was rather unusual combining both an unpredictable winner and an identified loser at the second round. According to the polls Marie Le Pen was simultaneously granted a place among the second round two finalists and yet given defeated at this second round, whoever her challenger might have been1. The French Presidential electoral system thus exhibited a paradoxical feature pointing to a blatant non-democratic drawback, which ensured that the non National Front (NF) candidate who comes first or second in the first round will come first in the second round. The Presidential election then ended up being a race among all non National Front (NF) candidates to win the place left for the second round, the other one being taken by Marine Le Pen. The 2002 second round runoff between Jean-Marine Le Pen and Jacques Chirac had been an emblematic illustration of this second round situation2. However Jean-Marie Le Pen qualifying for the second round then came as a total blow to all expectations while Marine Le Pen qualification was given for granted2. A substantial change.
Such a paradoxical dynamics is rooted in the existence of the robust political phenomenon denoted “Republican Front" (RF), which prevents any NF candidate to win an election. The RF has been activated regularly with quite a success (apart from a few minor exceptions in local elections), each time a NF candidate has run in the second round of a local or national election. This phenomenon explains why the NF has been absent from representative institutions for decades despite scoring among the higher votes in term of national support. In contrast, the NF managed to have numerous candidates elected to the European parliament since these elections are one round proportional3.
The RF results from the interplay of two effects. The first effect stems from the refusal of all parties across the political spectrum to join forces with NF candidates for the second round of local elections. The second effect results from the adamant refusal of millions of voters to allow a NF candidate to be elected. Accordingly, to prevent this from happening they vote massively to support the challenger candidate regardless of its political affiliation. This creates what has been defined metaphorically as a “glass ceiling,” which prevents any NF candidate who qualified for the second round from exceeding the required 50% ballot threshold needed to win the election.
Although the RF has eroded substantially during recent past elections, it has continued to ensure that the glass ceiling remains positioned below 50%. Therefore, a priori Marine Le Pen could not win the 2017 Presidential second final round whatever high score she could reach, this score being in all cases maintained below 50%.
Nevertheless, it is of central importance to stress that the 2017 campaign has been rife with an unprecedented series of judicial incidents combined to unexpected outcomes in primary elections held first by the Right and the Center together and later by the Socialist Party. In both cases the favorite candidate was defeated. On the Right (Républicains) Alain Juppé was defeated by François Fillon and on the Left, (the Socialist Party) Manuel Valls lost against Benoît Hamon. As a result, the possibility of a sudden acceleration of the RF erosion became feasible making the likelihood of Marine Le Pen election shift from impossible to improbable4.
However, poll predictions can turn dramatically wrong as proven with the notorious 2016 successive cases of highly unexpected Brexit victory and Trump election. Next along this series could have been the 2017 French Presidential election. For the first time ever an extreme right candidate, the National Front (NF) leader Marine Le Pen, could have won turning wrong polls prediction one more time. Indeed, during the electoral campaign she successfully shifted her winning expectations from improbable to possible, scoring up voting intentions at high levels as 41% never reached before1. Such scores were totally unconceivable a few weeks before the campaign was launched. Yet, polls kept predicting she would loose the election against the center candidate Emmanuel Macron5. In addition, using my opinion dynamics model [1] I also reached the same result as polls, i.e., Le Pen failure.
And yet, I warned about the feasibility of an unexpected voting outcome which would discard polls assessment and my model prediction. I alerted to the paradoxical situation in which Marine Le Pen could be elected despite scoring voting intentions below 50% [2–4]. My statement did not rely on voting intentions but on an insufficient implementation of those voting intentions into casting actual ballots.
Evoking the appearance of a new phenomenon, which I defined as unavowed abstention, I found that poll intentions could be reversed on the voting day without people shifting opinions. Indeed, the unavowed abstention, either direct or via blank and null ballots, had the capacity to create an effective differentiated abstention, which could have driven the outcome upside down with an unexpected victory of Marine Le Pen despite her having voting intentions below 50%. Unavowed abstention resembles to the withholding your vote phenomenon but while the former is silent and unspoken the last one is either tactical or publicized [5]. It is different from the “No-show paradox.”
The fact that using my model of opinion dynamics [1] I successfully predicted both Trump victory a few months ahead of the election [6] and the Brexit scenario several years ago [7, 8], fueled credibility to my alert, which was quite sound given the then peculiar volatile French political context. My alarming got quite a large media impact echoing to the overall feeling that democratic countries were being swept within a wave of rising populism. These works subscribe along the current active study of opinion dynamics and voting [9–21] within the field of sociophysics [22, 23].
On the voting day Marine Le Pen eventually ended loosing the election as expected. Nevertheless, her actual score at 33.90% was lower than the 38% poll estimates given 2 days ahead of the vote5. The associated abstention estimates at about 24% were also rather wrong against a turnout out at 74.56% with 11.52% of white and null ballots, which yield an overall abstention rate at 34.03% once aggregated adequately.
In this paper I develop a quantitative mathematical framing to reveal the existence of tipping points in respective turnouts with respect to the actual winning candidate vs. voting intentions. Applying the frame to the 2017 French Presidential election shows that the predicted phenomenon of unavowed abstention did happen but at the expense of Le Pen in contrast to the sound expectation that it will be at her benefit [2–4]. Therefore, abstention had no impact on the expected final outcome. The results could shed a new light on other national cases such as Obama and Trump victories in the US.
Model and Method
The Unavowed Abstention
Prior to the first round it was noticeable that for the first time, while Marine Le Pen was still generating the usual strong repulsion for a NF candidate among a large part of voters, a significant part of these sincere anti-NF voters would be also reluctant to cast a ballot in favor of the challenger, whoever he could have been, François Fillon, Jean-Luc Mélenchon or Emmanuel Macron. This very fact was novel and could affect meaningfully the final outcome [2].
Indeed, each one of these possible challengers would capitalize a large fraction of the anti-NF electorate. However, for a good part of these anti-NF voters, implementing their refusal of Le Pen would require paying a high political cost by casting a ballot in favor of a candidate they are been attacking adamantly during the campaign. Relying on such individual tensions between a repulsion toward Marine Le Pen and at the same time a revulsion toward her challenger, I postulate the appearance on the voting day of a phenomenon of unavowed abstention, which would materialize by either abstention or blank and null ballots.
I envisioned this feature in resonance with the earlier phenomenon of ashamed voting, which characterized a good fraction of NF voters at the earlier stages of the NF growing support. Polls had then failed forecasting this attitude and misforcast the NF growing support. Only latter on, using series of past elections pollsters did include the phenomenon calibrating the NF avowed voting intentions. Unavowed abstention would thus be the asymmetric counter part of ashamed voting and similarly would go undetectable by polls at its first manifestations.
In other words, given voting intentions Ia and Ib = 1 − Ia satisfying 0 ≤ Ia ≤ 1 for respectively Marine Le Pen and Emmanuel Macron, the condition Ia < Ib, i.e., may lead to an actual vote outcome over fifty percent for Marine Le Pen giving her the victory. The rank reversal being monitored by the differentiated abstention driven by unavowed abstention.
It is worth emphasizing the fact that such an reversed outcome would occur without any change in individual voting intentions. Only the actual rates of casting ballots would be different from polls expectations. My observation shifted Le Pen likelihood to be elected from improbable to quite possible. The mathematical frame I developed to embody such an hypothesis departs from traditional studies of abstention within the political sciences [5, 24–30].
Voting Outcomes and Effective Turnout
To substantiate my claim I consider an election with a two-candidate A and B competition. In all cases, once voting is completed two complementary percentages are first obtained, the turnout percentage T and 1 − T the percentage of abstainers. Then, from the ballots, which constitute the turnout, three percentages are obtained with
• Va the percentage of ballots for candidate A,
• Vb the percentage of ballots for candidate B,
• Vn the percentage of blank and null ballots,
satisfying Va + Vb + Vn = 1.
For instance, the 2017 second round French Presidential election yielded T = 74.56%, 1 − T = 25.44%, Va = 30.00%, Vb = 58.48% (denoting respectively Le Pen for candidate A and Macron for candidate B), and Vn = 11.52%6.
However, in order to have the winner candidate being always elected by more than 50% of votes cast, Va and Vb are rescaled accounting only for ballots to either one of the two candidates.
which satisfy va + vb = 1. It yields va = 33.90% and vb = 66.10% for the 2017 French case.
On this basis, giving the results with only va and vb makes the value of turnout T misleading since the blank and null ballots have disappeared. Therefore, to be consistent with such a reformatting it makes sense to also rescale Vn to add it to the abstention 1 − T since indeed those ballots are identical to hidden abstention with on the one hand, the corresponding voters not being identified as abstainers contrary to the ones who did not go to vote, and on the other hand, their ballots are discarded from the official counting. I thus calculate both an overall turnout To,
yielding for the 2017 French case To = 65.97% and thus an absolute abstention at 1 − To = 34.03% relatively T = 74.56% and 1 − T = 25.44%. It is worth underlying that every pollster has its own criterium to evaluate the turnout estimate, and often blank and null ballots are included in the abstention although not explicitly acknowledged. Usually no clear disclosure of the underlying details is given. But in all cases only va, vb and turnout T are publicized in the media without mentioning the percentage of blank and null ballots.
Voting Intention vs. Actual Voting
Once an election is scheduled and the associated campaign launched, pollsters are very active forecasting the outcome values va, vb and T, which is indeed To as argued above. They keep publishing successive estimates for voting intentions Ia, Ib for candidates A and B and turnout estimate. Collecting these data as a function of time allows extrapolating an outcome, which could turn right provided no sudden change in voting intentions occurred during the last days prior to the election. It supposes also that no significant asymmetric unavowed abstention will take place on the voting day.
At this stage it is of importance to enlighten that two different phenomena get embedded to make up the outcome of an election. First one relates to the dynamic of voting intentions which involves people interactions. When no major external event occurs, the distribution of individual voting intentions stabilizes over time. And yet if a major event occurs voting intentions might be changed but after they end up stabilizing again. The sociophysics modeling of opinion dynamics confirms this stabilization feature with the revealing of tipping points and attractors [7]. In contrast, second phenomenon concerns individual motivations to actually cast a ballot on the voting day. That feature is more volatile depending among other factors on series of daily life hazards which may occur on the voting day. Such usual hindrances do not depend on voting intention and are a priori equally distributed on A and B voters. That homogeneity allows a fair estimate of the turnout.
Nevertheless in addition to those normal homogenous impeachments, some heterogeneity must be accounted for to include unavowed abstention. Accordingly, I introduce two independent variables x and y to measure the respective turnout for candidates A and B. Then given voting intentions Ia and Ib, on the voting day we get,
which rewrites Equation (1) as,
giving the effective turnout
Simultaneously, using Vn = 1 − Va − Vb gives,
which in turn yields an overall turnout Equation (2),
Results
Building a Voting Phase Diagram
From Equation (4) A wins the election when va > vb ⇔ xIa > yIb = y(1 − Ia), which, given x and y, defines a critical value for A voting intentions,
When Ia > Iac, A wins the election with va > vb even if . At the critical voting intentions value Iac the associated critical effective turnout value is,
Above identification of a tipping point Iac opens the possibility to envision a different strategy to forecast a voting outcome. Instead of trying to determine what will be the values of va and vb, I can define a voting phase diagram which includes all possible values of the various parameters determining respective ranges for A and B to win the election.
Another point of view can be adopted where a set x and Ia and given to identify a critical value for B turnout y,
with A being elected in the range y < yc. In such a case even if .The reverse view holds true with defining an x critical turnout,
with A being elected when x > xc.
It should be stressed that it is rather useful to build the associated voting phase diagrams since x and y are difficult to estimate as explained earlier. Moreover, they stay unknown once the vote is completed having only va, vb, T, and To. In contrast, accurate estimate Ia (and thus Ib) is in principle feasible. For this reason the identification of a critical value for voting intention or turnout for a candidate is valuable since then what matters is determining in which region of the parameters the vote is likely to be located. Precise values are no longer required, only ratios and orders of magnitude matter.
Figure 1 shows the critical line (Equation 10) as a function of for x = 0.85. In the y < yc area (lower dark part under the curve) A wins the election thus contradicting poll predictions since . Otherwise, in the y > yc area (upper clear part above the curve) B wins the election in agreement with poll predictions. Two points with respectively Ia = 0.43 and Ia = 0.45 and identical B turnout illustrate the two situations.
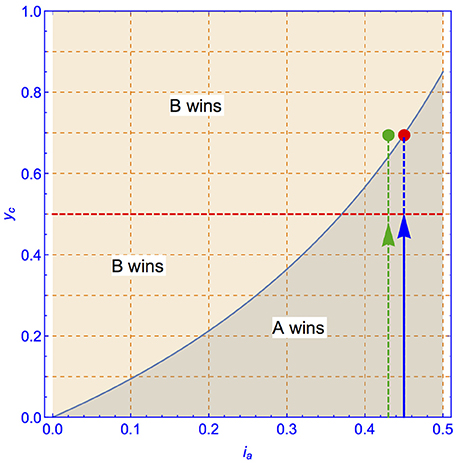
Figure 1. The critical line from Equation (10) is shown as a function of for x = 0.85. In the y < yc area (lower dark part under the curve) A wins the election. In the y > yc area (upper clear part above the curve) B wins the election. The arrow (blue) shows the A winning vote at 0.5002 for Ia = 0.45 and B turnout y = 0.695. The dot (red) locates B turnout y = 0.695 < yc = 0.6955. The arrow (green, left side) shows the A vote at va = 0.4799 for Ia = 0.43 and B turnout y = 0.695 not allowing A to win. The dot (green) locates B turnout at y = 0.695 > yc = 0.6412.
Figure 2 shows the variation of the critical curve for x = 0.95, 0.90, 0.85, 0.80, 0.75 as a function of . Below the curves A wins against poll predictions while above the curve B wins as predicted by polls.
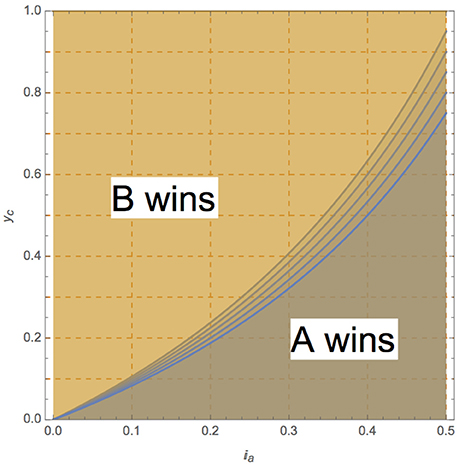
Figure 2. The critical line from Equation (10) is shown as a function of from top down for x = 0.95, 0.90, 0.85, 0.80, 0.75. In the y < yc area (lower dark part under the curve) A wins the election. In the y > yc area (upper clear part above the curve) B wins the election.
Three Scenarios to Illustrate the Reversal Effect
To illustrate the reversal process driven by Equation (8) I have suggested three scenarios, which were plausible before the vote given available polls [1]7. None actually occurs and what did happen is discussed below. Table 1 exhibits these three scenarios from the perspective of critical A voting intentions Iac.
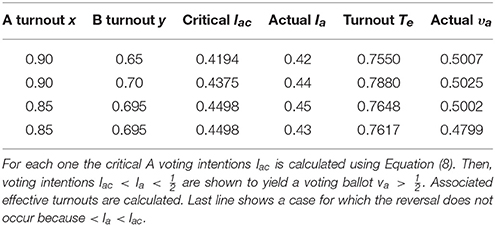
Table 1. Three cases of A and B turnouts (x and y) are considered.
The first scenario considers the case x = 0.90 and y = 0.65, which yields critical A voting intentions Iac = 0.4194. Accordingly, an actual A voting intentions Ia = 0.42 much lower than 50% leads to an A victory with va = 0.5007 and effective turnout Te = 0.7550. Second scenario keeps x = 0.90 but takes y = 0.70 to yield critical A voting intentions Iac = 0.4375. Now Ia = 0.42 leads to a B victory. However, an additional 2% in A voting support at Ia = 0.44 restores A victory with va = 0.5025 and effective turnout Te = 0.7880. Last scenario selects x = 0.85 and y = 0.695, which yields a critical A voting intentions Iac = 0.4498. Taking an actual A voting intentions Ia = 0.45 leads to an A victory with va = 0.5002 and effective turnout Te = 0.7648. But Ia = 0.43 < Iac = 0.4498 leads to A losing with va = 0.4799 and effective turnout Te = 0.7617.
Above scenarios can also be looked at from the perspective of critical B turnout using Equation (10) as shown in Table 2. The first scenario starts with x = 0.90 and actual A voting intentions Ia = 0.42 to yield a critical B turnout yc = 0.6517. Actual B turnout y = 0.65 < yc = 0.6517 leads to an A victory with va = 0.5007 and effective turnout Te = 0.7550. The second reads x = 0.90 with actual A voting intentions Ia = 0.44. This yields a critical B turnout yc = 0.7071. Therefore, actual B turnout y = 0.70 leads to an A victory with va = 0.5025 and effective turnout Te = 0.7880. Last scenario has x = 0.85 and actual A voting intentions Ia = 0.45 which yields a critical B turnout yc = 0.6955. A turnout y = 0.695 lead to va = 0.5002 and effective turnout Te = 0.7648. A fourth scenario still with x = 0.85 but with actual A voting intentions Ia = 0.43 is given. The critical B turnout is yc = 0.5667 making y = 0.695 > yc = 0.5667 not allowing the reversal with A losing at va = 0.4799 and effective turnout Te = 0.7617.
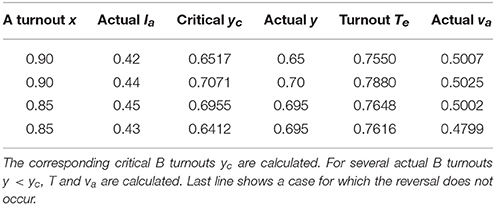
Table 2. Identical three cases as in Table 1 using Equation (10), i.e., A turnout x and voting intentions Ia are given.
Discussion
Before applying above analysis to the 2017 French Presidential election, it is worth emphasizing that during the public campaign which takes place before an election, each candidate tries to gain a maximum number of voting intentions. This goal produces a dynamics of public opinion which drives an initial distribution of voting intentions toward a final distribution, which eventually determines the outcome of the election. Successive polls show how overall support for each candidate evolves during the campaign period. Accordingly, if we consider poll estimates to be exact, in principle a last day poll prior to the election should yield the voting outcome but it is hard to implement in practical terms.
At the same time, polls were proven rather wrong in 2016 with the significant failures in predicting the Brexit and Donald Trump election. As regard to Brexit, I warned about holding referendums on the building of Europe many years ago [7, 8], pointing the likelihood that proposed institutional changes would be rejected even when polls showed widespread support for the change as with the Brexit case. The model also predicted the outcome of the 2005 French referendum on the European constitution which was rejected [31]. Using the same model I also predicted Donald Trump's totally unexpected victory over Hilary Clinton in the 2016 US Presidential election [6]. Earlier, the model also forecasted the scenario of Jean-Marie Le Pen's 2002 breakthrough victory at the first round Presidential election [32]. He was then heavily defeated by Jacques Chirac at the second round as expected unanimoulsy.
Above poll failure cases have shed light on the existing of possible occurrence of non-linear phenomena characterized by sudden and unexpected changes in individual voting choices. But for the 2017 French case I suggested another reason, differentiated abstention, which is independent of shifts in voter choices. Differentiated abstention addresses the turning of a voting intention into an actual vote on the voting day. It is not an opinion but a punctual one day act. As seen from above analyses and case studies, differentiated abstention has the realistic capacity to reverse the candidates order even when the difference in voting intention reaches a score of 10% or a bit more.
I was expecting this differentiation process to be accentuated by the very fact that most of Marine Le Pen voters were voting for her while a large number of those who were voting for her challenger would indeed be voting against Le Pen to prevent her from winning. This asymmetric abstention should have increased considerably abstention for the challenger than for Le Pen making the case with plausible. For instance, 42% could lead to 50.07% as shown in Table 1 for reasonable abstention rates with an effective turnout Te = 0.7550.
However, on the eve of May 7, 2017 the results of the French Presidential election have been an abstention at 25.44% (turnout at 74.56%), 30.00% for Marine Le Pen, 58.48% for Emmanuel Macron and 11.52% of blank and null ballots, which yielded 33.90% for Le Pen against 66.10% for Macron and an overall abstention at 34.03% (To = 0.6597). No reversal of expected outcome occurred along May 5 last polls 2 days ahead of the vote giving 37–38% for Le Pen against 63–62% for Macron with an abstention at 24.5–24.22%8. The results raise three questions:
1. Does the outcome discard my warning about the new phenomenon of asymmetric unavowed abstention with most anti-NF voters eventually going to cast a ballot for Macron including the ones adamantly opposed to his program?
2. Does the outcome means that my warning about the drastic effect of unavowed abstention had been heard, thank to the massive media coverage [2–4] with numerous reluctant anti-NF voters casting a ballot for Macron?
3. Does the outcome signals that unavowed abstention occurred but against Le Pen at the benefit of Macron?
My answers are negative for question 1, partly positive for question 2 and positive for question 3. Here follow the explanations. The media coverage reached millions of voters convincing many potential abstainers to cast a ballot for Macron. However, while that argument can explain why Le Pen did lose the election as anticipated by polls and my opinion dynamics model, it does not explain why she actually got less ballots than anticipated from poll voting intentions.
To support the affirmative answer to third question I assume for illustration that on the voting day voting intentions were Ia = 38% for Le Pen and Ib = 62% for Macron in agreement to most poll estimates given 2 days before8. Equations (3, 7) yield x = 0.30/0.38 = 0.7895 → 1 − x = 0.2105 and y = 0.5848/0.62 = 0.9432 → 1 − y = 0.0568, i.e., 21.05 and 5.68% for the respective effective rates of abstention for Le Pen and Macron giving a magnitude difference at 15.37% at the benefit of Macron. Equation (5) yields for the corresponding effective turnout Te = 0.8848, which in turn recovers To = TeT = 0.6597 with T = 0.7456.
Although these figures allow to identify an unavowed phenomenon as anticipated, it has occurred in the opposite expected direction. Moreover since it favored the candidate holding the majority of voting intentions, there is not impact on the outcome, as opposed to what may happened when favoring the minority candidate.
But how to explain this symmetry reversal in unavowed abstention? I advocate that Thursday, May 4, Presidential national TV debate between Le Pen and Macron triggered this reversal. Indeed Le Pen exhibited both aggressiveness and incompetence when compared to Macron who kept quite and more knowledgeable on the various policy issues9 My hypothesis is supported by a survey on a sample of 1,157 individuals representatives of the debate TV viewers. It found that 14% of the people did modify their voting intentions after watching the debate [33]. In particular according to the survey 4% of whose who declared to abstain or to vote blank shifted to vote for Macron but 1.9% moved from Macron to abstention or blank. For Le Pen it was respectively 1.4 and 3.1%. Overall after the debate the survey found a net increase of 3.5% voting intentions for Macron with a simultaneous decrease of 3.1% for Le Pen.
The debate has thus increased the anti-NF refusal by lowering the associated ethics-political cost for the numerous anti-NF voters who at the same time adamantly were rejecting Macron program. But in addition, another major unnoticed fact has contributed to another reversal process with many voters who were ready to cast a ballot for Le Pen for the first time as proven by voting intentions at higher ever estimate of 41% before the debate. Such a move in daring to vote for Le Pen had also an ethical cost. While the well mastered Le Pen campaign to dedemonize the NF had indeed lower that cost, the debate inflated this cost at once making a good deal of these would be Le Pen first voters pulled back to either abstention or blank and null ballot. Driven by above simultaneous cost reduction for Macron ballot and cost increase for Le Pen ballot I infer about a significant transfer of a few percents of intended first voters Le Pen to abstainers, blanks and nulls as well as from anti-NF abstainers, blanks and nulls to Macron voters.
Conclusion
At this stage I have determined all ranges of differentiated abstention which can reverse the expected voting order with actual outcome for A while . Indeed, given a turnout x and voting intention there exists a critical value yc for B turnout below which A wins the elections against poll predictions. It allows building a voting phase diagram which embodies all possible scenarios where poll predictions are expected to turn wrong as well as the regions where polls will be right. Such a phase diagram bypasses the poll difficulty to assess accurately effective turnouts since those result from an aggregation of fragile individual implementations of a stable voting intention into casting a ballot on the voting day. It is of importance to emphasize that such a reversal of the expected outcome occurs without any change of individual voting intentions.
When applied to the second round of the 2017 French Presidential election hold on May 7, I have shown that for the first time the NF candidate had a real chance of winning the race to become French President despite voting intentions of only about 40–45% due to the possibility of unavowed abstention. Yet unavowed abstention occurred but at Le Pen expense thus avoiding such an unexpected outcome.
I hope this paper will motive future survey to investigate my concept of competing costs in voting situations where many voters have to choose the less worth of two candidates they reject. The concept of unavowed abstention could be found relevant to explain other national election cases. For instance it should be interesting to revisit both American Presidential election of Obama and Trump in light of the unawoved abstention phenomenon.
Author Contributions
The author confirms being the sole contributor of this work and approved it for publication.
Conflict of Interest Statement
The author declares that the research was conducted in the absence of any commercial or financial relationships that could be construed as a potential conflict of interest.
Acknowledgments
I would like to thank Martial Foucault for useful discussions, Thierry Vedel for sharing his findings prior to publication [33] and Maria Jimena Sanhueza for a carefull reading of the manuscript.
Footnotes
1. ^https://www.enef.fr/données-et-résultats/
2. ^https://fr.wikipedia.org/wiki/Élection_présidentielle_française_de_2002
3. ^https://en.wikipedia.org/wiki/Elections_to_the_European_Parliament
4. ^http://www.sciencespo.fr/ecole-doctorale/sites/sciencespo.fr.ecole-doctorale/files/Seminaire_S_GALAM_2016-2017.pdf
5. ^http://opinionlab.opinion-way.com/opinionlab/832/627/presitrack.html
6. ^https://www.interieur.gouv.fr/Actualites/Communiques/Resultats-globaux-du-second-tour-de-l-election-du-President-de-la-Republique-2017
7. ^http://fr.kantar.com/opinion-publique/politique/2017/barometre-2017-d-image-du-front-national/
8. ^https://www.fiducial.fr/fr/Actualites-FIDUCIAL/Rolling-2017-Ifop-Fiducial-l-election-presidentielle-en-temps-reel-n-69
9. ^https://www.lefigaro.fr/elections/presidentielles/2017/05/04/35003-20170504ARTFIG00059-pourquoi-emmanuel-macron-a-remporte-le-debat-l-avis-de-cinq-experts.php; https://www.marianne.net/politique/debat-2017-marine-le-pen-face-macron-2h30-de-naufrage.
References
1. Galam S. Modeling the forming of public opinion: an approach from Sociophysics. Glob Econ Manag Rev. (2013) 18:2–11. doi: 10.1016/S2340-1540(13)70002-1
2. Galam S. Marine Le Pen, une faille de taille dans le plafond de verre. Libération Idées (2017) 26:24–5.
3. Vinocur N. How Marine Le Pen could win. Politico (2017). Available online at: https://www.politico.eu/article/how-marine-le-pen-could-win/
4. Galam S. Abstention, France's Last Temptation, International Edn. New York, NY:The New York Times (2017).
5. Hayden GM. Abstention: the unexpected power of withholding your vote. Conn Law Rev. (2010) 43:585.
6. Galam S. The trump phenomenon, an explanation from sociophysics. Int J Mod Phys B (2017) 31:1742015. doi: 10.1142/S0217979217420152
7. Galam S. Minority opinion spreading in random geometry. Eur Phys J B (2002) 25:403. doi: 10.1140/epjb/e20020045
8. Galam S. The dynamics of minority opinion in democratic debate. Phys A (2004) 336:56. doi: 10.1016/j.physa.2004.01.010
9. Biswas S, Sen P. Critical noise can make the minority candidate win: the U.S. Presidential election cases. Phys Rev E (2017) 96:032303. doi: 10.1103/PhysRevE.96.032303
10. Pickering W, Szymanski BK, Lim C. Analysis of the high dimensional naming game with committed minorities. Phys Rev E (2016) 93:052311. doi: 10.1103/PhysRevE.93.052311
11. Rodriguez N, Bollen J, Ahn YY. Collective dynamics of belief evolution under cognitive coherence and social conformity. PLoS ONE (2016) 11:e0165910. doi: 10.1371/journal.pone.0165910
12. Battiston F, Cairoli A, Nicosia V, Baule A, Latora V. Interplay between consensus and coherence in a model of interacting opinions. Physica D (2016) 323:12–9. doi: 10.1016/j.physd.2015.10.013
13. Cheon T, Morimoto J. Balancer effects in opinion dynamics. Phys Lett A (2016) 380:429–34. doi: 10.1016/j.physleta.2015.11.012
14. Burghardt K, Rand W, Girvan M. Competing opinions and stubborness: connecting models to data. Phys Rev E (2016) 93:032305. doi: 10.1103/PhysRevE.93.032305
15. Mobilia M. Nonlinear q-voter model with inflexible zealots. Phys Rev E (2015) 92:012803. doi: 10.1103/PhysRevE.92.012803
16. Timpanaro AM. Diversity and disorder in the voter model with delays. Available online at: https://arxiv.org/abs/1708.08756v2
17. Pires MA, Oestereich AL, Crokidakis N. Sudden transitions in coupled opinion and epidemic dynamics with vaccination. Available online at: https://arxiv.org/abs/1709.06461
18. Costa Filho RN, Almeida MP, Andrade JS Jr., Moreira JE. Scaling behavior in a proportional voting process. Phys Rev E (1999) 60:1067. doi: 10.1103/PhysRevE.60.1067
19. Araùjo NAM, Andrade, JS Jr, Herrmann HJ. Tactical voting in plurality elections. PLoS ONE (2010) 5:e12446. doi: 10.1371/journal.pone.0012446
20. Fernández-Gracia J, Suchecki K, Ramasco JJ, San Miguel M, and Eguíluz VM. Is the voter model a model for voters? Phys Rev Lett. (2014) 112:158701. doi: 10.1103/PhysRevLett.112.158701
21. Borghesi C, Chiche J, Nadal JP. Between order and disorder: a ‘weak law’ on recent electoral behavior among urban voters? PLoS ONE (2012) 7:0039916. doi: 10.1371/journal.pone.0039916
22. Galam S. Sociophysics: A Physicist's Modeling of Psycho-political Phenomena. New York, NY: Springer (2012).
24. Muxel A. “La mobilisation électorale, du décrochage civique á l′abstention record,” In: Perrineau P, editor, Le Vote Disruptif, Chapter 8. Paris: Presses de Sciences Po (2018).
26. Muxel A. La poussée des abstentions: protestation, malaise, sanction. In: Perrineau P, Ysmal C, editors. Le Vote de Tous les Refus, Chapter 5. Paris: Presses de Sciences Po (2003).
27. J. Jaffré and A. Muxel, S′abstenir : hors du jeu ou dans le jeu politique? In: Bréchon P, Laurent A, Perrineau P, editors. Les Cultures Politiques des Françcais. Paris: Presses de Sciences Po (2000). p. 19.
28. Chiche J, Dupoirier E. L'Abstention aux élections législatives de 1997. In: Perrineau P, Ysmal C, editors. Le Vote Surprise. Presses de Sciences Po (1998). p. 141.
29. Subileau F, Toinet MF. Les Chemins de l′abstention: Une Comparaison Franco-américain. Paris: La Découverte (1993).
30. Lancelot A. Cahiers de la FNSP, n 162, L′abstentionnisme électoral en France. Paris: Armand Colin (1968).
31. Lehir P. Les mathématiques s′invitent dans le débat européen, (interview of S. Galam). Le Monde (2005) 23.
Keywords: poll estimates, actual voting, turnout, abstention, vote prediction, Le Pen, Macron, France 2017 election
Citation: Galam S (2018) Unavowed Abstention Can Overturn Poll Predictions. Front. Phys. 6:24. doi: 10.3389/fphy.2018.00024
Received: 11 December 2017; Accepted: 27 February 2018;
Published: 13 March 2018.
Edited by:
Víctor M. Eguíluz, Instituto de Física Interdisciplinar y Sistemas Complejos (IFISC), SpainReviewed by:
Raimundo Nogueira Costa Filho, Federal University of Ceará, BrazilCelia Anteneodo, Pontifical Catholic University of Rio de Janeiro, Brazil
Krzysztof Suchecki, Warsaw University of Technology, Poland
Copyright © 2018 Galam. This is an open-access article distributed under the terms of the Creative Commons Attribution License (CC BY). The use, distribution or reproduction in other forums is permitted, provided the original author(s) and the copyright owner are credited and that the original publication in this journal is cited, in accordance with accepted academic practice. No use, distribution or reproduction is permitted which does not comply with these terms.
*Correspondence: Serge Galam, serge.galam@sciencespo.fr