 Koichiro Sadakane
95% of researchers rate our articles as excellent or good
Learn more about the work of our research integrity team to safeguard the quality of each article we publish.
Find out more
REVIEW article
Front. Phys. , 27 March 2018
Sec. Biophysics
Volume 6 - 2018 | https://doi.org/10.3389/fphy.2018.00026
Antagonistic salts are composed of hydrophilic and hydrophobic ions. In a binary mixture, such as water and organic solvent, these ion pairs preferentially dissolve to those phases, respectively, and there is a coupling between the charge density and the composition. The heterogeneous distribution of ions forms a large electric double layer at the interface between these solvents. This reduces the interfacial tension between water and organic solvent, and stabilizes an ordered structure, such as a membrane. These phenomena have been extensively studied from both theoretical and experimental point of view. In addition, the numerical simulations can reproduce such ordered structures.
The solvation effect of ion is considered to be important in various fields, such as those concerning biochemistry, chemical reactions (e.g., electrode reactions and metal ion complexation), and phase behavior in solutions. In particular, the solvation effect on the phase behavior of binary water/organic solvent mixtures is noteworthy. Experiments have established that the two-phase region of a binary mixture tends to expand with the addition of a hydrophilic salt, e.g., NaCl [1–4]. In such mixtures, both cations and anions preferentially attract water molecules more than the organic solvent molecules, which is a key factor in salt-induced phase separation [3, 4].
On the other hand, the class of salts containing a pair of hydrophilic and hydrophobic ions is known an “antagonistic salt.” An example is sodium tetraphenylborate, NaBPh4, which is frequently used as a precipitation agent [5]. This chemical is composed of a hydrophilic sodium ion (Na+) and a hydrophobic tetraphenylborate ion (), which has four phenyl rings bonded to a negatively charged boron atom. Because the surrounding phenyl rings are large, hydrogen bonding around this anion is largely deformed and the hydration shell may be destroyed. Thus, the anions preferentially dissolve in an organic solvent (oil) whereas the cations prefer to stay within the water [6, 7]. This means that the cations and anions behave antagonistically and may distribute heterogeneously when added to a binary liquid consisting of water and an organic solvent.
In 2004, Onuki and Kitamura investigated the effect of the preferential solvation of ions on the binary water/organic solvent based on the Ginzburg-Landau theory, and predicted that the long-range periodic structure, so-called the charge-density-wave (CDW) structure, is induced by the addition of antagonistic salts due to strong coupling between the concentration fluctuation of solvents and the preferential solvation of ions [8]. In 2006, Onuki also investigated the ion distribution in the binary water/organic solvent mixture, and showed that the cations and anions of an antagonistic salt tend to adsorb around a water-oil interface (see Figure 1) [14]. In parallel, the aggregation of hydrophilic and hydrophobic ion pairs was experimentally confirmed by Luo et al. by means of X-ray reflectivity for the mixture of water/nitrobenzene with tetrabutylammonium bromide [15]. Under this condition, it was also shown that the interfacial tension decreases with increasing the amount of antagonistic salts [15]. Furthermore, in 2007, the CDW structure predicted by Onuki and Kitamura [8] was confirmed using small-angle neutron scattering (SANS) on the water/3-methylpyridine (3MP)/NaBPh4 mixture [16].
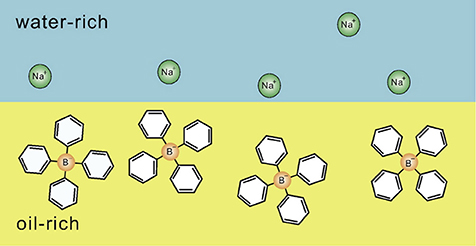
Figure 1. Schematic illustration indicating the distribution of hydrophilic and hydrophobic ion pairs at a water-oil interface, which was clarified by the theoretical studies of Onuki et al. [9–14]. Hydrophilic Na+ and hydrophobic are in the water-rich region and the oil-rich region, respectively. The figure is reproduced from Onuki et al. [13] with permission from Copyright 2016 Elsevier Ltd.
Since then, a number of investigations regarding the effect of antagonistic salts have been performed. On the basis of the Ginzburg-Landau theory, Onuki et al. clarified the heterogeneous distribution of solvents and ions in the mixture more in detail [9–14]. Bier et al. estimated the effect of antagonistic salts on the concentration fluctuation of solvents by extending the Ornstein-Zernike theory [17]. Bier et al. also examined the phase behavior of the mixture with antagonistic salts based on the density functional theory [18]. Pousaneh et al. investigated the effective interaction between a pair of colloids based on the Ginzburg-Landau theory, and showed that the oscillatory interaction occurs in the presence of antagonistic salts in the mixture [19, 20]. At the same time, there are several experimental results on the formation of ordered structures (e.g., membranes) induced by the preferential solvation of antagonistic salts [16, 21–33] and on the surface of water. Further, such structures have recently been confirmed by a lattice-based Monte Carlo simulation [34].
We review a series of results on mesoscopic structures induced by antagonistic salts in water/organic solvent mixtures.
As mentioned above, hydrophilic cations and hydrophobic anions tend to adsorb near the interface between water and the organic solvent because of the preferential solvation and the electrostatic attraction. This heteroselective solvation of cations and anions can affect the solubility of water and organic solvent. Figure 2 shows phase diagrams of deuterium oxide (D2O)/3MP and D2O/3MP/NaBPh4 mixtures [24]. The binary mixture of D2O and 3MP is miscible at room temperature and separates into two phases between T ≈ 310 K (lower critical solution temperature, LCST) and T ≈ 390 K (upper critical solution temperature, UCST), where T denotes the temperature of the mixture [35]. The critical composition is ϕ3MP = 0.30, where ϕ3MP denotes the volume fraction of 3MP in the mixture. When NaBPh4 is dissolved in the mixture, the two-phase region shrinks as the concentration of NaBPh4 in the mixtures Csalt increases, and disappears at Csalt > 15 mmol/L. That is, the mutual solubility between D2O and 3MP increases with the addition of NaBPh4. This result is consistent with the assumption that pairs of antagonistic ions behave as surface-active agents. Similar tendencies, i.e., increase of the mutual solubility between water and organic solvent, were also reported for water/3MP/tetraphenylphosphonium chloride (PPh4Cl) mixtures [23], water/2,6-dimethylpyridine/ NaBPh4 mixtures [26], and water/acetonitrile/NaBPh4 mixtures [31].
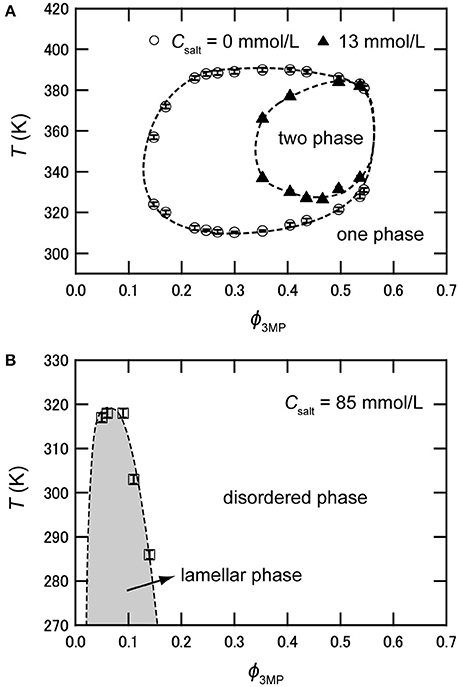
Figure 2. (A) Phase diagram of D2O/3MP and D2O/3MP/NaBPh4 (13 mmol/L). (B) Phase diagram of D2O/3MP/NaBPh4 (85 mmol/L). It is noted that the two-phase region does not exist at this salt concentration. The data are taken from Sadakane et al. [24].
As shown above, the mutual solubility of water and organic solvent increases with the addition of antagonistic salts. In this sense, antagonistic salts play the role of surfactants. Various kinds of ordered structures are formed in surfactant solutions depending on the sample composition and temperature. Therefore, it was expected that antagonistic salts can also induce an ordered structure in the mixture under certain conditions. In fact, the formation of a highly ordered lamellar structure, i.e., a multilamellar vesicle, was discovered in 2009 [21] in the water-rich region of water/3MP/NaBPh4 mixtures (see Figure 2B).
Figure 3 shows the temperature dependence via optical microscopic images of a mixture of D2O and 3MP at ϕ3MP = 0.09 with 85 mmol/L of NaBPh4. The entire area is homogeneous without visible structures above 318 K (Figure 3A), whereas small droplets with diameter of ca. 20 μm are formed below 318 K (Figures 3B,C); that is, a temperature-induced order/disorder phase transition occurs at 318 K. The left-hand panel of Figure 3B′ shows a magnified view of Figure 3B and the right-hand panel shows the corresponding polarized microscopic image with crossed Nicols. Since Maltese cross patterns are shown in the polarized microscopic image, the formation of multilamellar vesicles is suggested [21]. Similarly, the formation of multilamellar vesicles was observed in water/2,6-dimethylpyridine/NaBPh4 mixtures [26].
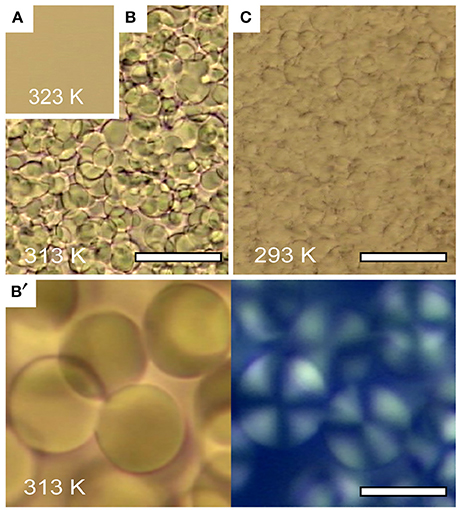
Figure 3. Optical microscopy images of D2O/3MP/NaBPh4 mixture at ϕ3MP = 0.09 and Csalt = 85 mmol/L ϕ3MP = 0.09: (A) T = 323 K (disordered phase), (B) T = 313 K (lamellar phase), and (C) T = 293 K (lamellar phase). Scale bars in (B,C) indicate 100 μm. (B′) Magnified view of (B) (left) and a birefringent image of the same region (right) with the scale bar being 20 μm. The figure is reproduced from Sadakane et al. [21] (Copyright 2009 by The American Physical Society). As per the copyright holder's policies, no permission is required for the use of figures by the authors of the original article.
Nanoscale structures induced by antagonistic salts were investigated by SANS, which could distinguish water and organic solvent regions. Figure 4A shows the temperature dependences of SANS profiles of a D2O/3MP/NaBPh4 mixture (ϕ3MP = 0.09 and Csalt = 85 mmol/L) [24]. The SANS profiles below 318 K show a sharp peak with higher-order peaks arising from the highly ordered structure, whereas profiles above 318 K show a single broad peak arising from the disordered structure. The sample shows two-phase coexistence at T ≈ 318 K, i.e., a highly ordered phase and a disordered phase are observed in the upper and the lower parts of the sample, respectively, suggesting that a 1st-order phase transition occurs around this temperature. This result is consistent with microscopic observation shown in Figure 3.
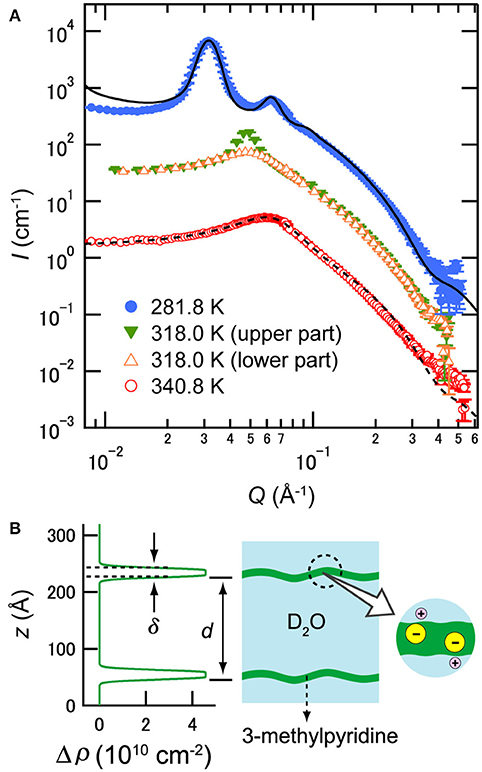
Figure 4. (A) Temperature dependence of SANS profiles of D2O/3MP/NaBPh4 mixture (ϕ3MP = 0.09 and Csalt = 85 mmol/L). The data at lower temperatures have been multiplied by 10 for better visualization. The closed and open symbols indicate data for the lamellar phase and the sponge phase, respectively. The solid and dashed lines show the fitting result according to Equations (1) and (4), respectively. The data are taken from Sadakane et al. [24]. (B) Scattering density distribution at T = 283 K estimated from Equation (1) (left) and schematic picture of the distribution of ingredients (right). The z axis indicates the distance normal to the membrane. (B) is reproduced from Sadakane et al. [21] (Copyright 2009 by The American Physical Society). As per the copyright holder's policies, no permission is required for the use of figures by the authors of the original article.
SANS profiles obtained from the highly ordered phase were analyzed according to the model scattering function of the lamellar structure proposed by Nallet et al. [36] as
with the form factor of the membrane
and structure factor
where ILα denotes the SANS intensity of the lamellar phase, Q the momentum transfer, d the intermembrane distance, Δρ the difference in scattering length density distribution between the membrane and bulk water, δ the membrane thickness, Δδ the membrane thickness distribution, N the number of layers, ΔQ the instrumental resolution, and g the correlation function of fluctuating membranes. As a result of the data analysis, it was confirmed that the membrane was composed of 3 MP and ions (see Figure 4B) [21, 24]. For example, the values of d and δ of the mixture at 281.8 K were evaluated as 195.6±0.2 and 14±3 Å, respectively [24]. A similar membrane structure was also observed in water/2,6-dimethylpyridine/NaBPh4 mixtures [26].
On the other hand, SANS profiles obtained from the disordered phase were analyzed according to the model scattering function for the sponge structure of a surfactant solution, given as [37, 38]
with the form factor derived from randomly oriented disks of membranes
and structure factor
where IL3 denotes the SANS intensity of the sponge phase, ϕBPh the volume fraction of a ion in the mixture, rd the radius of gyration of a disk membrane, ξio the inside–outside correlation length (which reflects the membrane scale [39]), and ξc the correlation length of cells. The terms C1 and C2 are constants. For example, the values of d and δ of the mixture at 340.8 K were evaluated as 92±1 and 16±1 Å, respectively [24].
As shown in Sadakane et al. [24], the lamellar structure in the mixture with antagonistic salt was assumed to be stabilized by the electrostatic interaction arising from ions. On the basis of this idea, Onuki et al. performed a numerical simulation of a water/organic solvent/antagonistic salt mixture and showed that multilamellar vesicles are certainly reproduced (see Figure 5) [13]. Their simulation is based on the Ginzburg-Landau theory considering the electrostatic interaction arising from ions. Here, it was found that the membrane was composed of organic solvent and hydrophobic anions, and hydrophilic cations distribute on the surface of the membrane. In addition, the intermembrane distance d and the membrane thickness η were evaluated as ca. 96 and 18 Å, respectively [13].
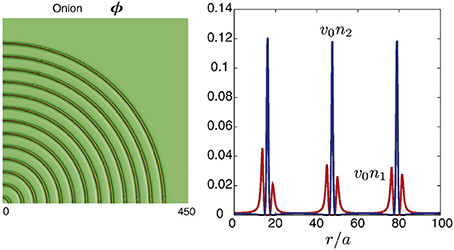
Figure 5. Numerically calculated multilamellar vesicle and charge density in water/organic solvent/antagonistic salt (hydrophilic cation and hydrophobic anion pairs) mixture. ϕ denotes the volume fraction of water, n1 the number density of cations, and n2 the number density of anions. is the molecular volume of solvent. r represents the distance from the center of the multilamellar vesicle. In the mixture, the average volume fraction of water in the mixture, < ϕ >, is set to 0.8. The figure on the left shows cross-sectional profile of ϕ, while the figure on the right shows the charge density around three membranes. The figure is reproduced from Onuki et al. [13] with permission from Copyright 2016 Elsevier Ltd.
In 2017, Tasios et al. performed a Monte Carlo simulation of the water/organic solvent/antagonistic salt mixture [34]. Their simulation was based on an Ising-like lattice model taking into account the effect of the electrostatic interaction arising from ions. As shown in Figure 6A, the lamellar structure was reproduced when the composition of water, xB, was 0.5. Additionally, some other structures that have not been observed in experiments were also obtained: (Figure 6B) perforated lamellar at xB = 0.4, (Figure 6C) tubular lamellar at xB = 0.3 (lower temperature region), (Figure 6D) tubular at xB = 0.35, (Figure 6E) tubular disordered at xB = 0.3 (higher temperature region), and (Figure 6F) droplet phases at xB = 0.2.
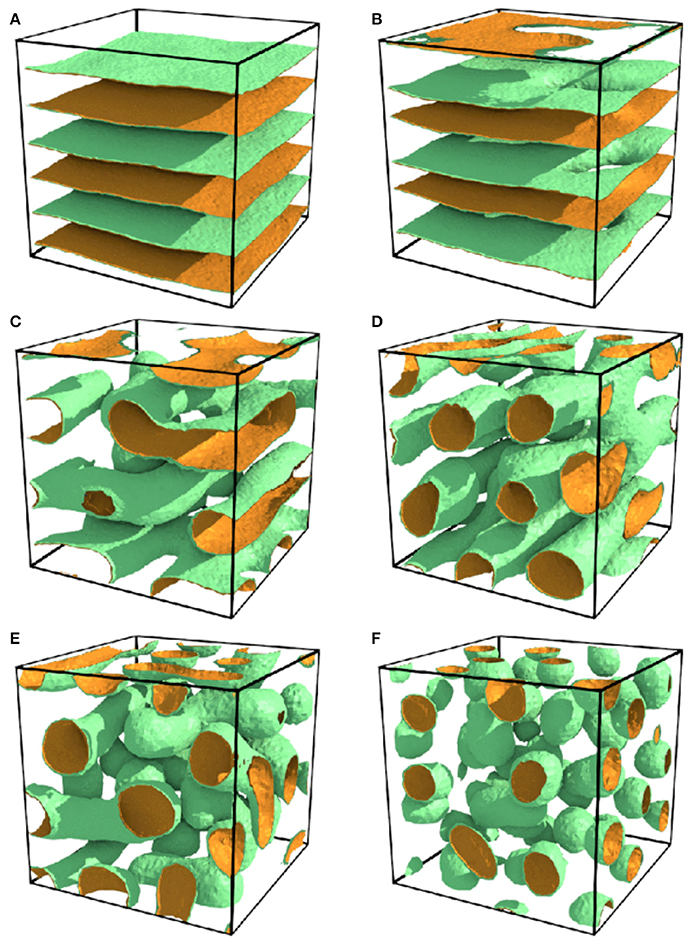
Figure 6. Ordered structures of water/organic solvent/antagonistic salt mixtures obtained by lattice-based Monte Carlo simulation. (A) Lamellar at xB = 0.5, (B) perforated lamellar at xB = 0.4, (C) tubular lamellar at xB = 0.3 (lower temperature region), (D) tubular at xB = 0.35, (E) tubular disordered at xB = 0.3 (higher temperature region), and (F) droplet phases at xB = 0.2. The figure is reproduced from Tasios et al. [34] with permission from Copyright 2017 by The American Physical Society.
Membrane formation in mixtures with antagonistic salts was also confirmed by neutron spin echo (NSE) spectroscopy, which could observe structural fluctuations in the scale of nanometers [24]. Figure 7A indicates an NSE result for D2O/3MP/NaBPh4 mixture (ϕ3MP = 0.09, Csalt = 85 mmol/L, and T = 293.2 K). The observed intermediate correlation function can be explained using the formula proposed by Zilman and Granek [40]:
where Γ and t denote the relaxation rate and Fourier time, respectively. In the case of membrane undulation, Γ is proportional to Q3:
where κNSE and ηvis denote the bending modulus of the membrane and the viscosity of the surrounding medium, respectively. As shown in Figure 7B, Γ is proportional to Q3. This evidence supports the idea that the nanostructure in the mixture with an antagonistic salt behaves as a membrane.
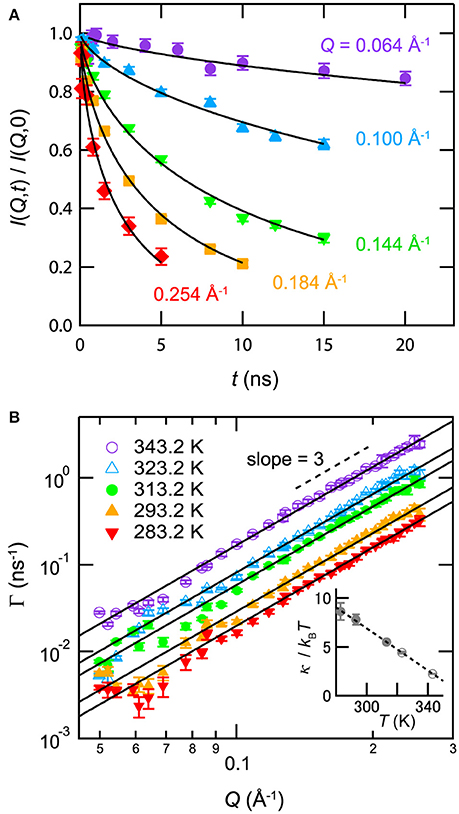
Figure 7. (A) Normalized intermediate correlation functions I(Q, t)/I(Q, 0) for the mixture of D2O/3MP/NaBPh4 (Csalt = 85 mmol/L, ϕ3MP = 0.09, and T = 293.2 K). The solid lines indicate fitting results according to Equation (7). (B) Q dependence of the relaxation rate Γ obtained from the fit of I(Q, t)/I(Q, 0) according to Equation (7) for mixture of D2O/3MP/NaBPh4 (Csalt = 85 mmol/L, ϕ3MP = 0.09, and 283.2K ≤ T ≤ 343.2K). The closed and open symbols indicate data for the lamellar phase and the sponge phase, respectively. The solid lines are the fitting results according to Equation (8). The inset in (B) shows the temperature dependence of κNSE/kBT according to Equation (8). The closed and open symbols indicate data for the lamellar phase and the sponge phase, respectively. The dashed line is a visual guide. Error bars denote ±1 standard deviation. The figure is partly reproduced from Sadakane et al. [24] with permission from Copyright 2013 AIP Publishing LLC.
The inset of Figure 7B shows the temperature dependence of κNSE/kBT according to Equation (7). κNSE/kBT decreases linearly with increasing temperature. It is noted that the value of κNSE obtained from Equation (7) in surfactant systems deviates from the actual value because of the difference between the viscosity of water ηvis and the effective viscosity of bulk water near the membrane ηeff: in many cases, κNSE approaches a reasonable value when ηeff is substituted with ηeff ≈ 3ηvis [41–45]. Similarly, the values of κNSE/kBT in the present case can deviate from reasonable values. In addition, the long-range electrostatic repulsion between membranes can suppress fluctuation [46], thereby increasing the value of κNSE from the actual value.
As shown in Figure 2A, a two-phase region exists in the mixture of D2O/3MP with NaBPh4 below 15 mmol/L. In the case of the binary D2O/3MP mixture without salt, “normal critical opalescence” is shown in the vicinity of the critical point; i.e., the mixture becomes milky-white due to critical concentration fluctuation. On the other hand, it was found in 2007 that a mixture with NaBPh4 (Csalt < 15 mmol/L) became blue far from the phase separation temperature and that the color changed to green and orange with increasing temperature (see Figure 8) [16]. This result suggests that a periodic structure whose characteristic repeat distance was comparable to the wavelength of visible light was formed, and its repeat distance increased with increasing temperature.
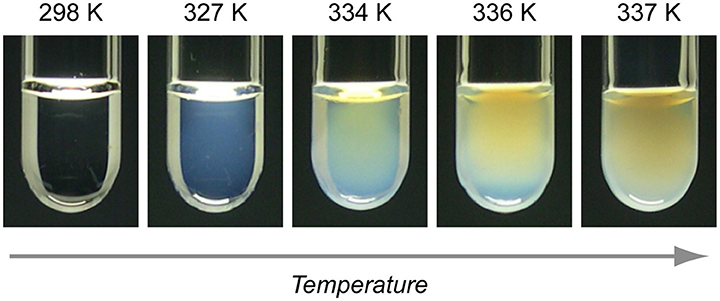
Figure 8. Result of visual inspection of D2O/3MP/NaBPh4 mixture (ϕ3MP = 0.35 and Csalt = 13 mmol/L). The mixture is blue at T = 327K, green at 334 K, and orange at 337 K. The figure is reproduced from Sadakane et al. [16] (Copyright 2007 by The Physical Society of Japan). As per the copyright holder's policies, no permission is required for the use of figures by the authors of the original article.
The nanometer scale structures formed in such mixtures were investigated by SANS in 2011. As shown in Figure 9A, SANS profiles for the mixture of D2O/3MP (ϕ3MP = 0.35) follow the Ornstein-Zernike equation [47], suggesting that D2O-rich and 3MP-rich domains are distributed randomly and the critical concentration fluctuation occurs without forming ordered structure [22]. On the other hand, SANS profiles of D2O/3MP/NaBPh4 (ϕ3MP = 0.35 and Csalt = 6 mmol/L) mixture were explained by the model scattering function of the CDW structure [8, 17, 20]:
where I0 denotes forward scattering proportional to the osmotic compressibility, ξ the correlation length of concentration fluctuation, λD the Debye screening length, and γp ≥ 0 a dimensionless parameter related to the difference in solubility between cations and anions in polar solvents, i.e., water (see Figure 9B). It is noted that Equation (9) corresponds to the Ornstein-Zernike equation when γp = 0. According to the theoretical study by Onuki and Kitamura in 2004 [8], it is suggested that a semi-micro-scale long-range periodic structure is formed as the CDW structure due to strong coupling between the concentration fluctuation of solvents and the preferential solvation of ions.
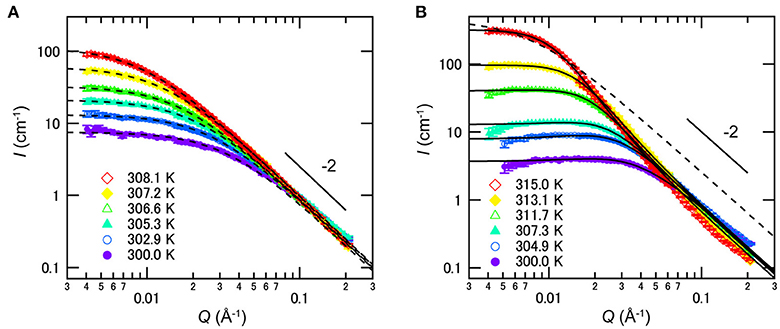
Figure 9. Temperature dependences of SANS profiles of mixtures of D2O/3MP (ϕ3MP = 0.35) (A) without NaBPh4 and (B) with 6 mmol/L of NaBPh4. The dashed and solid lines are fitting results according to the Ornstein-Zernike equation [47] and Equation (9), respectively. Error bars in the SANS profiles denote ±1 standard deviation. The figure is reproduced from Sadakane et al. [22] (Copyright The Royal Society of Chemistry 2011). As per the copyright holder's policies, no permission is required for the use of figures by the authors of the original article.
Formation of the CDW structure was also observed in the mixtures of water/3MP/PPh4Cl [23], water/2,6-dimethylpyridine/polystyrene/NaBPh4 [27], water/ethanol/1-octane/antagonistic salts (NaBPh4 and sodium thiocyanate) [28], water/2,6-dimethylpyridine/tetraheptylammonium bromide [30], and water/acetonitrile/NaBPh4 [31] by means of small-angle X-ray scattering (SAXS). Figure 10 shows the example of the SAXS profiles for the H2O/acetonitrile/NaBPh4 mixtures [31]. The profiles for the binary H2O/acetonitrile (Figure 10A) was well explained by the Ornstein-Zernike equation, suggesting that no ordered structure was formed in the mixture. On the other hand, profiles of the mixture of H2O/acetonitrile with 50 mmol/L NaBPh4 (Figure 10B) indicated that the CDW structure was formed since the Bragg peak arising from the long-range periodic structure was shown. Here, Bier et al. claimed that the long-range monopole-dipole interaction between solvents and ions is a key factor in the formation of the CDW structure [31].
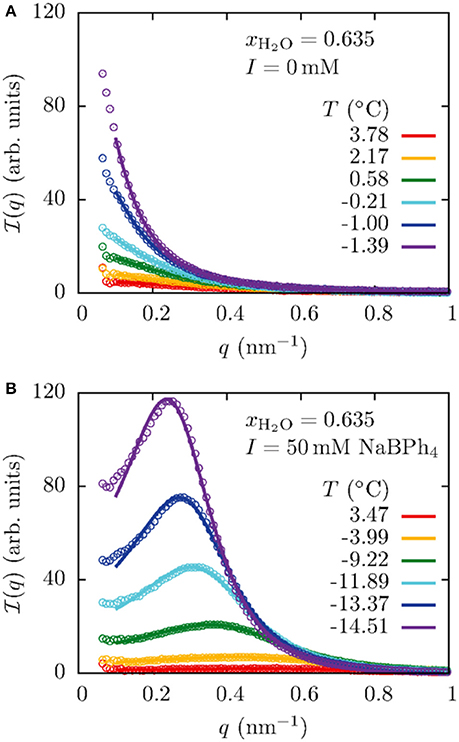
Figure 10. (A) Temperature dependence of the SAXS profiles of the H2O/acetonitrile mixture. q denotes the momentum transfer and xH2O the mole fraction of water in the mixture. The solid lines show fitting results according to the Ornstein-Zernike equation. (B) Temperature dependence of the SAXS profiles for the mixture H2O/acetonitrile with 50 mmol/L of NaBPh4. The solid lines show the fitting result according to the model scattering function for the charge-density-wave structure, taking into account the effect of the long-range monopole-dipole interaction between solvents and ions [31]. The figure is reproduced from Bier et al. [31] with permission from Copyright 2017 by The American Physical Society.
The detailed morphology of the CDW structure was numerically examined by Araki and Onuki based on the Ginzburg-Landau theory [10, 11, 48, 49]. In their model, large concentration fluctuation of solvents is taken into account, unlike in Figure 5. Typical results of the simulation are shown in Figure 11. The stretched water-rich and organic solvent-rich domains are distributed periodically in the mixture. Then, hydrophilic cations are present on the surfaces of the organic solvent-rich domains, whereas hydrophobic anions exist inside the organic solvent-rich domains. These images are similar to the bicontinuous structures formed in surfactant mixtures. In this case, the organic solvent-rich domains and hydrophobic anions can be regarded as a membrane, similar to the lamellar and sponge structures shown in section 3.
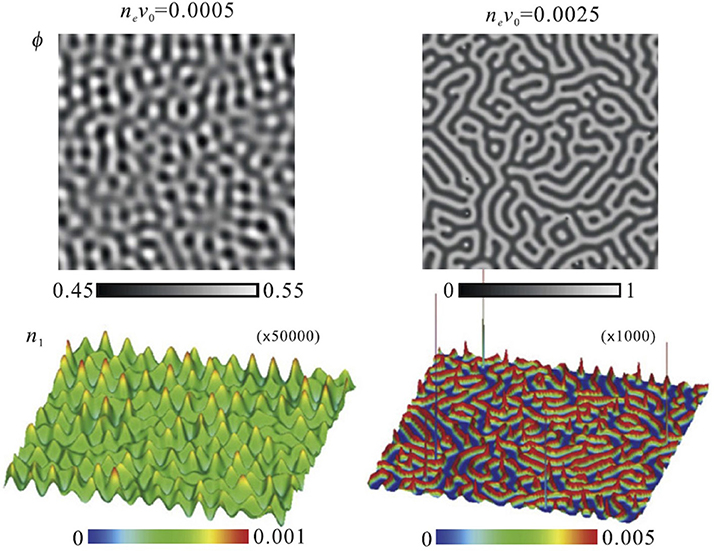
Figure 11. Morphologies of concentration fluctuation (upper figures) and charge density (lower figures) in the charge-density-wave phase obtained by Araki and Onuki by numerical simulation. ϕ, n1, ne, and v0 are the volume fraction of water in the mixture, the cation density, the average ion density, and the solvent molecular volume, respectively. The figure is reproduced from Araki and Onuki [10] with permission from Copyright 2009 IOP 1 Publishing Ltd.
The evidence that water-rich and organic solvent-rich domains are stretched as 2-dimensional planes could be confirmed in the critical phenomena. In the near-critical region, the temperature dependence of ξ follows [47]
where ξ0 denotes the bare correlation length, Tc the critical temperature, and ν the critical index for ξ. In most cases of simple liquid mixtures (including the D2O/3MP mixture), ν indicates the value of the 3D-Ising universality class, i.e., ν = 0.63 [50]. On the other hand, SANS measurements of D2O/3MP mixtures revealed that the value of ν changes from 0.63 (3D-Ising) to 1.00 (2D-Ising) with the addition of an antagonistic salt (see Figure 12) [22]. Thus, it was interpreted that the concentration fluctuation of D2O and 3MP has the 2-dimensional nature in the presence of NaBPh4. This tendency is consistent with the idea that water-rich and organic solvent-rich domains are stretched in planes in the CDW, as mentioned above.
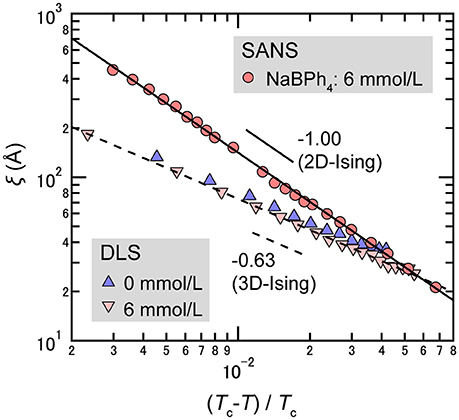
Figure 12. Temperature dependence of ξ for mixtures of D2O/3MP (ϕ3MP = 0.35) and D2O/3MP/NaBPh4 (ϕ3MP = 0.35 and Csalt = 85 mmol/L). The circles are data obtained by SANS measurements [22], while the triangles and the inverted triangles are data obtained by DLS measurements [25].
However, it should be pointed out that this interpretation is contradicted by the results of dynamic light scattering (DLS) measurements [25], shown in Figure 12; the value of ν is 0.63 even in the presence of NaBPh4 (6 mmol/L). A possible reason for the discrepancy in critical behavior could be the fact that the correlation lengths observed from SANS and DLS are quite different. The correlation length observed from SANS may be modified because the values observed are comparable to the length scale of the periodic structure and the Debye correlation length. This point has not yet been clarified and is subject to debate.
In this article, the formation of the ordered structures induced by antagonistic salts in the water/organic solvent mixtures has been reviewed. Hydrophilic and hydrophobic ions preferentially dissolve in polar and less-polar solvents, respectively, and stabilize the interface between these solvents through the Coulomb interaction. Thus, the interfacial tension decreases and a microphase separation is induced. In the water-rich region of the water/organic solvent/antagonistic salt mixtures (e.g., the water/3MP/NaBPh4 and the water/2,6-dimethylpyridine/NaBPh4 mixtures), the lamellar and the sponge structures were observed by optical microscopy, small-angle neutron scattering (SANS), and neutron spin echo (NSE). In such phases, it was assumed that the membrane is composed of organic solvent and hydrophobic ions. The formation of the lamellar structure was also confirmed by the numerical simulations taking into account the effect of the electrostatic interaction arising from ions. On the other hand, the formation of the charge-density-wave (CDW) structure was confirmed in near-critical regions of the water/organic solvent/antagonistic salt mixtures (e.g., the water/3MP/NaBPh4 and the water/acetonitrile/NaBPh4 mixtures) by SANS and small-angle X-ray scattering (SAXS). Furthermore, it was suggested that the organic solvent-rich domains behave as a membrane in the CDW phase, as in the case of the lamellar or the sponge phase. These series of findings will motivate further theoretical and experimental investigations for exploring the nature of the self-organization of soft materials containing ions or polyelectrolytes.
KS and HS wrote the paper.
The authors declare that the research was conducted in the absence of any commercial or financial relationships that could be construed as a potential conflict of interest.
We would like to express our gratitude to our collaborators, Prof. Onuki, Prof. Shibayama, Prof. Nishida, Prof. Koizumi, Dr. Nagao, Prof. Endo, and the late Dr. Y. B. Melnichenko. We also appreciate various grants to support our research activities and the neutron scattering beamtime awarded.
1. Eckfeldt EL, Lucasse WW. The liquid-liquid phase equilibria of the system cyclohexane-methyl alcohol in the presence of various salts as third components. J Phys Chem. (1943) 47:164–83.
2. Hales BJ, Bertrand GL, Hepler LG. Effects of 3rd components on critical mixing in water-triethylamine system. J Phys Chem. (1966) 70:3970–5.
3. Takamuku T, Yamaguchi A, Matsuo D, Tabata M, Yamaguchi T, Otomo T, et al. Nacl-induced phase separation of 1,4-dioxane-water mixtures studied by large-angle X-ray scattering and small-angle neutron scattering techniques. J Phys Chem B (2001) 105:10101–10. doi: 10.1021/jp011692w
4. Misawa M, Yoshida K, Maruyama K, Munemura H, Hosokawa Y. Salt-induced phase separation in aqueous solution. J Phys Chem Solids (1999) 60:1301–6.
7. Sadakane K, Fujii K, Tsuzuki S, Watanabe H, Umebayashi Y. Solvation state of sodium tetraphenylborate in 3-methylpyridine and its aqueous solutions. J Mol Liq. (2017) 248:53–9. doi: 10.1016/j.molliq.2017.10.006
8. Onuki A, Kitamura H. Solvation effects in near-critical binary mixtures. J Chem Phys. (2004) 121:3143–51. doi: 10.1063/1.1769357
9. Onuki A. Surface tension of electrolytes: hydrophilic and hydrophobic ions near an interface. J Chem Phys. (2008) 128:224704. doi: 10.1063/1.2936992
10. Araki T, Onuki A. Dynamics of binary mixtures with ions: dynamic structure factor and mesophase formation. J Phys Condens Matter (2009) 21:424116. doi: 10.1088/0953-8984/21/42/424116
11. Onuki A, Araki T, Okamoto R. Solvation effects in phase transitions in soft matter. J Phys Condens Matter (2011a) 23:284113. doi: 10.1088/0953-8984/23/28/284113
12. Onuki A, Okamoto R. Selective solvation effects in phase separation in aqueous mixtures. Curr Opin Coll Interface Sci. (2011) 16:525–33. doi: 10.1016/j.cocis.2011.04.002
13. Onuki A, Yabunaka S, Araki T, Okamoto R. Structure formation due to antagonistic salts. Curr Opin Coll Interface Sci. (2016) 22:59–64. doi: 10.1016/j.cocis.2016.02.007
14. Onuki A. Ginzburg-landau theory of solvation in polar fluids: ion distribution around an interface. Phys Rev E Stat Nonlin Soft Matter Phys. (2006) 73:021506. doi: 10.1103/PhysRevE.73.021506
15. Luo GM, Malkova S, Yoon J, Schultz DG, Lin BH, Meron M, et al. Ion distributions near a liquid-liquid interface. Science (2006) 311:216–8. doi: 10.1126/science.1120392
16. Sadakane K, Seto H, Endo H, Shibayama M. A periodic structure in a mixture of D2O/3-methylpyridine/NaBPh4 induced by solvation effect. J Phys Soc Jpn. (2007) 76:113602. doi: 10.1143/JPSJ.76.113602
17. Bier M, Harnau L. The structure of fluids with impurities. Z Phys Chem. (2012) 226:807–14. doi: 10.1524/zpch.2012.0260
18. Bier M, Gambassi A, Dietrich S. Local theory for ions in binary liquid mixtures. J Chem Phys. (2012) 137:034504. doi: 10.1063/1.4733973
19. Pousaneh F, Ciach A, Maciolek A. Effect of ions on confined near-critical binary aqueous mixture. Soft Matter (2012) 8:7567–81. doi: 10.1039/C2SM25461A
20. Pousaneh F, Ciach A. The effect of antagonistic salt on a confined near-critical mixture. Soft Matter (2014) 10:8188–201. doi: 10.1039/c4sm01264j
21. Sadakane K, Onuki A, Nishida K, Koizumi S, Seto H. Multilamellar structures induced by hydrophilic and hydrophobic ions added to a binary mixture of D2O and 3-methylpyridine. Phys Rev Lett. (2009) 103:167803. doi: 10.1103/PhysRevLett.103.167803
22. Sadakane K, Iguchi N, Nagao M, Endo H, Melnichenko YB, Seto H. 2D-Ising-like critical behavior in mixtures of water and 3-methylpyridine including antagonistic salt or ionic surfactant. Soft Matter (2011) 7:1334–40. doi: 10.1039/C0SM00598C
23. Sadakane K, Horikawa Y, Nagao M, Seto H. The effect of tetraphenylphosphonium chloride on phase behavior and nanoscale structures in a mixture of D2O and 3-methylpyridine. Chem Lett. (2012) 41:1075–7. doi: 10.1246/cl.2012.1075
24. Sadakane K, Nagao M, Endo H, Seto H. Membrane formation by preferential solvation of ions in mixture of water, 3-methylpyridine, and sodium tetraphenylborate. J Chem Phys. (2013) 139:234905. doi: 10.1063/1.4838795
25. Leys J, Subramanian D, Rodezno E, Hammouda B, Anisimov MA. Mesoscale phenomena in solutions of 3-methylpyridine, heavy water, and an antagonistic salt. Soft Matter (2013) 9:9326–34. doi: 10.1039/C3SM51662H
26. Sadakane K, Endo H, Nishida K, Seto H. Lamellar/disorder phase transition in a mixture of water/2,6-dimethylpyridine/antagonistic salt. J Solution Chem. (2014) 43:1722–31. doi: 10.1007/s10953-014-0240-x
27. Samin S, Hod M, Melamed E, Gottlieb M, Tsori Y. Experimental demonstration of the stabilization of colloids by addition of salt. Phys Rev Appl. (2014) 2:024008. doi: 10.1103/PhysRevApplied.2.024008
28. Marcus J, Touraud D, Prévost S, Diat O, Zemb T, Kunz W. Influence of additives on the structure of surfactant-free microemulsions. Phys Chem Chem Phys. (2015) 17:32528–38. doi: 10.1039/C5CP06364G
29. Michler D, Shahidzadeh N, Westbroek M, van Roij R, Bonn D. Are antagonistic salts surfactants? Langmuir (2015) 31:906–11. doi: 10.1021/la504801g
30. Witala M, Lages S, Nygård K. Mesoscale ordering in binary aqueous solvents induced by ion size asymmetry. Soft Matter (2016) 12:4778–82. doi: 10.1039/c6sm00580b
31. Bier M, Mars J, Li H, Mezger M. Salt-induced microheterogeneities in binary liquid mixtures. Phys Rev E (2017) 96:022603. doi: 10.1103/PhysRevE.96.022603
32. Silver BR, Holub K, Marecek V. Spontaneous emulsification at surfactantless liquid/liquid interfaces. J Electroanal Chem. (2017) 805:91–7. doi: 10.1016/j.jelechem.2017.10.027
33. Winkler R, Buchecker T, Hastreiter F, Touraud D, Kunz W. PPh4Cl in aqueous solution–the aggregation behavior of an antagonistic salt. Phys Chem Chem Phys. (2017) 19:25463–70. doi: 10.1039/C7CP02677C
34. Tasios N, Samin S, van Roij R, Dijkstra M. Microphase separation in oil-water mixtures containing hydrophilic and hydrophobic ions. Phys Rev Lett. (2017) 119:218001. doi: 10.1103/PhysRevLett.119.218001
35. Narayanan T, Kumar A. Reentrant phase-transitions in multicomponent liquid-mixtures. Phys Rep Rev Sect Phys Lett (1994) 249:136–218.
36. Nallet F, Laversanne R, Roux D. Modeling x-ray or neutron-scattering spectra of lyotropic lamellar phases - interplay between form and structure factors. J Phys II (1993) 3:487–502.
37. Lei N, Safinya C, Roux D, Liang K. Synchrotron x-ray-scattering studies on the sodium dodecyl sulfate-water-pentanol-dodecane l3 sponge phase. Phys Rev E (1997) 3:608–13.
38. Porcar L, Hamilton WA, Butler PD, Warr GG. Scaling of structural and rheological response of l-3 sponge phases in the “sweetened” cetylpyridinium/hexanol/dextrose/brine system. Langmuir (2003) 19:10779–94. doi: 10.1021/la034661w
39. Roux D, Coulon C, Cates ME. Sponge phases in surfactant solutions. J Phys Chem. (1992) 96:4174–87.
40. Zilman AG, Granek R. Undulations and dynamic structure factor of membranes. Phys Rev Lett. (1996) 77:4788–91.
41. Takeda T, Kawabata Y, Seto H, Komura S, Ghosh SK, Nagao M, et al. Neutron spin-echo investigations of membrane undulations in complex fluids involving amphiphiles. J Phys Chem Solids (1999) 60:1375–7.
42. Yi Z, Nagao M, Bossev DP. Bending elasticity of saturated and monounsaturated phospholipid membranes studied by the neutron spin echo technique. J Phys Condens Matter (2009) 21:155104. doi: 10.1088/0953-8984/21/15/155104
43. Nagao M. Observation of local thickness fluctuations in surfactant membranes using neutron spin echo. Phys Rev E (2009) 80:031606. doi: 10.1103/PhysRevE.80.031606
44. Watson MC, Brown FLH. Interpreting membrane scattering experiments at the mesoscale: the contribution of dissipation within the bilayer. Biophys J. (2010) 98:L9–11. doi: 10.1016/j.bpj.2009.11.026
45. Lee JH, Choi SM, Doe C, Faraone A, Pincus PA, Kline SR. Thermal fluctuation and elasticity of lipid vesicles interacting with pore-forming peptides. Phys Rev Lett. (2010) 105:038101. doi: 10.1103/PhysRevLett.105.038101
47. Stanley HE, (ed.). Introduction to Phase Transitions and Critical Phenomena. Oxford: Oxford University Press (1971).
48. Onuki A, Okamoto R, Araki T. Phase transitions in soft matter induced by selective solvation. Bull Chem Soc Jpn. (2011b) 84:569–87. doi: 10.1246/bcsj.20110012
49. Onuki A, Araki T. Selective solvation in aqueous mixtures: interface deformations and instability. J Phys Soc Jpn. (2012) 81:SA004. doi: 10.1143/JPSJS.81SA.SA004
Keywords: soft matter, self-organization, intermembrane interaction, solvation effect, antagonistic salt, small-angle neutron scattering, neutron spin echo
Citation: Sadakane K and Seto H (2018) Membrane Formation in Liquids by Adding an Antagonistic Salt. Front. Phys. 6:26. doi: 10.3389/fphy.2018.00026
Received: 29 November 2017; Accepted: 01 March 2018;
Published: 27 March 2018.
Edited by:
Alokmay Datta, University of Calcutta, IndiaReviewed by:
Aurora Hernandez-Machado, Universitat de Barcelona, SpainCopyright © 2018 Sadakane and Seto. This is an open-access article distributed under the terms of the Creative Commons Attribution License (CC BY). The use, distribution or reproduction in other forums is permitted, provided the original author(s) and the copyright owner are credited and that the original publication in this journal is cited, in accordance with accepted academic practice. No use, distribution or reproduction is permitted which does not comply with these terms.
*Correspondence: Hideki Seto, hideki.seto@kek.jp
Koichiro Sadakane, ksadakan@mail.doshisha.ac.jp
Disclaimer: All claims expressed in this article are solely those of the authors and do not necessarily represent those of their affiliated organizations, or those of the publisher, the editors and the reviewers. Any product that may be evaluated in this article or claim that may be made by its manufacturer is not guaranteed or endorsed by the publisher.
Research integrity at Frontiers
Learn more about the work of our research integrity team to safeguard the quality of each article we publish.