Femtosecond Laser Fabricated Ag@Au and Cu@Au Alloy Nanoparticles for Surface Enhanced Raman Spectroscopy Based Trace Explosives Detection
 Moram Sree Satya Bharati
 Chandu Byram
 Venugopal R. Soma
- Advanced Centre of Research in High Energy Materials, University of Hyderabad, Hyderabad, India
Herein we present results from our detailed studies on the fabrication of Ag@Au and Cu@Au alloy nanoparticles (NPs) using the femtosecond laser ablation in liquid technique. The NPs were obtained by ablating the pure Ag, Cu targets (bulk) in HAuCl4 (5 mM) solution. The absorption properties of the obtained NPs colloids were characterized using UV-Visible absorption spectrometer and their size, shape, and crystallinity were investigated using the XRD, FESEM and TEM techniques. The fabricated NPs were utilized for sensing of explosive molecules such as 2,4,6-trinitrophenol (PA), 2,4-dinitrotoluene (DNT) and a common dye methylene blue (MB) using the surface enhanced Raman spectroscopy (SERS) technique. The detection limit in terms of weight was as low as few nano-grams in the case of nitroaromatic explosive compounds (PA, DNT) and few picograms in the case of a common dye molecule (MB). Typical enhancement factors achieved were estimated to be ~104, ~105, and ~107, respectively, for PA, DNT, and MB. The significance of the present work lies in exploring the performance of the prepared NPs being used as SERS substrates for explosives detection using a portable Raman instrument. Such capability enables one to carry the spectrometer to the point of interest in the field and evaluate any hazardous samples within a short period of time.
Introduction
Over the last decade fabrication of noble metal/alloy/bimetallic nanoparticles (NPs) has garnered considerable attention from the materials, physics, and chemistry research community owing to their tunable optical properties based on the composition of constituents. A variety of methods have been introduced to fabricate NPs during the last two decades such as a chemical methods including seed growth method, citrate reduction method, laser ablation in liquids (LAL) and electrochemical methods [1–7]. In recent years, LAL grown as a promising simple green technique to fabricate NPs in a single experiment. The properties of the NPs generated through laser ablation in liquids technique depends on the input laser source parameters (wavelength, repetition rate, pulse duration, focusing conditions, and input fluence) along with properties of the surrounding environment (the amount and nature of the liquid) [8–11]. The effect of pulse duration in the ablation mechanism is a complementary function. In case of short pulses (typically ≤ few tens of ps) the pulse duration is much shorter than the electron-phonon interaction time which offers faster cooling of ablated species and reduce the irregularity in the particle size with improved stability of the NPs when compared to that obtained with longer pulses (ns) [12]. Typically, with ns ablation one can achieve NPs only while with fs ablation one can achieve both NPs and nanostructures (NSs) in a single experiment [13]. Kabashin et al. reported the formation of gold NPs (3–10 nm) at a lower fluence which could be due to the thermal-free mechanism offered by fs pulses [14]. Link et al. showed that 100 fs pulses needed 100 times lower threshold for complete melting of Au nanorods into nanodots than the 7 ns pulses [15]. Hamad et al. reported the ablation of Cu target in different organic liquids resulted in various products of Cu NPs in acetone, CuCl NPs in DCM, CuO NPs in ACN and CuCl2 NPs in chloroform using ultrashort pulses [16]. Gold NPs with different sizes of ~13.6, ~7.6, ~6.5, and ~6.2 nm were achieved for input energies of ~200, ~300, ~400, and ~500 μJ using fs laser ablation [13]. Semaltianos et al. synthesized nanomaterials of II–VI semiconductors (CdSe, CdTe, ZnTe) by ablating the targets in different solvents and the nanoparticles obtained were in the range of ~5–6 nm [17]. Tsuji et al. reported the synthesis of Ag NPs in distilled water with average diameter decreasing from 29 to 12 nm with a decrease in the input laser wavelength (1,064, 532, or 355 nm) at 36 J/cm2 fluence [18]. One of the major applications of the metallic NPs is in surface enhanced spectroscopies [19]. SERS provides the vibrational fingerprint of the molecules adsorbed on the roughened metal surfaces due to the localized surface plasmon resonance (LSPR) and the charge transfer between the molecule and the NPs. Further, an intensified enhancement of the local electromagnetic field can be obtained when the NPs are close proximity to each other (hot spots). This enhancement allows the detection/identification of molecules even at a single molecule level [20, 21]. Demeritte et al. reported the detection of TNT (100 fM) molecules using popcorn-shaped Au NPs functionalized with single walled carbon nanotubes [22]. Chen et al. detected ammonium nitrate (AN) and RDX with EF of ~7.0 × 10⁴ using a monolayer of ordered Au NPs on Si substrates [23]. Our group has recently demonstrated the detection of several explosives such as picric acid (5 μM), AN (50 μM) using gold nanoparticles and nanostructures [13], ammonium perchlorate (10 μM) using Ag decorated Silicon nanowires [24], FOX-7 (5 μM) and 1NPZ (20 nM) [25], ANTA (1 μM) and TNT with E.F.'s >105 [26] using femtosecond laser fabricated NPs/NSs. Furthermore, we have also reported the detection of 2, 4-Dinitrotoluene using Ag-Au nanostructures achieved using femtosecond laser ablation [13]. Recently, composite nanoparticles have attracted much attention by physicists, chemists and material scientists due to their higher catalytic, electronic, optical, physicochemical properties and multiple functionalities [2, 27–34]. To fabricate bimetallic/alloy NPs, there are several ways or (a) short pulse laser irradiation of colloidal mixture of NPs (b) ablation of a target in the presence of a precursor solution or (c) short pulse laser irradiation of alloy target in liquid media etc. Xu et al. recently reported the synthesis of Ag@Au NPs through laser-induced photochemical reaction by placing an Au target in AgNO3 solution [32]. Hajiesmaeilbaigi et al. have demonstrated the formation of Au-Ag NPs under laser irradiation of a mixture of the pure colloidal solution [35]. Podagatlapalli et al. synthesized Ag-Au bimetallic NPs by ultrafast laser ablation of Ag-Au target prepared from the mixture of bulk Ag and Au targets [25]. Plasmonic metals such as Ag and Cu have a strong plasmonic effect but both suffer from instability due to oxidation effects. Au has chemical stability against surface oxidation and possesses higher biocompatibility. By captivating the merits of individual metals, in this work we report the synthesis and characterization of Ag@Au, Cu@Au NPs by laser ablation of the metal target (Ag, Cu) in HAuCl4 solution. The fabricated NPs are then utilized to detect the explosives such as PA, DNT at lower concentrations using portable Raman spectrometer. SERS data was obtained with a portable Raman device with a rapid screening time (of typically few minutes) for the explosive, dye samples of DNT, PA, and MB with the corresponding concentration of 1 × 10⁻⁶ M, 5 × 10⁻⁶ M, and 5 × 10⁻⁹ M, which in terms of mass represents 1.82 ng, 11.45 ng, and 16 pg, respectively.
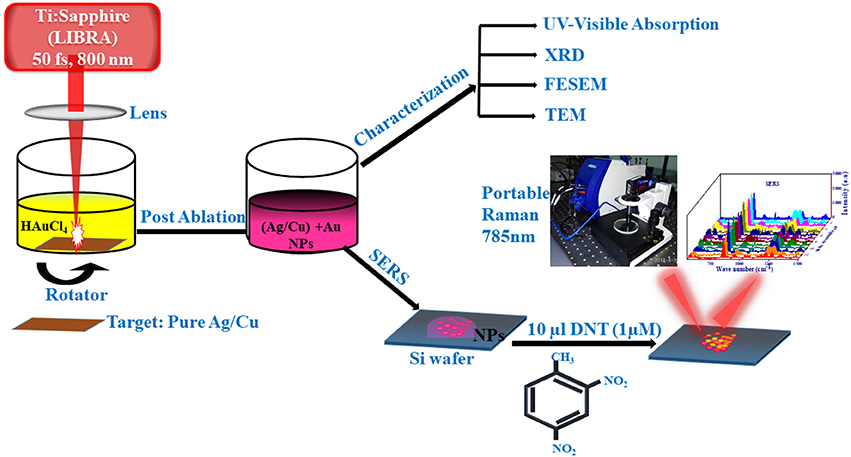
Graphical Abstract. Schematic of the fs ablation procedure and the SERS measurements using a portable Raman spectrometer.
Experimental Details
Chemicals and Materials
The silver (>99% pure) and copper targets (>99% pure) with thickness of 1 mm, tetrachloroauric (III) acid (HAuCl4 4H2O) ≥99.9% trace metals basis, methanol (reagent grade), acetone (reagent grade), methylene blue (C16H18ClN3S·xH2O) were purchased from Sigma Aldrich. The explosive molecules of 2,4,6-trinitrophenol (PA), 2,4-dinitrotoluene (DNT) were provided by HEMRL (Pune, India) for SERS detection.
Preparation of Ag@Au and Cu@Au NPs
Pure Ag and Cu substrates were cleaned with acetone, ethanol and deionized water sequentially in an ultrasonic cleaner for 15 min to remove any organic dopants from the surface. Then the samples were ablated with a regenerative fs amplifier (Ti: Sapphire, LIBRA) delivering ~50 fs at 800 nm with a repetition rate of 1 kHz. An input pulse energy of ~300 μJ was used for the ablation experiments. The input laser beam (diameter of ~14 mm) was focused onto the sample using a convex lens with a focal length of 100 mm. The intensity profile of the laser pulses was Gaussian, with an estimated <140 μm beam waist on the target surface. We have estimated the effective spot size (beam waist) according to the method proposed by Barcikowski et al. [12]. This value is slightly over-estimated since the ablation process in the present case is a result of several overlapping pulses. Accurate value of the spot size will be obtained when the ablation is performed with a single pulse. Therefore, we believe that the fluences estimated using these values are slightly under-estimated. Since we are not quantitatively measuring any quantity in this work, the reported values of fluences could be considered with an error of ±20% due to the uncertainty in the spot size estimation. The target (Ag/Cu) was placed at the bottom of the glass dish and was covered with a layer of 10 ml HAuCl4 (5 mM) with liquid height above the sample being 6 mm. The surface of the target was adjusted by observing the intense plasma plume generated by the focused laser pulses and by listening to the sound produced. Verification experiments were performed initially using a He-Ne laser to exactly obtain the plane where the focus is located. However, when we shift to 800 nm, there will be a small change in the focal plane. The Ag and Cu targets immersed in a liquid were placed normal to the laser beam and is rotated to avoid deposition of NPs onto a substrate and is expected to result in a higher production rate of the NPs in the liquid. We observed that the liquid in which the ablation was carried out turned into dark pink and dark brown color due to the replacement reaction between ablated Ag/Cu ions from target and Au ions from the precursor solution. Following the ablation procedure, the colloidal solutions were centrifuged at 3,500 rpm for 15 min. Later, the NPs were washed with deionized water for several times and dispersed in 5 ml distilled water using in an ultrasonic bath for 5 min. The prepared NPs were preserved in air tightened glass vials and stored to prevent the oxidation.
Characterization of Ag@Au and Cu@Au NPs
The formation of bimetallic NPs was confirmed by studying the absorption spectra using an UV–Visible absorption spectrophotometer (Perkin Elmer, Lambda 750). The X-ray diffraction patterns were recorded using a powder X-ray diffractometer (Discover D8 diffractometer of Bruker, Germany) with Cu Kα radiation (λ = 0.15408 nm). The NPs morphology was investigated using TEM (FEI Tecnai G2 S-Twin) with an electron-accelerating voltage of 200 kV. Further, elemental mapping on the fabricated NPs was achieved using high-resolution energy dispersive x-ray spectroscopy (EDS) unit connected to field emission scanning electron microscope (FESEM) (Carl Zeiss model Merlin compact 6027) operated with beam voltage 30 kV.
Preparation of Analyte Solutions
The analyte molecules 2,4,6-trinitrophenol (Picric Acid, PA dissolved in methanol), 2,4-dinitrotoluene (DNT, dissolved in acetone) and a dye methylene blue (MB, dissolved in methanol) were prepared in stock solution with the concentration of 0.1 M. The lower concentrations of analyte molecules (10−3 to 10−9 M) were prepared by further dilution of the stock solution.
Fabrication of SERS Substrates and SERS Measurements
Silicon (Si) was taken as a base to prepare SERS substrate because the metal NPs are tightly immobilized to prevent any aggregation. Before drop casting the NPs, Si wafers were cleaned with acetone and deionized water in an ultrasonic bath for 15 min. The SERS substrates were prepared by dropping the synthesized Ag@Au and Cu@Au NPs (typically 10 μl) on a cleaned Si wafer and was subsequently dried on the hot plate at 50°C. Later the analyte molecules such as PA (5 μM)/2, 4-DNT (1 μM)/MB (5 nM) were drop costed (typically 10 μl) on NPs films (NPs were earlier drop casted on Si surface). The Raman spectra were acquired with a portable Raman system (B&W Tek, USA) operated with a laser source at 785 nm and a maximum power of 300 mW. The collected SERS data was an average of 3 spectra and the integration time 5 s. Before the Raman measurements the intensity of the Raman peak at 520 cm−1 from silicon was normalized before each data acquisition.
Results and Discussions
UV-Visible Absorption Spectra
Figure 1 illustrates the normalized optical absorption spectra of the prepared NPs, and insets show the coloration of NPs. The appearance of a single SPR peak in the UV–Visible absorption spectrum clearly indicates the bimetallic Ag@Au and Cu@Au NPs formation. The absence of two plasmon peaks in the spectrum indicates that these NPs were not a mixture of individual metal NPs and also there is no core-shell formation [36, 37]. The SPR peak of Ag@Au NPs was observed at ~566 nm along with a redshift and broadening. This is not an intermediate position of pure Ag (~400 nm) and pure Au (~520 nm) NPs and this could be attributed to the variation in NPs shapes/sizes [38] and the concentration of precursor solution [6]. The SPR peak shift is primarily dependent on the size, shape and composition of nanoparticles [39]. The SPR peak of Cu@Au NPs was observed at 551 nm which was within the SPR peaks of Cu (~620 nm) and Au (~520 nm) NPs. The broad absorbance indicates the presence NPs with a wide size distribution by non-spherical shape, surface morphology and possible formation of nanoaggregates. Based on the previous reports, the absorption peak of bimetallic NPs shifted to a longer wavelength side due to the (i) concentration of precursor [32], (ii) irradiation energy, and (iii) time of exposure. Xu et al. fabricated the bimetallic Ag@Au nanocrystals and observed the red shift in the SPR peak (~858 nm) achieved using laser-induced photo-oxidation. Kuladeep et al. have recently demonstrated the formation of metal alloy NPs under direct laser irradiation of metal precursor solutions and observed a shift in absorption peak with different concentrations [40].
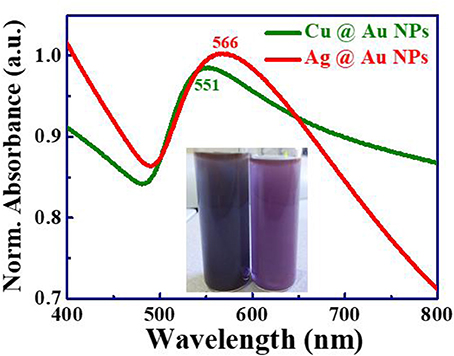
Figure 1. UV-Visible absorption spectra of Ag@Au NPs with SPR peak at 566 nm (red, top) and Cu@Au NPs with SPR peak at 551 nm (green, bottom) prepared in HAuCl4 5 mM solution (a.u. stands for arbitrary units).
XRD Characterization
For XRD measurements, the prepared NPs were drop cast on the Si wafer and dried using a hot plate. Figure 2 shows XRD spectra of synthesized bimetallic Ag@Au and Cu@Au NPs. The bimetallic phase of the NPs was confirmed by XRD peaks. In Figure 2 red color spectra indicate the XRD pattern of Ag@Au NPs and the main peaks are located at 38.4°, 44.6°, 64.8°, and 77.7°. These peaks are assigned to the crystal planes of (1 1 1), (2 0 0), (2 2 0) and (3 1 1). Due to the similarities in lattice constants of Ag and Au [Au (0.40786 nm) and Ag (0.40862 nm)] one cannot distinguish the phases of Ag@Au alloy/bimetallic NPs based on only XRD data (JCPDS file number Ag: 03-0921, Au: 04-0784). Figure 2 depicts the XRD spectra of Cu@Au NPs (green color) with the peaks observed at 38.3°, 44.6°, 64.7°, and 77.7° are attributed to the Au planes of (1 1 1), (2 0 0), (2 2 0) and (3 1 1) [JCPDS file: 04-0784].The other peaks positioned at 41.1°, 50.5°, 74.3° were corresponding to crystal planes (1 1 1), (2 0 0), and (2 2 0) of Copper (JCPDS file: 03-1005). The additional peaks of 27.9° and 31.1° show the presence of CuClO4 (JCPDS: 38-0594). The FESEM EDAX mapping also revealed that the presence of chlorine in Cu@Au NPs. XRD spectra from the drop cast NPs (i.e., NPs on Si) shows only some peaks with the small shift with respect to that of powder due to the preferred orientation of the lattice planes of the sample surface.
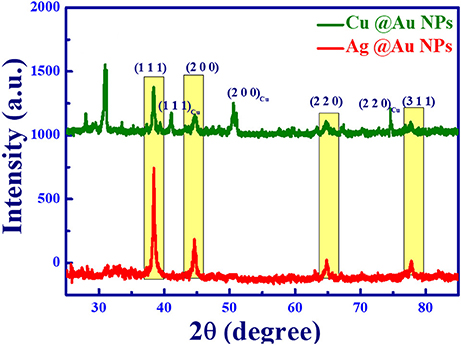
Figure 2. X-ray diffraction spectra of synthesized Ag@Au (Bottom) and Cu@Au (Top) NPs.
TEM Analysis
The morphology and crystallographic phases of Ag@Au and Cu@Au NPs was studied with TEM and HRTEM patterns. Figures 3A–D illustrate the TEM & HRTEM images of bimetallic Ag@Au and Cu@Au NPs, respectively. From the low magnification images of NPs presented in Figures 3A,C it is evident that the some of the particles are in quasi-spherical and few of them are interconnected with a chain like structure. This could be attributed to the high-pressure laser-induced plasma near the target-liquid surface. Lattice plane separations of Ag@Au NPs obtained through the HRTEM images are depicted in Figure 3B with an interplanar spacing of 0.14 nm for Ag, 0.204 nm for Au. Similarly, the d-spacing values of Cu@Au NPs were 0.13 nm, 0.207 nm for Cu and 0.223, 0.23 nm for Au NPs (in Figure 3D), respectively. The corresponding SAED patterns are shown in the inset of Figures 3B,D. The possible mechanism for the growth of bimetallic Ag@Au and Cu@Au NPs can be explained as follows. Briefly, the bimetallic NPs are controlled by laser-induced replacement reaction, rapid nucleation and growth processes. The fs laser pulses interact with precursor (HAuCl4) resulting in the formation of Au ions because of the higher reduction potential of AuCl4− species (0.93 V). When an intense laser pulse interacts with the solid target (Ag/Cu) huge amount of electrons are pulled out due to the inverse Bremsstrahlung and thermionic emission effects. Due to this the material will be short of electrons leading to the presence of excess ions. The ejected electrons oscillate and collide with atoms of target transferring some of the energy to surrounding lattice. At the focal point, plasma (atoms, clusters, electrons, ions, etc.) formed as a consequence of the ablated target surface heats up suddenly and vaporizes. Simultaneously, the pressure wave (shockwave) propagates below and above the target surface. As the time progresses, plasma plume cools down and transmission of energy to the surrounding medium triggers the formation of the cavitation bubble [containing both the ablated matter (Ag/Cu) and the liquid vapor (Au)], which expands to a maximum radius (typically ~1 mm) which then consumes the energy ending up in a collapse. The nanoparticles are ejected into the surrounding liquid following the collapse and nanostryctures are leftover on the target. With the presence of extreme conditions of high pressure and high temperature for a short period of time there is possibly a replacement reaction between ablated Ag and Au ions. The nucleation and growth rapidly occur leads to the formation of bimetallic/alloy NPs [41]. Due to high-intensity of the laser pulse the formation of bimetallic/alloy NPs is favored while suppressing the formation of metal segregation.
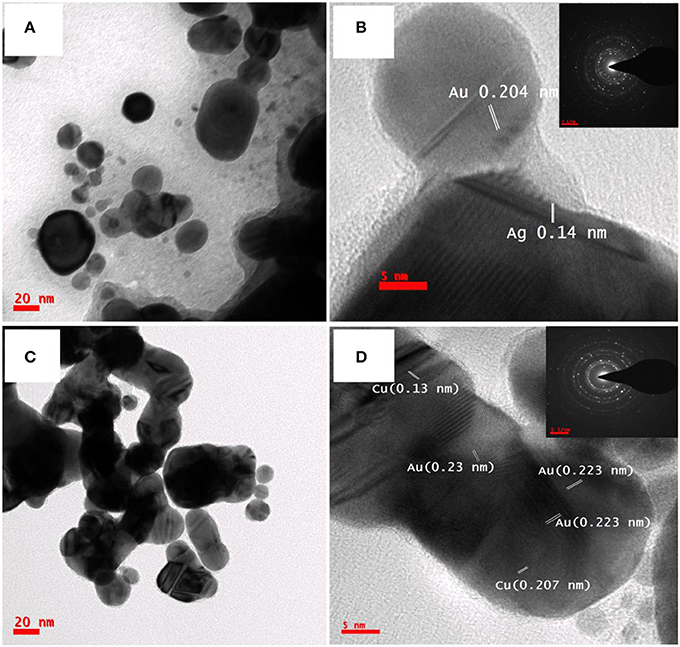
Figure 3. Low and high magnification TEM images of (A,B) Ag @Au NPs (C,D) Cu @Au NPs fabricated by laser ablation of Ag/Cu target in HAuCl4 (5 mM).
FESEM Analysis
To reveal the elemental distribution of synthesized bimetallic NPs, Energy Dispersive X-ray Spectroscopy (EDS) technique was employed along with FESEM characterization. In EDS, each element has a unique atomic structure with a unique set of X-ray emission peaks were produced by the interaction of a highly energetic electron beam with the sample. Figures 4A–F shows the FESEM analysis of Ag@Au NPs, formed due to the laser-induced replacement reaction between the ablated Ag ions ejected from the target and Au ions from the precursor solution. The EDS mapping conducted on a single particle is depicted in Figures 4C–E. The images clearly illustrate that the formation of bimetallic Ag@Au NPs wherein Ag (green color) is seen to be decorated on the surface of Au (red color). The line scan on a single particle is indicated in Figure 4F, which reveals that the NP is composed of Au rich center and decorated by Ag NPs. The Au mole fraction in bimetallic NPs depends on the concentration of the HAuCl4 solution. The atomic ratio of Ag@Au determined by FESEM - EDS measurements for the particle is 38:61 and the data shown in Figure 4B. The high weight percentage of gold may play a lead role in the stability of NPs. Due to the laser-induced replacement reaction between Cu and Au ions, the bimetallic Cu@Au NPs can possibly form. FESEM image and EDS mapping of Cu@Au NPs are depicted in Figures 5A–F, in which Cu and Au elemental mapping are shown in red and green colors (shown in Figures 5C–E) and we also observed a small amount of chlorine (data shown in Figure 5B). We believe that this could be due to the interaction of fs pulses with gold precursor solution resulting in the formation of Au, Cl radicals in the gold salt solution (HAuCl4). The presence of chlorine in Cu@Au NPs could possibly be due to the fast exchange reaction between the copper and chlorine compared to nobel metals (Ag, Au), where the latter are least reactive. This also supports the absence of chlorine in Ag@Au NPs. However, further detailed studies are essential to clearly identify the mechanism of this formation. EDS mapping revealed that the center rich Au covered Cu NPs are homogeneously distributed over the whole surface and the atomic ratio of the particle is 17:78 (Figure 5B). Thus, the EDS mapping results confirmed the formation of Ag@Au and Cu@Au alloys.
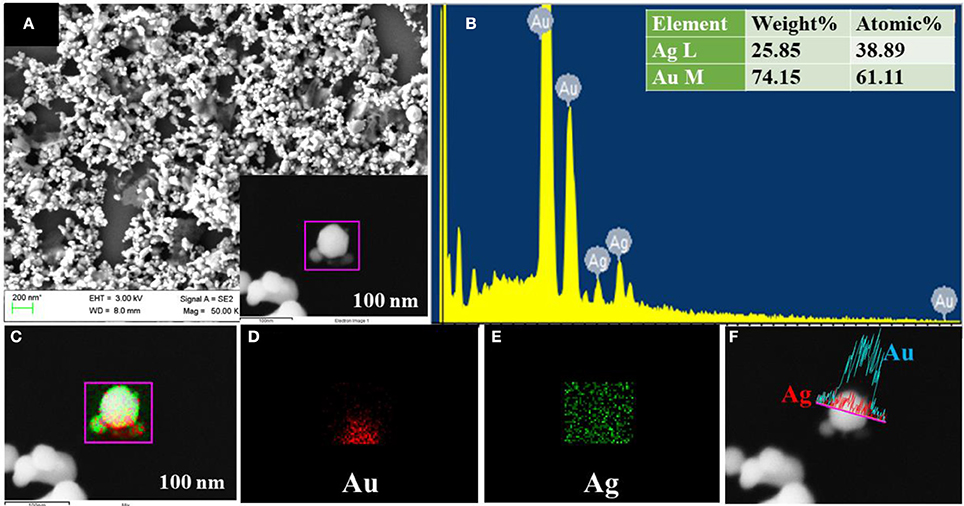
Figure 4. (A) FESEM image of Ag@Au NPs with the inset illustrating the single NP image in the 100 nm scale. (B) EDS spectra with inset depicting the wt % of individual elements. (C) EDS mapping image of the Ag @Au NPs. (D) Au EDS map. (E) Ag EDS map. (F) Line profile of the Ag@Au particle clearly demonstrating the presence of both.
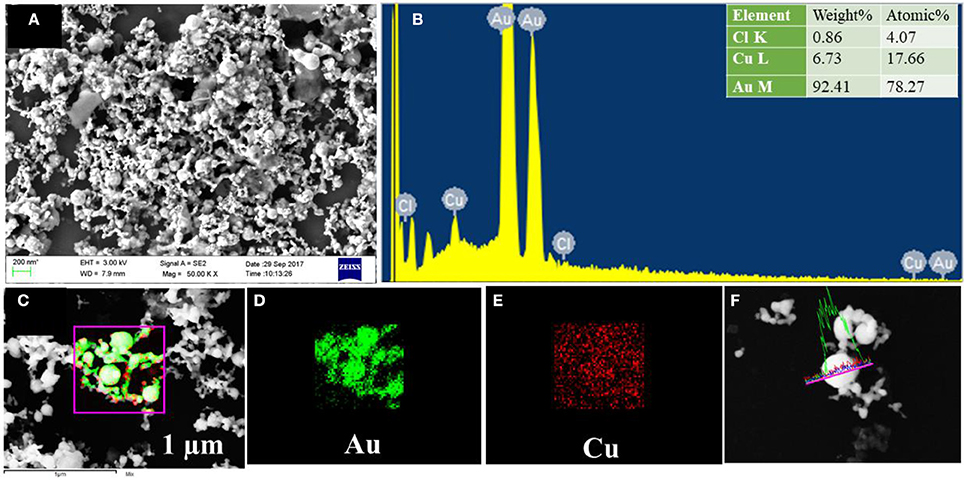
Figure 5. (A) FESEM image of Cu@Au NPs. (B) EDS spectra with inset depicting the wt % of individual elements. (C) EDS mapping image of the Cu@Au NPs. (D) Au EDS map. (E) Cu EDS map. (F) Line profile of the Cu@Au particle clearly demonstrating the presence of both.
SERS Measurements
The main objective of the present work is to study the performance of these samples in SERS applications using explosives as target molecules. Picric acid (PA) is a well-known explosive due to its unstable and toxic properties. Figure 6A shows the SERS spectra of PA (5 μM) molecules adsorbed on Ag@Au and Cu@Au NPs films. For PA, the observed modes were at 831, 943, and 1,339 cm−1 are assigned to C-H bending mode, ring breathing, and NO2 symmetric stretching mode, respectively. Similarly, the Raman activity of these substrates was tested with another explosive molecule of DNT. DNT is the main decomposition product of TNT and can be used as detection marker for landmines. Figure 6B shows the SERS spectra of DNT with Raman modes noticed at 855 cm−1, 1,203 cm−1 corresponds to NO2 out of plane and H-C-C plane bending [30, 42]. We extended our SERS studies of these NPs to detect MB, which is an aromatic dye used in the textile production that causes severe central nervous system toxicity. Figure 6C shows the SERS spectra of MB (5 nM) with observed modes at 449, 776, 947, 1,175, 1,396, and 1,621 cm−1 are in good agreement with the earlier works [43]. The major MB peaks were located at 449, 1,621 cm−1 were assigned to skeletal deformation of C-N-C, Ring stretching of C-C, respectively [44] and the other peaks and their assignments were reported in earlier literature [13, 45]. A strong peak at 520 cm−1 observed is from the silicon substrate with NPs (a break in spectra shown in Figure 6C) and also a broad flat edged peak between 900 and 1,000 cm−1 corresponds to the 2nd order Si Raman band. From the presented data Ag@Au NPs substrate depicted superior enhancements in Raman signals compared to the Cu@Au NPs, which could be due to the high plasmonic property of silver compared to copper and shape of Ag@Au alloy NPs with slightly sharp edges leads to the large accumulation of free electrons, induces the strong electric-field enhancement near the NP surfaces.
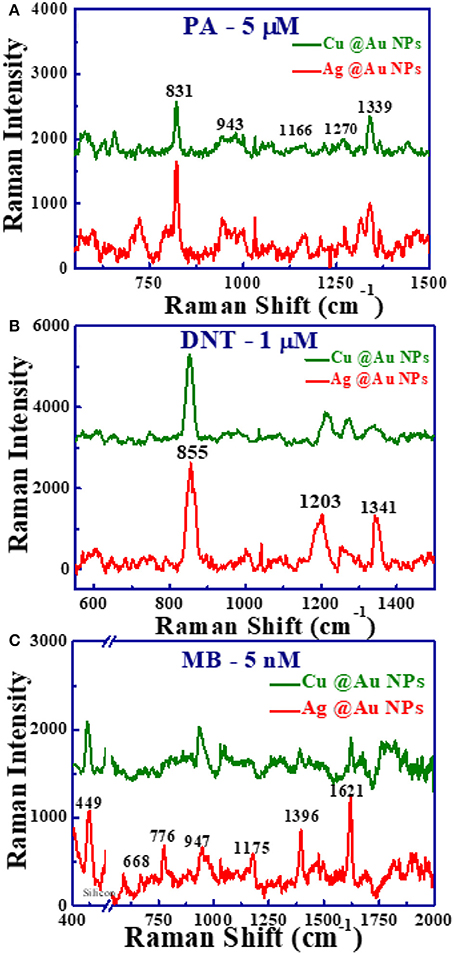
Figure 6. SERS spectra of adsorbed. (A) PA with 5 μM concentration. (B) DNT in methanol with 1 μM concentration. (C) MB (5 nM) recorded from Ag@Au NPs (red) and Cu@Au NPs (green) films with a portable Raman spectrometer operated at 785 nm while the integration time was ~5 s. In (C) X-axis break has been used to avoid the strong Si peak at 520 cm−1.
SERS data was also collected for MB (5 nM) with 632.8 nm excitation wavelength using Ag@Au and Cu@Au NPs films. The efficiency and sensitivity of the SERS substrates depend on the excitation wavelength, because of the coupling between the excitation wavelength and an electronic transition of the target molecule. Figure 7A shows the UV-VIS absorption spectra of MB (5 μM), the absorption maxima was located at ~653 nm corresponding to n-π* transitions. The peak at 600 nm is a shoulder and it corresponds to the vibrionic transition 0-1 (level 0 of ground state to level 1 of the excited state) [46]. Figure 7B illustrates the SERS spectra of MB at concentration 5 nm using Ag@Au and Cu@Au NPs with the excitation source 632.8 nm (He: Ne laser, HORIBA) and the laser beam was focused with 50X (NA, 0.55) objective lens and the integration time was set as 5 s. The Raman intensities of MB (1,622 cm−1) were 632, 1,019 using 632.8 nm excitation and 356, 851, using 785 nm excitation source by using Cu@Au, Ag@Au NPs films, respectively. A two times augmentation in the SERS intensities was noticed with 632.8 nm compared to the 785 nm excitation, which could be attributed to the excitation wavelength (632.8 nm) being nearer to the absorption maxima of MB.
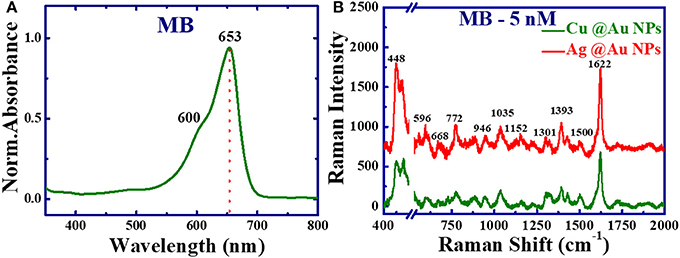
Figure 7. (A) UV-Vis absorption spectra of MB (5 μM). (B) SERS spectra of methylene blue concentration 5 nM (1.6 ng/ml) with excitation wavelength 632.8 nm integration time 5 s. In (B) X-axis break has been used to avoid the strong Si peak at 520 cm−1.
Reproducibility and Stability of SERS Substrates
For practical applications reproducibility is one of the essential parameters for fabricated SERS substrates. The reproducibility of the SERS substrates was investigated by collecting the SERS signals from >10 different sites on Ag@Au and Cu@Au NP films. Figures 8A,B depict the SERS spectra of MB (5 μM) and their corresponding histogram. The relative standard deviation (RSD) of SERS intensity for 1,622 cm−1 peak is 7.45% for Ag@Au NPs. Similarly, the reproducibility of Cu@Au NPs substrate was examined with DNT (1 μM) and the histogram of Raman peak at 849 cm−1 shown in Figures 8C,D. The 3D SERS spectra are provided in the supplementary information file (Figure S1). The estimated relative standard deviation (RSD) for SERS intensity of 849 cm−1 modes is ~12%. These RSDs indicates the reproducibility and suggest that these Ag@Au and Cu@Au NPs SERS substrates were good candidates for detection. The observed small variation in SERS intensity could be attributed to the morphology of NPs and the distance between the analyte and NPs. Even higher reproducibility can be achieved by placing these NPs in periodic templates of nanostructures.
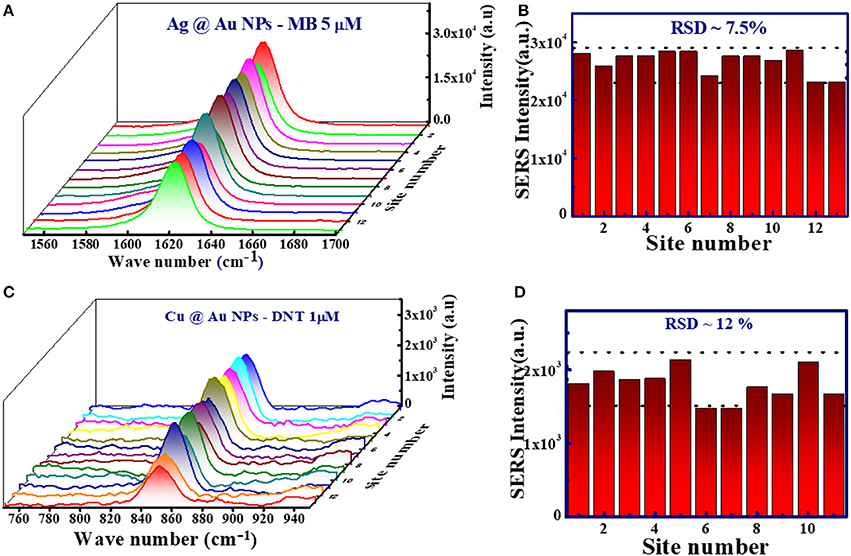
Figure 8. (A) SERS spectra of MB using Ag@Au NPs film recorded multiple times at different sites. (B) SERS intensity of 1622 cm−1 peak collected from Ag@Au NPs film. (C) SERS spectra of DNT using Cu@Au NPs film. (D) SERS intensity of 849 cm−1 peak collected from Cu@Au NP film at different sites with an excitation wavelength 785 nm and an integration time of ~5 s.
Pure metal (Ag and Cu) NPs are easily oxidized under ambient conditions and, therefore, reduce their efficacy. We believe that the presence of Au in these bimetallic NPs (SERS substrates) displays stable properties. To test the sensitivity of Ag@Au and Cu@Au NPs substrates a series of SERS measurements were conducted for PA and MB (from 5 mM to 5 μM and 5 μM to 5 nM, respectively). Figures 9A,C illustrate the variation in the SERS intensity with varying analytes [(a) PA (b) MB] concentration and recorded using Ag@Au NPs. The SERS intensity decreased as the concentration of analyte decreased and further we did not notice any shifts in the Raman modes. The Raman modes for MB were clearly identified even at the concentration of 10−9 M with a good signal-to-noise ratio. Further, statistical analysis of the data revealed that there exists a linear dependence between the logarithmic concentrations (log C) and the logarithmic intensity (log I) (for the characteristic peak of PA - 829 cm−1 and MB - 1,622 cm−1) using Ag@Au NPs (shown in Figures 9B,D). The data presented in the graph confirms the linearity at lower concentrations. However, at higher concentrations a slight saturation was observed and the reasons for this needs to be investigated. The observed SERS signals are related to the hotspots due to closely packed plasmonic metal NPs. We believe that Ag@Au has taken the advantages of the strong plasmonic electric field enhancement of Ag and the chemical stability of Au beneficial for SERS capability.
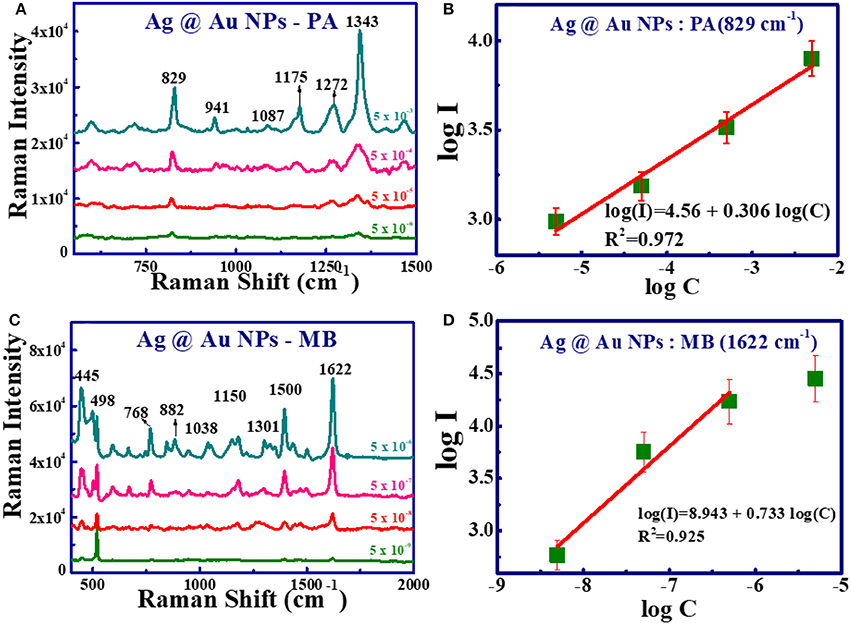
Figure 9. Concentration-dependent SERS spectra of PA and MB recorded using Ag@Au NPs. (A) PA with concentration from 5 mM to 5 μM. (B) SERS intensity at 829 cm−1 vs. PA concentration. (C) MB spectra from 5 μM to 5 nM. (D) SERS intensity at 1,622 cm−1 vs. MB concentration (Solid green squares represent the experimental data and red line represents the theoretical fit).
Figures 10A,C show the concentration-dependent SERS studies with the analyte [(a) PA (c) MB] using Cu@Au NPs. The SERS spectral intensity decreases as the concentration decreases. The small shifts in the characteristics peaks are due to the interaction of analyte molecule with the substrate, affected by the orientation of the adsorbed molecule [47]. The Raman modes for MB are clearly recognized even at the concentration of 10−9 M with a good signal-to-noise ratio. Furthermore, statistical analysis of the data revealed that here too there exists a linear dependence between the logarithmic concentrations (log C) and the logarithmic intensity (log I) (for the characterstic peak of PA - 821 cm−1 and MB - 1,620 cm−1) using Cu@Au NPs (shown in Figures 10B,D). This graph confirms a linear correlation between SERS intensities and logarithmic concentration within the concentration range investigated.
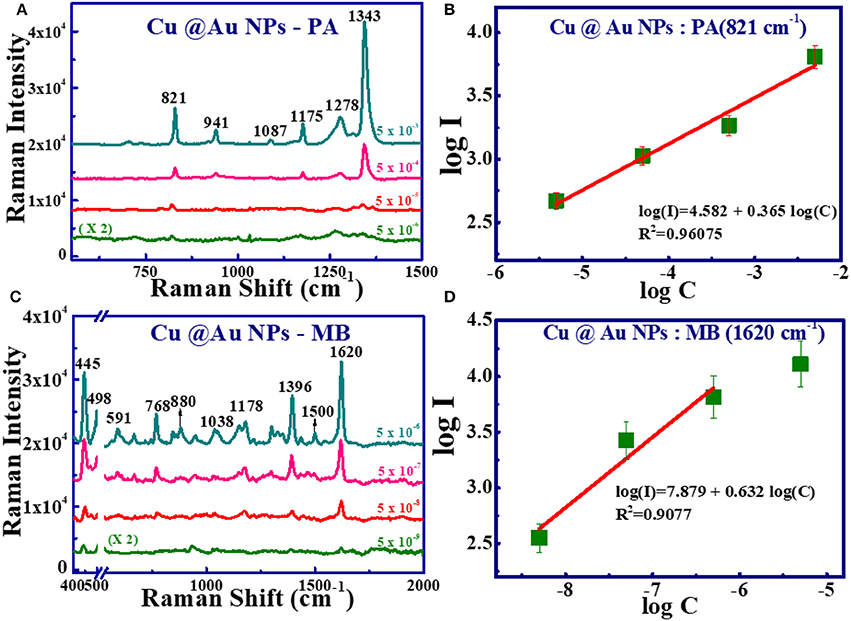
Figure 10. Concentration-dependent SERS spectra of PA and MB recorded using Cu@Au NPs. (A) PA with concentration from 5 mM to 5 μM. (B) SERS intensity at 1,343 cm−1 vs. PA concentration. (C) MB spectra from 5 μM to 5 nM. (D) SERS intensity at 1,622 cm−1 vs. MB concentration with excitation at 785 nm (Solid/green squares represents the experimental data and solid red line represents the theoretical fit). In (c) X-axis break has been used to avoid the strong Si peak at 520 cm−1.
Enhancement Factors
The enhancement factor (EF) was calculated using the relation , where ISERS Raman Intensity using NPs, IR is the Raman intensity on Si wafer (without using NPs), CSERS the concentration of sample on NPs substrate (low concentration) and CR is the concentration of sample on Si wafer (0.1 M) which produce Raman signal (IR). For the reference, the Raman spectra of PA, DNT and MB with concentration 0.1 M on Si substrate was recorded and the plots were presented in the supplementary information (Figure S2). The calculated EFs for Ag@Au NPs and Cu@Au NPs are 3.45 × 10⁷, 1.44 × 10⁷ for MB (1,622 cm−1 mode), 8.22 × 10⁴, 4.47 × 10⁴ for PA (829 cm−1 mode) and 7.5 × 10⁵, 6.0 × 10⁵ for DNT (855 cm−1 mode), respectively. The calculated EFs for all the molecules are summarized in Table 1. The comparison plot of obtained EFs for PA, DNT, and MB recorded from Ag@Au and Cu@Au substrates is depicted in Figure 11. From the presented results, Ag@Au NPs demonstrated more than two orders of magnitude stronger EFs than the Cu@Au NPs with best detection amount in terms of mass being 16 pg of MB, 11.45 ng of PA and 1.82 ng of DNT respectively. The detection limit of MB (nM) is higher compared to the explosive molecules (μM) and this could possibly be due to partial attachment of the explosive molecules electromagnetically with the NPs [47]. The EF critically depends on the analyte molecule adsorption, orientation of molecules on the NP surface, NP surface morphology (nanostars usually demonstrate superior performance compared to spherical nanoparticles), the availability of number of hotspots and the excitation wavelength. Our earlier work reported the detection of 25 μM DNT (explosive molecule) and 5 nM MB [30] in the case of Ag-Au NPs and nanostrcutures (NSs) prepared through the ablation of Ag-Au targets in acetone. Similarly, we could achieve the detection of explosive molecules of PA at 5 μM concentration levels and ammonium nitrate at 50 μM concetration levels using gold NPs and NSs [30]. In the present work, though, we achieved the detection of 1 μM DNT and 5 μM PA. The EFs obtained in the present case could possibly be further improved by increasing the number of hot spots through simple procedures such as (a) drop casting more number of NPs of same type or of different metals (b) drop casting these NPs in nanostructured metals or even Si/SiO2 and subsequently perform the SERS measurements. Our earlier report [30] has already demonstrated one of this possibility. This is conceivable since the NPs will be localized on these NSs and by increasing the concentration of the present NPs one could possible achieve higher number of hotspots. Our initial results on similar idea (present set of NPs on Si nanostructured surface) have indeed demonstrated superior SERS enhancements. The results of those studies are beyond the scope of this work. It is well established that pure Ag/Cu NPs have been reported to be easily susceptible to oxidation and aggregation in air. The presence of stable Au in bimetallic NPs composition with its rich and excitation properties leads to stable and reproducible SERS substrates which are favorable for on-site and field-based detection of a variety of molecules in combination with portable Raman spectrometers.
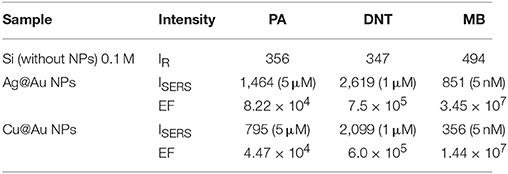
Table 1. Raman intensity obtained from SERS measurements and calculation of EF.
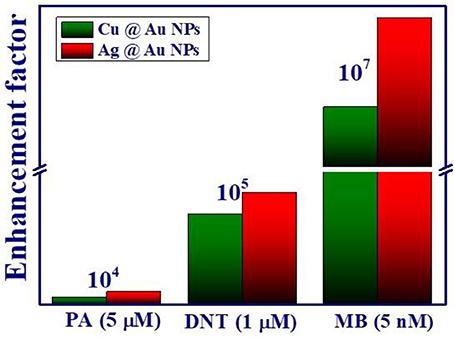
Figure 11. A comparison of the SERS enhancement factors obtained with Ag@Au and Cu@Au NPs for different analyte molecules used in this study.
Conclusions
Bimetallic Ag@Au and Cu@Au NPs were fabricated with a simple approach of using laser ablation of the bulk target (Ag/Cu) immersed in HAuCl4 solution. The formation of bimetallic Ag@Au and Cu@Au NPs was confirmed from the observed single plasmon bond in the absorption spectra. The phase and compositions of fabricated NPs were determined from the XRD, TEM, and FESEM-EDX mapping. These NPs acted as efficient SERS platforms for detection of two different explosive molecules (PA, DNT) as well as a common dye molecule (MB). The fabricated SERS substrates demonstrated the detection limits of 10−6, 10−6, and 10−9 M for PA, DNT, and MB with high sensitivity, reproducibility, and chemical stability. The estimated EFs for PA, DNT, and MB were ~104, ~105, and ~107 for PA, DNT, and MB, respectively. From the results obtained and the analyses performed we could conclude that the Ag@Au NPs substrates exhibited superior SERS response than the Cu@Au NPs. We strongly feel that these SERS substrates have great potential for on-field applications in detection of various explosive molecules.
Author Contributions
MS performed the SERS, TEM measurements and analyzed the data. CB performed the laser ablation experiments and helped in TEM data analysis. MS and CB wrote the initial draft of the Manuscript. VS conceived the idea, supervised the research, participated in writing and correcting the Manuscript.
Funding
We are grateful for the financial support from DRDO [Project # ERIP/ER/1501138/M/01/319/D(R&D) dated 27.02.2017].
Conflict of Interest Statement
The authors declare that the research was conducted in the absence of any commercial or financial relationships that could be construed as a potential conflict of interest.
Acknowledgments
We would like to acknowledge DRDO through ACRHEM for financial support. We thank the support of HEMRL for supplying the explosive molecules used in the present experiments. We acknowledge the Centre for Nanotechnology and University of Hyderabad for providing TEM, FESEM, and XRD to characterize the nanoparticles. We would like to thank Ms. Sini Nanadath Shibu for helping in SERS data collection.
Supplementary Material
The Supplementary Material for this article can be found online at: https://www.frontiersin.org/articles/10.3389/fphy.2018.00028/full#supplementary-material
References
1. Semaltianos N. Nanoparticles by laser ablation. Crit Rev Solid State Mater Sci. (2010) 35:105–24. doi: 10.1080/10408431003788233
2. Samal AK, Polavarapu L, Rodal-Cedeira S, Liz-Marzán LM, Pérez-Juste J, Pastoriza-Santos I. Size tunable Au@Ag core–shell nanoparticles: synthesis and surface-enhanced raman scattering properties. Langmuir (2013) 29:15076–82. doi: 10.1021/la403707j
3. Podagatlapalli GK, Hamad S, Mohiddon MA, Rao SV. Effect of oblique incidence on silver nanomaterials fabricated in water via ultrafast laser ablation for photonics and explosives detection. Appl Surf Sci. (2014) 303:217–32. doi: 10.1016/j.apsusc.2014.02.152
4. Fernández-López C, Polavarapu L, Solís DM, Taboada JM, Obelleiro F, Contreras-Cáceres R, et al. Gold Nanorod–pNIPAM hybrids with reversible plasmon coupling: synthesis, modeling, and SERS properties. ACS Appl Mater Interf. (2015) 7:12530–8. doi: 10.1021/am5087209
5. Jiang T, Song J, Zhang W, Wang H, Li X, Xia R, et al. Au-Ag@Au hollow nanostructure with enhanced chemical stability and improved photothermal transduction efficiency for cancer treatment. ACS Appl Mater Interf. (2015) 7:21985–94. doi: 10.1021/acsami.5b08305
6. Chen M, Wang D, Liu X. Direct synthesis of size-tailored bimetallic Ag/Au nano-spheres and nano-chains with controllable compositions by laser ablation of silver plate in HAuCl4 solution. RSC Adv. (2016) 6:9549–53. doi: 10.1039/C5RA24578H
7. Wang C, Li M, Li Q, Zhang K, Wang C, Xiao R, et al. Polyethyleneimine-mediated seed growth approach for synthesis of silver-shell silica-core nanocomposites and their application as a versatile SERS platform. RSC Adv. (2017) 7:13138–48. doi: 10.1039/C6RA28629A
8. Barcikowski S, Compagnini G. Advanced nanoparticle generation and excitation by lasers in liquids. Phys Chem Chem Phys. (2013) 15:3022–6. doi: 10.1039/C2CP90132C
9. Rao SV, Podagatlapalli GK, Hamad S. Ultrafast laser ablation in liquids for nanomaterials and applications. J Nanosci Nanotechnol. (2014) 14:1364–88. doi: 10.1166/jnn.2014.9138
10. Podagatlapalli GK, Hamad S, Mohiddon MA, Rao SV. Fabrication of nanoparticles and nanostructures using ultrafast laser ablation of silver with Bessel beams. Laser Phys Lett. (2015a) 12:036003. doi: 10.1088/1612-2011/12/3/036003
11. Zhang D, Gökce B, Barcikowski S. Laser synthesis and processing of colloids: fundamentals and applications. Chem Rev. (2017a) 117:3990–4103. doi: 10.1021/acs.chemrev.6b00468
12. Barcikowski S, Menéndez-Manjón A, Chichkov B, Brikas M, Račiukaitis G. Generation of nanoparticle colloids by picosecond and femtosecond laser ablations in liquid flow. Appl Phys Lett. (2007) 91:083113. doi: 10.1063/1.2773937
13. Byram C, Moram SSB, Shaik AK, Soma VR. Versatile gold based SERS substrates fabricated by ultrafast laser ablation for sensing picric acid and ammonium nitrate. Chem Phys Lett. (2017) 685:103–7. doi: 10.1016/j.cplett.2017.07.043
14. Kabashin AV, Meunier M. Synthesis of colloidal nanoparticles during femtosecond laser ablation of gold in water. J Appl Phys. (2003) 94:7941–3. doi: 10.1063/1.1626793
15. Link S, Wang ZL, El-Sayed MA. How does a gold nanorod melt? J Phys Chem B (2000) 104:7867–70. doi: 10.1021/jp0011701
16. Hamad S, Podagatlapalli GK, Tewari SP, Rao SV. Influence of picosecond multiple/single line ablation on copper nanoparticles fabricated for surface enhanced Raman spectroscopy and photonics applications. J Phys D Appl Phys. (2013) 46:485501. doi: 10.1088/0022-3727/46/48/485501
17. Semaltianos N, Chassagnon R, Moutarlier V, Blondeau-Patissier V, Assoul M, Monteil G. Nanoparticles alloying in liquids: laser-ablation-generated Ag or Pd nanoparticles and laser irradiation-induced AgPd nanoparticle alloying. Nanotechnology (2017) 28:155703. doi: 10.1088/1361-6528/aa6282
18. Tsuji T, Iryo K, Watanabe N, Tsuji M. Preparation of silver nanoparticles by laser ablation in solution: influence of laser wavelength on particle size. Appl Surf Sci. (2002) 202:80–5. doi: 10.1016/S0169-4332(02)00936-4
19. Lal S, Grady NK, Kundu J, Levin CS, Lassiter JB, Halas NJ. Tailoring plasmonic substrates for surface enhanced spectroscopies. Chem Soc Rev. (2008) 37:898–911. doi: 10.1039/b705969h
20. Kneipp K, Wang Y, Kneipp H, Perelman LT, Itzkan I, Dasari RR, et al. Single molecule detection using surface-enhanced Raman scattering (SERS). Phys Rev Lett. (1997) 78:1667. doi: 10.1103/PhysRevLett.78.1667
21. Soma VR, Podagatlapalli GK, Syed H. Femtomolar detection of explosive molecules using laser ablated targets and SERS. In: International Conference on Fibre Optics and Photonics: Optical Society of America. Kanpur (2016). doi: 10.1364/PHOTONICS.2016.Th4D.2
22. Demeritte T, Kanchanapally R, Fan Z, Singh AK, Senapati D, Dubey M, et al. Highly efficient SERS substrate for direct detection of explosive TNT using popcorn-shaped gold nanoparticle-functionalized SWCNT hybrid. Analyst (2012) 137:5041–5. doi: 10.1039/c2an35984g
23. Chen T, Lu S, Wang A, Zheng D, Wu Z, Wang Y. Detection of explosives by surface enhanced Raman scattering using substrate with a monolayer of ordered Au nanoparticles. Appl Surf Sci. (2014) 317:940–5. doi: 10.1016/j.apsusc.2014.09.015
24. Vendamani V, Nageswara Rao S, Venugopal Rao S, Kanjilal D, Pathak A. Three-dimensional hybrid silicon nanostructures for surface enhanced Raman spectroscopy based molecular detection. J Appl Phys. (2018) 123:014301. doi: 10.1063/1.5000994
25. Podagatlapalli GK, Hamad S, Rao SV. Trace-level detection of secondary explosives using hybrid silver–gold nanoparticles and nanostructures achieved with femtosecond laser ablation. J Phys Chem C (2015b) 119:16972–83. doi: 10.1021/acs.jpcc.5b03958
26. Hamad S, Podagatlapalli GK, Mohiddon MA, Soma VR. Cost effective nanostructured copper substrates prepared with ultrafast laser pulses for explosives detection using surface enhanced Raman scattering. Appl Phys Lett. (2014) 104:263104. doi: 10.1063/1.4885763
27. Lee I, Han SW, Kim K. Production of Au–Ag alloy nanoparticles by laser ablation of bulk alloys. Chem Commun. (2001) 1782–3. doi: 10.1039/b105437f
28. Tao Y, Li M, Ren J, Qu X. Metal nanoclusters: novel probes for diagnostic and therapeutic applications. Chem Soc Rev (2015) 44:8636–63. doi: 10.1039/C5CS00607D
29. Xie H, Ye X, Duan K, Xue M, Du Y, Ye W, et al. CuAu–ZnO–graphene nanocomposite: a novel graphene-based bimetallic alloy-semiconductor catalyst with its enhanced photocatalytic degradation performance. J Alloys Comp. (2015) 636:40–7. doi: 10.1016/j.jallcom.2015.02.159
30. Byram C, Soma VR. 2,4-dinitrotoluene detected using portable Raman spectrometer and femtosecond laser fabricated Au–Ag nanoparticles and nanostructures. Nano-Struct Nano-Objects (2017) 12:121–9. doi: 10.1016/j.nanoso.2017.09.019
31. Shiji R, Joseph MM, Unnikrishnan BS, Preethi GU, Sreelekha TT. Fluorescent gold nanoclusters as a powerful tool for sensing applications in cancer management. In: Tripathi A, Melo J, editors. Advances in Biomaterials for Biomedical Applications. Advanced Structured Materials, Vol. 66. Singapore: Springer (2017). p. 385–428.
32. Xu L, Li S, Zhang H, Wang D, Chen M. Laser-induced photochemical synthesis of branched Ag@Au bimetallic nanodendrites as a prominent substrate for surface-enhanced Raman scattering spectroscopy. Opt Exp. (2017) 25:7408–17. doi: 10.1364/OE.25.007408
33. Ye W, Long R, Huang H, Xiong Y. Plasmonic nanostructures in solar energy conversion. J Mater Chem C (2017) 5:1008–21. doi: 10.1039/C6TC04847A
34. Zhang J, Chaker M, Ma D. Pulsed laser ablation based synthesis of colloidal metal nanoparticles for catalytic applications. J Coll Interf Sci. (2017b) 489:138–49. doi: 10.1016/j.jcis.2016.07.050
35. Hajiesmaeilbaigi F, Motamedi A. Synthesis of Au/Ag alloy nanoparticles by Nd: YAG laser irradiation. Laser Phys Lett. (2006) 4:133. doi: 10.1002/lapl.200610083
36. Amendola V, Meneghetti M. Size evaluation of gold nanoparticles by UV– vis spectroscopy. J Phys Chem. C (2009) 113:4277–85. doi: 10.1021/jp8082425
37. Amendola V, Pilot R, Frasconi M, Maragò OM, Iatì MA. Surface plasmon resonance in gold nanoparticles: a review. J Phys Condens Matt. (2017) 29:203002. doi: 10.1088/1361-648X/aa60f3
38. Nigoghossian K, Dos Santos MV, Barud HS, Da Silva RR, Rocha LA, Caiut JM, et al. Orange pectin mediated growth and stability of aqueous gold and silver nanocolloids. Appl Surf Sci. (2015) 341:28–36. doi: 10.1016/j.apsusc.2015.02.140
39. Sosa IO, Noguez C, Barrera RG. Optical properties of metal nanoparticles with arbitrary shapes. J Phys Chem. B (2003) 107:6269–75. doi: 10.1021/jp0274076
40. Kuladeep R, Jyothi L, Alee KS, Deepak KLN, Rao DN. Laser-assisted synthesis of Au-Ag alloy nanoparticles with tunable surface plasmon resonance frequency. Opt Mater Exp. (2012) 2:161–72. doi: 10.1364/OME.2.000161
41. Zeng H, Du XW, Singh SC, Kulinich SA, Yang S, He J, et al. Nanomaterials via laser ablation/irradiation in liquid: a review. Adv Funct Mater. (2012) 22:1333–53. doi: 10.1002/adfm.201102295
42. Peveler WJ, Jaber SB, Parkin IP. Nanoparticles in explosives detection–the state-of-the-art and future directions. Foren Sci Med Pathol. (2017) 13:490–494. doi: 10.1007/s12024-017-9903-4
43. Lee P, Meisel D. Adsorption and surface-enhanced Raman of dyes on silver and gold sols. J Phys Chem. (1982) 86:3391–5. doi: 10.1021/j100214a025
44. Anastasopoulos J, Soto Beobide A, Manikas A, Voyiatzis G. Quantitative surface-enhanced resonance Raman scattering analysis of methylene blue using silver colloid. J Raman Spectrosc. (2017) 48:1762–70. doi: 10.1002/jrs.5233
45. Olea-Mejía O, Fernández-Mondragón M, Rodríguez-de la Concha G, Camacho-López M. SERS-active Ag, Au and Ag–Au alloy nanoparticles obtained by laser ablation in liquids for sensing methylene blue. Appl Surf Sci. (2015) 348:66–70. doi: 10.1016/j.apsusc.2015.01.075
46. Heger D, Jirkovský J, Klan P. Aggregation of methylene blue in frozen aqueous solutions studied by absorption spectroscopy. J Phys Chem A (2005) 109:6702–9. doi: 10.1021/jp050439j
Keywords: ultrafast laser ablation, explosives detection, surface-enhanced raman scattering, nanoparticles, picric acid
Citation: Sree Satya Bharati M, Byram C and Soma VR (2018) Femtosecond Laser Fabricated Ag@Au and Cu@Au Alloy Nanoparticles for Surface Enhanced Raman Spectroscopy Based Trace Explosives Detection. Front. Phys. 6:28. doi: 10.3389/fphy.2018.00028
Received: 24 November 2017; Accepted: 12 March 2018;
Published: 27 March 2018.
Edited by:
Olivier J. F. Martin, École Polytechnique Fédérale de Lausanne, SwitzerlandReviewed by:
Murali Banavoth, King Abdullah University of Science and Technology, Saudi ArabiaAntonio Riveiro Rodriguez, University of Vigo, Spain
Copyright © 2018 Sree Satya Bharati, Byram and Soma. This is an open-access article distributed under the terms of the Creative Commons Attribution License (CC BY). The use, distribution or reproduction in other forums is permitted, provided the original author(s) and the copyright owner are credited and that the original publication in this journal is cited, in accordance with accepted academic practice. No use, distribution or reproduction is permitted which does not comply with these terms.
*Correspondence: Venugopal R. Soma, soma_venu@uohyd.ac.in; soma_venu@yahoo.com