Experimental and Modeling Approaches for Understanding the Effect of Gene Expression Noise in Biological Development
 David M. Holloway
- 1Mathematics Department, British Columbia Institute of Technology, Burnaby, BC, Canada
- 2Biology Department, University of Victoria, Victoria, BC, Canada
Biological development involves numerous chemical and physical processes which must act in concert to reliably produce a cell, a tissue, or a body. To be successful, the developing organism must be robust to variability at many levels, such as the environment (e.g., temperature, moisture), upstream information (such as long-range positional information gradients), or intrinsic noise due to the stochastic nature of low concentration chemical kinetics. The latter is especially relevant to the regulation of gene expression in cell differentiation. The temporal stochasticity of gene expression has been studied in single celled organisms for nearly two decades, but only recently have techniques become available to gather temporally-resolved data across spatially-distributed gene expression patterns in developing multicellular organisms. These demonstrate temporal noisy “bursting” in the number of gene transcripts per cell, raising the question of how the transcript number defining a particular cell type is produced, such that one cell type can reliably be distinguished from a neighboring cell of different type along a tissue boundary. Stochastic spatio-temporal modeling of tissue-wide expression patterns can identify signatures for specific types of gene regulation, which can be used to extract regulatory mechanism information from experimental time series. This Perspective focuses on using this type of approach to study gene expression noise during the anterior-posterior segmentation of the fruit fly embryo. Advances in experimental and theoretical techniques will lead to an increasing quantification of expression noise that can be used to understand how regulatory mechanisms contribute to embryonic robustness across a range of developmental processes.
The Challenge of Development: Coordinated Tissue Differentiation From Cell-Specific Gene Expression
Development of a multicellular organism's body depends on the reliable differentiation of cells into tissues. Differentiation must be coordinated in space, defining the extent of the tissue, and in time, for cells to acquire the proper identity at the correct time. Genetically, cell type is defined by expression of a unique subset of the genome. Gene expression has multiple levels, including the binding of DNA by regulatory transcription factors, transcription from DNA to mRNA, splicing variation, and translation of mRNA to protein. Protein transport, degradation and interactions with other proteins and cellular components then form the molecular biology, structure and functionality of a specific cell type.
Variability exists in all of these processes. Extrinsic variability can be in temperature or moisture; the timing of a hormone signal; or the spatial distribution of a transcription factor, for example the anterior-posterior Bicoid (Bcd) gradient in the fruit fly (Drosophila) which activates different tissues depending on its concentration (Figure 1A, purple). Gene expression also has intrinsic variability (noise), since it occurs at low enough concentrations to exhibit stochastic kinetics (e.g., [1]).
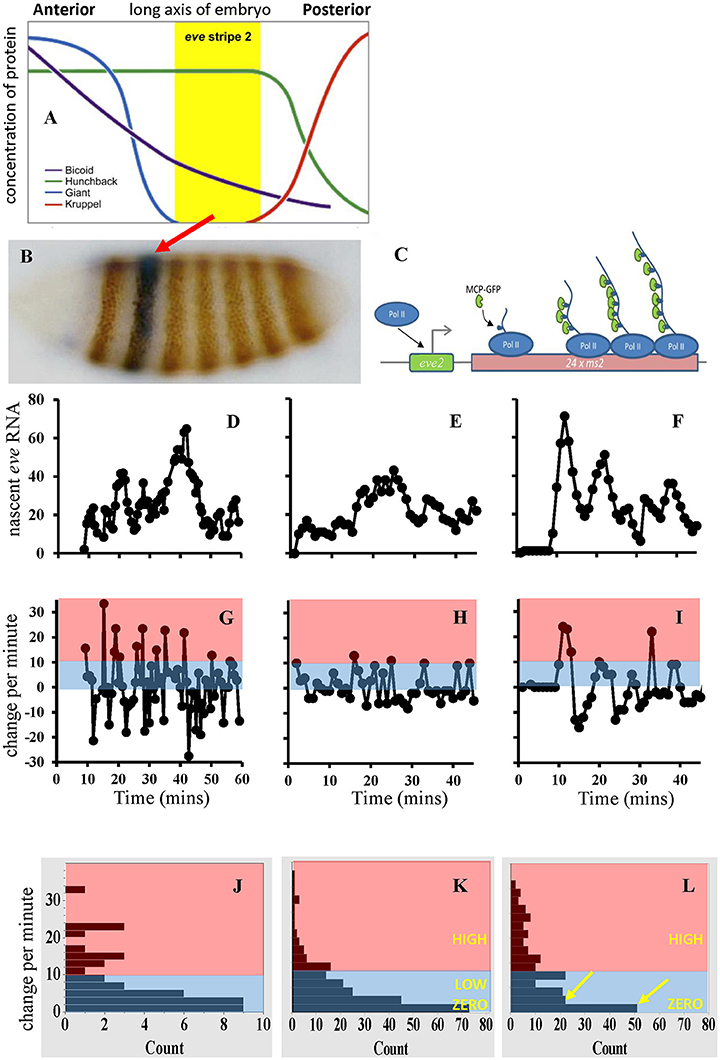
Figure 1. (A) Spatial expression of several Drosophila segmentation genes. (B) eve gene expression stripes on an interphase 14 embryo. Red arrow, eve stripe 2. (C) Schematic of the MCP/MS2 system. “eve2” represents the CRE controlling transcriptional initiation (right-angle arrow); see Figure 2A for an expanded view and model of this eve MSE. PolII transcribes multiple MS2 loops in addition to the target gene. MS2 loops in the nascent RNA bind MCP tagged with green fluorescent protein (GFP). (D) Experimental time series from a nucleus in the center of eve stripe 2, from Bothma et al. [54]. (E) A stochastic simulation for OFF-LOW-HIGH eve2 transcription (model in Figures 2A,B). (F) A simulation of simple OFF-ON transcription. Experimental time series exhibit a 10 min initial lag, simulation dynamics start at time 0; time axes same as (G–I), vertical scale (number of transcript molecules) shared (D–F). (G–I) Corresponding change per minute for the data (G), and for the OFF-LOW-HIGH (H), and OFF-ON (I) simulations. Pink, minutes with high initiation; blue, minutes with low to zero initiation. (J–L) Distributions of change-per-minute for data (J, from G), OFF-LOW-HIGH (K, 10 pooled simulations) and OFF-ON (L, also 10 simulations; yellow arrows indicate dichotomy in low to zero rates not seen in J,K). Vertical bin ranges identical for (J–L). LOW corresponds to kB000 in Figure 2, HIGH to kBH00. (A,B) adapted from Levine [79], (C) from Desponds et al. [53], (D–L) from Holloway and Spirov [66].
In single cells, intrinsic variability can contribute to population heterogeneity that may be exploited for evolutionary adaptivity to environmental changes (e.g., [2–5]). In the development of multicellular metazoans, however, such heterogeneity must generally be much lower to produce distinct tissue types with clear boundaries. Anterior-posterior segmentation of the insect body must achieve 1–2 cell positional accuracy to avoid developmental errors. This implies variability-limiting mechanisms at most, if not all, steps of cellular differentiation. This Perspective addresses how gene regulation can affect the variability due to intrinsic transcription noise, particularly in Drosophila.
Regulatory Mechanisms for Robust Gene Expression
Several dozen genes are involved in early Drosophila anterior-posterior segmentation (e.g., [6, 7]). Many of these code for transcription factors which regulate other segmentation genes, creating a highly interconnected gene regulatory network. Hierarchically, long-range maternal gradients (e.g., Bcd) activate broad gap-gene patterns (e.g., hunchback, hb; Krüppel, Kr; Giant, Gt; knirps, kni; Figure 1A), which then regulate the finer-scale pair-rule genes (e.g., even-skipped, eve). Stripes of pair-rule expression, each several cells wide, form in the long 14th interphase after fertilization (Figure 1B); these are the first manifestation of the fly's future body segments.
This coordinated spatially-patterned expression of genes has been extensively studied with mathematical models. For example, parameter searches with the gene interaction matrix approach of Mjolsness et al. and Reinitz and Sharp [8, 9] found classes of networks for wild-type [10] and mutant [11–13] gap-gene patterns. Such potential mechanisms can be further screened for robustness to extrinsic variability, such as to Bcd gradient variability [11, 12].
Such deterministic models are not appropriate, however, for the intrinsic noise generated during gene transcription and translation: they can guide the development of stochastic models, but only to the extent that terms can be converted to elementary probabilistic events. New types of data are also required for quantifying intrinsic noise and model validation.
Pioneering Work in Single Cells; Gene Expression is Intrinsically Noisy
While the effects of noise in gene expression had been discussed in the 1990's (e.g., [14–19]), technological advances in the early 2000's allowed for the first experimental measurements of noise in living cells, in bacteria (e.g., [1, 20]) and in yeast (e.g., [21]). In E. coli, for instance, genes for cyan and yellow fluorescent proteins were incorporated into the genome: when a cell experienced fluctuations in extrinsic factors, the transgenes expressed together, producing an equally-blended color; deviations from this revealed the intrinsic noise at each gene [1]. Advances in this period include finding how noise scales [22], and that prokaryotic expression exhibits noisy bursts in translation while eukaryotic expression, with slower initiation kinetics, is dominated by transcriptional bursting (see review [23]; also [24] regarding transcription factor concentrations and burst dynamics).
Transcription Noise in Multicellular Spatially-Patterned Tissues
While fluorescent protein transgenes have been used extensively in metazoans, the long maturation times (~30 min) of those developed for Drosophila segmentation genes (e.g., bcd [25] and eve [26]) tend to obscure the rapid (~10 min) pattern changes during interphase 14. Gene expression noise studies in Drosophila have therefore focused on transcription, measuring RNA rather than protein.
Static Snapshots
High resolution FISH (fluorescent in situ hybridization) can image sub-nuclear RNA transcription centers (or “dots,” corresponding to individual gene copies on the DNA) and even single RNA molecules (smFISH). Fixed embryos can be assigned within several-minute developmental stages. Stochastic transcriptional processes can be inferred from the distribution of RNA in these staged snapshots.
Data
Different FISH probes can visualize different stages of RNA production, from nascent (actively transcribing from the DNA) to nuclear (dots) to cytoplasmic. Intronic probes for nascent transcripts were used to demonstrate transcriptional bursting in segmentation genes [27]. Similar to a unicellular population, early Bcd-activated hb expression can be heterogeneous [28], but becomes more synchronized as spatial pattern matures [29]; this may be aided by a persistence of the transcriptional state through cell divisions [30]. Correlation between Bcd and hb intronic signal [31] was used to calculate the number of Bcd binding sites (BSs) in the hb cis-regulatory element (CRE; the DNA region to which transcription factors bind). hb Bcd-dependence decays quickly in early interphase 14 [32], after which gap-gap interactions become important. Noise damping and synchronization can be aided by a “paused” state, in which the transcriptional machinery (RNA polymerase II complex, PolII) is assembled and ready, but not actively transcribing [33, 34]. Having multiple CREs for a gene may also reduce transcription noise [35, 36]. While hb, gt, Kr, kni are noisy during transcription, cytoplasmic mRNA levels can be smoother, which may indicate spatiotemporal averaging [37].
Modeling
With FISH data, the substantial theory from unicellular noise research can start to be applied to multicellular gene expression. For instance, Boettiger et al. [38] used a Markov chain approach (see, for example, [39–41]) to compare initiation-regulated and elongation-regulated transcriptional dynamics and show how the latter could produce the more consistent patterns of paused genes observed in Boettiger and Levine [33]. Xu et al. [42] recently derived probability distributions for the number of nascent transcripts and corroborated these against smFISH signal for hb activated by high, medium and low levels of Bcd.
FISH also provides the resolution to check stochastic versions of long-range spatial patterning models. For instance, a stochastic model of Bcd and Hb (self) activation of the anterior hb expression domain [43], developed from an earlier deterministic version [44], predicted that reporter constructs with less than wild-type numbers of Bcd BSs should show increased variability of the mid-embryo boundary, and that loss of hb autoregulation should decrease correlation of the FISH signal between the two hb gene copies (dots). See also Sanchez et al. and Monteoliva et al. [40, 45] on the effect of the number of BSs on transcriptional noise. For later patterning, we modeled the gap-gap interactions producing the mid-embryo Hb concentration peak necessary for the future thorax [46]. Stochastic simulations indicated that hb-Kr interactions reduce expression noise and contribute to the reliability of mid-embryo development, predicting that FISH dot-dot correlation should decrease in Kr− mutants.
Live Time Series
More recently, technology has been developed for the visualization of transcription in live embryos, using the MS2/MCP system originally developed in Bertrand et al. [47] (see also [48] for a recent application in yeast). A viral coat protein (MCP) and its corresponding RNA stem loop (MS2) is introduced into a host reporter gene. MCP, tagged with green fluorescent protein, binds an MS2 loop during transcription of the reporter, producing signal for the nascent transcript (Figure 1C). The first application in Drosophila was to visualize mature nanos RNA [49]. While the technique has inherent background issues compared to FISH (see extensive review in Ferraro et al. [50]), it is increasingly being used to visualize live transcription in embryos at timescales on the order of 1 min. This resolution allows for the corroboration of stochastic models and data along time series, as well as spatially. The time dimension provides new constraints for screening potential regulatory mechanisms.
Data
Time series were first measured in Drosophila for hb [51, 52]. The MCP signal was sampled every 30–60 s and calibrated to the number of active PolII molecules. Peak transcription (up to 100 transcripts being made) can occur within 1–2 min after nuclear division [52]. hb output corresponds well to transcriptional initiation rates up through interphase 13, but the large increase in output entering interphase 14 indicates an additional contribution from whether a nucleus is active or not [51]. Though fluctuations are observed, particularly in longer traces (e.g., Figure 1D of Garcia et al. [51]), the short cell cycles prior to interphase 14 make quantification challenging. A new autocorrelation technique for short sampling periods has been used to detect hb transcriptional bursts in interphase 13 [53].
Live pair-rule gene transcription has been measured [54] with MS2 driven by a 1.7 kb CRE of eve [55, 56] which expresses in stripes 2 and 7 (Figure 1B). A 480 bp minimal stripe element (MSE) within this sequence controls expression at eve stripe 2 (eve2). The MSE has BSs for Bcd, Hb, Gt and Kr [57–59]. The activators, Bcd and Hb, are high throughout the anterior of the embryo; eve2 forms in a trough between the repressor patterns, with Gt to the anterior and Kr to the posterior (Figure 1A). Bothma et al. [54] sampled individual nuclei in stripe 2 over nearly 60 min time series at ~1 min resolution (Figure 1D). These show bursts in eve2 transcription, with “peaks” of some 50–60 nascent transcripts interspersed with “troughs” of about 10–20 nascent transcripts. The authors suggested this indicated two distinct ON rates (i.e., transcriptional initiation could be OFF, LOW, or HIGH). Lower expression at stripe-edge nuclei indicated repression from Gt and Kr.
Using Spatio-Temporal Stochastic Modeling to Find Gene Regulatory Mechanisms From Noisy Time Series
Expression noise has primarily been modeled with simple OFF-ON mechanisms, with transcriptional initiation ON at random intervals, at a characteristic mean rate, and OFF otherwise. The ON intervals can include many initiation events, producing bursts of transcripts (see review in Munsky et al. [60]). An OFF-ON model was recently used to study the effects of transcription noise on eve2 stripe border variability [61]. A number of systems have now been characterized, however, which display multiple distinct ON rates [62–64]. The proposal in Bothma et al. [54] that eve2 has multiple ON rates could have a mechanistic basis in the dual activation of the MSE by Bcd and Hb: removal of the Hb BS leaves reduced Bcd-only activated expression of eve2 [57, 65]. However, to determine whether this regulatory feature can be extracted from time series, it must first be determined whether output from simple OFF-ON and multiple-ON mechanisms can be distinguished.
We, Holloway and Spirov [66], developed a stochastic model of the eve2 MSE, with BSs for Bcd, Hb, Gt, and Kr (Figures 2A,B), and parameters calibrated to experimental data (see also [67, 68] for deterministic MSE models). Sets of time series were generated for a multiple-rate OFF-LOW-HIGH mechanism (Figure 1E, at stripe center, where repression is minimal) and for a simple OFF-ON mechanism (Figure 1F, also stripe center), both producing the observed total number of transcripts in interphase 14. Both mechanisms produced “bursty” peaks in number of transcripts qualitatively like the data (Figure 1D). A more direct measure of initiation rates, however, is the minute-to-minute change in number of transcripts (Figures 1G–I): any increase in signal over the previous minute indicates at least that number of transcripts initiated. The distribution of these minute-to-minute changes is closer between the data (Figure 1J) and the OFF-LOW-HIGH mechanism (Figure 1K) than between the data and the OFF-ON mechanism (Figure 1L), particularly in the low addition range (2-3 initiations per minute). The two models produce distinct distributions (χ2, p < 0.05 [66]). Furthermore, OFF-ON simulations show significant autocorrelation in the minute-to-minute changes (particular initiation rates are maintained over multiple minutes), which is not seen with the data or the OFF-LOW-HIGH mechanism (initiation rates are not maintained from minute-to-minute; e.g., see the net loss in the “burst peak” at minute 40 in Figure 1D). This indicates that features of the time series do support a multiple ON rate mechanism. This corresponds to BS knockouts exhibiting lower eve2 expression for Bcd-only activation than for Bcd+Hb co-activation [57, 65]. Without the LOW rate, the OFF-ON model switches between OFF and HIGH intensity intervals; we suggest that biologically the Bcd-only LOW rate steadies a basal production, while the Bcd+Hb HIGH rate allows for more total transcript. Spatially, the model produces the observed eve2 stripe sharpening in time (Figure 2C), and indicates that time series from nuclei under repression at the stripe edges should be distinguishable from low expression due to reduced activation (e.g., Hb BS knockout).
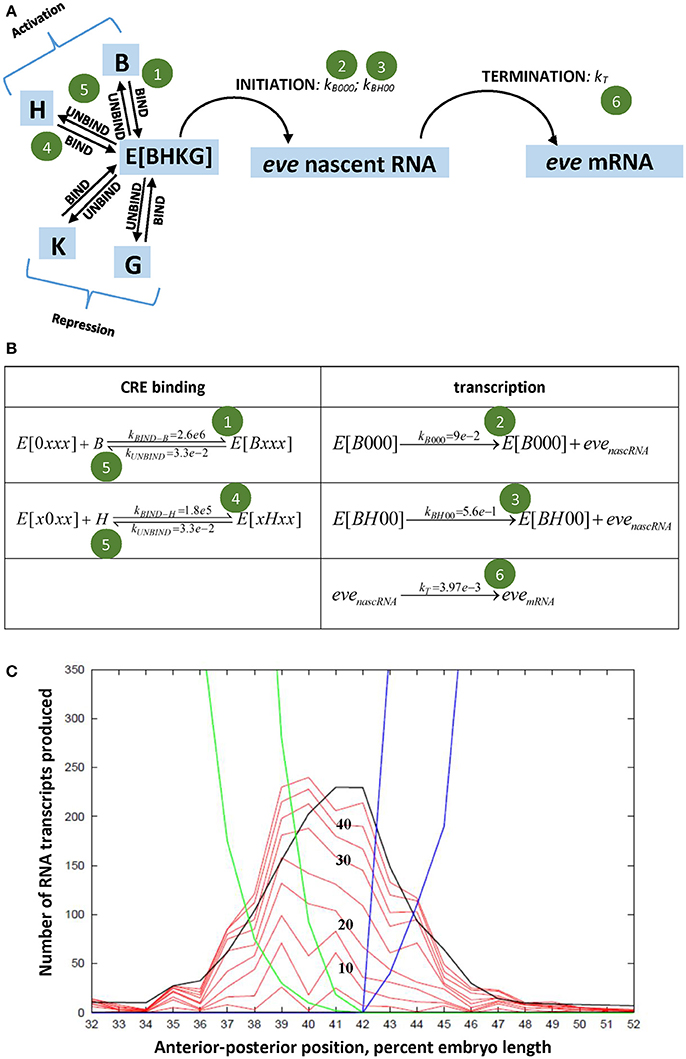
Figure 2. (A) States (blue) and events (arrows) of the stochastic eve2 transcription model [66]; shown as elementary reactions in (B), solved as master equations [80, 81]. E, the eve2 MSE, can bind four transcription factors (B, Bcd; H, Hb; K, Kr; G, Gt); transcriptional initiation occurs at a LOW (green circle 2) or HIGH (circle 3) rate. Experimental signal corresponds to eve nascent RNA. K, G repression not shown in (B), see [66]. (C) Modeled spatial patterning of eve2: numbers of transcripts against position. Red, stochastic solutions at 5 min intervals (times numbered in black); black line, deterministic solution at 45 min; blue (Kr) and green (Gt), early (outer) and late (inner) repressor patterns. Adapted from Holloway and Spirov [66].
This approach indicates that a combination of live imaging, data analysis and stochastic modeling can be used both to find regulatory mechanisms and to understand how they affect transcription noise. Transcription factor binding and initiation kinetics must be slow enough to produce bursting and not time-average output [66]. The time series also need to be long enough, but this can be shortened: Desponds et al. [53] simulated Bcd-activated hb expression, comparing OFF-ON transcription to a mechanism with two OFF states (corresponding to different inactive states of the DNA); they reported that with their new autocorrelation technique time series of 20 min should be sufficient to distinguish these alternatives.
Future Prospects
Live MS2 imaging has been extended to an increasing number of genes in Drosophila, including kni and, in dorsal-ventral patterning, the ventrally expressed snail [69, 70] and its targets brinker and short gastrulation [71]. These provide new insights into temporal aspects of regulation and patterning, but also allow for new noise analysis, particularly how transcriptional noise control may vary between genes or between tissues. For instance, while single CREs can exhibit multiple initiation rates (e.g., eve2), a broader level of control may arise with the multiple enhancers (CREs) seen for many genes: [72] reported a correlation between enhancer strength and transcriptional burst frequency in snail, rhomboid, Abdominal-B and Kr. In addition to Drosophila, MS2 has been introduced into zebrafish [73] and mice [74] to visualize patterning dynamics and transcriptional bursting in vertebrate development.
Discerning regulatory mechanisms from time series will be facilitated in several ways. First, while bursts can be defined theoretically (e.g., [19, 61]), quantifying the duration and amplitude of bursts in data series can be challenging. Comparison of experiment and theory is likely to be more robust using time series statistics such as autocorrelation [53, 66]. Next, numerical simulations currently offer a way to find characteristics of multi-state regulatory processes: e.g., Figures 1, 2; also see [75] for a systematic method for fitting putative models to single-cell expression. Analytical approaches have been developed for stochastic transcription of a spatial pattern with OFF-ON initiation [61]; and for steady-state distributions of nascent signal for intronic FISH, addressing the effect of time lags due to placement of the probe [42]. Extensions of such approaches to multi-state initiation and time-series analysis from cells in a developing spatial pattern may give a more complete treatment of MS2 signal dynamics and better predictive power for inferring regulatory mechanisms.
Characterizing the stochastic dynamics of transcription provides insight into how biology may exploit different regulatory mechanisms. For instance, the eve2 modeling indicates that multiple ON-state mechanisms may support smoother mRNA output compared to OFF-ON mechanisms. Recent examples from single-cell work include modeling dosage regulation after DNA replication as a reduced probability of the ON state [76]; and an experimental and theoretical demonstration that in HIV production a positive feedback slows promoter toggling and uncouples mean from variance, allowing for stochastic active/latent switching at high output which increases viral fitness [77]. Recent single-cell transcriptomes in mice indicate noise regulation is under selective pressure in metazoans as well: low expression noise is associated with gene expression regulators and highly-networked genes (such as Drosophila segmentation genes); while higher noise is associated with stress response, which could aid adaptivity [78]. A more complete picture of the evolution of the gene regulatory networks controlling spatial pattern formation in metazoans will ultimately combine quantification of expression variability with the experimental and theoretical characterization of the stochastic dynamics of gene expression, such that we can understand how regulators interact with the target gene structure to provide both the stability and adaptivity needed for robust development over successive generations.
Author Contributions
The author confirms being the sole contributor of this work and approved it for publication.
Conflict of Interest Statement
The author declares that the research was conducted in the absence of any commercial or financial relationships that could be construed as a potential conflict of interest.
Acknowledgments
Thank you to the reviewers for constructive comments on the manuscript.
References
1. Elowitz MB, Levine AJ, Siggia ED, Swain PS. Stochastic gene expression in a single cell. Science (2002) 297:1183–6. doi: 10.1126/science.1070919
2. Maughan H, Nicholson WL. Stochastic processes influence stationary-phase decisions in Bacillus subtilis. J Bacteriol. (2004) 286:2212–4. doi: 10.1128/JB.186.7.2212-2214.2004
3. Levin BR. Microbiology. Noninherited resistance to antibiotics. Science (2004) 305:1578–9. doi: 10.1126/science.1103077
4. Acar M, Becksei A, van Oudenaarden A. Enhancement of cellular memory by reducing stochastic transitions. Nature (2005) 435:228–32. doi: 10.1038/nature03524
5. Acar M, Mettetal JT, van Oudenaarden A. Stochastic switching as a survival strategy in fluctuating environments. Nat Genet. (2008) 40:471–5. doi: 10.1038/ng.110
6. Nüsslein-Volhard C, Wieschaus E. Mutations affecting segment number and polarity in Drosophila. Nature (1980) 287:795–801. doi: 10.1038/287795a0
7. Fowlkes CC, Luengo Hendriks CL, Keränen SVE, Weber GH, Rübel O, Huang, M-Y, et al. A quantitative spatio-temporal atlas of gene expression in the Drosophila blastoderm. Cell (2008) 133:364–74. doi: 10.1016/j.cell.2008.01.053
8. Mjolsness E, Sharp DH, Reinitz J. A connectionist model of development. J Theor Biol. (1991) 152:429–53. doi: 10.1016/S0022-5193(05)80391-1
9. Reinitz J, Sharp DH. Mechanism of eve stripe formation. Mech Dev. (1995) 49:133–58. doi: 10.1016/0925-4773(94)00310-J
10. Jaeger J, Blagov M, Kosman D, Kozlov KN, Manu, Myasnikova E, et al. Dynamical analysis of regulatory interactions of the gap gene system of Drosophila melanogaster. Genetics (2004). 167:1721–37. doi: 10.1534/genetics.104.027334
11. Manu, Surkova S, Spirov AV, Gursky VV, Janssens H, Kim AR, et al. Canalization of gene expression in the Drosophila blastoderm by gap gene cross regulation. PLoS Biol. (2009) 7:e1000049. doi: 10.1371/journal.pbio.1000049
12. Manu, Surkova S, Spirov AV, Gursky VV, Janssens H, Kim AR, et al. Canalization of gene expression and domain shifts in the Drosophila blastoderm by dynamical attractors. PLoS Comput Biol. (2009) 5:e1000303. doi: 10.1371/journal.pcbi.1000303
13. Kozlov K, Surkova S, Myasnikova E, Reinitz, Samsonova M. Modeling of gap gene expression in Drosophila Kruppel mutants. PLoS Comput Biol. (2012) 8:e1002635. doi: 10.1371/journal.pcbi.1002635
14. Ko MS. Induction mechanism of a single gene molecule: stochastic or deterministic? Bioessays (1992) 14:341–6. doi: 10.1002/bies.950140510
15. McAdams HH, Arkin A. Stochastic mechanisms in gene expression. Proc Natl Acad Sci USA. (1997) 94:814–9. doi: 10.1073/pnas.94.3.814
16. McAdams HH, Arkin A. It's a noisy business! Genetic regulation at the nanomolar scale. Trends Genet. (1999) 15:65–9.
17. Hasty J, Pradines J, Dolnik M, Collins JJ. Noise-based switches and amplifiers for gene expression. Proc Natl Acad Sci USA. (2000) 97:2075–80. doi: 10.1073/pnas.040411297
18. Kepler TB, Elston TC. Stochasticity in transcriptional regulation: origins, consequences, and mathematical representations. Biophys J. (2001) 81:3116–36. doi: 10.1016/S0006-3495(01)75949-8
19. Thattai M, van Oudenaarden A. Intrinsic noise in gene regulatory networks. Proc Natl Acad Sci USA. (2001) 98:8614–9. doi: 10.1073/pnas.151588598
20. Ozbudak EM, Thattai M, Kurtser I, Grossman AD, van Oudenaarden, A. Regulation of noise in the expression of a single gene. Nat Genet. (2002) 31:69–73. doi: 10.1038/ng869
21. Blake WJ, Kærn M, Cantor CR, Collins JJ. Noise in eukaryotic gene expression. Nature (2003) 422:633–7. doi: 10.1038/nature01546
22. Bar-Even A, Paulsson J, Maheshri N, Carmi M, O'Shea E, Pilpel Y, et al. Noise in protein expression scales with natural protein abundance. Nat Genet. (2006) 38:636–43. doi: 10.1038/ng1807
23. Kaern M, Elston TC, Blake WJ, Collins JJ. Stochasticity in gene expression: from theories to phenotypes. Nat Rev. (2005) 6:451–64. doi: 10.1038/nrg1615
24. Carey LB, van Dijk D, Sloot PMA, Kaandorp JA, Segal E. Promoter sequence determines the relationship between expression level and noise. PLoS Biol. (2013) 11:e1001528. doi: 10.1371/journal.pbio.1001528
25. Gregor T, Wieschaus EF, McGregor AP, Bialek W, Tank DW. Stability and nuclear dynamics of the Bicoid morphogen gradient. Cell (2007) 130:141–52. doi: 10.1016/j.cell.2007.05.026
26. Venken KJT, Carlson JW, Schulze KL, Pan H, He Y, Spokony R, et al. Versatile P(acman) BAC libraries for transgenesis studies in Drosophila melanogaster. Nat Methods (2009) 6:431–4. doi: 10.1038/nmeth.1331
27. Paré A, Lemons D, Kosman D, Beaver W, Freund Y, McGinnis W. Visualization of individual Scr mRNAs during Drosophila embryogenesis yields evidence for transcriptional bursting. Curr Biol. (2009) 19:2037–42. doi: 10.1016/j.cub.2009.10.028
28. He F, Ren J, Wang W, Ma J. A multiscale investigation of Bicoid-dependent transcriptional events in Drosophila embryos. PLoS ONE (2011) 6:e19122. doi: 10.1371/journal.pone.0019122
29. Porcher A, Abu-Arish A, Huart S, Roelens B, Fradin C, Dostatni N. The time to measure positional information: maternal Hunchback is required for the synchrony of the Bicoid transcriptional response at the onset of zygotic transcription. Development (2010) 137:2795–804. doi: 10.1242/dev.051300
30. He F, Ma J. A spatial point pattern analysis in Drosophila blastoderm embryos evaluating the potential inheritance of transcriptional states. PLoS ONE (2013) 8:e60876. doi: 10.1371/journal.pone.0060876
31. Xu H, Sepulveda LA, Figard L, Sokac AM, Golding I. Combining protein and mRNA quantification to decipher transcriptional regulation. Nat Methods (2015) 12:739–42. doi: 10.1038/nmeth.3446
32. Liu J, Ma J. Uncovering a dynamic feature of the transcriptional regulatory network for anterior-posterior patterning in the Drosophila embryo. PLoS ONE (2013) 8:e62641. doi: 10.1371/journal.pone.0062641
33. Boettiger AN, Levine M. Synchronous and stochastic patterns of gene activation in the Drosophila embryo. Science (2009) 325:471–3. doi: 10.1126/science.1173976
34. Boettiger AN, Levine M. Rapid transcription fosters coordinate snail expression in the Drosophila embryo. Cell Rep. (2013) 3:8–15. doi: 10.1016/j.celrep.2012.12.015
35. Perry MW, Boettiger AN, Levine M. Multiple enhancers ensure precision of gap gene-expression patterns in the Drosophila embryo. Proc Natl Acad Sci USA. (2011) 108:13570–5. doi: 10.1073/pnas.1109873108
36. Perry MW, Bothma JP, Luu RD, Levine M. Precision of hunchback expression in the Drosophila embryo. Curr Biol. (2012) 22:1–6. doi: 10.1016/j.cub.2012.09.051
37. Little SC, Tikhonov M, Gregor T. Precise developmental gene expression arises from globally stochastic transcriptional activity. Cell (2013) 154:789–800. doi: 10.1016/j.cell.2013.07.025
38. Boettiger AN, Ralph PL, Evans SN. Transcriptional regulation: effects of promoter proximal pausing on speed, synchrony and reliability. PLoS Comput Biol. (2011) 7:e1001136. doi: 10.1371/journal.pcbi.1001136
39. Sanchez A, Kondev J. Transcriptional control of noise in gene expression. Proc Natl Acad Sci USA. (2008) 105:5081–6. doi: 10.1073/pnas.0707904105
40. Sanchez A, Garcia HG, Jones D, Phillips R, Kondev J. Effect of promoter architecture on the cell-to-cell variability in gene expression. PLoS Comput Biol. (2011) 7:e1001100. doi: 10.1371/journal.pcbi.1001100
41. Boettiger AN. Analytic approaches to stochastic gene expression in multicellular systems. Biophys J. (2013) 105:2629–40. doi: 10.1016/j.bpj.2013.10.033
42. Xu H, Skinner SO, Sokac AM, Golding I. Stochastic kinetics of nascent RNA. Phys Rev Lett. (2016) 117:128101. doi: 10.1103/PhysRevLett.117.128101
43. Holloway DM, Lopes FJP, da Fontoura Costa L, Travençolo BAN, Golyandina N, Usevich K, et al. Gene expression noise in spatial patterning: hunchback promoter structure affects noise amplitude and distribution in Drosophila segmentation. PLoS Comput Biol. (2011) 7:e1001069. doi: 10.1371/journal.pcbi.1001069
44. Lopes FJP, Vieira FMC, Holloway DM, Bisch PM, Spirov AV. Spatial bistability generates hunchback expression sharpness in the Drosophila embryo. PLoS Comput Biol. (2008) 4:e1000184. doi: 10.1371/journal.pcbi.1000184
45. Monteoliva D, McCarthy CB, Diambra L. Noise minimisation in gene expression switches. PLoS ONE (2013) 8:e84020. doi: 10.1371/journal.pone.0084020
46. Holloway DM, Spirov AV. Mid-embryo patterning and precision in Drosophila segmentation: Krüppel dual regulation of hunchback. PLoS ONE (2015) 10:e0118450. doi: 10.1371/journal.pone.0118450
47. Bertrand E, Chartrand P, Schaefer M, Shenoy SM, Singer RH, Long RM. Localization of ASH1 mRNA particles in living yeast. Mol Cell (1998) 2:437–45. doi: 10.1016/S1097-2765(00)80143-4
48. Larson DR, Zenklusen D, Wu B, Chao JA, Singer RH. Real-time observation of transcription initiation and elongation on an endogenous yeast gene. Science (2011) 332:475–8. doi: 10.1126/science.1202142
49. Forrest KM, Gavis ER. Live imaging of endogenous RNA reveals a diffusion and entrapment mechanism for nanos mRNA localization in Drosophila. Curr Biol. (2003) 13:1159–68. doi: 10.1016/S0960-9822(03)00451-2
50. Ferraro T, Lucas T, Clémot M, de las Heras Chanes J, Desponds J, Coppey M, et al. New methods to image transcription in living fly embryos: the insights so far, and the prospects. WIREs Dev Biol. (2016) 5:296–310. doi: 10.1002/wdev.221
51. Garcia HG, Tikhonov M, Lin A, Gregor T. Quantitative imaging of transcription in living Drosophila embryos links polymerase activity to patterning. Curr Biol. (2013) 23:2140–5. doi: 10.1016/j.cub.2013.08.054
52. Lucas T, Ferraro T, Roelens B, de las Heras Chanes J, Walczak AM, Coppey M, et al. Live imaging of Bicoid-dependent transcription in Drosophila embryos. Curr Biol. (2013) 23:2135–9. doi: 10.1016/j.cub.2013.08.053
53. Desponds J, Tran H, Ferraro T, Lucas T, Perez Romero C, Guillou A, et al. Precision of readout at the hunchback gene: analyzing short transcription time traces in living fly embryos. PLoS Comput Biol. (2016) 12:e1005256. doi: 10.1371/journal.pcbi.1005256
54. Bothma JB, Garcia HG, Esposito E, Schlissel G, Gregor T, Levine M. Dynamic regulation of eve stripe 2 expression reveals transcriptional bursts in living Drosophila embryos. Proc Natl Acad Sci USA. (2014) 111:10598–603. doi: 10.1073/pnas.1410022111
55. Goto T, Macdonald P, Maniatis T. Early and late periodic patterns of even skipped expression are controlled by distinct regulatory elements that respond to different spatial cues. Cell (1989) 57:413–22. doi: 10.1016/0092-8674(89)90916-1
56. Harding K, Hoey T, Warrior R, Levine M. Autoregulatory and gap gene response elements of the even-skipped promoter in Drosophila. EMBO J. (1989) 8:1205–12.
57. Small S, Blair A, Levine M. Regulation of even-skipped stripe 2 in the Drosophila embryo. EMBO J. (1992) 11:4047–57.
58. Stanojevic D, Small S, Levine M. Regulation of a segmentation stripe by overlapping activators and repressors in the Drosophila embryo. Science (1991) 254:1385–7. doi: 10.1126/science.1683715
59. Small S, Kraut R, Hoey T, Warrior R, Levine M. Transcriptional regulation of a pair-rule stripe in Drosophila. Genes Dev. (1991) 5:827–39. doi: 10.1101/gad.5.5.827
60. Munsky B, Neuert G, van Oudenaarden A. Using gene expression noise to understand gene regulation. Science (2012) 336:183–7. doi: 10.1126/science.1216379
61. Prata GN, Hornos JEM, Ramos AF. Stochastic model for gene transcription in Drosophila melanogaster embryos. Phys Rev E (2016) 93:022403. doi: 10.1103/PhysRevE.93.022403
62. Munsky B, Fox Z, Neuert G. Integrating single-molecule experiments and discrete stochastic models to understand heterogeneous gene transcription dynamics. Methods (2015) 85:12–21. doi: 10.1016/j.ymeth.2015.06.009
63. Corrigan AM, Tunnacliffe E, Cannon D, Chubb JR. A continuum model of transcriptional bursting. eLife (2016) 5:e13051. doi: 10.7554/eLife.13051
64. Choubey S, Kondev J, Sanchez A. Deciphering transcriptional dynamics in vivo by counting nascent RNA molecules. PLoS Comput Biol. (2015) 11:e1004345. doi: 10.1371/journal.pcbi.1004345
65. Arnosti DN, Barolo S, Levine M, Small S. The eve stripe 2 enhancer employs multiple modes of transcriptional synergy. Development (1996) 122:205–14.
66. Holloway DM, Spirov AV. Transcriptional bursting in Drosophila development: stochastic dynamics of eve stripe 2 expression. PLoS ONE (2017) 12:e0176228. doi: 10.1371/journal.pone.0176228
67. Janssens H, Hou S, Jaeger J, Kim A-R, Myasnikova E, Sharp D, et al. Quantitative and predictive model of transcriptional control of the Drosophila melanogaster even skipped gene. Nat Genet. (2006) 38:1159–65. doi: 10.1038/ng1886
68. Ilsley GR, Fisher J, Apweiler R, DePace AH, Luscombe NM. Cellular resolution models for even-skipped regulation in the entire Drosophila embryo. eLife (2013) 2:e00522.
69. Bothma JP, Garcia HG, Ng S, Perry MW, Gregor T, Levine M. Enhancer additivity and non-additivity are determined by enhancer strength in the Drosophila embryo. eLife (2015) 4:e07956.
70. Ferraro T, Esposito E, Mancini L, Ng S, Lucas T, Coppey M, et al. Transcriptional memory in the Drosophila embryo. Curr Biol. (2015) 26:212–8. doi: 10.1016/j.cub.2015.11.058
71. Esposito E, Lim B, Guessous G, Falahati H, Levine M. Mitosis-associated repression in development. Genes Dev. (2016) 30:1503–8. doi: 10.1101/gad.281188.116
72. Fukuya T, Lim B, Levine M. Enhancer control of transcriptional bursting. Cell (2016) 166:358–68. doi: 10.1016/j.cell.2016.05.025
73. Campbell PD, Chao JA, Singer RH, Marlow FL. Dynamic visualization of transcription and RNA subcellular localization in zebrafish. Development (2015) 142:1368–74. doi: 10.1242/dev.118968
74. Lionnet T, Czaplinski K, Darzacq X, Shav-Tai Y, Wells A, Chao JA, et al. A transgenic mouse for in vivo detection of endogenous labeled mRNA. Nat Methods (2011) 8:165–70. doi: 10.1038/nmeth.1551
75. Neuert G, Munsky B, Tan RZ, Teytelman L, Khammash M, van Oudenaarden A. Systematic identification of signal-activated stochastic gene regulation. Science (2013) 339:584–7. doi: 10.1126/science.1231456
76. Skinner SO, Xu H, Nagarkar-Jaiswal S, Freire PR, Zwaka TP, Golding I. Single-cell analysis of transcription kinetics across the cell cycle. eLife (2016) 5:e12175. doi: 10.7554/eLife.12175
77. Razooky BS, Cao Y, Hansen MMK, Perelson AS, Simpson ML, Weinberger LS. Nonlatching positive feedback enables robust bimodality by decoupling expression noise from the mean. PLoS Biol. (2017) 15:e2000841. doi: 10.1371/journal.pbio.2000841
78. Barroso GV, Puzovic N, Dutheil JY. The evolution of gene-specific transcriptional noise is driven by selection at the pathway level. Genetics (2018) 208:173–89. doi: 10.1534/genetics.117.300467
80. Hattne J, Fange D, Elf J. Stochastic reaction-diffusion simulation with MesoRD. Bioinformatics (2005) 21:2923–4. doi: 10.1093/bioinformatics/bti431
Keywords: transcription, Drosophila, mRNA, stochastic model, embryo development, gene regulation, spatial pattern formation, tissue differentiation
Citation: Holloway DM (2018) Experimental and Modeling Approaches for Understanding the Effect of Gene Expression Noise in Biological Development. Front. Phys. 6:36. doi: 10.3389/fphy.2018.00036
Received: 02 February 2018; Accepted: 03 April 2018;
Published: 18 April 2018.
Edited by:
Luis Diambra, National University of La Plata, ArgentinaReviewed by:
Adrian Jacobo, Rockefeller University, United StatesOsvaldo Chara, Consejo Nacional de Investigaciones Científicas y Técnicas (CONICET), Argentina
Copyright © 2018 Holloway. This is an open-access article distributed under the terms of the Creative Commons Attribution License (CC BY). The use, distribution or reproduction in other forums is permitted, provided the original author(s) and the copyright owner are credited and that the original publication in this journal is cited, in accordance with accepted academic practice. No use, distribution or reproduction is permitted which does not comply with these terms.
*Correspondence: David M. Holloway, david_holloway@bcit.ca