
- 1 Harvard-MIT Athinoula A. Martinos Center for Biomedical Imaging, Massachusetts General Hospital, Charlestown, MA, USA
- 2 The University of Texas School of Law, Austin, TX, USA
To date, parameters defining biological properties in multiscale disease models are commonly obtained from a variety of sources. It is thus important to examine the influence of parameter perturbations on system behavior, rather than to limit the model to a specific set of parameters. Such sensitivity analysis can be used to investigate how changes in input parameters affect model outputs. However, multiscale cancer models require special attention because they generally take longer to run than does a series of signaling pathway analysis tasks. In this article, we propose a global sensitivity analysis method based on the integration of Monte Carlo, resampling, and analysis of variance. This method provides solutions to (1) how to render the large number of parameter variation combinations computationally manageable, and (2) how to effectively quantify the sampling distribution of the sensitivity index to address the inherent computational intensity issue. We exemplify the feasibility of this method using a two-dimensional molecular-microscopic agent-based model previously developed for simulating non-small cell lung cancer; in this model, an epidermal growth factor (EGF)-induced, EGF receptor-mediated signaling pathway was implemented at the molecular level. Here, the cross-scale effects of molecular parameters on two tumor growth evaluation measures, i.e., tumor volume and expansion rate, at the microscopic level are assessed. Analysis finds that ERK, a downstream molecule of the EGF receptor signaling pathway, has the most important impact on regulating both measures. The potential to apply this method to therapeutic target discovery is discussed.
Introduction
Despite advances in cancer therapies such as molecular-targeted therapy (Sawyers, 2008), the clinical outcome of highly malignant tumors remains disappointing, with one in four deaths in the United States attributed to this disease (Jemal et al., 2010). In recent years, interdisciplinary approaches using data-driven mathematical and computational modeling have garnered much attention, gaining recognition for their potential to simulate, and analyze the complex behavior of cancer systems (Khalil and Hill, 2005). Moreover, tumor models across different biological scales, i.e., multiscale cancer models, have begun to play an increasingly important role in moving the field of integrative cancer systems biology toward clinical implementation (Sanga et al., 2007; Wang and Deisboeck, 2008). A multiscale approach recognizes the fact that cancer growth indeed spans multiple spatial scales (from nanometers to centimeters) as well as temporal scales (from milliseconds to years), and in some cases, it is more informative to incorporate this aspect into models than to remain at a scale-specific level.
A multiscale cancer model’s need to quantify parameters on, and relationships between, different biological scales significantly increases the complexity of model development. It is quite common that model parameters defining biological properties at different scales are not produced by a single laboratory, but instead are supplemented with those obtained from the literature or have to be estimated. Given the inherent uncertainties in their values, parameters should not be fixed when building a model, but should be assigned statistical distributions that reflect the degree of uncertainty. Hence, it is crucial to not only study the dynamical system behavior governed by a specific set of parameters, but also to further investigate the influence of their perturbations on the overall system behavior (Zi et al., 2005). Sensitivity analysis has been widely accepted as a useful tool for this purpose, especially when it is not possible or practical to conduct numerous wet-lab experiments (van Riel, 2006).
Sensitivity analysis methods fall into two categories: local sensitivity analysis (LSA) and global sensitivity analysis (GSA). LSA (one-at-a-time parameter variation) evaluates the slopes of system outputs with respect to each parameter at a particular point, resulting in a narrow coverage of the entire parameter space (i.e., all possible parameter variation combinations). GSA, on the other hand, addresses model behavior over a wide range of parameter operating conditions (Mishra et al., 2009). In complex biosystems, such as cancer, model parameter values may vary within a large range depending on the specific cell types and cellular environments. Hence, LSA can potentially be misleading. A number of GSA techniques have been developed, especially in the engineering field (Helton et al., 2006), but only recently have GSA methods been applied to systems biology models (Bentele et al., 2004; Zi et al., 2005; Zhang and Rundell, 2006; Marino et al., 2008; Sahle et al., 2008; Zhang et al., 2009). Specific examples are given in the following, and interested readers should refer to the corresponding original articles for more detail. Bentele et al. (2004) proposed a GSA approach by directly building on LSA to measure parameter sensitivities in a CD95-induced apoptotic pathway model. In their approach, a parameter’s global sensitivity index is quantified by calculating a weighted average of local sensitivity indices of the parameter at multiple random points within the parameter space. In Sahle et al. (2008), the authors presented a new approach that integrates the use of optimization techniques with sensitivity analysis to find the global optimum of the sensitivities of control coefficients in a glycolysis model. However, their approach may prove insufficient if the flux control coefficient (used to evaluate the control exerted by each reaction on the glycolytic flux) of a parameter has a very high value. A probabilistic variance-based GSA, based on Sobol’s method (Sobol, 1993), was developed to study a mitogen-activated protein kinase (MAPK) signaling model (Zhang et al., 2009), but the method is very computationally intensive because it requires a large number of system simulations in a Monte Carlo framework.
So far, most of the GSA methods proposed in the systems biology field still focus on signaling pathway analysis. We believe that providing an applicable GSA method for multiscale cancer models, and for multiscale systems biology models at large, is an important step for the assessment of the context-dependent relationship between different biological scales of interest. In this article, we present such a method for performing GSA, based on the integration of Monte Carlo and resampling methods as well as analysis of variance (ANOVA). ANOVA is a model-independent method with no assumption regarding the functional relationships between input and output (Frey and Patil, 2002), a feature which is of particular interest because, in most cases of model analysis, such relationships are not known a priori or cannot be quantified mathematically. Although ANOVA has been used as a sensitivity analysis method in other scientific disciplines, such as food quality (Pet-Armacost et al., 1999; Gerken et al., 2000), material testing (Golinkin et al., 1997), and health risk assessment (Ashraf et al., 1999; Mokhtari and Frey, 2005), to our knowledge this is the first such systematic application to the theoretical modeling of cancer. We exemplify the feasibility of the method using a two-dimensional (2D) multiscale agent-based model previously developed for simulating non-small cell lung cancer (NSCLC; Wang et al., 2007).
Materials and Methods
Multiscale Non-Small Cell Lung Cancer Model
We only briefly introduce the concept behind and key development methods of the 2D agent-based NSCLC model (Wang et al., 2007), which spans both molecular and microscopic (i.e., multi-cellular) scales. At the molecular scale, an epidermal growth factor (EGF)-induced, EGF receptor (EGFR)-mediated signaling pathway specific to NSCLC is implemented (Figure 1). The pathway model is composed of 20 EGF downstream signaling components and 38 corresponding rate constants. Each cell (or agent) in the model carries such a self-maintained signaling pathway. At the microscopic scale, a lattice-based 2D biochemical microenvironment is constructed and populated with diffusive chemical cues including EGF, glucose, and oxygen (see Figure 2 for model environment setup). In each simulation run, a total of 49 seed cells, arranged in a 7 × 7 square, are initially positioned in the center of a 2D lattice. As a simulation progresses, cancer cells constantly sense changes in environmental factors, interact with other cells, and adjust their behavior according to a set of pre-defined biological rules. A cellular phenotypic decision algorithm is established to determine cell phenotypic transitions upon molecular changes: PLCγ-dependent migration and ERK-dependent proliferation. Experimental studies have shown that the transient acceleration of accumulating PLCγ levels leads to cell migration (Dittmar et al., 2002), while that of ERK leads to cell replication (Santos et al., 2007). Therefore, in the algorithm, the rate of change of PLCγ determines the cellular migration decision, and the rate of change of ERK dictates the cellular proliferation fate. If a cell decides to migrate or proliferate, it will search for a suitable neighborhood to move to or for its offspring to occupy. A main feature of the model is that, in each simulation, tumor growth and expansion patterns due to cell proliferation and migration are neither pre-defined nor intuitive, but rather are the accumulated result of dynamic interactions between individual cells, and between cells and their biochemical microenvironment. The model can be used to quantify the relationship between extracellular stimuli, intracellular signaling dynamics, and multi-cellular tumor growth and expansion. Thus, in this study the above-described NSCLC model is employed as the modeling platform to investigate the cross-scale effects of simultaneous pathway parameter variations on tumor outcome at the microscopic scale.
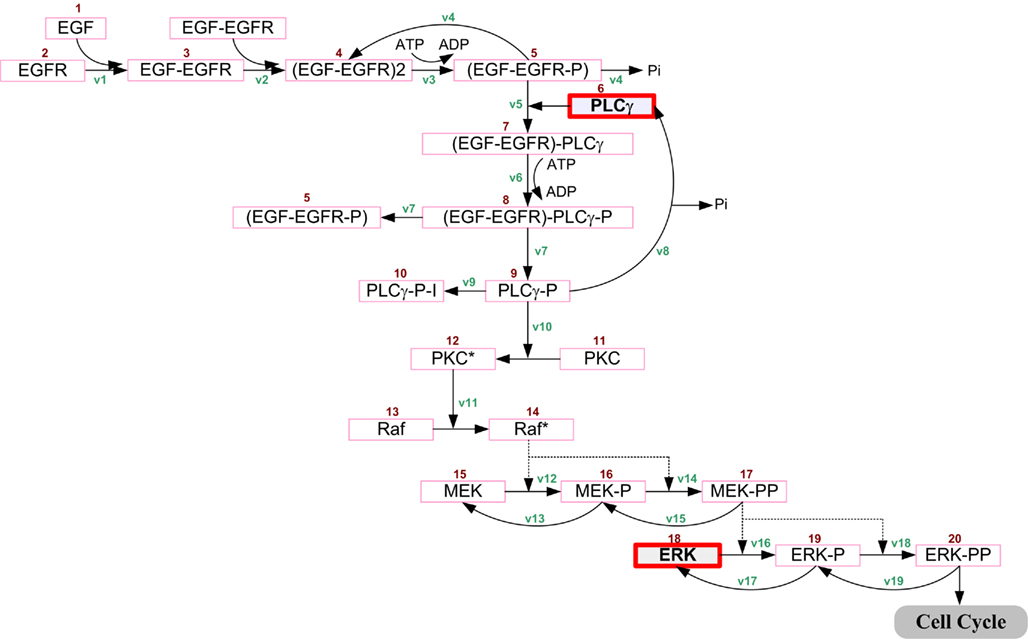
Figure 1. Non-small cell lung cancer-specific EGF-induced EGFR-mediated signal transduction pathway model previously developed in Wang et al. (2007). Extracellular EGF binds to the EGF receptor on the cell membrane, inducing receptor dimerization and autophosphorylation. The bound receptor forms a docking site for the signaling molecule PLCγ, which then activates the Raf signal through PKC. This process then initiates the ERK signaling cascade. Detailed chemical reactions, including rate constants and initial concentrations of components, are described in Wang et al. (2007). The two highlighted molecules, PLCγ and ERK, are used in an experimentally supported, molecularly driven cellular phenotypic decision algorithm (Wang et al., 2007, 2009). Reproduced with permission from Wang et al. (2007).
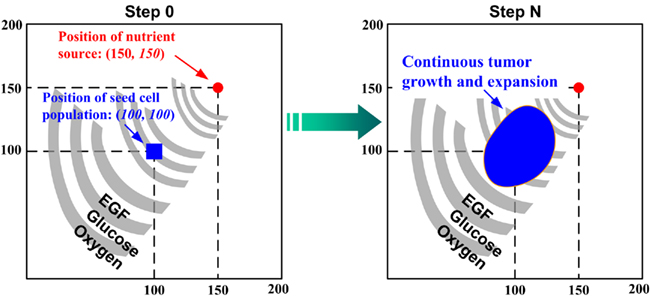
Figure 2. A virtual 2D microenvironment with a discrete lattice containing 200 × 200 grid points (Wang et al., 2007). A single, distant blood vessel representing a “nutrient source” is located at (150,150) and a number of 7 × 7 cancer cells are initially positioned in the center of the lattice. The diameter of each cell is 10μm. A heterogeneous biochemical environment is attained by normally distributing three external diffusive chemical cues (EGF, glucose, and oxygen tension) throughout the 2D microenvironment. The assigned initial values of these chemical cues are weighted by the distance of a grid point from the nutrient source. Hence the nutrient source, representing a blood vessel, is the most attractive location for the chemotactically acting tumor cells, because it maintains the highest weight for each aforementioned chemical cue. Moreover, throughout the simulation, the concentrations of these three chemical cues are continuously updated at a fixed rate (see Wang et al., 2007 for corresponding equations). When the first cell reaches the nutrient source, the simulation run is terminated. One of the important features of this multiscale model is that each cell encompasses a self-maintained molecular signaling pathway (see Figure 1).
Using ANOVA to Assess Parameter Sensitivity
Analysis of variance evaluates the effects of the inputs (i.e., independent variables) on the response (i.e., output or dependent variable) by decomposing the response into an overall mean (μ), main factor effects, interaction effects, and an error term (ε), and then provides their corresponding estimates (Winter et al., 1991). In ANOVA, each input factor has to be assigned specific ranges of values (also termed “factor levels”). Here is an example of a two-way (i.e., two input factors) ANOVA with a single response variable (Y):

where i refers to the level of factor A, j refers to the level of factor B, and k refers to the kth value of the response variable. Ai, Bj, and (A × B)i,j represent the main effect of the ith level of factor A, the main effect of the jth level of factor B, and the interaction effect between the two factors, respectively. Corresponding equations can be deduced in the same way for three or more input factors. ANOVA uses the F-test to examine the significance of each main or interaction effect, thus determining whether a statistically significant difference exists between mean responses for main effects or interactions between input factors. Thus, an F value is used as the sensitivity index to evaluate the effects of a factor (input parameter) on model output and then to rank the parameters. The higher the F value, the more a parameter contributes to changes in the output, and thus the more critical the parameter is in the model.
Integrated Global Sensitivity Analysis
We propose an integrated GSA method that includes a process for preparing the basic input data samples, and a process for performing the analysis and quantifying the distribution of the sensitivity index (i.e., F value). We exemplify each process using the aforementioned 2D NSCLC multiscale model.
Data sample preparation
Continuous input parameters (in our case, the initial concentrations of pathway components) are first partitioned into mutually exclusive ranges of values, and each individual range is termed a parameter level. Exploring the entire parameter space will provide the most accurate, comprehensive understanding of a system, but is computationally impractical unless the number of parameters or parameter levels is small. For example, suppose we have M parameters and for each parameter we have N levels; this will generate a total of NM combinations. The number of simulations (each corresponding to a mutually independent parameter set) grows exponentially as M or N increases. The other reason for its impracticality is that the 2D multiscale cancer model takes a relatively long time to finish, depending on the final size of the simulated tumor, because each cell has to undergo a series of pathway analyses throughout the course of the simulation (with 3D discrete models taking even longer). For this reason, we use a random sampling of input parameters to make the large number of variation combinations computationally manageable. Specifically, we use the Latin hypercube sampling (LHS) method (McKay et al., 1979; Iman and Conover, 1980) to generate 2000 random sets of parameter values which evenly cover individual parameter ranges simultaneously. The LHS is a widely used variant of the standard Monte Carlo method, which allows for an unbiased estimate of the average model output. The advantage of this approach is that the random samples are generated from all of the ranges of possible values, thus giving insight into the extremes of the probability distributions of the outputs. That is, the use of LHS helps to ensure maximal sampling through each parameter dimension.
With the 2000 random sets of parameter values, 2000 simulation runs will be carried out accordingly, and hence will generate 2000 sets of simulation results. Note that, with our multiscale cancer model, to investigate the effects of how molecular changes in individual cancer cells percolate throughout and across the scales of a cancer system, the model output (i.e., biological response of the tumor) is no longer the behavior of output signals or signal activation patterns (as is the case in most current signaling pathway studies Murphy and Blenis, 2006); but rather, they are the tumor’s growth and expansion rate, two phenotypic behaviors at the microscopic level. Similar to previous studies (Wang et al., 2008, 2009), we use the number of elapsed time steps as a measure for “tumor expansion rate,” and the final number of live cells for “tumor (area or, more generally) volume.” We note here that a greater number of time steps until termination indicates a slower tumor expansion rate in a given simulation. For simplicity, we call each set of parameter values along with the corresponding two tumor output values an observation (see Figure 3A for an illustration). Hence, at the end of this data preparation process, we have 2000 observations. Hereafter, the 2000 observations (consisting of input parameter values and corresponding output responses) are referred to as the original sample.
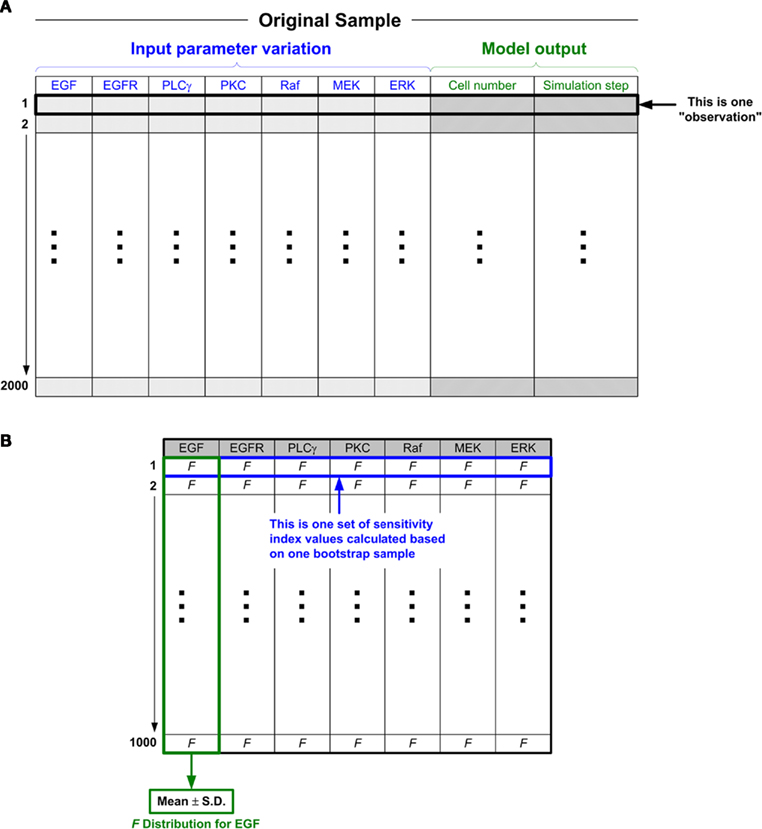
Figure 3. The ANOVA-based GSA procedure for the 2D multiscale lung cancer model. (A) Schematic illustration of the original sample. An “observation” is composed of two parts: input and output. Combining the input and output parts into one observation facilitates the subsequent analysis. For example, when we use the bootstrap method (see below) to process resampling, one observation is regarded as one set of data. As shown in the figure, there are a total of 2000 such observations (this number can be set to meet different research purposes, i.e., as investigators see fit given their empirical results; “2000” is the number that we assume to be sufficient to obtain a “fair” parameter ranking). All the observations as a whole are taken as a sample, and we call this sample the “original sample.” (B) Structure of the sensitivity index values calculated based on the 1000 bootstrap samples. There are 1000 corresponding F values for each input parameter (e.g., EGF), from which the quantification of F values can be drawn. The simplest statistical measure is to calculate the mean value and standard deviation of the 1000 F values.
Analysis
We plan to only consider the main effect for input (independent) parameters because it has been found that interaction effects contribute almost insignificantly when compared to the main effect (Pant and Ghosh, 2006); also, doing so is a reasonable way to reduce the initial complexity of the system. As mentioned above, the F value calculated by the F-test is the sensitivity index for ANOVA. We note here that, based on the original sample (containing 2000 observations) generated in the previous data preparation process, ANOVA can already yield a parameter sensitivity ranking. The specific procedure for performing ANOVA on an input parameter is as follows. Assume parameter A has N treatment levels (corresponding to treatment groups in biological experiments). For each treatment level, we perform a number of 2000/N “virtual” experiments (this number, dependent on the LHS method, should roughly be 2000/N but may be different). Thus, we perform a total of 2000 “virtual” experiments based on these treatment levels for parameter A. In the end, with respect to each dependent variable, we have 2000 lines of measured experimental data. ANOVA is then used to compare means of these treatment levels using the F-test.
However, although the original sample is generated with the sophisticated LHS method, there is still the possibility that the sample data is biased, which would make the resultant ranking incorrect. To produce more convincing results, we seek to further quantify the sampling distribution of the sensitivity index (i.e., F value). A straightforward approach to understand such distributions of F values is as follows: create more, different sets of sample data (each sample again contains as many parameter combinations as the original sample), run the multiscale model with each parameter set in each sample, perform an F-test to calculate the F value for each parameter for each sample, and then, using all of the obtained results, quantify the distribution of F values. Since this approach is computationally costly, we employ a bootstrap method (Henderson, 2005). In brief, bootstrapping repeatedly samples the original sample with replacement and forms a new sample that is the same size as the original sample. The most attractive feature of bootstrapping is that we do not have to run the multiscale cancer model again, saving a great deal of time. In our study, we generate 1000 bootstrap samples (including the original sample) and then apply ANOVA to each bootstrap sample to calculate corresponding F values (Figure 3B). As a result, with respect to each model output (tumor volume or expansion rate), there will be 1000 sensitivity index values (each corresponding to a bootstrap sample) generated for each input parameter. Probability distributions of sensitivity indices can then be drawn from these results.
Results
The first 2000 sets of parameter combinations (i.e., the original sample) were created with Matlab 2008 (Mathworks, Inc.). All of the statistical analysis programs for running ANOVA and bootstrap resampling were developed with SAS/STAT 9.2 (SAS Institute). The 2D agent-based model was developed in C/C++. All simulation runs were carried out on a 19-node dual-CPU supercomputer, and each simulation run took about 10 min to finish. In this study, we only considered the initial concentrations of seven EGFR pathway components (EGF, EGFR, PLCγ, PKC, Raf, MEK, and ERK; see Figure 1) as input parameters. Parameter variation ranges were set large enough to cover the entire possible parameter space. Moreover, a variation range was partitioned into levels by means of evenly spaced intervals for each parameter. Table 1 summarizes the input parameter variation ranges and corresponding levels. In a parameter ranking, a rank of 1 was assigned to an input with the highest sensitivity index, and the largest value of rank was assigned to the input with the least importance (i.e., lowest sensitivity index).
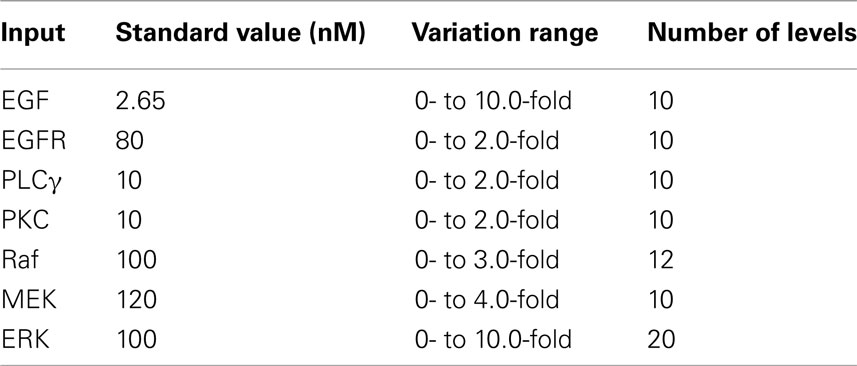
Table 1. Variation ranges and corresponding levels of input parameters.
ANOVA-Based Ranking
Table 2 summarizes the ranking results when using the ANOVA method with 1000 bootstrap samples. For tumor volume evaluation (Part I of Table 2), ERK appears at the top of the ranking of the seven inputs, which is not surprising since ERK determines a cell’s proliferation fate in our phenotypic decision algorithm of the 2D multiscale model (Wang et al., 2007). MEK holds the second position, but its F value is only approximately 1/10 of that of ERK, implying that ERK is far more important than MEK in influencing the emergent tumor volume. The remaining five molecules all have F values that are small when compared to the aforementioned two. In the tumor expansion rate evaluation (Part II of Table 2), ERK is again the top input, followed by PLCγ and EGFR. This is somewhat surprising since we assumed that PLCγ would have the most significant impact on tumor expansion because it is the determinant of cell migration fate (Wang et al., 2007). The differences in F values for the top three parameters are not substantial, but the F value starts to drop dramatically from EGFR to MEK (the number 4 parameter), indicating that the last four parameters (including MEK) are likely not as important as the top three.
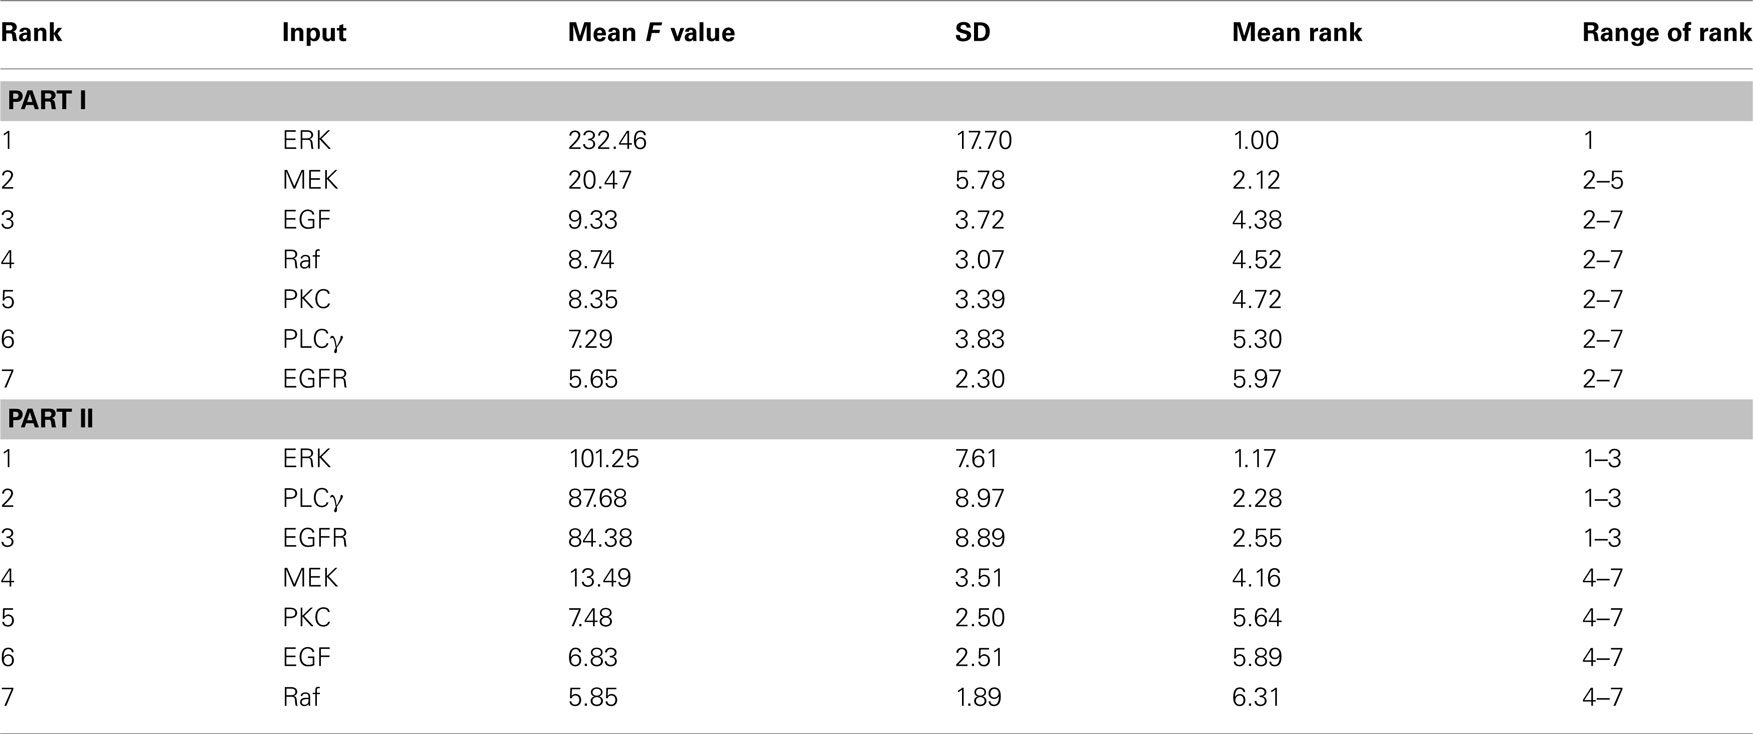
Table 2. Summary of the ANOVA-based results from 1000 bootstrap simulations for F value statistics, with respect to the final number of live cells – tumor volume (Part I) and the number of simulation steps – tumor expansion rate (Part II).
For each input parameter, we also quantify the arithmetic mean of the 1000 individual ranks (corresponding to the 1000 bootstrap samples) and the range of rank (last two columns of Table 2). ERK is the first-ranked parameter for all bootstrap samples in the tumor volume evaluation. However, tumor expansion rate evaluation using sample data shows that ERK is not always the most sensitive parameter (the range of rank for ERK is 1–3). Moreover, all other parameters also exhibit different ranks across different bootstrap samples. This result indicates that the introduction of bootstrapping into the GSA workflow is necessary to produce non-biased parameter rankings, especially when only a relatively small or moderate size of data samples is available.
Comparison with Local Sensitivity Analysis
We performed an analysis on the multiscale model using the LSA method adopted in Wang et al. (2008). In brief, a sensitivity coefficient (SC) was used as an index to evaluate how a change in a single pathway component affects the overall system response at the microscopic level. This coefficient was calculated by the following equation:

where p represents the parameter that is varied in a simulation and M, the response of the system; M0 is obtained by setting all parameters to their reference values, and thus (Mi − M0) is the change in M due to the change in p, i.e., (pi − p0). Similar to the ANOVA-based sensitivity analysis, the system response M here also corresponds to either tumor volume or tumor expansion rate, i.e., tumor behavior at the multicellular level. Note here that two conditions result in a positive SC (taking tumor volume evaluation as an example): an increased tumor volume with increasing levels of a parameter, and a decreased tumor volume with decreasing levels of a parameter. For instance, if the tumor volume is increased (i.e., Mi> M0) and a certain parameter value is increased as well (i.e., pi > p0), then by using Eq. 1, the resultant SC will be positive. Similarly, two conditions result in a negative SC: an increased tumor volume with decreasing levels of a parameter, and a decreased tumor volume with increasing levels of a parameter.
Parameter variation ranges for this LSA analysis were the same as those listed in Table 1. For each parameter, we created 101 variations, from 0 to its maximum value with increments of 1.0% of the maximum value. Taking EGF variation as an example, variation values were [0, 0.1, 0.2, …, 10.0]-fold of the parameter’s reference value. Note that the reference value for each parameter, i.e., a variation of 1.0-fold, was discarded when calculating SC values using Eq. 2. Only one parameter was varied when running a simulation, and all other parameters were held fixed at their reference values. Figure 4 illustrates the SCs of each input parameter. In tumor volume evaluation, MEK appears to be the most sensitive parameter in the model, with the maximum absolute value of a SC of 2.36 occurring at a variation of 0.96-fold of MEK’s reference value. In tumor expansion rate evaluation, three parameters, EGFR, PLCγ, and PKC, are identified to have the most significant impact on tumor expansion. A variation of 1.02-fold of the reference values of the three parameters results in the maximum absolute SC value, i.e., 4.48. In fact, ERK with a variation of 1.02-fold of its reference value also results in a SC value of 4.48 (data not shown). This result signifies that, with respect to tumor expansion rate evaluation, the LSA cannot discriminate between the importance of these parameters to the model. The overall ranking results from this LSA differed from what we obtained with the ANOVA-based GSA.
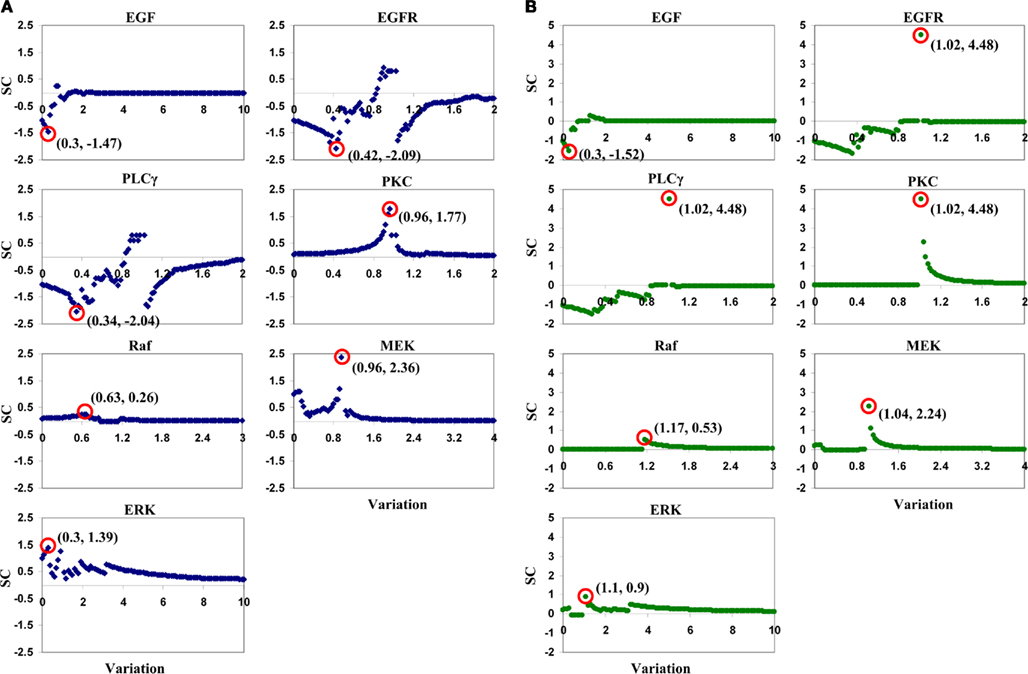
Figure 4. Plots of sensitivity coefficients for the seven input parameters with respect to (A) tumor volume and (B) tumor expansion rate. The variation range for each parameter is listed in Table 1. SC stands for sensitivity coefficient. The first number in the parentheses in each sub-plot is the variation (in fold) of a corresponding parameter that results in the maximum absolute value of the sensitivity coefficients, and the second shows the sensitivity coefficient value. For example, for the EGF sub-plot in (A), “(0.3, −1.47)” means that, in tumor volume evaluation by varying EGF concentrations, the maximum absolute value of sensitivity coefficients is −1.47, and it occurs at a 0.3-fold variation of the EGF reference value.
Validation with Multivariate Linear Regression Analysis
Sobie (2009) developed a method using multivariate linear regression analysis combined with parameter randomization to quantify parameter sensitivities in electrophysiological models, and then demonstrated the power of this method to compare the relative effects of different parameters in determining outputs of complex non-linear computational models. Because it allows multiple parameters to vary at the same time, this method belongs to the GSA category. We used Sobie’s regression-based method to validate our ANOVA-based ranking results by performing another set of analysis on the original sample (containing 2000 sets of parameter combinations). Ranking results are shown in Figure 5. The regression coefficients indicate how changes in input parameters lead to changes in outputs, and examining these coefficients allows for an assessment of the relative contributions of the various parameters. In tumor volume evaluation (Figure 5A), ERK is the most sensitive parameter, followed by MEK. In tumor expansion rate evaluation (Figure 5B), ERK, EGFR, and PLCγ are the top 3 parameters in the order of their importance. Comparing Figure 5 with Table 2 confirms that the ranking results produced by both regression- and ANOVA-based analyses are in good agreement.
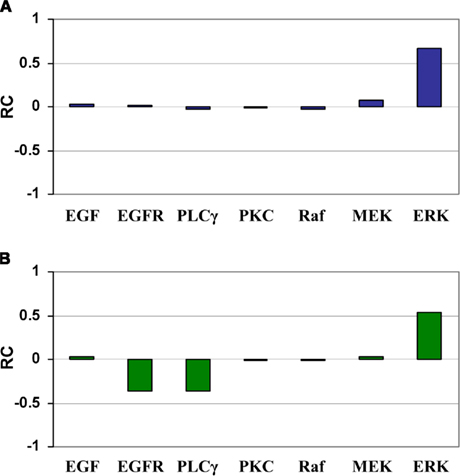
Figure 5. Regression coefficients for the seven input parameters with respect to (A) tumor volume and (B) tumor expansion rate. (A) Increase in ERK and MEK leads to a bigger tumor volume, whereas changes in other parameters have little effect. (B) Increase in ERK and decreases in EGFR and PLC lead to a larger number of simulation steps (i.e., slower tumor expansion rate), whereas changes in other parameters have little effect. RC stands for regression coefficient.
Discussion and Future Work
We have presented an applicable GSA method for multiscale cancer models with the use of a number of support techniques, including LHS sampling, Bootstrap resampling, and ANOVA. We exemplified the applicability of this method using a previously developed 2D multiscale NSCLC model (Wang et al., 2007). The effects of the input parameters on model outputs were quantified by simultaneously varying all of the parameters over the entire parameter space. Moreover, the computing time required for prioritizing the importance of parameters was considerably reduced by the introduction of Bootstrap resampling. The final parameter ranking results indicate that ERK is the most critical parameter at the molecular scale, chiefly regulating the two tumor growth indices, i.e., tumor volume and expansion rate, on the multi-cellular level. The ranking results from the GSA and LSA were different, but we believe the GSA-based analysis provides more convincing and realistic results because, unlike with LSA, multiple parameters are allowed to change simultaneously. This finding therefore supports therapeutic efforts that seek to target ERK to control overall tumor growth in NSCLC.
ERK, the decision molecule for cell proliferation, appears to have the most significant impact on both tumor growth indices. It is counterintuitive that ERK is more important than PLCγ in regulating the tumor’s spatial expansion rate because PLCγ is used as the key component for determining a migratory phenotypic switch. However, many experimental studies have observed that the activation of ERK signaling is directly associated with both cancer growth and metastasis in a number of cancer types, including lung cancer (Tan et al., 2004; Cheng et al., 2008; Ming et al., 2009). Hence, our in silico analysis results, to some degree, are in agreement with these experimental findings. As noted before, a sensitivity analysis method may produce different parameter rankings with respect to either tumor growth index, and this is precisely what we find in our cross-scale analysis (Table 2). In tumor expansion rate evaluation, PLCγ and EGFR have demonstrated their importance with the ANOVA-based GSA, and thus they are also (in addition to ERK) considered important parameters. It is different from tumor volume evaluation, where only ERK demonstrates a dominating position.
In both tumor volume and expansion rate evaluation, PKC is assigned the lowest ranking with the ANOVA-based GSA, and thus is deemed to be a less-important parameter. However, this finding conflicts with the LSA analysis, where PKC was observed to be one of the most sensitive parameters affecting tumor expansion rate. Since the LSA method only varied a single parameter at a time while keeping all others fixed, we believe it only accessed the baseline of the effect of perturbations in each individual parameter. Furthermore, the ranking results produced by the ANOVA-based GSA were mostly consistent with the results of the multivariate regression analysis (Figure 5). Thus, very cautiously extrapolating the findings of this theoretical study, ERK appears to be a more valuable therapeutic target than PKC in regulating tumor expansion.
The LSA carried out in this study is not a thorough analysis. Rather, the main purpose of performing LSA here is to demonstrate that the LSA and our ANOVA-based GSA produce different parameter ranking results. There are discontinuities in SC values for some parameters, e.g., for the “sudden” peak for EGFR and PLCγ in Figure 4B. This outcome is not a system error, but indicates that the parameter is highly sensitive around that concentration value. In fact, other systems models also exhibit this behavior – for example (Hornberg et al., 2005). Moreover, a small variation in a parameter’s reference value resulted in a relatively big change on model output (e.g., PKC and MEK in Figure 4A, and EGFR, PLCγ, PKC, and MEK in Figure 4B). This result is not surprising either, because many other biological systems have shown this response behavior to system input (Calabrese, 2005).
In summary, we have presented a readily applicable, integrated GSA method to identify and rank critical parameters at the molecular level that have significant impact on tumor volume and expansion rate at the microscopic level. Applying the method to a previously developed multiscale lung cancer model, ERK is found to be the most critical molecule in regulating both tumor growth indices, thus indicating its potential to serve as a therapeutic target in treating NSCLC. In the future, we plan on taking into account other types of GSA methods since there is no single ultimate method that best fits all types of systems biology models. Then, a consistently high ranking confirmed by different GSA methods may even more convincingly confirm the value of a molecule to serve as a therapeutic target in pharmacological drug discovery efforts. Such an approach is helpful and necessary, especially when the resulting parameter rankings differ from each other. Additionally, kinetic rate constants will also be considered as molecular parameters, and their cross-scale effects will be examined together with the signaling pathway component concentrations.
Conflict of Interest Statement
The authors declare that the research was conducted in the absence of any commercial or financial relationships that could be construed as a potential conflict of interest.
Acknowledgments
This work has been supported in part by NIH grant CA 113004 and by the Harvard-MIT (HST) Athinoula A. Martinos Center for Biomedical Imaging and the Department of Radiology at Massachusetts General Hospital.
References
Ashraf, H. R., White, M., and Klubek, B. (1999). Microbiological survey of tofu sold in a rural Illinois county. J. Food Prot. 62, 1050–1053.
Bentele, M., Lavrik, I., Ulrich, M., Stosser, S., Heermann, D. W., Kalthoff, H., Krammer, P. H., and Eils, R. (2004). Mathematical modeling reveals threshold mechanism in CD95-induced apoptosis. J. Cell Biol. 166, 839–851.
Calabrese, E. J. (2005). Cancer biology and hormesis: human tumor cell lines commonly display hormetic (biphasic) dose responses. Crit. Rev. Toxicol. 35, 463–582.
Cheng, Y. J., Lee, C. H., Lin, Y. P., Huang, J. Y., Su, C. C., Chang, W. T., and Yang, B. C. (2008). Caspase-3 enhances lung metastasis and cell migration in a protease-independent mechanism through the ERK pathway. Int. J. Cancer 123, 1278–1285.
Dittmar, T., Husemann, A., Schewe, Y., Nofer, J. R., Niggemann, B., Zanker, K. S., and Brandt, B. H. (2002). Induction of cancer cell migration by epidermal growth factor is initiated by specific phosphorylation of tyrosine 1248 of c-erbB-2 receptor via EGFR. FASEB J. 16, 1823–1825.
Frey, H. C., and Patil, S. R. (2002). Identification and review of sensitivity analysis methods. Risk Anal. 22, 553–578.
Gerken, M., Kreienbrock, L., Wellmann, J., Kreuzer, M., and Wichmann, H. E. (2000). Models for retrospective quantification of indoor radon exposure in case-control studies. Health Phys. 78, 268–278.
Golinkin, I. A., Ruff, D. D., Kvam, E. P., McCabe, G. P., and Grandt, A. F. (1997). Application of analysis of variance (ANOVA) statistical methods to breaking load corrosion test. J. Test. Eval. 25, 565–570.
Helton, J. C., Johnson, J. D., Sallaberry, C. J., and Storlie, C. B. (2006). Survey of sampling-based methods for uncertainty and sensitivity analysis. Reliab. Eng. Syst. Saf. 91, 1175–1209.
Henderson, A. R. (2005). The bootstrap: a technique for data-driven statistics. Using computer-intensive analyses to explore experimental data. Clin. Chim. Acta 359, 1–26.
Hornberg, J. J., Binder, B., Bruggeman, F. J., Schoeberl, B., Heinrich, R., and Westerhoff, H. V. (2005). Control of MAPK signalling: from complexity to what really matters. Oncogene 24, 5533–5542.
Iman, R. L., and Conover, W. J. (1980). Small sample sensitivity analysis techniques for computer-models, with an application to risk assessment. Commun. Stat. Theor. Meth. 9, 1749–1842.
Jemal, A., Siegel, R., Xu, J., and Ward, E. (2010). Cancer statistics, 2010. CA Cancer J. Clin. 60, 277–300.
Marino, S., Hogue, I. B., Ray, C. J., and Kirschner, D. E. (2008). A methodology for performing global uncertainty and sensitivity analysis in systems biology. J. Theor. Biol. 254, 178–196.
McKay, M. D., Beckman, R. J., and Conover, W. J. (1979). Comparison of 3 methods for selecting values of input variables in the analysis of output from a computer code. Technometrics 21, 239–245.
Ming, J., Liu, N., Gu, Y., Qiu, X., and Wang, E. H. (2009). PRL-3 facilitates angiogenesis and metastasis by increasing ERK phosphorylation and up-regulating the levels and activities of Rho-A/C in lung cancer. Pathology 41, 118–126.
Mishra, S., Deeds, N., and Ruskauff, G. (2009). Global sensitivity analysis techniques for probabilistic ground water modeling. Ground Water 47, 730–747.
Mokhtari, A., and Frey, H. C. (2005). Sensitivity analysis of a two-dimensional probabilistic risk assessment model using analysis of variance. Risk Anal. 25, 1511–1529.
Murphy, L. O., and Blenis, J. (2006). MAPK signal specificity: the right place at the right time. Trends Biochem. Sci. 31, 268–275.
Pant, D. K., and Ghosh, A. (2006). A systems biology approach for the study of cumulative oncogenes with applications to the MAPK signal transduction pathway. Biophys. Chem. 119, 49–60.
Pet-Armacost, J. J., Sepulveda, J., and Sakude, M. (1999). Monte Carlo sensitivity analysis of unknown parameters in hazardous materials transportation risk assessment. Risk Anal. 19, 1173–1184.
Sahle, S., Mendes, P., Hoops, S., and Kummer, U. (2008). A new strategy for assessing sensitivities in biochemical models. Philos. Trans. A Math. Phys. Eng. Sci. 366, 3619–3631.
Sanga, S., Frieboes, H. B., Zheng, X., Gatenby, R., Bearer, E. L., and Cristini, V. (2007). Predictive oncology: a review of multidisciplinary, multiscale in silico modeling linking phenotype, morphology and growth. Neuroimage 37(Suppl. 1), S120–S134.
Santos, S. D., Verveer, P. J., and Bastiaens, P. I. (2007). Growth factor-induced MAPK network topology shapes Erk response determining PC-12 cell fate. Nat. Cell Biol. 9, 324–330.
Sobie, E. A. (2009). Parameter sensitivity analysis in electrophysiological models using multivariable regression. Biophys. J. 96, 1264–1274.
Sobol, I. (1993). Sensitivity estimates for nonlinear mathematical models. Math. Model. Comput. Exp. 1, 407–414.
Tan, X., Tamori, Y., Egami, H., Ishikawa, S., Kurizaki, T., Takai, E., Hirota, M., and Ogawa, M. (2004). Analysis of invasion-metastasis mechanism in pancreatic cancer: involvement of tight junction transmembrane protein occludin and MEK/ERK signal transduction pathway in cancer cell dissociation. Oncol. Rep. 11, 993–998.
van Riel, N. A. (2006). Dynamic modelling and analysis of biochemical networks: mechanism-based models and model-based experiments. Brief. Bioinform. 7, 364–374.
Wang, Z., Birch, C. M., and Deisboeck, T. S. (2008). Cross-scale sensitivity analysis of a non-small cell lung cancer model: linking molecular signaling properties to cellular behavior. Biosystems 92, 249–258.
Wang, Z., Birch, C. M., Sagotsky, J., and Deisboeck, T. S. (2009). Cross-scale, cross-pathway evaluation using an agent-based non-small cell lung cancer model. Bioinformatics 25, 2389–2396.
Wang, Z., and Deisboeck, T. S. (2008). Computational modeling of brain tumors: discrete, continuum or hybrid? Sci. Model. Simul. 15, 381–393.
Wang, Z., Zhang, L., Sagotsky, J., and Deisboeck, T. S. (2007). Simulating non-small cell lung cancer with a multiscale agent-based model. Theor. Biol. Med. Model. 4, 50.
Winter, B. J., Brown, D. R., and Michels, K. M. (1991). Statistical Principles in Experimental Design. New York: McGraw-Hill Inc.
Zhang, H. X., Dempsey, W. P. Jr., and Goutsias, J. (2009). Probabilistic sensitivity analysis of biochemical reaction systems. J. Chem. Phys. 131, 094101.
Zhang, Y., and Rundell, A. (2006). Comparative study of parameter sensitivity analyses of the TCR-activated Erk-MAPK signalling pathway. Syst. Biol. (Stevenage) 153, 201–211.
Keywords: agent-based model, analysis of variance, multiscale, non-small cell lung cancer, sensitivity analysis
Citation: Wang Z, Bordas V and Deisboeck TS (2011) Identification of critical molecular components in a multiscale cancer model based on the integration of Monte Carlo, resampling, and ANOVA. Front. Physio. 2:35. doi: 10.3389/fphys.2011.00035
Received: 04 February 2011; Accepted: 20 June 2011;
Published online: 05 July 2011.
Edited by:
John Jeremy Rice, Functional Genomics and Systems Biology, USAReviewed by:
Eric A. Sobie, Mount Sinai School of Medicine, USAFeilim Mac Gabhann, Johns Hopkins University, USA
Copyright: © 2011 Wang, Bordas and Deisboeck. This is an open-access article subject to a non-exclusive license between the authors and Frontiers Media SA, which permits use, distribution and reproduction in other forums, provided the original authors and source are credited and other Frontiers conditions are complied with.
*Correspondence: Thomas S. Deisboeck, Complex Biosystems Modeling Laboratory, Harvard-MIT Athinoula A. Martinos Center for Biomedical Imaging, Massachusetts General Hospital-East, 2301, Building 149, 13th Street, Charlestown, MA 02129, USA. e-mail: deisboec@helix.mgh.harvard.edu