 Leon S. Farhy1*† Alice Chan2† Marc D. Breton2 Stacey M. Anderson1 Boris P. Kovatchev2 Anthony L. McCall1
- 1 Division of Endocrinology and Metabolism, Department of Medicine, University of Virginia, Charlottesville, VA, USA
- 2 Center for Diabetes Technology, University of Virginia, Charlottesville, VA, USA
Glucagon counterregulation (GCR) protects against hypoglycemia, but is impaired in type 1 diabetes (T1DM). A model-based analysis of in vivo animal data predicts that the GCR defects are linked to basal hyperglucagonemia. To test this hypothesis we studied the relationship between basal glucagon (BasG) and the GCR response to hypoglycemia in 29 hyperinsulinemic clamps in T1DM patients. Glucose levels were stabilized in euglycemia and then steadily lowered to 50 mg/dL. Glucagon was measured before induction of hypoglycemia and at 10 min intervals after glucose reached levels below 70 mg/dL. GCR was assessed by CumG, the cumulative glucagon levels above basal; MaxG, the maximum glucagon response; and RIG, the relative increase in glucagon over basal. Analysis of the results was performed with our mathematical model of GCR. The model describes interactions between islet peptides and glucose, reproduces the normal GCR axis and its impairment in diabetes. It was used to identify a control mechanism consistent with the observed link between BasG and GCR. Analysis of the clinical data showed that higher BasG was associated with lower GCR response. In particular, CumG and RIG correlated negatively with BasG (r = −0.46, p = 0.012 and r = −0.74, p < 0.0001 respectively) and MaxG increased linearly with BasG at a rate less than unity (p < 0.001). Consistent with these results was a model of GCR in which the secretion of glucagon has two components. The first is under (auto) feedback control and drives a pulsatile GCR and the second is feedback independent (basal secretion) and its increase suppresses the GCR. Our simulations showed that this model explains the observed relationships between BasG and GCR during a three-fold simulated increase in BasG. Our findings support the hypothesis that basal hyperglucagonemia contributes to the GCR impairment in T1DM and show that the predictive power of our GCR animal model applies to human pathophysiology in T1DM.
Introduction
Defective hormonal counterregulation is the primary obstacle to safely achieving tight blood glucose (BG) control in type 1 diabetes (T1DM) and may result in up to threefold excess of severe hypoglycemia [The Diabetes Control and Complications Trial Research Group, 1993; UK Prospective Diabetes Study Group (UKPDS), 1998; The Action to Control Cardiovascular Risk in Diabetes Study Group, 2008]. In health, hypoglycemia defenses include in the order of their activation (Cryer and Gerich, 1983; Gerich, 1988): (i) reduction in β-cell insulin secretion, (ii) glucagon release from the pancreas, (iii) secretion of epinephrine by the adrenal medulla, (iv) sympathetic nervous system activation, (v) cortisol and growth hormone secretion, and (vi) hepatic auto-regulation. In T1DM, effective reduction in insulin secretion is not possible and the glucagon counterregulation (GCR) gradually disappears during the course of the disease (Gerich et al., 1973; Fukuda et al., 1988; Hoffman et al., 1994) even though the glucagon secreting α-cells in the pancreatic islets appear intact and respond to other stimuli. The abnormal GCR presents a major barrier to the safe treatment of the disease with intensive insulin therapy (Cryer, 1999, 2002; Segel et al., 2002) and even though extensively studied, the mechanism behind the GCR impairment remains unclear. One of the theories proposed to explain the deficiency in the GCR is the “switch-off” hypothesis. It hypothesizes that α-cell activation by hypoglycemia requires both the availability and rapid decline of intraislet insulin and attributes the defects in GCR in T1DM to loss of a (insulin) “switch-off” signal from the β-cells (Banarer et al., 2002). Some support for this theory was provided by animal (Zhou et al., 2004) and clinical data (Banarer et al., 2002).
To study the mechanisms of GCR and its impairment in T1DM we apply a system-level approach based on the premise that the glucagon time-dependent secretion is controlled by the action of a hormonal network within the endocrine pancreas. In vivo animal and in silico studies are thus combined to reconstruct the network mechanisms directing the glucagon release and the GCR response to hypoglycemia and how these mechanisms change in T1DM. We have developed a mathematical model of GCR which unifies interactions between islet peptides and glucose, reproduces the normal GCR control axis, and its impairment in diabetes in rodents. Using this model we have predicted that the GCR must be pulsatile in nature and develop as response of an intrapancreatic hormone feedback network to disinhibition of α-cells and hypoglycemia. We have supported this prediction by showing that in an insulin deficient animal model a defective GCR can be repaired in vivo by two different glucagon inhibiting signals (insulin and somatostatin) which upon switch-off during hypoglycemia trigger a pulsatile GCR response (Farhy et al., 2008). Further analysis of our rodent experimental data led to several modification of the initial GCR model (see Farhy and McCall, 2009a,b, 2010, 2011), which in its current form assumes that the secretion of glucagon has two components. The first component is under (auto) feedback control and drives a pulsatile glucagon response to hypoglycemia and the second component is feedback independent (basal secretion) and its increase suppresses the GCR. We have shown that this model replicates most of the in vivo behavior of the system and key experimental findings including the in vivo repair of GCR in diabetic rats by intrapancreatic infusion and termination (switch-off) during hypoglycemia of insulin (Zhou et al., 2004; Farhy et al., 2008) and somatostatin (Farhy et al., 2008). These additional model-based simulations led to the prediction that GCR defects are likely linked to basal hyperglucagonemia (Farhy and McCall, 2010, 2011). We have also proposed clinical strategies which use α-cell inhibitors to repair the defective GCR and stabilize insulin deficient diabetes although no human data is yet available (Farhy and McCall, 2011). The goal of the current study is to start testing our model-based predictions with clinical data. Accordingly, we examine here the relationship between basal glucagon (BasG) levels and various facets of the GCR response to insulin-induced hypoglycemia in T1DM subjects.
Materials and Methods
Methodology Outline
Our methodology to explore the link between basal hyperglucagonemia and GCR impairment in T1DM involves a combination of analysis of clinical data with model-based simulations. We use clinical data to confirm that BasG levels (understood as the glucagon concentrations during euglycemia) are negatively correlated with glucagon response to hypoglycemia. Then, we use our existing model of glucagon secretion to confirm that it is consistent with the clinical results in order to verify its predictive capabilities.
Subjects and Protocol Design
To investigate the relationship between BasG levels and GCR, T1DM patients were studied under controlled hospital conditions. Participants were treated overnight with a low-dose insulin infusion to attain near euglycemia and then the effects of hypoglycemia were estimated using a clamp procedure. Twenty-nine hyperinsulinemic euglycemic–hypoglycemic clamps were performed on 24 patients with type 1 diabetes. The time interval between the clamps in the five patients who were studied twice was at least 6 months, which allowed us to consider them to be independent. The study was approved by the University of Virginia Internal Review Board and was done at the University of Virginia General Clinical Research Center. All study participants have signed an informed consent form.
Study participants had a screening visit that included a history and physical examination. Laboratory testing included a urine microalbumin/creatinine ratio, human chorionic gonadotropin (HCG; females), HbA1c, hematocrit, and a comprehensive chemistry panel. The participants were on average (mean ± SD) 36.9 ± 12.4 years old, had had type 1 diabetes for 17.2 ± 9.7 years and had BMI of 25.7 ± 2.9 kg/m2. All volunteers were treating their diabetes (insulin pump or insulin injections) and had HbA1c of 7.9 ± 1.5% prior to the clamp. Before the admission, patients using long or intermediate acting (basal) insulin consulted with a study physician for insulin dose adjustment. Long-acting insulin was discontinued 60 h and intermediate acting insulin was discontinued 36 h prior to the clamp procedure. Only soluble (Regular) or rapid-acting analog insulin was allowed on the day of the admission. Participants were allowed to take their other outpatient medications, but glucocorticoids were excluded. Scrupulous avoidance of hypoglycemia was maintained in the week prior to the study. Patients were asked to try to keep their BG between 100 and 150 mg/dL and to perform frequent finger stick BG measurements (10 per day, at least 30 min apart) for reference values. Participants were admitted to the General Clinical Research Center on the evening prior to study. At 21:30 h, an intravenous infusion of soluble insulin (Novolin R, Novo Nordisk, Bagsværd, Denmark, 0.1 U/mL saline) was begun and titrated to maintain the participants’ BG overnight between 100 and 150 mg/dL as measured every 30 min using a YSI analyzer (YSI Life Sciences, OH, USA). This infusion was discontinued at 08:30 h the following morning at the initiation of the clamp procedure.
At time 0 an insulin infusion was given via Harvard pump (Harvard Apparatus, MA, USA) as a 20 mU/kg priming over 10 min followed by a constant 1 mU/kg/min infusion. Plasma glucose was measured at intervals of 5 min and clamped at basal levels via a variable-rate infusion of 20% dextrose using the equations of DeFronzo et al. (1979). BG levels were stabilized in euglycemia for 150 min and then lowered to 50 mg/dL using a previously validated hypoglycemic clamping technique to ensure steady descent into hypoglycemia (Baron et al., 1993). BG levels were maintained at that level for 30 min, and finally increased back to euglycemia. BasG concentration (GLbasal) was measured at tbasal, 10 min before the start of the descent into hypoglycemia. To assess GCR, glucagon levels were measured every 10 min from 25 to 135 min after starting the descent. Glucagon concentration was measured by radioimmunoassay (RIA kits, Millipore, MA, USA).
Measures of GCR and Statistical Analysis
The following measures were used to estimate various facets of the GCR response to hypoglycemia:
• MaxG (pg/mL): maximum GCR reached from 25 to 135 min after starting the descent into hypoglycemia.
• CumG (pg/mL × 90 min): cumulated glucagon levels above basal (integral of the concentration of glucagon minus BasG) computed from t70 to t70 + 90 min where t70 is the time when glucose levels crossed the threshold of 70 mg/dL.
• RIG (%): relative increase of glucagon computed by the formula:
Note that both CumG and RIG could have negative values.
An outline of the clamp procedure with an illustration of the GCR measures used is presented in Figure 1.
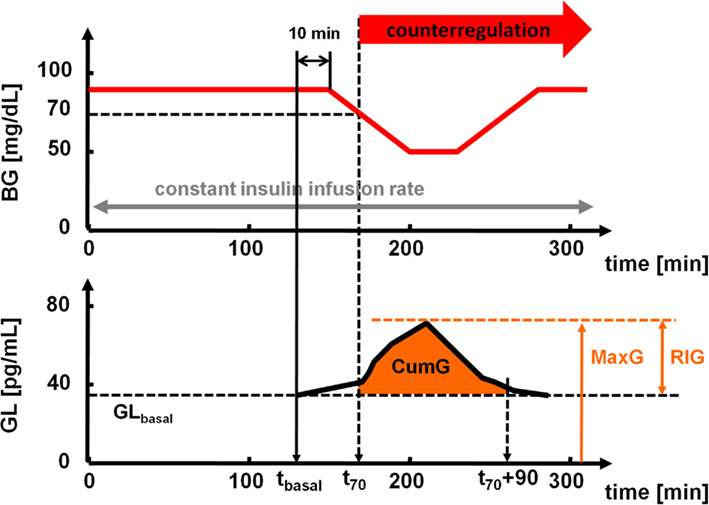
Figure 1. Top: timeline of the hyperinsulinemic euglycemic–hypoglycemic clamp. Bottom: schematic presentation of the measures used to estimate the GCR.
The relationships between GLbasal and MaxG, CumG, and RIG were examined using Pearson’s correlation. The analyses were performed using MATLAB 7.10 (R2010a), The MathWorks and PASW Statistics 18, SPSS Inc. Data are presented in mean ± SD.
Mathematical Model of GCR
We have recently developed and validated a mathematical model of GCR which approximates the rodent glucagon control axis and explains most of its in vivo behavior. This model shows that α-cell secretion is inhibited by hyperglycemia and has both basal, or auto-feedback independent (AFI) component and pulsatile, or auto-feedback regulated (AFR) component. In this work we use this model to determine the extent to which it is consistent with human data (above).
Figure 2 summarizes the interactions between BG and the α-cells to which we refer as a minimal control network (MCN) of glucagon secretion in the insulin deficient pancreas. Background supporting each of these interactions can be found elsewhere (Farhy et al., 2008; Farhy and McCall, 2009a,b, 2010, 2011). We note that the α-cell auto-feedback (Kawai and Unger, 1982) which is the key mediator of the system dynamic properties is likely indirect, mediated by δ-cell somatostatin [glucagon stimulates somatostatin (Utsumi et al., 1979; Epstein et al., 1980; Kawai and Unger, 1982; Stagner et al., 1988, 1989; Brunicardi et al., 2001) and, in turn, somatostatin inhibits glucagon (Klaff and Taborsky, 1987; Schuit et al., 1989; Sumida et al., 1994; Kleinman et al., 1995; Huypens et al., 2000; Portela-Gomes et al., 2000; Strowski et al., 2000; Brunicardi et al., 2001; Cejvan et al., 2003; Ludvigsen et al., 2004)].
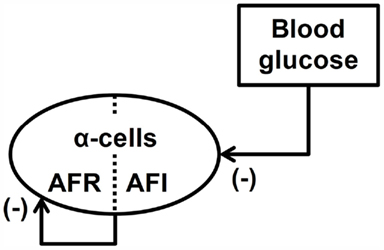
Figure 2. Minimal control network (MCN) of glucagon secretion in T1DM. AFR, auto-feedback regulated; AFI, auto-feedback independent.
To establish that the relationships shown in Figure 2 unify the primary interactions responsible for the control of GCR, we have approximated the MCN with a mathematical model and shown that it explains most of the in vivo behavior of the system. The model equation is shown below and is constructed following the methodology outlined in (Farhy, 2004).
Here, GL(t) and BG(t) are the time-dependent concentrations of glucagon and BG, respectively; the derivative is the rate of change with respect to time t. The half-life of glucagon determines the elimination constant kGL. The delay DGL, the half-maximal inhibitory doses (ID50-s), tBG, tGL, and the slopes nBG and nGL in the auto-feedback guarantee glucagon pulsatility with a frequency similar to that experimentally observed in rats (Farhy et al., 2008). The slope nBG is determined so that a glucose stimulus leads to an increase in insulin similar to that of published rat data. The secretion rates rGL and rGL,basal control the amplitude of the GCR. The physiological meaning of the parameters and the way they have been determined is explained in detail elsewhere (Farhy et al., 2008; Farhy and McCall, 2009a,b, 2010, 2011).
The nominal values of the parameters that appear in Eq. 1 are given in Table 1 in Farhy and McCall (2010). We note that these parameters have been determined to approximate rodent physiology. Here, to better approximate the human glucagon levels we have rescaled the values of GL by multiplying tGL, rGL, and rGL,basal by the scaling factor 0.24. Since the other parameters remain unchanged all dynamic properties of the model are preserved.
We have used the mathematical approximation outlined above to show that the MCN explains the observed in vivo pulsatile GCR response to hypoglycemia triggered by switch-off signals in insulin deficient rats (Farhy et al., 2008; Farhy and McCall, 2010) and other key experimental findings. These results exemplify the excellent agreement of the model predictions with the experimental observations. We note however, that this minimal model cannot explain reports in which hyperglycemia paradoxically increases glucagon levels (Olsen et al., 2005; Salehi et al., 2006).
In this work, the model of GCR is used to simulate the system response to hypoglycemia and changes in BasG (AFI: model parameter rGL,basal). To integrate Eq. 1 we used a Runge–Kutta 4 algorithm and its specific implementation within the software package Berkeley-Madonna.
Results
Measures of GCR and their Relationship with GLbasal
The measured patient’s GLbasal, MaxG, CumG, and RIG are shown in Table 1.
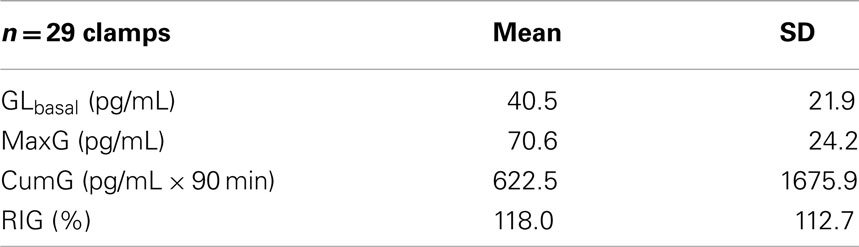
Table 1. Measures of basal glucagon and GCR in the study.
The calculated correlations between GLbasal and MaxG, CumG, and RIG which quantify the relationships between GLbasal and GCR are summarized in Table 2.
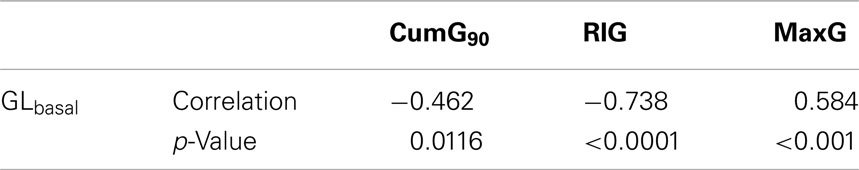
Table 2. Correlations between GLbasal and MaxG, CumG, and RIG.
The correlations in Table 2 demonstrate that higher BasG levels are associated with lower GCR response to hypoglycemia. In particular, there is a significant negative relationship between GLbasal and the measures of GCR which estimate the glucagon response over its basal values, CumG and RIG.
Figure 3 shows the scattered plot of CumG vs. GLbasal showing the negative relationship between these two markers.
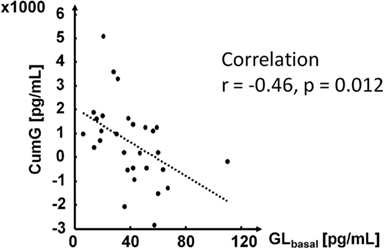
Figure 3. Relationship between GLbasal and CumG90.
As expected, the measured estimate of the absolute GCR, MaxG, was positively correlated with GLbasal. However, the increase of MaxG was slower than that of GLbasal as shown in Figure 4.
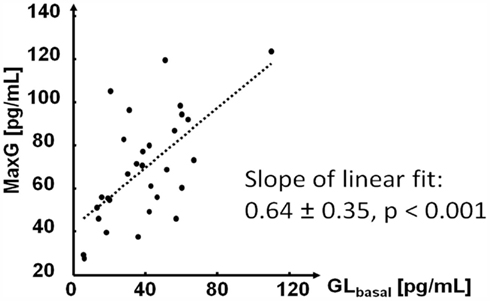
Figure 4. Relationship between GLbasal and MaxG.
Since the correlation between RIG and GLbasal could depend on the range of the data we use a bootstrap method which repeatedly randomly permutes MaxG (10,000 times) to verify its significance. We found that the originally obtained very high correlation (−0.738) have a p-value of 0.12 and is therefore not significant.
Figure 5 illustrates the glucagon dynamics during hypoglycemia in two representative subjects with different GLbasal values. The subject with a higher GLbasal had lower CumG, MaxG, and RIG.
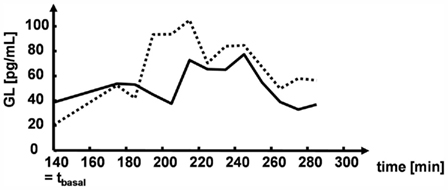
Figure 5. Illustrative glucagon levels in two study participants.
Model-Based Analysis
Figure 6 below shows the model response to hypoglycemia in two different simulations performed with different values of the parameter rGL,basal, which resulted in different BasG levels (18 pg/mL in the simulation depicted in the left panel and 28 pg/mL in the simulation shown on the right – more than 50% increase).
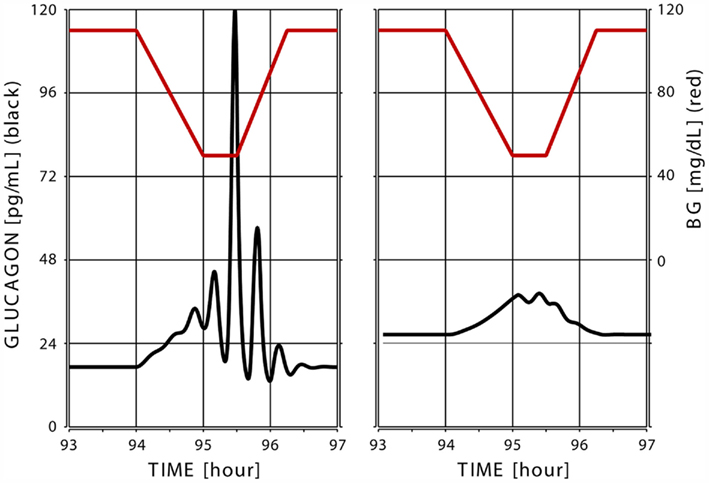
Figure 6. Simulated glucagon response (black) to superimposed hypoglycemia (glucose levels shown in red) in two “in silico” subjects with low (left) and high (right) basal glucagon.
To explore this further we performed a series of simulations in which we varied the parameter rGL,basal in a way that the BasG levels (before the decent into hypoglycemia) generally span the range detected in the experiments (40.5 ± 20.9 pg/mL; Table 1). Table 3 shows the results of the simulations in terms of the same measures that were used to assess the link between GLbasal and GCR in the experimental data.
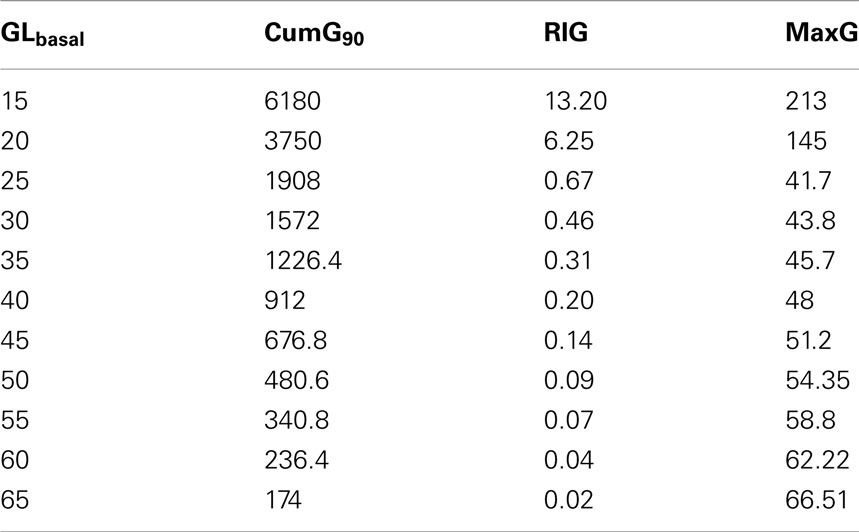
Table 3. MaxG, CumG, and RIG at different levels of GLbasal, which span the range detected in the experiments.
The left panel in Figure 7 depicts the relationship between GLbasal and MaxG in which GLbasal varies between 25 and 65 pg/dL. This range was chosen to show that it is possible to find a range that contains most of the experimentally observed BasG values (in this case, >70%) in which the linear fit has a slope similar to the one shown in Figure 4. We note that the simulated relationship between GLbasal and MaxG is clearly not linear and when GLbasal increases it approximates the diagonal. In other words, increase in GLbasal gradually obliterates the capacity of the system to counterregulate above this basal value. In addition we point out the fact that at the lower range of GLbasal the simulated counterregulation response rapidly increases as GLbasal decreases (see the first couple of rows in Table 3).
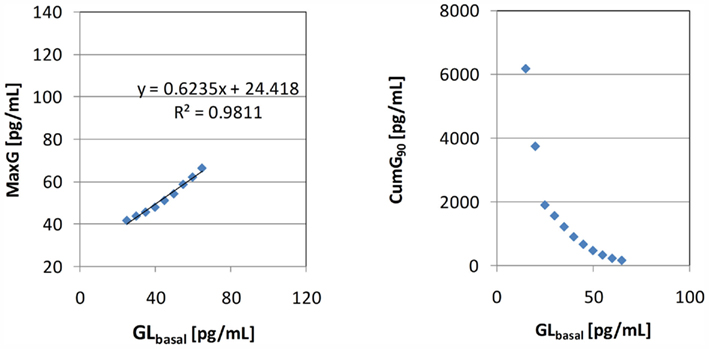
Figure 7. Left: relationship between GLbasal and MaxG (the equation is the linear data fit) Right: relationship between GLbasal and CumG90.
The scattered plot on the right panel in Figure 7 shows the link between the model predicted CumG and GLbasal. We note the apparent negative relationship as observed in the experiments and the rapid increase in CumG with further decrease in GLbasal.
Discussion
In type 1 diabetes defective hormonal counterregulation is the primary obstacle to achieving tight BG control. GCR disappears during the course of the disease, but the mechanism behind the GCR impairment remains unclear. In order to understand this mechanism, we have developed a system-level approach combining in vivo and in silico studies to reconstruct the primary network interactions that control the glucagon release and GCR. In the course of our recent studies we have developed a mathematical model of GCR which approximates the normal GCR control axis and its impairment in diabetic rats (Farhy et al., 2008; Farhy and McCall, 2009a,b, 2010, 2011). Using this model we have proposed two key network abnormalities which might contribute to the defects in GCR: (i) absence of a switch-off trigger or in other words, lack of constant intrapancreatic repression of the α-cells which is released (switched-off) during hypoglycemia, and (ii) elevated intraislet basal (AFI) glucagon secretion. Our model-based work predicts and our animal work (Farhy et al., 2008) supports the concept that both network abnormalities can be attacked to repair, or at least partially reverse, the GCR defects. Based on these predictions we have proposed clinical strategies which use α-cell inhibitors to repair the defective GCR and stabilize insulin deficient diabetes (Farhy and McCall, 2011). So far however, human studies addressing these predictions are scarce. There exist some clinical data supporting the concept behind the switch-off hypothesis (Banarer et al., 2002), but no data directly addresses this issue (ii). Therefore, the goal of this work is to start investigating the relevance of our predictions from animal data and modeling to human pathophysiology in T1DM.
The results in this work support the validity of the concept related to the second network abnormality (the GCR effects of basal hyperglucagonemia) and confirm the predictive power of our existing GCR model in the context of human physiology. Our data reflect the glucagon response to hypoglycemia in T1DM subjects under tightly controlled glucose clamp conditions (Figure 1). Several metrics were used to measure the GCR and their choice was directed by the understanding that efficient defense against dangerous low blood sugar drops requires increase of glucagon levels during hypoglycemic episodes above the glucagon basal level (concentration during euglycemia). Therefore, we used measures that estimate GCR relative to the basal concentration (GLbasal): CumG and RIG. We have found that higher BasG levels are associated with reduction of the ability of the system to respond adequately to hypoglycemia with glucagon secretion that markedly exceeds the basal levels (Table 2; Figure 3). In absolute terms, the maximal glucagon response to hypoglycemia (MaxG) is positively linked to the basal level, but MaxG increases slower than GLbasal (Figure 4) which supports the concept that in T1DM the GCR generally cannot significantly exceed the basal levels. Both findings appear consistent and were reproduced by our model. They are in accordance with the proposed second network abnormality and support the recently formulated hypothesis that elevation of BasG is part of the mechanism of GCR impairment in T1DM (Farhy and McCall, 2011). We note that the very high negative correlation between RIG and GLbasal may be partially a reflection of a limited range of the data as detected by a bootstrap procedure according to which this correlation was not significant. However, we would like to emphasize that even though this lack of detected significance does not support the concept that GLbasal and RIG are linked, it suggests that a decrease of BasG levels as proposed elsewhere (Farhy and McCall, 2011), may improve the effectiveness of the GCR even in the face of a limited GCR response.
Model-based analysis was used to explain and replicate the experimental observations. The simulations demonstrate that a model of glucagon secretion in which one part of the α-cells are feedback regulated and another is feedback independent (Figure 2) can successfully replicate many aspects of the in vivo behavior of the system (compare Figures 5 and 6). Except for rescaling of the model output which leaves intact its dynamic properties, no attempts were made to change the original parameters even though they have been determined to approximate the rat GCR axis. This was done in order to test the extent to which the rodent model can explain the human data without changing its basic features or adding new model components. The simulations showed that the model is consistent with the detected negative correlation between CumG and GLbasal (Figure 7, left) and with the observed slower growth of MaxG with respect to GLbasal (Figure 7, right). From a network control point of view this property of the system is due to a repression exerted by the high AFI (basal) glucagon secretion on the auto-feedback dependent (pulsatile) GCR as explained in our prior studies (Farhy and McCall, 2009b, 2010). Thereby, our model is consistent with the data and provides a putative mechanism for the experimentally observed link between defective GCR and basal hyperglucagonemia. Additional simulations predict that with lowering the levels of GLbasal (below the typical glucagon levels in T1DM) the simulated counterregulation response rapidly increases (see Table 3; Figure 7, right), which is consistent with the previously proposed strategy to repair the defective GCR by decreasing the glucagon basal levels (Farhy and McCall, 2011) with α-cell inhibitors.
One limitation of our model is that some of the specifics in the experimental data cannot be explained in the framework of the current construct. In particular, our model cannot account for the fact that in some study participants the glucagon response to hypoglycemia paradoxically went down with respect to their basal levels (which accounts for some of the negative CumG values). Possible explanations for this phenomenon could be an unaccounted excessive variability or pulsatility of glucagon during euglycemia or the already mentioned putative paradoxical stimulation of glucagon by glucose (Olsen et al., 2005; Salehi et al., 2006). However, none of these properties are currently part of the model, which may require further extension and refinement.
Conflict of Interest Statement
The authors declare that the research was conducted in the absence of any commercial or financial relationships that could be construed as a potential conflict of interest.
Acknowledgments
Authors acknowledge support by NIH grants RO1 DK082805, RO1 DK51562, UVa GCRC M01 RR 000847.
Abbreviations
AFI, auto-feedback independent glucagon secretion; AFR, auto-feedback regulated glucagon secretion; BasG, basal glucagon; BG, blood glucose; CumG, cumulated glucagon levels above basal; GCR, glucagon counterregulation; MaxG, maximum glucagon response; RIG, relative increase in glucagon over basal; T1DM, type 1 diabetes mellitus.
References
Banarer, S., McGregor, V. P., and Cryer, P. E. (2002). Intraislet hyperinsulinemia prevents the glucagon response to hypoglycemia despite an intact autonomic response. Diabetes 51, 958–965.
Baron, A. D., Brechtel-Hook, G., Johnson, A., and Hardin, D. (1993). Skeletal muscle blood flow. A possible link between insulin resistance and blood pressure. Hypertension 21, 129–135.
Brunicardi, F. C., Kleinman, R., Moldovan, S., Nguyen, T. H., Watt, P. C., Walsh, J., and Gingerich, R. (2001). Immunoneutralization of somatostatin, insulin, and glucagon causes alterations in islet cell secretion in the isolated per fused human pancreas. Pancreas 23, 302–308.
Cejvan, K., Coy, D. H., and Efendic, S. (2003). Intra-islet somatostatin regulates glucagon release via type 2 somatostatin receptors in rats. Diabetes 52, 1176–1181.
Cryer, P. E. (1999). Hypoglycemia is the limiting factor in the management of diabetes. Diabetes Metab. Res. Rev. 15, 42–46.
Cryer, P. E. (2002). Hypoglycemia the limiting factor in the glycaemic management of type I and type II diabetes. Diabetologia 45, 937–948.
Cryer, P. E., and Gerich, J. E. (1983). Relevance of glucose counterregulatory systems to patients with diabetes: critical roles of glucagon and epinephrine. Diabetes Care 6, 95–99.
DeFronzo, R., Tobin, J., and Andres, R. (1979). Glucose clamp technique: a method for quantifying insulin secretion and resistance. Am. J. Physiol. 237, E214–E223.
Epstein, S., Berelowitz, M., and Bell, N. H. (1980). Pentagastrin and glucagon stimulate serum somatostatin-like immunoreactivity in man. J. Clin. Endocrinol. Metab. 51, 1227–1231.
Farhy, L. S. (2004). Modeling of oscillations in endocrine networks with feedback. Meth. Enzymol. 384, 54–81.
Farhy, L. S., Du, Z., Zeng, Q., Veldhuis, P. P., Johnson, M. L., Brayman, K. L., and McCall, A. L. (2008). Amplification of pulsatile glucagon secretion by switch-off of α-cell suppressing signals in streptozotocin (STZ)-treated rats. Am. J. Physiol. Endocrinol. Metab. 295, E575–E585.
Farhy, L. S., and McCall, A. L. (2009a). System-level control to optimize glucagon counterregulation by switch-off of alpha-cell suppressing signals in beta-cell deficiency. J. Diabetes Sci. Technol. 3, 21–33.
Farhy, L. S., and McCall, A. L. (2009b). Pancreatic network control of glucagon secretion and counterregulation. Methods Enzymol. 467, 547–581.
Farhy, L. S., and McCall, A. L. (2010). Models of glucagon secretion, their application to the analysis of the defects in glucagon counterregulation and potential extension to approximate glucagon action. J. Diabetes Sci. Technol. 4, 1345–1356.
Farhy, L. S., and McCall, A. L. (2011). Optimizing reduction in basal hyperglucagonaemia to repair defective glucagon counterregulation in insulin deficiency. Diabetes Obes. Metab. 13, 133–143.
Fukuda, M., Tanaka, A., Tahara, Y., Ikegami, H., Yamamoto, Y., Kumahara, Y., and Shima, K. (1988). Correlation between minimal secretory capacity of pancreatic beta-cells and stability of diabetic control. Diabetes 37, 81–88.
Gerich, J. E. (1988). Lilly lecture. Glucose counterregulation and its impact on diabetes mellitus. Diabetes 37, 1608–1617.
Gerich, J. E., Langlois, M., Noacco, C., Karam, J. H., and Forsham, P. H. (1973). Lack of glucagon response to hypoglycemia in diabetes: evidence for an intrinsic pancreatic alpha cell defect. Science 182, 171–173.
Hoffman, R. P., Arslanian, S., Drash, A. L., and Becker, D. J. (1994). Impaired counterregulatory hormone responses to hypoglycemia in children and adolescents with new onset IDDM. J. Pediatr. Endocrinol. 7, 235–244.
Huypens, P., Ling, Z., Pipeleers, D., and Schuit, F. (2000). Glucagon receptors on human islet cells contribute to glucose competence of insulin release. Diabetologia 43, 1012–1019.
Kawai, K., and Unger, R. H. (1982). Inhibition of glucagon secretion by exogenous glucagon in the isolated, perfused dog pancreas. Diabetes 31, 512–515.
Klaff, L. J., and Taborsky, G. J. Jr. (1987). Pancreatic somatostatin is a mediator of glucagon inhibition by hyperglycemia. Diabetes 36, 592–596.
Kleinman, R., Gingerich, R., Ohning, G., Wong, H., Olthoff, K., Walsh, J., and Brunicardi, F. C. (1995). The influence of somatostatin on glucagon and pancreatic polypeptide secretion in the isolated perfused human pancreas. Int. J. Pancreatol. 18, 51–57.
Ludvigsen, E., Olsson, R., Stridsberg, M., Janson, E. T., and Sandler, S. (2004). Expression and distribution of somatostatin receptor subtypes in the pancreatic islets of mice and rats. J. Histochem. Cytochem. 52, 391–400.
Olsen, H. L., Theander, S., Bokvist, K., Buschard, K., Wollheim, C. B., and Gromada, J. (2005). Glucose stimulates glucagon release in single rat alpha-cells by mechanisms that mirror the stimulus-secretion coupling in beta-cells. Endocrinology 146, 4861–4870.
Portela-Gomes, G. M., Stridsberg, M., Grimelius, L., Oberg, K., and Janson, E. T. (2000). Expression of the five different somatostatin receptor subtypes in endocrine cells of the pancreas. Appl. Immunohistochem. Mol. Morphol. 8, 126–132.
Salehi, A., Vieira, E., and Gylfe, E. (2006). Paradoxical stimulation of glucagon secretion by high glucose concentrations. Diabetes 55, 2318–2323.
Schuit, F. C., Derde, M. P., and Pipeleers, D. G. (1989). Sensitivity of rat pancreatic A and B cells to somatostatin. Diabetologia 32, 207–212.
Segel, S. A., Paramore, D. S., and Cryer, P. E. (2002). Hypoglycemia-associated autonomic failure in advanced type 2 diabetes. Diabetes 51, 724–733.
Stagner, J. I., Samols, E., and Bonner-Weir, S. (1988). Beta – alpha – delta pancreatic islet cellular perfusion in dogs. Diabetes 37, 1715–1721.
Stagner, J. I., Samols, E., and Marks, V. (1989). The anterograde and retrograde infusion of glucagon antibodies suggests that A cells are vascularly perfused before D cells within the rat islet. Diabetologia 32, 203–206.
Strowski, M. Z., Parmar, R. M., Blake, A. D., and Schaeffer, J. M. (2000). Somatostatin inhibits insulin and glucagon secretion via two receptors subtypes: an in vitro study of pancreatic islets from somatostatin receptor 2 knockout mice. Endocrinology 141, 111–117.
Sumida, Y., Shima, T., Shirayama, K., Misaki, M., and Miyaji, K. (1994). Effects of hexoses and their derivatives on glucagon secretion from isolated perfused rat pancreas. Horm. Metab. Res. 26, 222–225.
The Action to Control Cardiovascular Risk in Diabetes Study Group. (2008). Effects of intensive glucose lowering in type 2 diabetes. N. Engl. J. Med. 358, 2545–2559.
The Diabetes Control and Complications Trial Research Group. (1993). The effect of intensive treatment of diabetes on the development and progression of long-term complications in insulin-dependent diabetes mellitus. N. Engl. J. Med. 329, 977–986.
UK Prospective Diabetes Study Group (UKPDS). (1998). Intensive blood-glucose control with sulphonylureas or insulin compared with conventional treatment and risk of complications in patients with type 2 diabetes. Lancet 352, 837–853.
Utsumi, M., Makimura, H., Ishihara, K., Morita, S., and Baba, S. (1979). Determination of immunoreactive somatostatin in rat plasma and responses to arginine, glucose and glucagon infusion. Diabetologia 17, 319–323.
Keywords: glucagon, counterregulation, diabetes mellitus, hyperglucagonemia, feedback, hypoglycemia, intrapancreatic network, mathematical model
Citation: Farhy LS, Chan A, Breton MD, Anderson SM, Kovatchev BP and McCall AL (2012) Association of basal hyperglucagonemia with impaired glucagon counterregulation in type 1 diabetes. Front. Physio. 3:40. doi: 10.3389/fphys.2012.00040
Received: 16 January 2012;
Accepted: 12 February 2012;
Published online: 28 February 2012.
Edited by:
Michael L. Johnson, University of Virginia, USAReviewed by:
Scott H. Harrison, North Carolina A&T State University, USASudhir Chowbina, SAIC-Frederick, USA
Copyright: © 2012 Farhy, Chan, Breton, Anderson, Kovatchev and McCall. This is an open-access article distributed under the terms of the Creative Commons Attribution Non Commercial License, which permits non-commercial use, distribution, and reproduction in other forums, provided the original authors and source are credited.
*Correspondence: Leon S. Farhy, Division of Endocrinology and Metabolism, Department of Medicine, University of Virginia, Charlottesville, VA 22908, USA. e-mail: leon@virginia.edu
†Leon S. Farhy and Alice Chan have contributed equally to this work.