 Peter M. Kekenes-Huskey1* Yuhui Cheng2 Johan E. Hake3,4 Frank B. Sachse5,6 John H. Bridge5 Michael J. Holst7 J. Andrew McCammon1 Andrew D. McCulloch3 Anushka P. Michailova3*
- 1 Department of Pharmacology, University of California San Diego, La Jolla, CA, USA
- 2 Florida State University, Tallahassee, FL, USA
- 3 Department of Bioengineering, University of California San Diego, La Jolla, CA, USA
- 4 Simula Research Laboratory, Center for Biomedical Computing, Lysaker, Norway
- 5 Cardiovascular Research and Training Institute, University of Utah, Salt Lake City, UT, USA
- 6 Department of Bioengineering, University of Utah, Salt Lake City, UT, USA
- 7 Departments of Mathematics and Physics, University of California San Diego, La Jolla, CA, USA
The transverse tubular system of rabbit ventricular myocytes consists of cell membrane invaginations (t-tubules) that are essential for efficient cardiac excitation-contraction coupling. In this study, we investigate how t-tubule micro-anatomy, L-type Ca2+ channel (LCC) clustering, and allosteric activation of Na+/Ca2+ exchanger by L-type Ca2+ current affects intracellular Ca2+ dynamics. Our model includes a realistic 3D geometry of a single t-tubule and its surrounding half-sarcomeres for rabbit ventricular myocytes. The effects of spatially distributed membrane ion-transporters (LCC, Na+/Ca2+ exchanger, sarcolemmal Ca2+ pump, and sarcolemmal Ca2+ leak), and stationary and mobile Ca2+ buffers (troponin C, ATP, calmodulin, and Fluo-3) are also considered. We used a coupled reaction-diffusion system to describe the spatio-temporal concentration profiles of free and buffered intracellular Ca2+. We obtained parameters from voltage-clamp protocols of L-type Ca2+ current and line-scan recordings of Ca2+ concentration profiles in rabbit cells, in which the sarcoplasmic reticulum is disabled. Our model results agree with experimental measurements of global Ca2+ transient in myocytes loaded with 50 μM Fluo-3. We found that local Ca2+ concentrations within the cytosol and sub-sarcolemma, as well as the local trigger fluxes of Ca2+ crossing the cell membrane, are sensitive to details of t-tubule micro-structure and membrane Ca2+ flux distribution. The model additionally predicts that local Ca2+ trigger fluxes are at least threefold to eightfold higher than the whole-cell Ca2+ trigger flux. We found also that the activation of allosteric Ca2+-binding sites on the Na+/Ca2+ exchanger could provide a mechanism for regulating global and local Ca2+ trigger fluxes in vivo. Our studies indicate that improved structural and functional models could improve our understanding of the contributions of L-type and Na+/Ca2+ exchanger fluxes to intracellular Ca2+ dynamics.
Introduction
In cardiac ventricular myocytes, invaginations of the cell membrane, known as t-tubules, promote rapid propagation of the action potential (AP) in the cell interior (Savio-Galimberti et al., 2008; Orchard et al., 2009; Smyrnias et al., 2010). The AP activates and modulates sarcolemmal Ca2+ fluxes, including fluxes through the L-type Ca2+ channels (LCC), Na+/Ca2+ exchangers (NCX), Ca2+ ATPase pumps, and background sarcolemmal Ca2+ leak (Bers, 2001). The entry of Ca2+ via LCC and NCX triggers the sarcoplasmic reticulum (SR) Ca2+ release via ryanodine receptors (RyRs). The SR provides Ca2+ for the troponin C (TnC) myofilament protein, thereby activating and regulating myocyte contraction (Bridge et al., 1990; Bers, 2001). Controversy, however, surrounds our understanding of whether the openings of LCCs can activate allosteric Ca2+-binding sites on NCX and how the clustering of LCCs, the allosteric catalysis of NCX, and cell surface shape modulate Ca2+ trigger flux controlling SR Ca2+ release (Sipido et al., 1997; Litwin et al., 1998; Egger and Niggli, 1999; Inoue and Bridge, 2003; Bers and Ginsburg, 2007; Cheng et al., 2010).
To investigate relationships between ion fluxes via LCCs and NCXs at voltages corresponding to the early AP plateau, Sobie et al. (2008) recently measured the time-dependent Ca2+ concentration profiles ([Ca2+]i) in isolated rabbit ventricular myocytes. Pharmaceutical disruption of SR activity enabled them to examine the contributions of LCC and NCX to Ca2+ trigger flux, which otherwise would have been masked by SR-bound fluxes from RyRs and the SR Ca2+ ATPase (SERCA). The study suggests that at positive voltages (Vm = +30 mV), the trigger flux of Ca2+ is greater than estimates from a simple summation of the fluxes through LCCs and Ca2+ entry via reverse NCX mode. The authors hypothesized that openings of LCCs increase local ([Ca2+]i) near the NCX protein complex, which activates Ca2+-binding sites on NCX and results in an increase of Ca2+ influx via the exchanger.
Mathematical modeling complements experimental studies by enabling the examination of Ca2+ signaling and excitation-contraction coupling (ECC) in cellular and sub-cellular environments. To this end, whole-cell models have suggested an intimate relationship between Ca2+, Na+, K+ ionic fluxes, and Ca2+ transient in rabbit ventricular myocytes (Shannon et al., 2004; Mahajan et al., 2008; Aslanidi et al., 2010). These models permitted examination of the contribution of various cellular components to the evolution of the Ca2+ transient under normal and certain pathological conditions. Furthermore, recent approaches have included approximate representations of the sub-cellular geometry to introduce spatial control of the predicted local and global Ca2+ transients (Langer and Peskoff, 1996; Michailova et al., 2002; Izu et al., 2006; Koh et al., 2006; Lines et al., 2006; Means et al., 2006; Lu et al., 2009; Soeller et al., 2009; Cheng et al., 2010, 2011, 2012a,b; Louch et al., 2010; Hatano et al., 2011, 2012; Sato and Bers, 2011; Yu et al., 2011; Hake et al., 2012). Lu et al. (2009) introduced a cylindrical representation of a t-tubule of rat ventricular myocytes. Cheng et al. (2010) extended this approach to use recently published t-tubule structures imaged in mice; these t-tubules displayed a large degree of branching unlike the simple cylindrical representation used by Lu et al.
In contrast to mice, the transverse tubular system (t-system) in rabbit ventricular myocytes exhibits a simple topology that more closely resembles the t-system of canine and human ventricular myocytes (Hayashi et al., 2009; Crossman et al., 2011; Sachse et al., 2012). Scanning confocal microscopy has yielded sub-micrometer resolution details of 3D structure of the rabbit t-system (Sachse et al., 2008, 2009) including wider t-tubule cross-sections compared to rodents, and structural variations such as constrictions and flattening (Savio-Galimberti et al., 2008). These large structural differences of the t-system, as well as variations in the density and expression of proteins, suggest that the local and global Ca2+ dynamics during myocyte contraction and relaxation may be species-dependent (Bers, 2001).
In this study we extended the model of Cheng et al. (2010), originally developed for rodent myocytes to incorporate structural data and model parameters specific to rabbit ventricular myocytes. We examined local and global Ca2+ dynamics under the influence of two applied transmembrane voltages (0 and +50 mV). We included equations describing the voltage-dependent background Ca2+ leak and the sarcolemmal Ca2+ ATPase pump (Lu et al., 2009). Furthermore, we evaluated a model of NCX allostery proposed by Weber et al. (2001) against experimental data (Sobie et al., 2008) and tested the hypothesis that the allosteric activation of NCX augments the global trigger flux for SR Ca2+ release in rabbits. Preliminary results of this work have been presented to the Biophysical Society in abstract form (Kekenes-Huskey et al., 2011).
Materials and Methods
A summary of important model properties is presented here. Detailed methods, descriptions, definitions of variables and abbreviations, parameter values, and model equations are provided in the Supplementary Material. The model code is available to download from http://mccammon.ucsd.edu/smol and http://www.fetk.org, respectively.
Geometric Model
The model geometry was derived from the published structural data in rabbit ventricular myocytes (Sachse et al., 2008, 2009; Savio-Galimberti et al., 2008). The model contains one repeating unit inside the cell that includes: realistic surface sarcolemma; realistic t-tubule and its surrounding half-sarcomeres (Figures 1A,B). The surrounding half-sarcomeres were modeled as a rectangular-shaped box of 2.34 μm × 2.58 μm in the plane of external sarcolemma and 5.76 μm in depth.
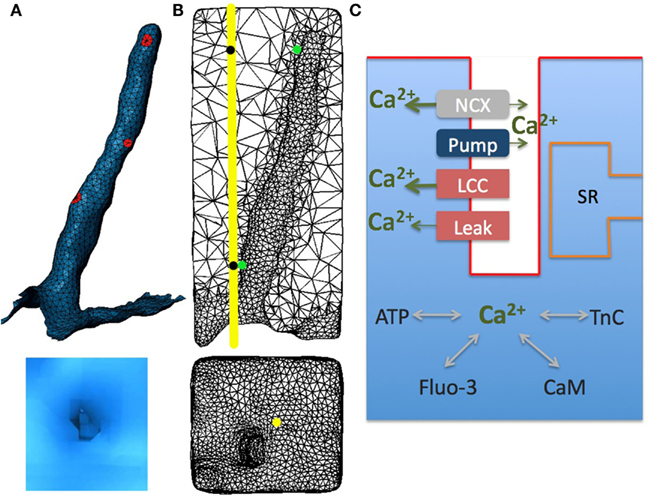
Figure 1. Model geometry and diagram illustrating Ca2+ dynamics in rabbit ventricular myocytes with sarcoplasmic reticulum pharmacologically disabled. (A) The cardiac sarcolemma, including external and t-tubule membranes were visualized using scanning confocal microscopy and labeled in Blender. Localized aggregates of L-type Ca2+ channels (red spots) were placed randomly within t-tubule membrane. (B) T-tubule mesh and its surrounding half-sarcomeres (upper panel); external membrane and t-tubule mouth (lower panel). (C) Schematic drawing of Ca2+ entrance and extrusion via the sarcolemma and Ca2+ buffering and diffusion inside the myocyte: LCC, L-type Ca2+ current; NCX, Na+/Ca2+ exchanger; Pump, membrane Ca2+ ATPase pump; Leak, background sarcolemmal Ca2+ leak; SR, sarcoplasmic reticulum; TnC, troponin C; CaM, calmodulin; ATP, adenosine triphosphate; Fluo-3, fluorescent dye. In all numerical experiments: LCC and NCX current densities were ninefold and threefold higher, respectively, in the t-tubule membrane; Ca2+ leak and pump were uniformly distributed along the sarcolemma; LCC clusters (diameter of (∼200 nm) had the same current density in the outer and t-tubular sarcolemma. The line-scan was positioned at 200 nm away from the t-tubule mouth [yellow line and yellow spot in (B)]. Local Ca2+ transients were extracted at two featured spots along the scanning line (black spots) and along the t-tubule membrane (green spots).
The t-tubule diameter varied from between 0.39 and 0.62 μm and the length was ∼4.6 μm. The constrictions occurred every 1.87 ± 1.09 μm along the principal axis of the t-tubule and cross-sectional area of these constrictions was reduced to an average of 57.7 ± 27.5% (Savio-Galimberti et al., 2008). The volume of the model compartment was estimated to be 0.0282 pL. The compartment membrane area was 15.9 μm2 where the cell membrane within t-tubule was 7.8 μm2 and within the external membrane 8.1 μm2.
Reaction-Diffusion Model
The effects of four exogenous and endogenous Ca2+ buffers (Fluo-3, ATP, calmodulin, and TnC) were considered (Figure 1C). The endogenous stationary buffer TnC was distributed uniformly throughout the cytosol, but not on the sarcolemma or the sub-sarcolemmal space (40–50 nm in depth; Shannon et al., 2004; Cheng et al., 2010). The free Ca2+ and mobile buffers (Fluo-3, ATP, and calmodulin) diffuse and react throughout the cytoplasm. The outer sarcolemma and sarcomere box faces were subject to reflective boundary conditions.
Model Currents
We examined the contributions of four ionic currents; ILCC, INCX, IPump, and ILeak. Formulation of INCX was presented as the product of an electrochemical (ΔE) and an allosteric factor (Allo; Weber et al., 2001). The maximum NCX rate value (Vmax_NCX = 0.207 μM/ms) used here was from Shannon et al. (2004). The NCX allosteric constant (KmCaAct) was fitted to 0.29 vs. 0.256 μM in Shannon et al. (2004). The KmCaAct value was adjusted to approximate the curvature of +50 mV whole-cell Ca2+ transient data from Sobie et al. (2008).
Immunohistochemical studies have demonstrated that most of the LCCs are concentrated in the t-tubules (from 3 to 9 times more than on the external sarcolemma; Scriven et al., 2000; Soeller et al., 2009). In this study, in agreement with the reported data, the LCC current density was assumed to be ninefold higher in the t-tubular membrane than in the outer cell surface. Measurements of Ca2+ sparks in rabbits and other species imply that a cluster of LCCs is likely involved in gating a cluster of RyRs (Lipp and Niggli, 1998; Bridge et al., 1999; Scriven et al., 2000, 2010; Takagishi et al., 2000; Inoue and Bridge, 2003; Altamirano and Bers, 2007; Dan et al., 2007; Poláková et al., 2008; Sobie and Ramay, 2009; Louch et al., 2010). Furthermore, 3D visualizations of fragments from rabbit ventricular myocytes have revealed that the majority of RyR clusters are adjacent to the t-system and that these clusters are irregularly distributed along t-tubules (Dan et al., 2007; Sachse et al., 2009). Thus here three patches (∼200 nm in diameter with the same LCC current density) were placed randomly along the t-tubule (Figure 1A). Data also suggest a smaller number of RyR clusters to co-localize with LCCs on the external membrane (Franzini-Armstrong et al., 1999; Chen-Izu et al., 2006; Dan et al., 2007; Baddeley et al., 2011; Sachse et al., 2012). Dan et al. (2007) measured ∼2 μm longitudinal periodicity of RyR clusters on the cell surface and Sachse et al. (2009, 2012) observed irregular cluster distributions in transverse sheets. As surface RyR cluster positions with respect to t-tubule mouth remain controversial, in our model we assumed that the LCC current density was continuous along the outer membrane. Because in adult rabbits a lesser degree of clustering for NCX has been demonstrated (Lin et al., 2009; Gershome et al., 2011), we also assumed a continuous NCX distribution with a threefold higher density along the t-tubule (Neco et al., 2010). Here Ca2+ pump and leak currents were uniformly distributed along the model surface (Shannon et al., 2004; Lu et al., 2009; Brini and Carafoli, 2011).
In this study, each simulation started with basal cytosolic ([Ca2+]i) of 0.1 μM, and buffers in equilibrium. The extracellular Ca2+ and Na+ concentrations were 2 and 140 mM, respectively, and remained constant. The voltage-clamp protocols (holding potential −50 mV, voltage step to 0 or +50 mV for 200 ms) were derived from data in rabbits (Sobie et al., 2008). Each current density (ILCC, INCX, IPump, and ILeak) was converted to Ca2+ flux (see Eq. A7, Supplementary Material) by using the experimentally suggested surface to volume ratio (Cm/Vcell ∼ 4.54 pF/pL) in adult rabbit ventricular myocytes (Bers, 2001). To ensure the total Ca2+ flux through L-type channels to be the same as measured at given voltage, the model protocols for whole-cell LCC current were fitted vs. data reported in rabbits (Sobie et al., 2008). To justify the model predictions a solution convergence analysis has been performed. Multiple tests, including refining the original mesh or changing the original time-step size for integration (0.5 ms), demonstrated that the used mesh and time step were correctly chosen (see Figure A1 in Appendix).
Results
Global Ca2+ Signals
We validated the model against whole-cell measurements of the L-type Ca2+ current and Ca2+ transient at two voltages (0 and +50 mV) in the presence of 50 μM Fluo-3 and [Na+]i of 10 mM (Sobie et al., 2008). The voltage-clamp protocols and LCC currents are shown in Figures 2A,B. Global NCX time-courses are shown in Figure 2C. Calcium pump and leak fluxes are not shown here due to their small contribution. The model predicts at 0 mV a steep increase in global [Ca2+]i that tapers off at ∼40 ms and converges to 0.19 μM as shown experimentally (Figure 2E). At +50 mV, a more gradual accumulation of Ca2+ is predicted until converging to ∼0.2 vs. 0.19 μM experimentally. These results indicate that our model is a reliable representation of whole-cell Ca2+ dynamics as measured in rabbit ventricular myocytes (Sobie et al., 2008).
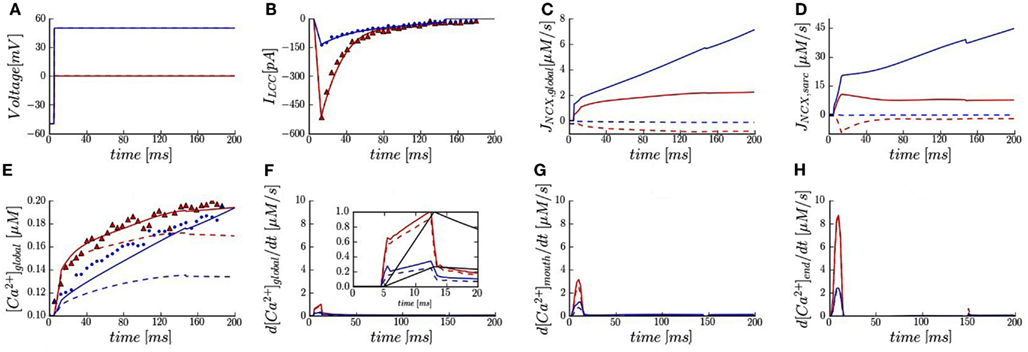
Figure 2. Membrane currents, calcium signals, and trigger fluxes in the presence of 50 μM Fluo-3. (A) Voltage-clamp protocols. (B) Whole-cell LCC current fitted and plotted (solid lines) vs. data reported in rabbits with SR blocked (triangles and dots). (C,D) Predicted global and sub-sarcolemmal Na+/Ca2+ fluxes. (E) Global Ca2+ transients (solid and dash lines) vs. experimentally measured (triangles and dots). (F) Predicted trigger fluxes from global Ca2+ transient. Inset shows normalized whole-cell LCC currents (black lines) and normalized trigger fluxes at 0 and +50 mV. (G,H) Local Ca2+ trigger fluxes at 1.5 and 5.3 μm (green spots in Figure 1B). Membrane voltage at 0 mV (red lines and symbols) and at +50 mV (blue lines and symbols). [Na+]i 10 mM (solid lines) and [Na+]i 0 mM (dash lines).
Global and Sub-Sarcolemmal NCX Fluxes
In agreement with experiment (Sobie et al., 2008), the model predicts that global NCX flux (INCXglobal; computed by averaging local [Ca2+]i levels for the entire compartment) is in reverse mode at both applied voltages with 10 mM [Na+]i (Figure 2C). For [Na+]i of 0 mM, the NCX reverse mode is inactivated and an outward Ca2+ flux is predicted. The contribution to the global Ca2+ transient due to NCX was largest at +50 mV and [Ca2+]i monotonically increases with time.
Figure 2D shows NCX flux calculated by averaging local [Ca2+]i levels in the sub-sarcolemmal space (INCXsarc). In the presence of 10 mM [Na+]i, our results demonstrate that: (1) the overall scale of INCXsarc was ∼5.6-fold greater than INCXglobal; (2) the increase in INCXsarc during ILCC upstroke relative to INCXglobal was much faster; (3) while INCXglobal monotonically increased over the entire simulation, local peaks in INCXsarc are predicted at 15 ms. Moreover, in absence of [Na+]i, the model predicts a sharp reversal in INCXsarc at 0 mV, whereas INCXsarc had a more gradual and monotonically decreasing flux.
Global and Local Ca2+ Trigger Fluxes
The whole-cell trigger flux reported by Sobie et al. (defined as dF/dtmax) quantifies the maximum inward Ca2+ flux. By normalizing dF/dtmax and ILCC to 1.0, it was suggested that the relative contribution of global NCX flux can be estimated (Sobie et al., 2008). Here we first calculated our global trigger flux (d[Ca2+]global/dt, Figure 2F) from the predicted global Ca2+ transient. We then normalized ILCC and d[Ca2+]global/dt based on their maximum values, which both occur at 15 ms for 0 mV. In the presence of 10 mM [Na+]i, our results show that at +50 mV, d[Ca2+]global/dtmax is ∼30% of the value at 0 mV while experimental value is reported as 45%. Furthermore, ILCC constitutes 70% of the trigger flux at +50 mV in comparison to 50% measured (Figure 2F Inset vs. Figure 2 in Sobie et al.). For zero [Na+]i, in agreement with experiment (Figure 2F Inset vs. Figure 3 in Sobie et al.), there is negligible impact on d[Ca2+]global/dtmax at 0 mV (∼10% reduction) and at +50 mV, a ∼30% reduction in d[Ca2+]global/dtmax is predicted relative to a measured 50% decline.
The model also provides estimates of local Ca2+ trigger fluxes within the sub-sarcolemmal space. At 0 mV, the model predicts an approximately threefold increase in d[Ca2+]/dtmax near the t-tubule mouth relative to the global trigger flux (Figures 2F,G). Moreover, the local d[Ca2+]/dtmax at the cell exterior and distal end of t-tubule (adjacent to LCC cluster) were very different: 3 vs. 9 μM/s at 0 mV; 1.3 vs. 2.5 μM/s at +50 mV (Figures 2G,H). At +50 mV a roughly 30% drop in d[Ca2+]mouth/dtmax was predicted in the absence of [Na+]i.
Local Ca2+ Signals
In Sobie’s et al. (2008) experiment in rabbits the sarcolemma were not labeled and the fluorescence signal was recorded along the single scan lane at unknown orientations (Sobie personal communication). Due to these experimental limitations, we assumed the scanned line oriented in transverse cell direction (Figure 1 in Sobie et al., Figure (1B yellow line) to probe contributions of the realistic surface and t-tubule shape to local Ca2+ profiles. The calculated line-scan images and local Ca2+ time-courses are shown in Figures 3A–H. In agreement with experiment with 10 mM [Na+]i non-uniform Ca2+ distributions for both voltages are predicted (Figures 3E,G vs. Figure 1 in Sobie et al.). The contribution of a LCC cluster located ∼2 μm away from upper surface is evident as a spike in the line-scan images. At +50 mV a slight Ca2+ gradient is predicted in transverse cell direction (Figure 3G). In addition, results in Figures 3A,D show that local Ca2+ transients at both locations along the scanning line (1.5 μm red and blue circles; 5.3 μm red and blue triangles) follow the same trends as the global Ca2+ transients.
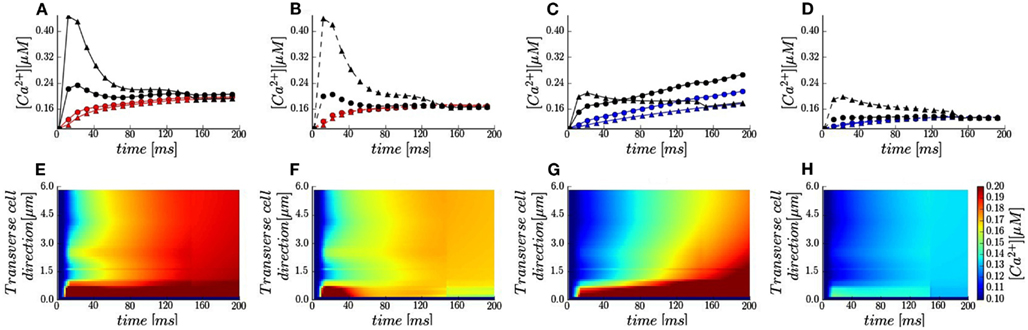
Figure 3. Local calcium signals in the presence of 50 μM Fluo-3. (A–D) Local Ca2+ transients taken at two featured spots along the scanning line (red and blue lines and symbols) and the t-tubule membrane (black lines and symbols): circle −1.5 μm; triangles −5.3 μm. Membrane voltage at 0 mV [red and black lines in (A,B)] and at +50 mV [blue and black lines in (C,D)]. [Na+]i 10 mM (solid lines) and [Na+]i 0 mM (dash lines). (E–H) Calcium concentrations visualized as line-scan images in transverse cell direction for the cases described in (A–D).
The model also predicts that local Ca2+ transients in the proximity of a t-tubule (Figure 1B green spots) differ considerably with respect to local cytosolic Ca2+ transients. Adjacent to the LCC cluster located at the t-tubule distal end (Figure 1A), the local Ca2+ transients closely resembles the ILCC profiles with times to peak ∼15 ms followed by a decay to the cytosolic [Ca2+]i by 200 ms (Figures 3A–D black triangles). Toward the cell surface, the trends depend on the applied voltage (Figures 3A–D black circles). At 0 mV, the [Ca2+]i peak at the cell surface is nearly half of the transient at the LCC cluster and occurs ∼10 ms later. At +50 mV, the sub-membrane [Ca2+]i initially increases faster than the cytosolic analog (for t < 20 ms) and thereafter [Ca2+]i increases at the same rate as local cytosolic. We should mention here, that such local Ca2+ signals are difficult to resolve experimentally due to optical blurring and noise. Thus, our modeling study is one more example that computational models may serve as powerful tools for prediction and analysis on how local Ca2+ dynamics is regulated.
The most compelling evidence of the voltage and [Na+]i-influenced [Ca2+]i transient is shown in Movie S1 in Supplementary Material. Consistent in all movies is the predicted large and steep Ca2+ gradient in the narrow sub-sarcolemmal region. In these movies, the LCC clusters are clearly evident as localized regions of enhanced local [Ca2+]i. Comparison of the 0 vs. +50 mV cases (top and bottom rows) demonstrates that at both voltages [Ca2+]i increases heterogeneously in transverse cell direction as suggested by experiment (Sobie et al., 2008). A spontaneous increase in sub-membrane [Ca2+]i at +50 mV propagating within the cell late in the simulation is predicted also, while initiation and propagation of Ca2+ gradients at both voltages has not been observed during experiment. Additional interesting results in the presence 10 mM [Na+]i are that: (1) Ca2+ gradient traveling from the external membrane to the cell interior is predicted at both voltages when LCCs were continuously distributed along the t-tubule (Movie S2 in Supplementary Material, right column); and (2) lesser inwardly propagating Ca2+ gradient was observed at +50 mV when using the non-allosteric model of NCX (e.g., Allo = 1; Movie S3 in Supplementary Material, lower left panel).
The interaction between adjacent Ca2+ release units (CRU, local functional unit where LCC and RyR clusters reside) has been suggested to be critically dependent on the distance between one unit and its immediate neighbor (Franzini-Armstrong et al., 1999; Scriven et al., 2000; Izu et al., 2006; Dan et al., 2007; Hayashi et al., 2009). To test this, we held fixed the LCC cluster placed ∼2 μm away from upper surface while placing the other two clusters at various inter-cluster spacings. These spacings include ∼0.57, ∼0.8, 1.07, and ∼1.8 μm, whereas 0.78 ± 0.21 μm for the nearest end-to-end CRU distance was measured in rabbits (Dan et al., 2007; Savio-Galimberti et al., 2008). We found that predicted spatial [Ca2+]i distributions are highly sensitive to the spacing between LCC clusters (Movie S4 in Supplementary Material).
Finally, to gain further insights on the role of NCX flux in regulating local Ca2+ dynamics, we tested how the changes in NCX allosteric constant (KmCaAct) and maximum exchanger rate (Vmax_NCX) affect the results. Our data indicate that local Ca2+ profiles are highly sensitive to KmCaAct and Vmax_NCX alterations (Movie S5 in Supplementary Material vs. Movie S1 in Supplementary Material left lower panel).
Discussion
Model Geometry and L-Type Ca2+ Channels Clustering
Numerical studies of Ca2+ signaling in rodent cardiomyocytes that consider non-trivial geometries have shown that the spatial Ca2+ dynamics depends on myocyte micro-structure, including the branching of t-tubules (Lu et al., 2009; Soeller et al., 2009; Cheng et al., 2010; Hake et al., 2012; Hatano et al., 2012). Therefore, we hypothesized that details specific to rabbits, e.g., the linear t-tubule structure with varying diameter and eccentricity, provide unique control of the Ca2+ transient (Sachse et al., 2008; Savio-Galimberti et al., 2008). Our studies indicate that these factors may contribute to a spatially non-uniform [Ca2+]i distribution (Sobie et al., 2008; Bridge and Sachse, personal communication) while in rats, the measured [Ca2+]i profiles were more evenly distributed with SR activity disabled (Cheng et al., 1994).
In this study, we also assumed a clustered distribution for LCCs along the t-tubule based on a random distribution. The model predicts that clustering of LCCs resulted in more uniform [Ca2+]i profiles along the transverse cell direction relative to a continuous LCCs distribution. This greatly reduced the amplitude of the outer sarcolemmal compared to the continuous LCCs distribution (Movie S2 in Supplementary Material). New findings are also that local Ca2+ levels are highly sensitive to LCC cluster positions along the t-tubule (Movie S4 in Supplementary Material). In the model LCCs were also uniformly distributed on the cell surface, yet RyR distribution data suggest a small number of LCC clusters may also co-localize on the external membrane (Chen-Izu et al., 2006; Dan et al., 2007; Sachse et al., 2009, 2012). Thus, we placed two LCC clusters within the surface membrane near the t-tubule mouth but found that the LCC cluster placement intensified the under-membrane [Ca2+]i non-uniformity (data not shown). We speculate here that the localization of two LCC clusters along the cell surface within the half-sarcomere micro-domain probably overestimates the outer sarcolemma contribution (two outer LCC clusters vs. three t-tubule LCC clusters). In addition, our assumption of identical current profiles for each LCC cluster may be inappropriate, since the cluster shape and size, and the number of L-type channels involved in single spark triggering will certainly modulate the local current and local [Ca2+]i profiles (Franzini-Armstrong et al., 1999; Chen-Izu et al., 2006; Hayashi et al., 2009; Louch et al., 2010; Scriven et al., 2010). Although our concept of LCC clustering is quite rudimentary, this is a first attempt to examine the effects of LCC clusters, incorporated in more realistic membrane shapes, on local Ca2+ dynamics in light of evidence that LCC clusters exist in junctional clefts and form part of the couplon. A more appropriate description may require modeling LCC patches comprised of LCC “sub-clusters,” given their suggested involvement in the triggering of RyRs in the dyadic junction (Louch et al., 2010). Labeling techniques capable of resolving the localized positions of LCC clusters would permit a more detailed analysis of LCC and NCX contributions to Ca2+ trigger flux (Jayasinghe et al., 2009).
Allosteric Catalysis of Na+-Ca2+ Exchanger and Ca2+ Trigger Fluxes
A unique feature of the presented model was its ability to directly examine the role of catalytic Ca2+-binding sites on NCX in regulating local and global Ca2+ trigger fluxes. Here our studies indicate that upon depolarization, the non-allosteric NCX rapidly entered reverse mode and contributed a substantial constant inward flux during the entire simulation with 10 mM [Na2+]i [INCXglobal(0mV) ∼ 3 μM/s, INCXglobal(+50mV) ∼ 8 μM/s, INCXsarc(0mV) ∼ 9 μM/s, INCXsarc(+50mV) ∼ 22 μM/s]. At 0 mV, when the LCC flux was dominant, a modest decrease in d[Ca2+]mouth/dtmax (2.5 vs. 3 μM/s) was predicted. At +50 mV, when NCX contributes a significantly larger fraction of the total Ca2+ transient, the effects of NCX allostery were more evident. Assumption of a non-allosteric NCX model resulted in a approximately twofold drop in d[Ca2+]mouth/dtmax and lesser inwardly propagating Ca2+ gradient at +50 mV (Movie S3 in Supplementary Material lower left panel vs. Movie S1 in Supplementary Material lower left panel). These data reveal that the allosteric catalysis of NCX can augment the local trigger fluxes as well (Litwin et al., 1996; Ramirez et al., 2011). No visible changes, however, were detected in d[Ca2+]end/dtmax and d[Ca2+]global/dtmax at both applied voltages (data not shown). A possible reason for the negligible predicted effects of NCX allostery on d[Ca2+]end/dtmax and d[Ca2+]global/dtmax, which is at odds with experimental estimates of the global trigger fluxes (Figure 2F), might be the assumed continuous NCX distribution along the cell membrane. We speculate that the NCX allosteric effect would be much more pronounced, if reverse-mode Ca2+ entry were localized to a smaller region typical of a cluster, which could then activate Ca2+ binding to NCX to a greater degree (Jayasinghe et al., 2009). Moreover, the relative spacing between an NCX cluster and LCC and alterations in normal NCX maximum rate and allosteric constant (Movie S5 in Supplementary Material) could modulate the amplitude of the NCX reverse mode.
Limitations of the Model
Although we demonstrate good correlation with whole-cell experimental data using a relatively small sub-cellular geometric domain, this assumption implies that all domains are identical in shape and flux distribution. T-tubule data in rabbits from Savio-Galimberti et al. (2008), however, suggest considerable variety both in terms of the diameter, shape, and arrangement of tubules, as well as the shape of the cell exterior. Including such details could permit investigation into coupling between adjacent tubules in rabbits.
Furthermore, we restrict our model to Ca2+ and Ca2+-buffer dynamics, whereas additional ions, namely Na+ and K+, play a significant role in modulating ECC coupling (Despa et al., 2003; Bers and Despa, 2009; Torres et al., 2010). In particular, our results suggest that changes in [Na+]i modulate NCX activity independent from any Ca2+-dependent allosteric effects (Movie S3 in Supplementary Material). By explicitly including the primary fluxes for Na+ and K+ (INa, INaK), intracellular Na+ diffusion and buffering, and distributions of Na+ channels and Na+/K+ pumps along the sarcolemma we may further examine the role of NCX allostery due to LCC opening, especially early in the AP. We further anticipate that the allosteric interaction between NCX and LCCs will be more nuanced during an AP, given that the fast Na+ promotes activation of the exchanger before many LCCs have opened (Torres et al., 2010). In this study also, the mitochondrial Ca2+ fluxes were omitted (Dash et al., 2009; Pradhan et al., 2010). These are likely to have important impact on predicted Ca2+ profiles as well (Nguyen et al., 2007; Cortassa and Aon, 2012; Dedkova and Blatter, 2012).
Conclusion
We developed and validated a 3D reaction-diffusion model of Ca2+ signaling in rabbit ventricular myocytes. The model incorporates realistic t-tubule and cell surface topologies, as well as clusters of LCCs along the t-tubule membrane. The key findings are: (1) the linear t-tubule topology and the punctuate spatial distribution of LCC along the sarcolemma function to inhibit inwardly propagating Ca2+ gradients; (2) local trigger fluxes of Ca2+ are at least threefold to eightfold higher than whole-cell Ca2+ trigger flux; and (3) the activation of allosteric Ca2+-binding sites on Na+/Ca2+ exchanger could provide a mechanism that regulates local and global Ca2+ trigger fluxes in vivo. We concluded that improved models representing the localized positions and the functional diversity of LCC clusters could help to improve our understanding of ILCC and INCX contributions to global and local Ca2+ trigger fluxes.
Conflict of Interest Statement
The authors declare that the research was conducted in the absence of any commercial or financial relationships that could be construed as a potential conflict of interest.
Acknowledgments
The authors thank Eric Sobie, Ryan Szypowski, and Zeyun Yu for helpful suggestions and discussion on the experimental and numerical tools. This work is supported by the National Biomedical Computational Resource (NIH grant 8P41 GM103426-19), an NHLBI Systems Biology Collaboration 1R01HL105242-01 (McCulloch). Dr. McCammon acknowledges additional support from NIH, NSF, Howard Hughes Medical Institute (HHMI), and the Center for Theoretical Biological Physics (CTBP). We acknowledge also funding by NIH HLBI R01 HL094464, the Richard A. and Nora Eccles Fund for Cardiovascular Research, and the Nora Eccles Treadwell Foundation. The work was also partly supported by Center of Excellence grant from the Research Council of Norway to the Center for Biomedical Computing at Simula Research Laboratory.
Supplementary Material
The Supplementary Material for this article can be found online at http://www.frontiersin.org/Computational_Physiology_and_Medicine/10.3389/fphys.2012.00351/abstract
Movie S1. Effects of voltage and intracellular Na+ on spatial Ca2+ dynamics in the presence of allosteric catalysis and 50 μM Fluo-3.
Movie S2. Effects of continuous LCC current distribution along the t-tubule on spatial Ca2+ dynamics in the presence of allosteric catalysis, 50 μM Fluo-3 and 10 mM [Na+]i.
Movie S3. Effects of voltage and intracellular Na+ on spatial Ca2+ dynamics in the absence of allosteric catalysis and presence of 50 μM Fluo-3.
Movie S4 Effects of LCC cluster placement along t-tubule on spatial Ca2+ dynamics at 0 mV in the presence of allosteric catalysis, 50 μM Fluo-3 and 10 mM [Na+]i.
Movie S5. Effects of changes in NCX allosteric constant and maximum NCX rate on spatial Ca2+ dynamics at +50 mV in the presence of allosteric catalysis, 50 μM Fluo-3 and 10 mM [Na+]i.
References
Altamirano, J., and Bers, D. M. (2007). Voltage dependence of cardiac excitation-contraction coupling: unitary Ca2+ current amplitude and open channel probability. Circ. Res. 101, 590–597.
Aslanidi, O. V., Sleiman, R. N., Boyett, M. R., Hancox, J. C., and Zhang, H. (2010). Ionic mechanisms for electrical heterogeneity between rabbit Purkinje fiber and ventricular cells. Biophys. J. 98, 2420–2431.
Baddeley, D., Crossman, D., Rossberger, S., Cheyne, J. E., Montgomery, J. M., Jayasinghe, I. D., Cremer, C., Cannell, M. B., and Soeller, C. (2011). 4D super-resolution microscopy with conventional fluorophores and single wavelength excitation in optically thick cells and tissues. PLoS ONE 6, e20645. doi:10.1371/journal.pone.0020645
Bers, D. (2001). Excitation-Contraction Coupling and Cardiac Contractile Force. Dordrecht: Kluwer Academic Publishers.
Bers, D., and Ginsburg, K. (2007). Na:Ca stoichiometry and cytosolic Ca dependent activation of NCX in intact cardiomyocytes. Ann. N. Y. Acad. Sci. 1099, 326–338.
Bers, D. M., and Despa, S. (2009). Na+ transport in cardiac myocytes: implications for excitation-contraction coupling. IUBMB Life 61, 215–221.
Bridge, J. H., Ershler, P. R., and Cannell, M. B. (1999). Properties of Ca2+ sparks evoked by action potentials in mouse ventricular myocytes. J. Physiol. (Lond.) 518, 469–478.
Bridge, J. H., Smolley, J. R., and Spitzer, K. W. (1990). The relationship between charge movements associated with ICa and INa-Ca in cardiac myocytes. Science 248, 376–378.
Brini, M., and Carafoli, E. (2011). The plasma membrane Ca2+ ATPase and the plasma membrane sodium calcium exchanger cooperate in the regulation of cell calcium. Cold Spring Harb. Perspect. Biol. 3, a004168.
Cheng, H., Cannell, M. B., and Lederer, W. J. (1994). Propagation of excitation-contraction coupling into ventricular myocytes. Pflugers Arch. 428, 415–417.
Cheng, Y., Holst, M., McCammon, A., and Michailova, A. (2011). Distribution and clustering of membrane Ca2+ transporters regulate Ca2+ signals in rat ventricular myocytes. Biophys. J. 100, 293a–293a. [Annual Meeting Abstracts].
Cheng, Y., Kekenes-Huskey, P., Hake, J., Holst, M. J., McCammon, J. A., and Michailova, A. P. (2012a). Multi-scale continuum modeling of biological processes: from molecular electro-diffusion to sub-cellular signaling transduction. Comput. Sci. Discov. 5, 015002.
Cheng, Y., Kekenes-Huskey, P., Holst, M., McCammon, J. A., and Michailova, A. (2012b). How spatiotemporal clustering of L-type Ca2+ channels regulates Ca2+ signals in rat ventricular myocytes? Biophys. J. 102, 551a. [Annual Meeting Abstracts].
Cheng, Y., Yu, Z., Hoshijima, M., Holst, M. J., McCulloch, A. D., McCammon, J. A., and Michailova, A. P. (2010). Numerical analysis of Ca2+ signaling in rat ventricular myocytes with realistic transverse-axial tubular geometry and inhibited sarcoplasmic reticulum. PLoS Comp. Biol. 6, e1000972. doi:10.1371/journal.pcbi. 1000972
Chen-Izu, Y., McCulle, S. L., Ward, C. W., Soeller, C., Allen, B. M., Rabang, C., Cannell, M. B., Balke, C. W., and Izu, L. T. (2006). Three-dimensional distribution of ryanodine receptor clusters in cardiac myocytes. Biophys. J. 91, 1–13.
Cortassa, S., and Aon, M. A. (2012). Computational modeling of mitochondrial function. Methods Mol. Biol. 810, 311–326.
Crossman, D. J., Ruygrok, P. N., Soeller, C., and Cannell, M. B. (2011). Changes in the organization of excitation-contraction coupling structures in failing human heart. PLoS ONE 6, e17901. doi:10.1371/journal.pone.0017901
Dan, P., Lin, E., Huang, J., Biln, P., and Tibbits, G. F. (2007). Three-dimensional distribution of cardiac Na+-Ca2+ exchanger and ryanodine receptor during development. Biophys. J. 93, 2504–2518.
Dash, R. K., Qi, F., and Beard, D. A. (2009). A biophysically based mathematical model for the kinetics of mitochondrial calcium uniporter. Biophys. J. 96, 1318–1332.
Dedkova, E. N., and Blatter, L. A. (2012). Measuring mitochondrial function in intact cardiac myocytes. J. Mol. Cell. Cardiol. 52, 48–61.
Despa, S., Brette, F., Orchard, C. H., and Bers, D. M. (2003). Na/Ca exchange and Na/K-ATPase function are equally concentrated in transverse tubules of rat ventricular myocytes. Biophys. J. 85, 3388–3396.
Egger, M., and Niggli, E. (1999). Regulatory function of Na-Ca exchange in the heart: milestones and outlook. J. Membr. Biol. 168, 107–130.
Franzini-Armstrong, C., Protasi, F., and Ramesh, V. (1999). Shape, size and distribution of Ca release units and couplons in skeletal and cardiac muscles. Biophys. J. 77, 1528–1539.
Gershome, C., Lin, E., Kashihara, H., Hove-Madsen, L., and Tibbits, G. F. (2011). Colocalization of voltage-gated Na+ channels with the Na+/Ca2+ exchanger in rabbit cardiomyocytes during development. Am. J. Physiol. Heart Circ. Physiol. 300, H300–H311.
Hake, J. E., Edwards, A. G., Yu, Z., Kekenes-Huskey, P., Michailova, A. P., McCammon, A., Holst, M. J., Hoshijima, M., and McCulloch, A. D. (2012). Modeling cardiac calcium sparks in a three-dimensional reconstruction of a calcium release unit. J. Physiol. (Lond.) doi: 10.1113/jphysiol.2012.227926. [Epub ahead of print].
Hatano, A., Okada, J., Hisada, T., and Sugiura, S. (2012). Critical role of cardiac t-tubule system for the maintenance of contractile function revealed by a 3D integrated model of cardiomyocytes. J. Biomech. 45, 815–823.
Hatano, A., Okada, J., Washio, T., Hisada, T., and Sugiura, S. (2011). A three-dimensional simulation model of cardiomyocyte integrating excitation-contraction coupling and metabolism. Biophys. J. 101, 2601–2610.
Hayashi, T., Martone, M. E., Yu, Z., Thor, A., Doi, M., Holst, M. J., Ellisman, M. H., and Hoshijima, M. (2009). Three-dimensional electron microscopy reveals new details of membrane systems for Ca2+ signaling in the heart. J. Cell Sci. 122, 1005–1013.
Inoue, M., and Bridge, J. H. B. (2003). Ca2+ sparks in rabbit ventricular myocytes evoked by action potentials: involvement of clusters of L-type Ca2+ channels. Circ. Res. 92, 532–538.
Izu, L. T., Means, S. A., Shadid, J. N., Chen-Izu, Y., and Balke, C. W. (2006). Interplay of ryanodine receptor distribution and calcium dynamics. Biophys. J. 91, 95–112.
Jayasinghe, I. D., Cannell, M. B., and Soeller, C. (2009). Organization of ryanodine receptors, transverse tubules, and sodium-calcium exchanger in rat myocytes. Biophys. J. 97, 2664–2673.
Kekenes-Huskey, P. M., Cheng, Y., Hake, J., Sachse, F., Bridge, J., McCammon, J. A., and Michailova, A. (2011). Contributions of structural t-tubule heterogeneities and membrane Ca2+ flux localization to local Ca2+ signaling in rabbit ventricular myocytes. Biophys. J. 100, 557a–557a. [Annual Meeting Abstracts].
Koh, X., Srinivasan, B., Ching, H. S., and Levchenko, A. (2006). A 3D Monte Carlo analysis of the role of dyadic space geometry in spark generation. Biophys. J. 90, 1999–2014.
Langer, G. A., and Peskoff, A. (1996). Calcium concentration and movement in the dyadic cleft space of the cardiac ventricular cell. Biophys. J. 70, 1169–1182.
Lin, E., Hung, V. H., Kashihara, H., Dan, P., and Tibbits, G. F. (2009). Distribution patterns of the Na+-Ca2+ exchanger and caveolin-3 in developing rabbit cardiomyocytes. Cell Calcium 45, 369–383.
Lines, G. T., Sande, J. B., Louch, W. E., Mørk, H. K., Grøttum, P., and Sejersted, O. M. (2006). Contribution of the Na+/Ca2+ exchanger to rapid Ca2+ release in cardiomyocytes. Biophys. J. 91, 779–792.
Lipp, P., and Niggli, E. (1998). Fundamental calcium release events revealed by two-photon excitation photolysis of caged calcium in guinea-pig cardiac myocytes. J. Physiol. (Lond.) 508, 801–809.
Litwin, S., Kohmoto, O., Levi, A. J., Spitzer, K. W., and Bridge, J. H. (1996). Evidence that reverse Na-Ca exchange can trigger SR calcium release. Ann. N. Y. Acad. Sci. 779, 451–463.
Litwin, S. E., Li, J., and Bridge, J. H. (1998). Na-Ca exchange and the trigger for sarcoplasmic reticulum Ca release: studies in adult rabbit ventricular myocytes. Biophys. J. 75, 359–371.
Louch, W. E., Hake, J., Jølle, G. F., Mørk, H. K., Sjaastad, I., Lines, G. T., and Sejersted, O. M. (2010). Control of Ca2+ release by action potential configuration in normal and failing murine cardiomyocytes. Biophys. J. 99, 1377–1386.
Lu, S., Michailova, A. P., Saucerman, J. J., Cheng, Y., Yu, Z., Kaiser, T. H., Li, W. W., Bank, R. E., Holst, M. J., McCammon, J. A., Hayashi, T., Hoshijima, M., Arzberger, P., and McCulloch, A. D. (2009). Multiscale modeling in rodent ventricular myocytes: contributions of structural and functional heterogeneities to excitation-contraction coupling. IEEE Eng. Med. Biol. Mag. 28, 46–57.
Mahajan, A., Shiferaw, Y., Sato, D., Baher, A., Olcese, R., Xie, L. H., Yang, M. J., Chen, P. S., Restrepo, J. G., Karma, A., Garfinkel, A., Qu, Z., and Weiss, J. N. (2008). A rabbit ventricular action potential model replicating cardiac dynamics at rapid heart rates. Biophys. J. 94, 392–410.
Means, S., Smith, A. J., Shepherd, J., Shadid, J., Fowler, J., Wojcikiewicz, R. J. H., Mazel, T., Smith, G. D., and Wilson, B. S. (2006). Reaction diffusion modeling of calcium dynamics with realistic ER geometry. Biophys. J. 91, 537–557.
Michailova, A., DelPrincipe, F., Egger, M., and Niggli, E. (2002). Spatiotemporal features of Ca2+ buffering and diffusion in atrial cardiac myocytes with inhibited sarcoplasmic reticulum. Biophys. J. 83, 3134–3151.
Neco, P., Rose, B., Huynh, N., Zhang, R., Bridge, J. H., Philipson, K. D., and Goldhaber, J. I. (2010). Sodium-calcium exchange is essential for effective triggering of calcium release in mouse heart. Biophys. J. 99, 755–764.
Nguyen, M. H., Dudycha, S. J., and Jafri, M. S. (2007). Effect of Ca2+ on cardiac mitochondrial energy production is modulated by Na+ and H+ dynamics. Am. J. Physiol. Cell Physiol. 292, C2004–C2020.
Orchard, C. H., Pásek, M., and Brette, F. (2009). The role of mammalian cardiac t-tubules in excitation-contraction coupling: experimental and computational approaches. Exp. Physiol. 94, 509–519.
Poláková, E., Zahradníková, A. Jr., Pavelková, J., Zahradník, I., and Zahradníková, A. (2008). Local calcium release activation by DHPR calcium channel openings in rat cardiac myocytes. J. Physiol. (Lond.) 586, 3839–3854.
Pradhan, R. K., Beard, D. A., and Dash, R. K. (2010). A biophysically based mathematical model for the kinetics of mitochondrial Na+-Ca2+ antiporter. Biophys. J. 98, 218–230.
Ramirez, R. J., Sah, R., Liu, J., Rose, R. A., and Backx, P. H. (2011). Intracellular [Na(+)] modulates synergy between Na+/Ca2+ exchanger and L-type Ca2+ current in cardiac excitation-contraction coupling during action potentials. Basic Res. Cardiol. 106, 967–977.
Sachse, F., Savio-Galimberti, E., Goldhaber, J., and Bridge, J. (2008). “Sub-micrometer anatomical models of the sarcolemma of cardiac myocytes based on confocal imaging,” in Pacific Symposium on Biocomputing, Kohala Coast, Hawaii, 390–401.
Sachse, F., Savio-Galimberti, E., Goldhaber, J., and Bridge, J. (2009). “Towards computational modeling of excitation-contraction coupling in cardiac myocytes: reconstruction of structures and proteins from confocal imaging,” in Pacific Symposium on Biocomputing, Kohala Coast, Hawaii, 328–339.
Sachse, F. B., Torres, N. S., Savio-Galimberti, E., Aiba, T., Kass, D. A., Tomaselli, G. F., and Bridge, J. H. (2012). Subcellular structures and function of myocytes impaired during heart failure are restored by cardiac resynchronization therapy. Circ. Res. 110, 588–597.
Sato, D., and Bers, D. M. (2011). How does stochastic ryanodine receptor-mediated Ca leak fail to initiate a Ca spark? Biophys. J. 101, 2370–2379.
Savio-Galimberti, E., Frank, J., Inoue, M., Goldhaber, J. I., Cannell, M. B., Bridge, J. H. B., and Sachse, F. B. (2008). Novel features of the rabbit transverse tubular system revealed by quantitative analysis of three-dimensional reconstructions from confocal images. Biophys. J. 95, 2053–2062.
Scriven, D. R., Asghari, P., Schulson, M. N., and Moore, E. D. (2010). Analysis of Cav1.2 and ryanodine receptor clusters in rat ventricular myocytes. Biophys. J. 99, 3923–3929.
Scriven, D. R., Dan, P., and Moore, E. W. (2000). Distribution of proteins implicated in excitation-contraction coupling in rat ventricular myocytes. Biophys. J. 79, 2682–2691.
Shannon, T., Wang, F., Puglisi, J., Weber, C., and Bers, D. (2004). A mathematical treatment of integrated Ca dynamics within the ventricular myocyte. Biophys. J. 87, 3351–3371.
Sipido, K. R., Maes, M., and Van de Werf, F. (1997). Low efficiency of Ca2+ entry through the Na+-Ca2+ exchanger as trigger for Ca2+ release from the sarcoplasmic reticulum. A comparison between L-type Ca2+ current and reverse-mode Na+-Ca2+ exchange. Circ. Res. 81, 1034–1044.
Smyrnias, I., Mair, W., Harzheim, D., Walker, S. A., Roderick, H. L., and Bootman, M. D. (2010). Comparison of the t-tubule system in adult rat ventricular and atrial myocytes, and its role in excitation-contraction coupling and inotropic stimulation. Cell Calcium 47, 210–223.
Sobie, E. A., Cannell, M. B., and Bridge, J. H. B. (2008). Allosteric activation of Na+-Ca2+ exchange by L-Type Ca2+ current augments the trigger flux for SR Ca2+ release in ventricular myocytes. Biophys. J. 94, L54–L56.
Sobie, E. A., and Ramay, H. R. (2009). Excitation-contraction coupling gain in ventricular myocytes: insights from a parsimonious model. J. Physiol. (Lond.) 587(Pt 6), 1293–1299.
Soeller, C., Jayasinghe, I. D., Li, P., Holden, A. V., and Cannell, M. B. (2009). Three-dimensional high-resolution imaging of cardiac proteins to construct models of intracellular Ca2+ signalling in rat ventricular myocytes. Exp. Physiol. 94, 496–508.
Takagishi, Y., Yasui, K., Severs, N. J., and Murata, Y. (2000). Species-specific difference in distribution of voltage-gated L-type Ca2+ channels of cardiac myocytes. Am. J. Physiol. Cell Physiol. 279, C1963–C1969.
Torres, N. S., Larbig, R., Rock, A., Goldhaber, J. I., and Bridge, J. H. B. (2010). Na+ currents are required for efficient excitation-contraction coupling in rabbit ventricular myocytes: a possible contribution of neuronal Na+ channels. J. Physiol. (Lond.) 588, 4249–4260.
Weber, C., Ginsburg, K., Philipson, K., Shannon, T., and Bers, D. (2001). Allosteric regulation of Na/Ca exchange current by cytosolic Ca in intact cardiac myocytes. J. Gen. Physiol. 117, 119–131.
Yu, Z., Yao, G., Hoshijima, M., Michailova, A., and Holst, M. (2011). Multi-scale modeling of calcium dynamics in ventricular myocytes with realistic transverse tubules. IEEE Trans. Biomed. Eng. 58, 2947–2951.
Appendix
Experimental and Simulation Protocols
Confocal Imaging, Post-Processing, and Geometric Modeling
Myocytes were superfused with membrane-impermeant dextran conjugated to fluorescein and imaged with a BioRad MRC-1024 laser-scanning confocal microscope (Savio-Galimberti et al., 2008). Image data were devonvolved, corrected for background signals, and depth dependent attenuation. Single or groups of t-tubules were segmented using region-growing and stored together with an associated segment of outer sarcolemma. A modified Marching cube algorithm was used to create an initial triangulation from the segmented data (Heiden et al., 1993). A GAMer plugin to Blender was used to assign markers for the cell surface, t-tubule, and interior boundaries (Yu et al., 2008a). TetGen was then used to convert the surface mesh into a tetra-hedralized mesh suitable for finite-element solution (http://wias-berlin.de/software/tetgen/). The created geometric model contained realistic surface sarcolemma, realistic t-tubule, and its surrounding half-sarcomeres.
Currents and Calcium Concentration Simulation Protocols
The voltage-clamp protocols (holding potential −50 mV, voltage step to 0 or +50 mV for 200 ms) and whole-cell LCC currents were derived from data in rabbit ventricular myocytes with RyR Ca2+ release and SERCA Ca2+ uptake disabled pharmacologically (Sobie et al., 2008).
Model simulation protocols for [Ca2+]i resemble the protocols applied previously in experimental studies where the cells, incubated with ryanodine and thapsigargin, were loaded with 50 μM Fluo-3, and confocal line-scan recordings of fluorescence ratio (F/Fo) reflecting the changes of Ca2+ concentration in time were made concurrently (Sobie et al., 2008). This allowed simultaneous measurements of whole-cell LCC current and the total transmembrane flux of Ca2+ under conditions promoting Ca2+ entry via NCX; positive potentials and [Na+]i of 10 mM Sobie’s et al. data indicate: (1) that at Vm ≥ 20 mV, dF/dtmax was larger with 10 mM [Na+]i than that measured with 0 mM [Na+]i (zero Na+ prohibits Ca2+ entry through NCX), suggesting that reverse-mode NCX augments Ca2+ trigger flux at positive voltages; and (2) that under control conditions (10 mM [Na+]i and Vm ≥ +30 mV) dF/dtmax is much greater than a simple sum of fluxes due to LCC current and reverse-mode NCX, suggesting possible activation of an allosteric NCX Ca2+-binding site.
Model Parameters
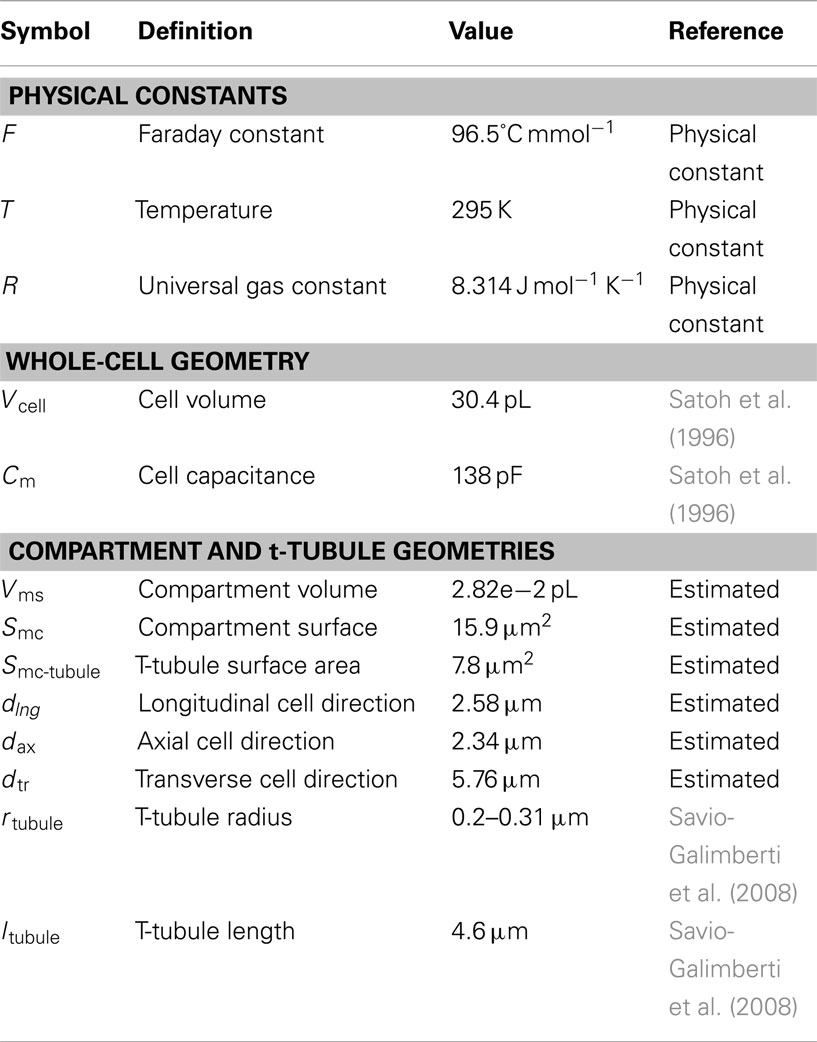
Table A1. Physical constants and cell geometry parameters.
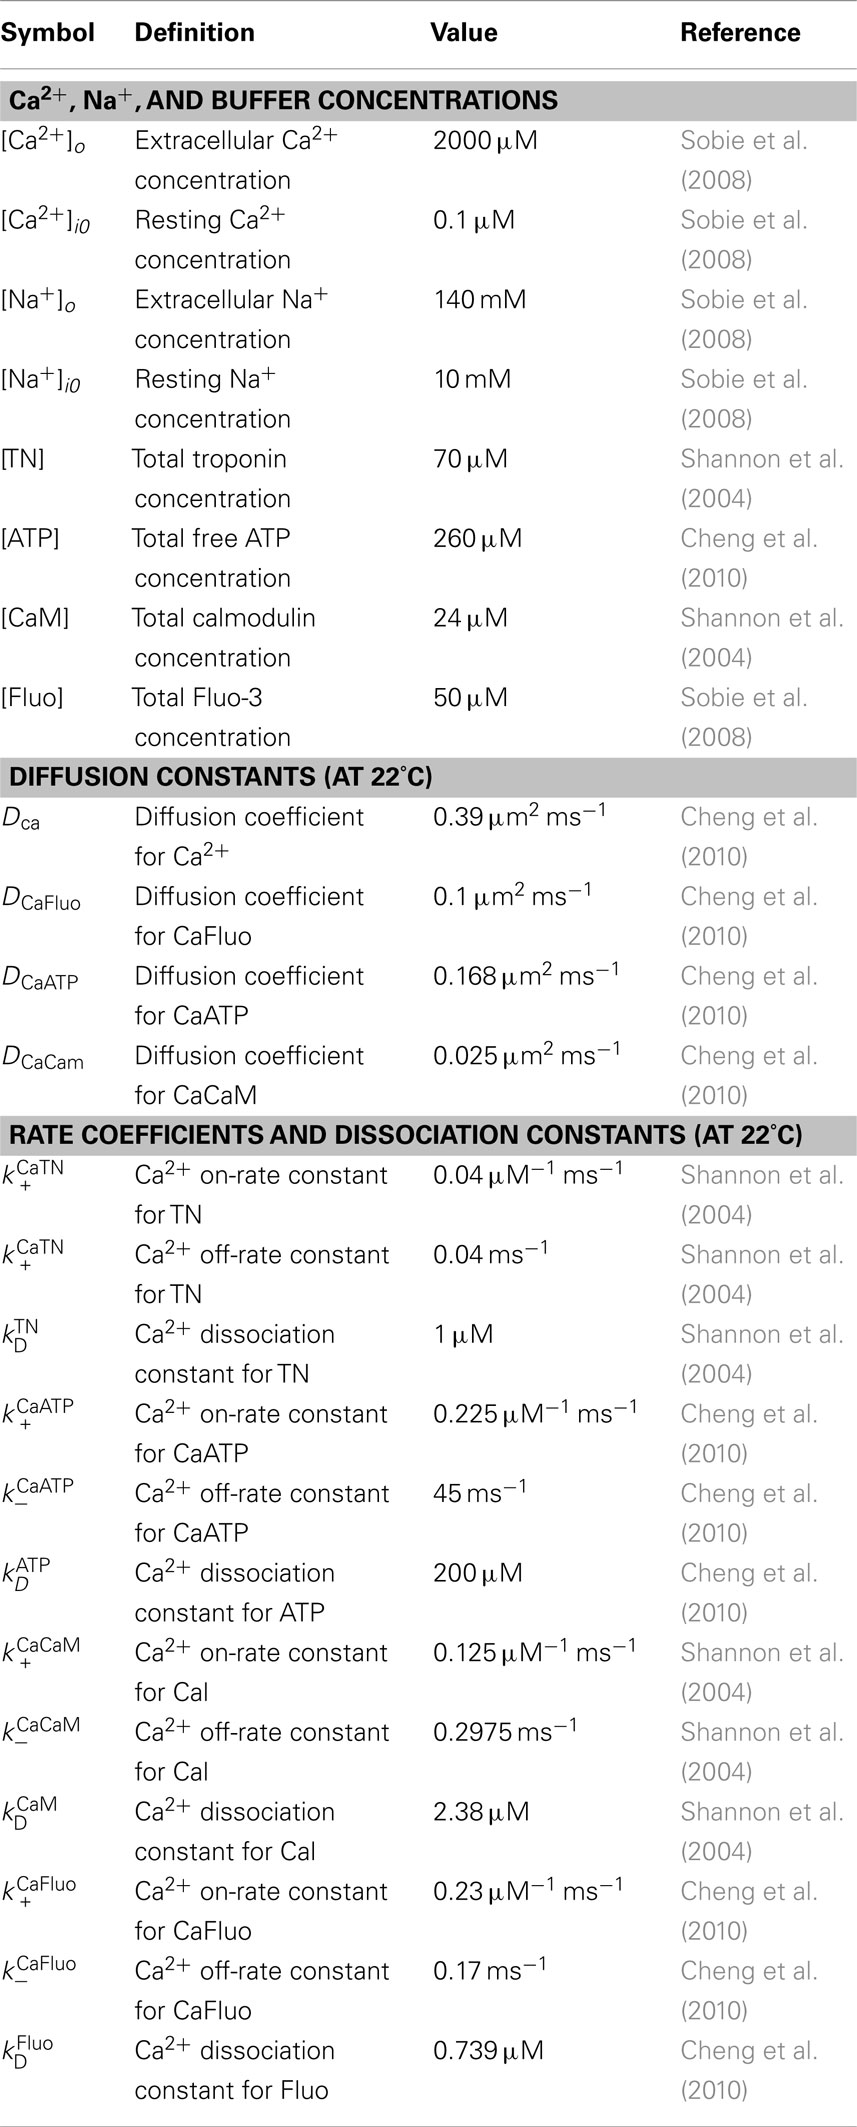
Table A2. Calcium and buffer reaction-diffusion parameters.
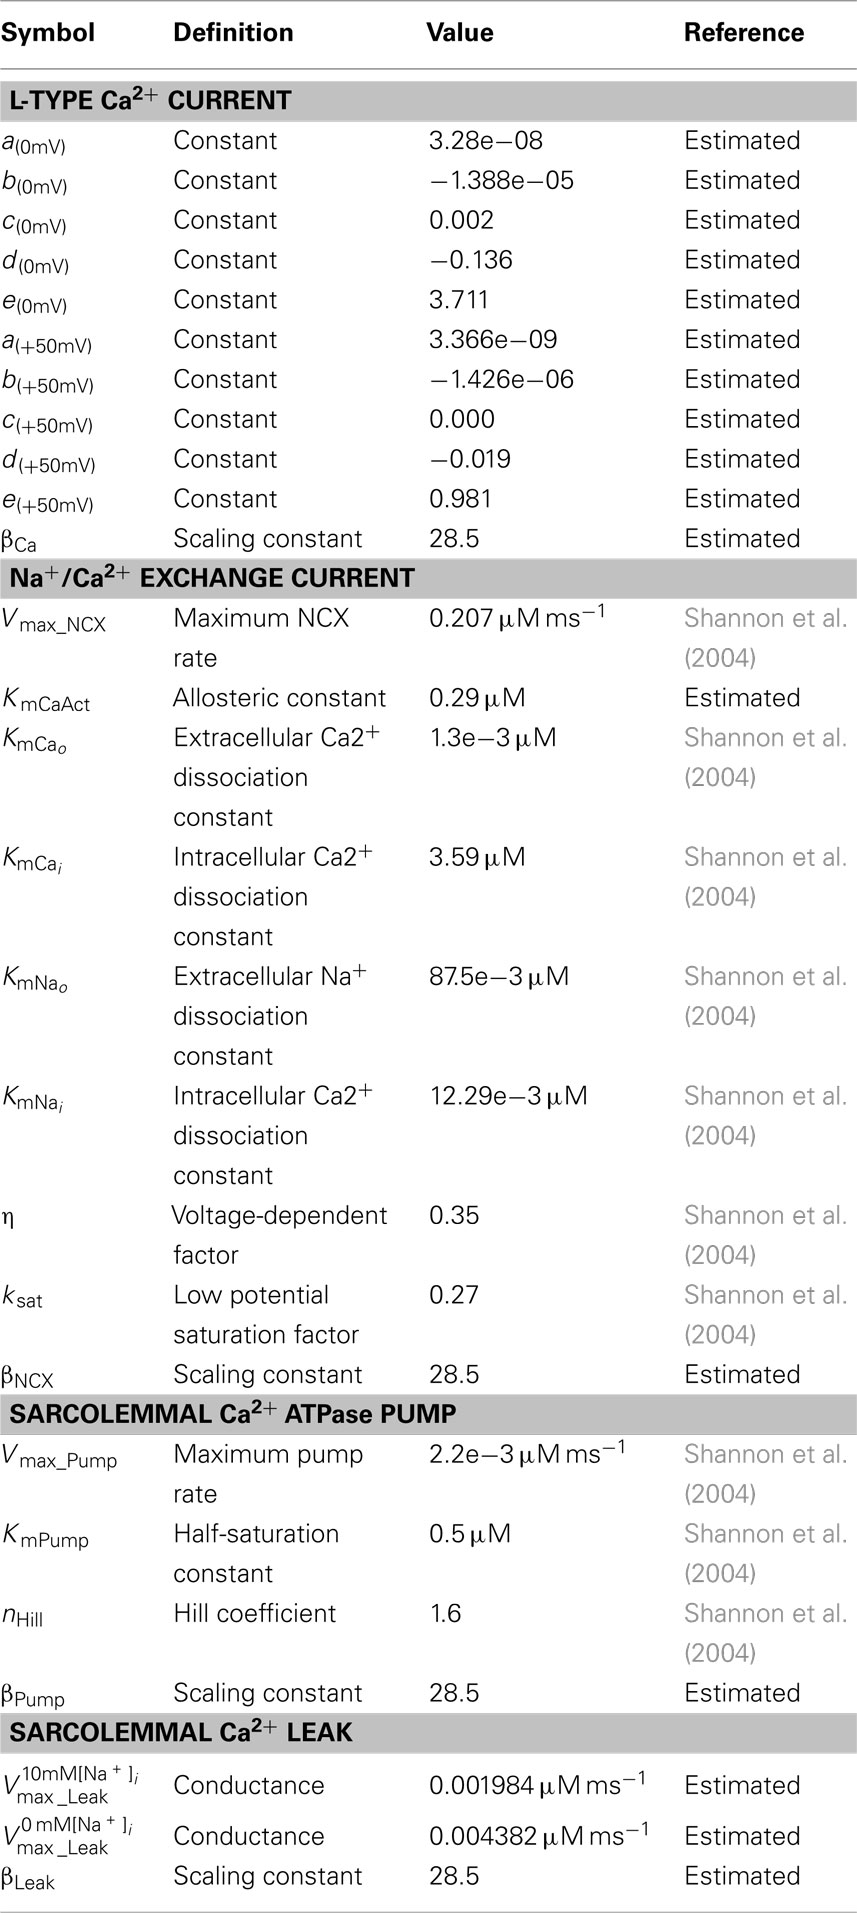
Table A3. Membrane calcium fluxes parameters.
Model Equations
Reaction-diffusion equations.
where [Bm] represents the concentration of mobile buffer Fluo-3, ATP, or calmodulin; [Bs] is the concentration stationary buffer troponin C.
In the model we assume: (1) isotropic diffusion for Ca2+ and all mobile buffers (Soeller et al., 2009); (2) Ca2+ binds to Fluo-3, calmodulin, ATP, and TN without cooperativity; (3) the initial total concentrations of the mobile buffers are spatially uniform; (4) the diffusion coefficients of Fluo-3, ATP, or calmodulin with bound Ca2+ are equal to the diffusion coefficients of free Fluo-3, ATP, or calmodulin.
Model Currents
The total Ca2+ flux across the t-tubule and external membrane is described as:
Each current density was converted to Ca2+ flux by using the experimentally suggested surface to volume ratio in adult rabbit ventricular myocytes (Satoh et al., 1996; Bers, 2001):
where Vms and Sms are total surface and volume of the real or ideal model compartment and βi scaling constant.
L-type Ca2+ current (ILCC).
L-type Ca2+ current density was parameterized to fit the current profiles recoded at 0 mV and +50 mV (Sobie et al., 2008):
Na+/Ca2+ exchanger current (INCX).
The steady-state relation between [Ca2+]i and INCX is described as in Weber et al. (2001):
The three factors are: Allo-allosteric regulation by [Ca2+]i, which is not transported; Bind-competitive binding of Na+ and Ca2+ as substrates; Elect-effects of membrane potential. The latter two combined give an electrochemical term, i.e., ΔE = Bind × Elect.
Sarcolemmal Ca2+ ATPase pump (IPump).
The equation and describing IPump dependence on [Ca2+]i is from Shannon et al. (2004):
Sarcolemmal Ca2+ leak (ILeak).
The equation for ILeak dependence on [Ca2+]i is as in Shannon et al. (2004):
At rest the Ca2+ influx via background Ca2+ leak is adjusted to match the Ca2+ efflux via NCX and Ca2+ ATPase so that no net movement across the cell membrane to occurred.
Numerical Algorithms and Software
In finite-element methods, a complex domain needs to be discretized into a number of small elements (such as triangles or tetrahedra). This process is usually referred to as mesh generation (Yu et al., 2008a,b). Although different types of meshes may be generated depending on the numerical solvers to be employed, we restrict ourselves to triangular (surface) and tetrahedral (volumetric) mesh generation as commonly used in biomedical simulation. In the present simulation, the number of finite-element nodes and tetrahedral elements are 4274 and 13,673, respectively.
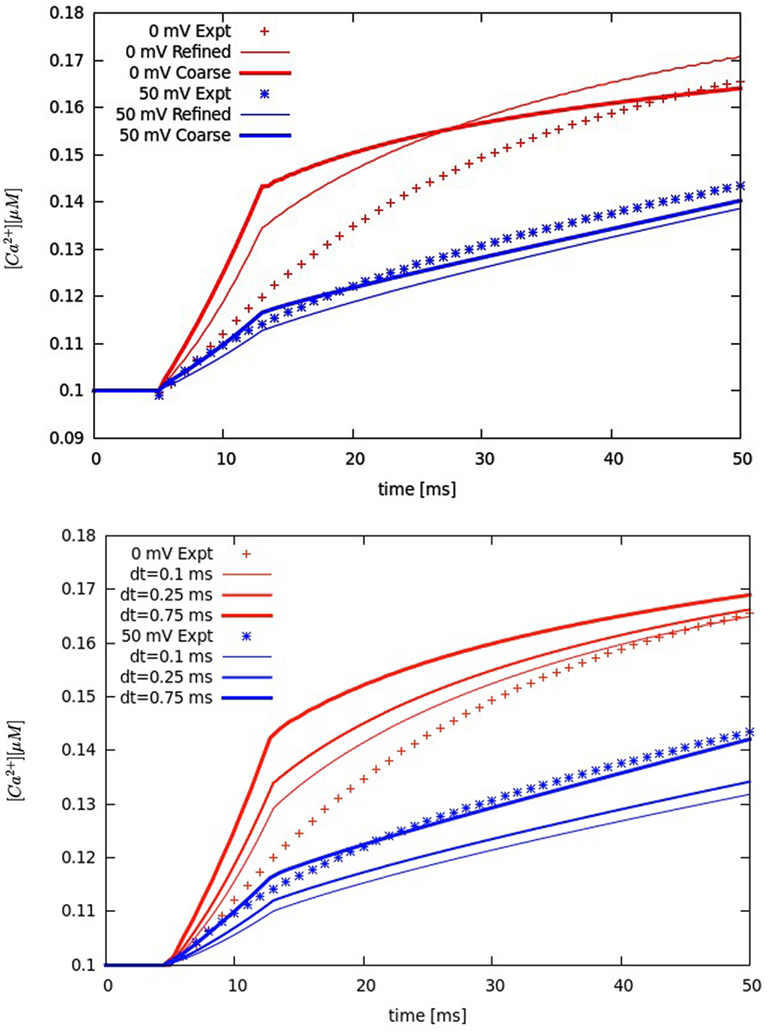
Figure A1. Solution convergence analysis. Upper panel: refining the original mesh. Lower panel: changing the original time step of 0.5 ms. Global Ca2+ transients experimentally measured (symbols). Membrane voltage at 0 mV (red lines and symbols) and at +50 mV (blue lines and symbols). [Na+]i 10 mM.
The non-linear reaction-diffusion system was solved by a finite difference method in time and finite-element method in space using our SMOL software tool (Smoluchowski Solver, http://mccammon.ucsd.edu/smol/) with the time step of 0.5 ms. It takes around 60 min to run 200 ms snapshots with a single Intel Xeon X5355 processor. The SMOL program utilizes libraries from the finite-element tool kit (FETK), which previously has been used in several molecular level studies (Cheng et al., 2007a,b, 2008). One bottleneck for dynamic 3D simulation of non-linear reaction-diffusion system is the computing complexity involved in solving the problem. Here we successfully extended SMOL to solve multiple coupled partial differential equations with non-linear ordinary equations. Multiple tests demonstrate that our SMOL program is quite robust and flexible for various boundary and initial conditions. The simulation results were visualized using GMV mesh viewers (Ortega, 1996). Post-processing and data analyses were implemented by customized Python, MATLAB 2008b (The MathWorks, Natick, MA, USA) scripts and Xmgrace software (Vaught, 1996). A version control system, subversion, was used to monitor the development of software (Collins-Sussman et al., 2002).
References
Bers, D. (2001). Excitation-Contraction Coupling and Cardiac Contractile Force. Dordrecht: Kluwer Academic Publishers.
Cheng, Y., Suen, J. K., Zhang, D., Bond, S. D., Zhang, Y., Song, Y., Baker, N. A., Bajaj, C. L., Holst, M. J., and McCammon, J. A. (2007a). Finite element analysis of the time-dependent Smoluchowski equation for acetylcholinesterase reaction rate calculations. Biophys. J. 92, 3397–3406.
Cheng, Y., Suen, J. K., Radić, Z., Bond, S. D., Holst, M., and McCammon, J. A. (2007b). Continuum simulations of acetylcholine diffusion with reaction-determined boundaries in neuromuscular junction models. Biophys. Chem. 127, 129–139.
Cheng, Y., Chan, C. E., Yu, Z., Zhang, Y., Sun, M., Leyh, T. S., Holst, M. J., and McCammon, J. A. (2008). Diffusional channeling in the sulfate activating complex: Combined continuum modeling and coarse-grained Brownian dynamics studies. Biophys. J. 95, 4659–4667.
Cheng, Y., Yu, Z., Hoshijima, M., Holst, M. J., McCulloch, A. D., McCammon, J. A., and Michailova, A. P. (2010). Numerical analysis of Ca2+ signaling in rat ventricular myocytes with realistic transverse-axial tubular geometry and inhibited sarcoplasmic reticulum. PLoS Comp. Biol. 6, e1000972. doi:10.1371/journal.pcbi.1000972
Collins-Sussman, B., Fitzpatrick, B. W., and Pilato, C. M. (2002). Version Control with Subversion. Available at: http://subversion.tigris.org/
Heiden, W., Goetze, T., and Brickman, J. (1993). Fast generation of molecular surfaces from 3D data fields with an enhanced “Marching Cube” algorithm. J. Comput. Chem. 14, 246–250.
Ortega, F. (1996). The General Mesh Viewer. Available at: http://www.generalmeshviewer.com/
Satoh, H., Delbridge, L., Blatter, L., and Bers, D. (1996). Surface: volume relationship in cardiac myocytes studied with confocal microscopy and membrane capacitance measurements: species-dependence and developmental effects. Biophys. J. 70, 1494–1504.
Savio-Galimberti, E., Frank, J., Inoue, M., Goldhaber, J. I., Cannell, M. B., Bridge, J. H. B., and Sachse, F. B. (2008). Novel features of the rabbit transverse tubular system revealed by quantitative analysis of three-dimensional reconstructions from confocal images. Biophys. J. 95, 2053–2062.
Shannon, T., Wang, F., Puglisi, J., Weber, C., and Bers, D. (2004). A mathematical treatment of integrated Ca dynamics within the ventricular myocyte. Biophys. J. 87, 3351–3371.
Sobie, E. A., Cannell, M. B., and Bridge, J. H. B. (2008). Allosteric activation of Na+-Ca2+ exchange by L-Type Ca2+ current augments the trigger flux for SR Ca2+ release in ventricular myocytes. Biophys. J. 94, L54–L56.
Soeller, C., Jayasinghe, I. D., Li, P., Holden, A. V., and Cannell, M. B. (2009). Three-dimensional high-resolution imaging of cardiac proteins to construct models of intracellular Ca2+ signalling in rat ventricular myocytes. Exp. Physiol. 94, 496–508.
Vaught, A. (1996). Graphing with Gnuplot and Xmgr. Linux J. Available at: http://www.linuxjournal.com/issue/28
Weber, C., Ginsburg, K., Philipson, K., Shannon, T., and Bers, D. (2001). Allosteric regulation of Na/Ca exchange current by cytosolic Ca in intact cardiac myocytes. J. Gen. Physiol. 117, 119–131.
Yu, Z., Holst, M., Cheng, Y., and McCammon, J. A. (2008a). Feature-preserving adaptive mesh generation for molecular shape modeling and simulation. J. Mol. Graph. Model. 26, 1370–1380.
Keywords: Ca2+ signaling, L-type Ca2+ channel, Na+/Ca2+ exchanger, channel clustering, allosteric regulation, t-tubule, rabbit ventricular myocyte
Citation: Kekenes-Huskey PM, Cheng Y, Hake JE, Sachse FB, Bridge JH, Holst MJ, McCammon JA, McCulloch AD and Michailova AP (2012) Modeling effects of L-type Ca2+ current and Na+-Ca2+ exchanger on Ca2+ trigger flux in rabbit myocytes with realistic t-tubule geometries. Front. Physio. 3:351. doi: 10.3389/fphys.2012.00351
Received: 13 April 2012; Paper pending published: 22 May 2012;
Accepted: 16 August 2012; Published online: 10 September 2012.
Edited by:
Mohsin Saleet Jafri, George Mason University, USAReviewed by:
Eric A. Sobie, Mount Sinai School of Medicine, USAVijay Rajagopal, University of Auckland, New Zealand
Copyright: © 2012 Kekenes-Huskey, Cheng, Hake, Sachse, Bridge, Holst, McCammon, McCulloch and Michailova. This is an open-access article distributed under the terms of the Creative Commons Attribution License, which permits use, distribution and reproduction in other forums, provided the original authors and source are credited and subject to any copyright notices concerning any third-party graphics etc.
*Correspondence: Peter M. Kekenes-Huskey, Department of Pharmacology, University of California San Diego, La Jolla, CA, USA. e-mail: pkekeneshuskey@ucsd.edu; Anushka P. Michailova, Department of Bioengineering, University of California San Diego, La Jolla, CA, USA. e-mail: amihaylo@bioeng.ucsd.edu