 Shu Xing
 Matthew W. Grol
 Peter H. Grutter1
 S. Jeffrey Dixon
 Svetlana V. Komarova
- 1Department of Physics, McGill University, Montreal, QC, Canada
- 2Shriners Hospital for Children-Canada, Montreal, QC, Canada
- 3Department of Anatomy and Cell Biology, Schulich School of Medicine and Dentistry, University of Western Ontario, London, ON, Canada
- 4Department of Physiology and Pharmacology, Schulich School of Medicine and Dentistry, and Bone and Joint Institute, University of Western Ontario, London, ON, Canada
- 5Faculty of Dentistry, McGill University, Montreal, QC, Canada
Extracellular ATP acts on the P2X family of ligand-gated ion channels and several members of the P2Y family of G protein-coupled receptors to mediate intercellular communication among many cell types including bone-forming osteoblasts. It is known that multiple P2 receptors are expressed on osteoblasts (P2X2,5,6,7 and P2Y1,2,4,6). In the current study, we investigated complex interactions within the P2 receptor network using mathematical modeling. To characterize individual P2 receptors, we extracted data from published studies of overexpressed human and rodent (rat and mouse) receptors and fit their dependencies on ATP concentration using the Hill equation. Next, we examined responses induced by an ensemble of endogenously expressed P2 receptors. Murine osteoblastic cells (MC3T3-E1 cells) were loaded with fluo-4 and stimulated with varying concentrations of extracellular ATP. Elevations in the concentration of cytosolic free calcium ([Ca2+]i) were monitored by confocal microscopy. Dependence of the calcium response on ATP concentration exhibited a complex pattern that was not explained by the simple addition of individual receptor responses. Fitting the experimental data with a combination of Hill equations from individual receptors revealed that P2Y1 and P2X7 mediated the rise in [Ca2+]i at very low and high ATP concentrations, respectively. Interestingly, to describe responses at intermediate ATP concentrations, we had to assume that a receptor with a K1∕2 in that range (e.g. P2Y4 or P2X5) exerts an inhibitory effect. This study provides new insights into the interactions among individual P2 receptors in producing an ensemble response to extracellular ATP.
Introduction
Extracellular nucleotides, signaling via P2 receptors, participate in a wide range of biological processes, including neurotransmission, exocrine and endocrine secretion, immune responses, inflammation, pain, and platelet aggregation (Burnstock and Knight, 2004; Orriss et al., 2012). Among the nucleotides, adenosine 5′-triphosphate (ATP) is found in prokaryotes, plants and animals, where it is important for both intracellular and extracellular cell functions. Intracellular ATP is primarily utilized to drive energy-dependent processes, such as active transport (Ataullakhanov and Vitvitsky, 2002). Extracellular ATP has been clearly established to play a role in several biological processes, including the regulation of epithelial cell responses (Schafer et al., 2003), neurotransmission and secretion (Burnstock, 2007), the activation of platelets at sites of vascular injury (Pederson et al., 1999), and bone homeostasis (Weidema et al., 1997; Bowler et al., 2001; Grol et al., 2009; Orriss et al., 2010). The release of ATP can be triggered by various mechanical stimuli, such as shear stress, tension, and hydrostatic pressure (Lazarowski, 2012). Once released into the extracellular milieu, ATP acts on target cells and initiates intracellular signaling through P2 receptors, which are subdivided into the P2X family of ligand-gated ion channels and the P2Y family of G protein-coupled receptors (North, 2002; von Kugelgen, 2006; Orriss et al., 2012). Release of ATP in response to mechanical stimulation, coupled with the presence of multiple P2 receptors on bone cells, has led to the proposal that purinergic signaling plays a key role in skeletal mechanotransduction (Dixon and Sims, 2000).
Currently, seven P2X receptors (P2X1-7) and eight P2Y receptors (P2Y1, P2Y2, P2Y4, P2Y6, P2Y11-14) have been cloned and confirmed in mammals (Gallagher, 2004; Burnstock, 2007). ATP is the sole agonist for the functional homo- or heterotrimeric channels formed by P2X subunits. Upon binding of ATP, these channels change configuration, allowing the entry of Ca2+ in addition to the movement of monovalent cations such as Na+ and K+ (Coddou et al., 2011b). Among P2X receptors, homomeric P2X6 channels were found to be silent as no currents were evoked by ATP when P2X6 was expressed alone (North, 2002; Coddou et al., 2011b). Most G protein-coupled P2Y receptors (P2Y1, P2Y2, P2Y4, P2Y6, P2Y11, P2Y13) are linked to activation of phospholipase C, generation of inositol phosphates and release of Ca2+ from intracellular stores (Kennedy et al., 2000; Marteau et al., 2003; White et al., 2003). Depending on the subtype, P2Y receptors can be activated physiologically by ATP, ADP, UTP, UDP, and/or UDP-glucose; however, in the present study, only ATP signaling was addressed. Of the eight P2Y receptors, only P2Y6 and P2Y14 are not activated in the presence of ATP.
Bone forming osteoblasts express at least seven different P2 receptor subtypes (P2X2, P2X5, P2X7, P2Y1, P2Y2, P2Y4, and P2Y6; Orriss et al., 2012). Certain differences in expression in rodent and human tissues can be noted. For instance, the P2Y2 receptor was shown to be strongly expressed on human osteoblasts, whereas P2Y1 receptors were predominant on rat osteoblasts (Gallagher and Buckley, 2002). The functional responses of individual receptors have been studied extensively in vitro using heterologous expression techniques to focus on a specific receptor while excluding contributions of others (references in Tables 1, 2). However, less is known about the interactions among endogenously expressed P2 receptors, which determine the overall response to ATP physiologically and pathologically.
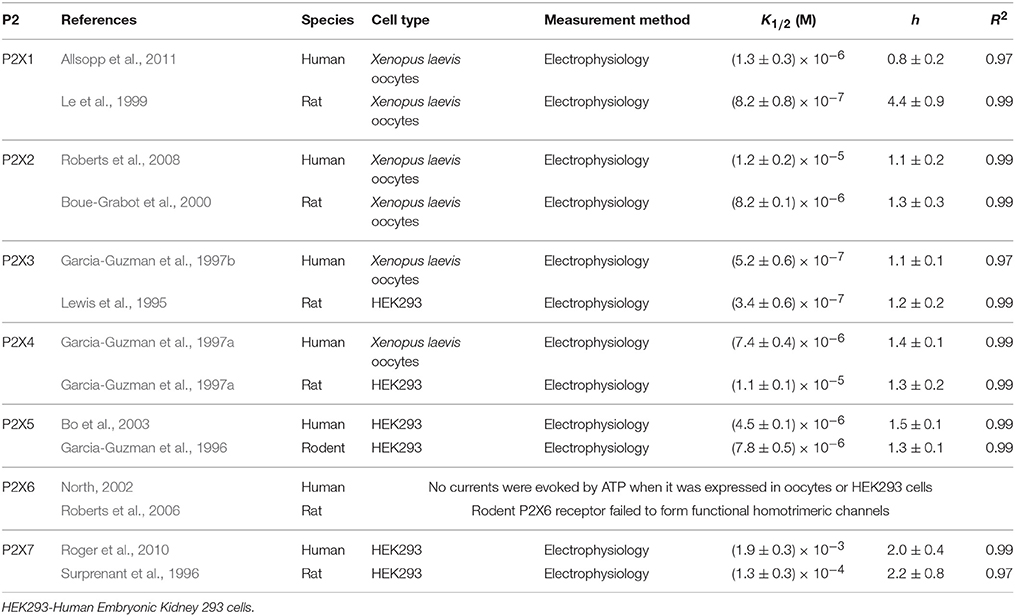
Table 1. P2X Receptors: data sources and fitting parameters.
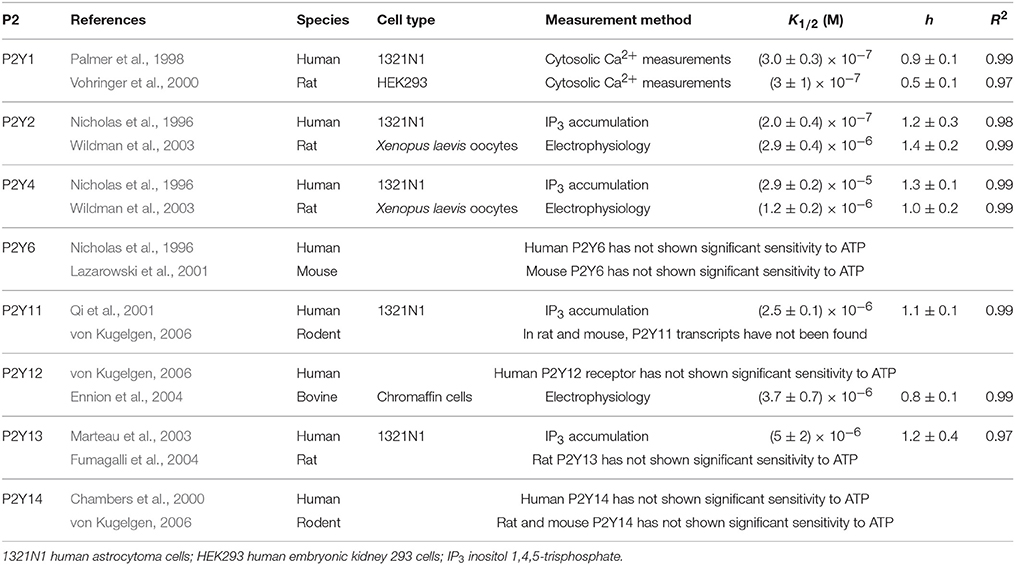
Table 2. P2Y Receptors: data sources and fitting parameters.
The goal of this study was to use previously published ATP dose-dependence data for individual P2 receptors to gain insight into how these receptors might interact when expressed together in an endogenous network of P2 receptors present in the osteoblastic cell line MC3T3-E1. To do this, we first summarized published data on the ATP concentration dependency of individual P2 receptors. We then performed detailed analysis of the dependence of calcium responses in osteoblastic cells on extracellular ATP concentration. Finally, we modeled the potential contribution of individual receptors to ATP responses in osteoblastic cells endogenously expressing an ensemble of P2 receptor subtypes.
Materials and Methods
Cells and Cell Culture
The MC3T3-E1 osteoblast-like cell line, a non-transformed clonal cell line originally established from newborn mouse calvaria (Sudo et al., 1983), was from the American Type Culture Collection (Rockville, MD, USA). Subclone 4 of MC3T3-E1 cells was selected because these cells exhibit properties of osteoblasts, including elevation of cyclic AMP in response to parathyroid hormone. expression of transcripts for Runx2, bone sialoprotein, and osteocalcin, and formation of mineralized nodules (Wang et al., 1999). Importantly, MC3T3-E1 cells endogenously express multiple subtypes of P2X and P2Y receptors (Gartland et al., 2012; Grol et al., 2013; Xing et al., 2014). Functionally, extracellular nucleotides acting through P2 receptors on MC3T3-E1 cells have been reported to stimulate: cell proliferation (Shimegi, 1996); prostaglandin release (Genetos et al., 2005); cell metabolism (Grol et al., 2012); Ca2+-NFATc1 signaling (Grol et al., 2013); and the Wnt/β-catenin signaling pathway (Grol et al., 2016). Thus, the MC3T3-E1 cell line is an excellent system for examining interactions among endogenously expressed P2 receptors in a physiologically relevant cell type. MC3T3-E1 cells were maintained at 37°C and 5% CO2 in α-minimum essential medium, supplemented with 10% fetal bovine serum and 1% antibiotic solution (10,000 U/mL penicillin, 10,000 μg/mL streptomycin, and 25 μg/mL amphotericin B). All cell culture reagents were from Life Technologies Inc. (Burlington, ON, Canada).
Fluorescence Measurement of Cytosolic Free Calcium Concentration ([Ca2+]i)
[Ca2+]i measurements used in the present study were unpublished single-cell data from our previous work (Grol et al., 2013). Briefly, MC3T3-E1 cells were plated at a density of 1.5 × 10⁴ cells/cm2 on 35-mm glass-bottomed dishes (MatTek Corporation, Ashland, MA, USA) in culture medium. After 2 days, cells were placed in serum-free medium and incubated overnight. On the day of the experiment, cells were loaded with the Ca2+-sensitive dye fluo-4 by incubation with fluo-4-AM (2 μg/mL) and 0.1% Pluronic F-127 (Molecular Probes, Life Technologies) for 30–45 min at 37°C and 5% CO2. Medium was then replaced with HEPES-buffered, bicarbonate-free α-MEM supplemented with 1% antibiotic solution, and cells were observed by live-cell confocal microscopy (model LSM 510; Carl Zeiss Inc., Jena, Germany) at ~28°C using a Plan-Apochromat 40 × objective (1.2 NA; Carl Zeiss Inc.) with 488 nm Ar+ ion laser excitation. Images were captured at 500–550 emission every 500 ms in time-lapse mode. Fluorescence intensity was analyzed using LSM 510 software. Baseline fluorescence intensity in different experiments varied between 23 ± 7 and 78 ± 43 FU. Within individual experiments basal fluorescence intensity between different experimental conditions varied by 17 ± 8%. [Ca2+]i in individual cells was quantified as normalized fluorescence intensity using the formula (F/Fo)−1, where F was fluorescence intensity and Fo was the baseline fluorescence observed prior to application of adenosine 5′-triphosphate disodium salt (ATP, Sigma-Aldrich, St. Louis, MO, USA) to the bath solution.
Data Analysis
Experimental data are presented as representative traces or means ± standard deviation (SD) when the responses of individual cells within a single experiment were analyzed or standard error of the mean (SEM) when the results of a number of independent experiments were analyzed. MATLAB (The MathWorks Inc., Natick, MA, 2000) was used to extract and analyze the calcium response data and to calculate the average peak amplitude, duration and area under the curve (Supplementary Matlab code 1). The outliers were identified as points outside of mean ± 2 SD within the group of cells exposed to the same ATP concentration within the same experiment. Between 25% (for low ATP concentrations) and 10% (for high ATP concentrations) of cells were removed from analysis as outliers. Data within an individual experiment was normalized to maximum in each corresponding parameter to account for biological and experimental variability. Comparative analyses of outcomes using raw data and normalized data demonstrated that only for the amplitude dose dependence was statistical significance lost when raw data were used, due to higher variability in this parameter. Differences were assessed by ANOVA for multiple group comparisons, followed by Tukey post-test, and accepted as statistically significant at p < 0.05. To examine the contribution of individual receptors to the overall calcium response, we used a linear combination approach, in which the complex response was assumed to arise from the sum of responses of individual receptors multiplied by the respective coefficients. We defined the set of basic functions as the concentration dependences of individual receptors obtained from literature analysis, and assumed that a complex ATP-dependence is a sum of basic functions executed with certain weight (coefficients): f(x) = a1f1(x) + a2f2(x) + …+ anfn(x), where fi (i = 1, 2, …n) are the ATP concentration dependencies of individual receptors and ai (i = 1, 2, …n) are coefficients that roughly correspond to the efficiency of engagement of different receptors as well as generally stimulatory (positive contribution) or inhibitory (negative contribution) of individual functions (receptors) to the overall response. The coefficients in the linear combination function were then fitted numerically.
Fitting Methods
The data points of each receptor were extracted from indicated published sources using software DataThief (B. Tummers, DataThief III. 2006). These data were then fit to the Hill equation using a non-linear least squares regression program in MATLAB (Supplementary Matlab code 2). The Hill coefficient, half maximum value and linear combination coefficients (Supplementary Matlab code 3) were obtained from the fitting, and are presented as best fit value ± 95% confidence interval.
Results
Characteristics of Individual P2 Receptors
Using previously published data, we first explored the dependence on ATP concentration of responses induced by each P2 receptor. Within each of the studies, an individual P2X (Table 1) or P2Y (Table 2) receptor cDNA sequence was isolated and overexpressed in various cell-types and their dependency on ATP concentration was measured. The data from the concentration dependence curves obtained in each study were extracted, normalized to the maximal response and fitted to the Hill equation (Figure 1; Evans et al., 1995):
where θ is the fraction of activated receptors; L represents ligand concentration; K1∕2 is the ligand concentration at half maximal response, and h is the Hill coefficient, describing cooperativity (Figure 1, Tables 1, 2).
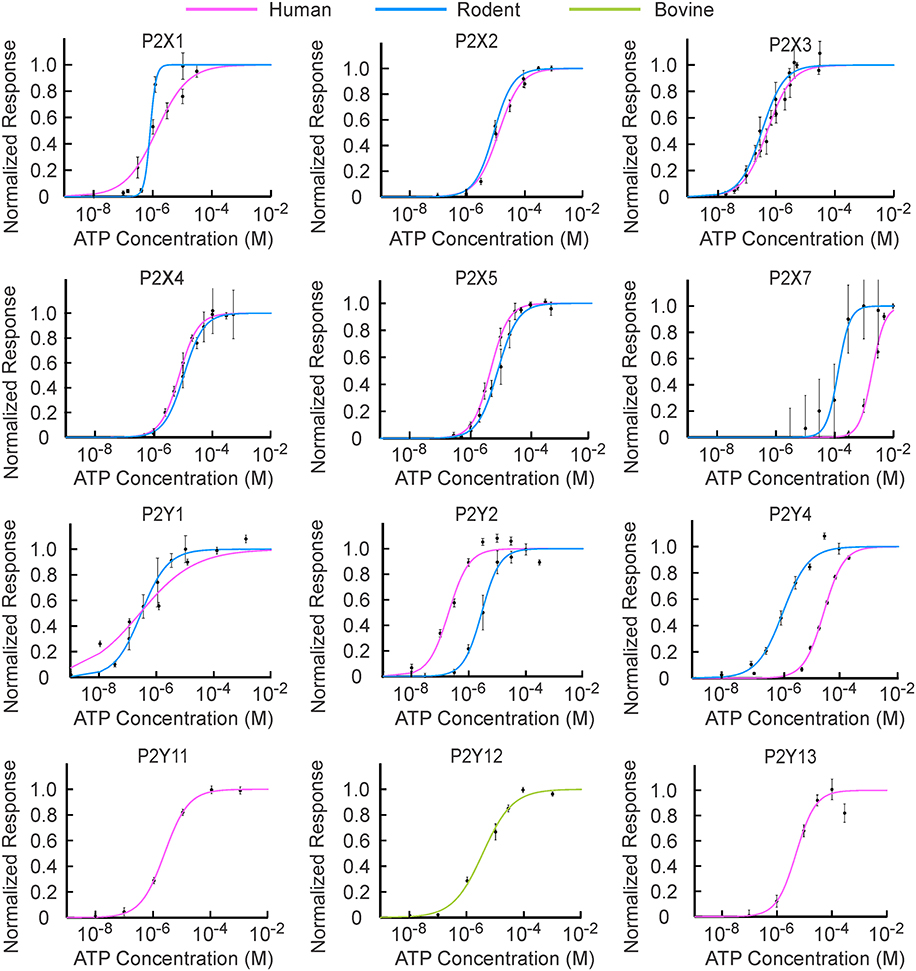
Figure 1. [ATP] sensitivity of P2X and P2Y receptor families. The experimental data points for human and rodent P2 receptors denoted by dots were re-plotted from papers indicated in Tables 1, 2. P2Y11 transcripts have not been found in rodents; therefore, only human P2Y11 was used. The experimental data for [ATP] dependence of human and rodent P2Y12 and rodent P2Y13 were not found in the literature, therefore bovine P2Y12 and human P2Y13 were used. The data were normalized to the maximal response. [ATP] dependence for each receptor was fit with the Hill equation with R2 > 0.95, and shown in pink for human, blue for rodent, and green for bovine receptors.
The [ATP] dependence of rodent and human receptors overlapped for P2X2-5 receptors. Rodent and human P2X1 and P2Y1 receptors demonstrated similar K1∕2 but different cooperativity h, which was higher for rodent P2X1 and P2Y1 receptors. P2Y2, P2Y4, and P2X7 exhibited a difference in K1∕2 between human and rodent receptors. Rodent P2X7 and P2Y4 were more sensitive to [ATP], whereas P2Y2 was less sensitive compared to their human counterparts (Figure 1, Tables 1, 2). When plotted together, the concentration dependence curves for both human (Figure 2A) and rodent (Figure 2B) receptors covered a wide range of [ATP]; however, rodent receptors were positioned in a lower concentration range from 10−9 to 10−3 M, which was shifted to the right by approximately an order of magnitude for human receptors, 10−8 to 10−2 M. To assess the contributions of individual P2 receptors to ATP-induced calcium responses in osteoblasts, we plotted [ATP]-dependencies of the known ATP-responsive P2 receptors expressed by osteoblastic cells P2X2,5,7 and P2Y1,2,4 (Figure 2C).
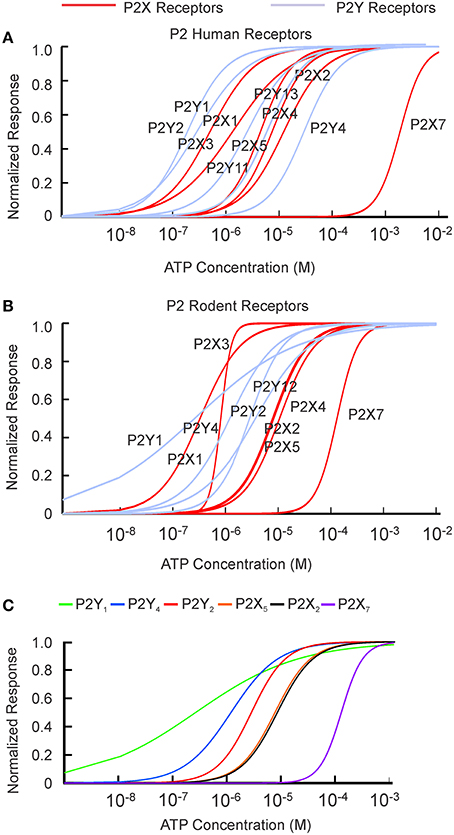
Figure 2. P2 receptors are activated by a wide range of ATP concentrations. ATP concentration dependence obtained from the fitting of published data (Tables 1, 2) to the Hill equation for P2X receptors (in red) and P2Y receptors (in light purple) were plotted for human (A) and rodent (B) receptors. (C) P2 receptors known to be expressed on osteoblasts.
Experimental Data for the Dependence of Ca2+ Responses on ATP Concentration
We used the murine osteoblast-like cell line MC3T3-E1, which endogenously expresses an ensemble of P2X and P2Y receptors (Grol et al., 2013). Cells were loaded with the calcium-sensitive fluorescent probe fluo-4 and ATP-induced changes in [Ca2+]i were assessed. Extracellular ATP from 1 nM to 1 mM induced transient elevation of [Ca2+]i with distinctive patterns at different concentrations (Figure 3A). We characterized these ATP-induced calcium responses by determining: (i) the peak amplitude; (ii) the width at half maximum, which reflects the duration of the calcium response; and (iii) the area under the curve, which reflects the amount of calcium released over time (Figure 3B). We analyzed individual responses of 21–61 cells to 8–11 different concentrations of ATP in 8 independent experiments (2607 cells in total).
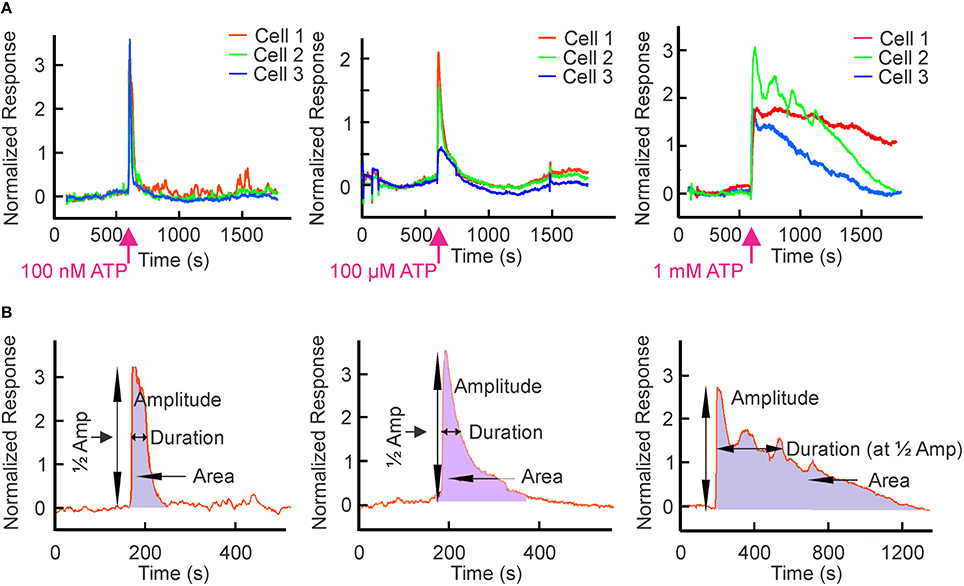
Figure 3. ATP-induced Ca2+ responses in osteoblastic cells. MC3T3-E1 cells were loaded with the Ca2+ sensitive dye fluo-4 and changes in [Ca2+]i in response to bath application of ATP were monitored by confocal microscopy. [Ca2+]i in individual cells was normalized as (F/F0)−1, where F was fluorescence intensity and F0 was the baseline fluorescence observed prior to addition of ATP. (A) Representative calcium responses from osteoblasts exposed to 100 nM, 100 μM or 1 mM ATP at the time indicated by the arrow. (B) The schematics illustrate parameters used to analyse the calcium response curves. Peak amplitude was quantified as the maximal rise in [Ca2+]i. Duration of the response was quantified as the width at the half maximum. The amount of calcium released was calculated as the area under the curve by taking the integral of the curve.
An ATP Sensitivity Threshold was Generated by P2Y1 (with Potential Involvement of P2Y4) at Low Concentrations of ATP
We first examined the dose dependence of calcium responses at very low ATP concentrations (10−9–10−7 M). In these experiments, application of vehicle commonly induced low-level responses likely attributable to mechanical stimulation of osteoblasts due to fluid shear. Therefore, we chose three experiments in which the cell responses to vehicle were absent or low and analyzed them separately for the responses to ATP in the range of 10−9–10−7 M (Figure 4). We found that the average amplitude of calcium responses exhibited a trend to increase at 10−9 M [ATP] and was significantly higher than in vehicle-treated cells at 10−8 M [ATP] (Figure 4A). The average duration of the calcium signal did not change at these concentrations (Figure 4B). The average area under the curve increased significantly at 10−9 M [ATP] compared to vehicle and increased further at 10−8 compared to 10−9 M [ATP] (Figure 4C). Interestingly, variation in the amplitude of the calcium response (reflected by the size of the error bars) was greater than in the amount of calcium released estimated as the area under the curve. When we compared the amplitude and duration of calcium responses in individual cells, we found a significant negative correlation between these parameters (Figure 4D), suggesting that amplitude and duration are not independent parameters, but rather exhibit a complex non-linear correlation represented by an exponential regression line. The best fit for amplitude [K1∕2 = (7 ± 9) × 10−10 M, h = 1 ± 1, R2 = 0.87] and area [K1∕2 = (5 ± 7) × 10−10 M, h = 0.8 ± 0.5, R2 = 0.83] curves were similar (Figure 4E).
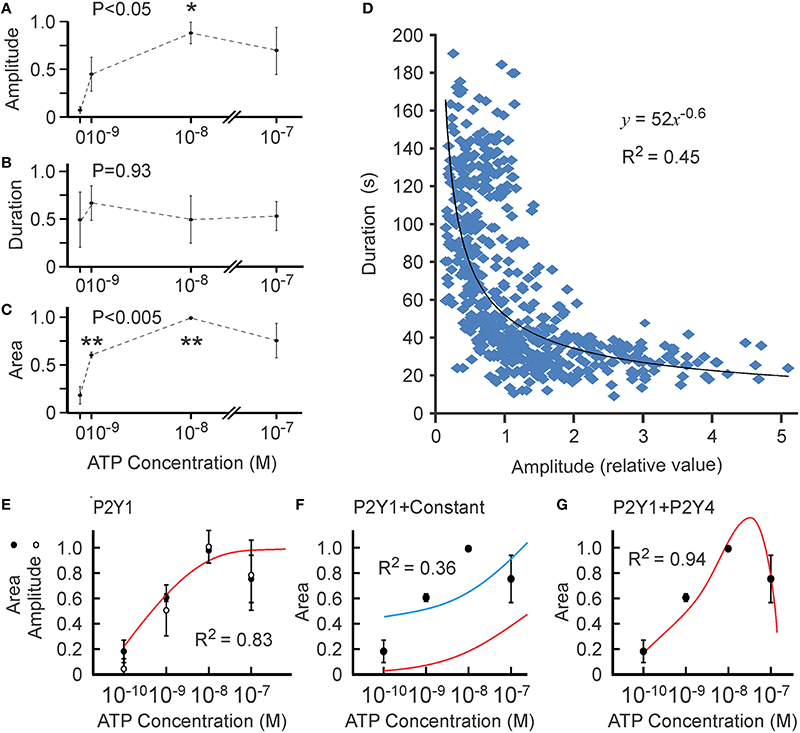
Figure 4. Ca2+ responses induced by low [ATP]. Changes in [Ca2+]i induced by bath application of vehicle (0) or 10−9–10−7 M ATP to MC3T3-E1 cells loaded with fluo-4 were analyzed. (A) [ATP] dependence of average peak amplitude. (B) [ATP] dependence of average response duration. (C) [ATP] dependence of average area under the curve. For (A–C), data are means ± SEM, normalized to the maximal amplitude (A), duration (B) or area under the curve (C) (maximal response = 1) within an experiment, n = 3 independent experiments, 17–35 cells per condition in each experiment. The differences were analyzed by ANOVA (P-value given on the top of the graph) followed by Tukey post-test, *p < 0.05; **p < 0.01 compared to vehicle (0). (D) The correlation between the amplitude and duration of Ca2+ responses was examined in 563 individual cells exposed to 10−9–10−7 M ATP. (E) Similar best fit for [ATP] dependence for amplitude (white circles) and area (black circles) of Ca2+ responses. (F) The [ATP] dependence for the area was fit with the Hill equation of P2Y1 based on published data yielding no acceptable fit (red curve). The Hill equation of P2Y1 offset by a constant β is shown as the blue curve (ky1 = 1 ± 2, β = 0.4 ± 0.6, R2 = 0.36). (G) The [ATP] dependence for the area under Ca2+ responses was fit with the linear combination of P2Y1 and P2Y4 functions (ky1 = 7 ± 1, ky4 = −25 ± 8, R2 = 0.94).
Since P2Y1 is the most sensitive ATP receptor, we first assumed that P2Y1 is the only receptor contributing to the calcium response in the 10−9–10−7 M range, and fit the area curve with the Hill equation of P2Y1. However, the sensitivity of P2Y1 observed in overexpression experiments (Table 2) was not sufficient to describe the responses to ATP at 10−9–10−8 M observed in MC3T3-E1 cells with an endogenous ensemble of P2 receptors (Figure 4F, red curve). One strategy to obtain a better fit was to shift the curve up, assuming a constant extraneous contribution to the response (such as mechanical perturbation of the cell induced by application of the test solution: Grol et al., 2013). The best fit available had R2 = 0.36 and required a non-specific contribution of β = 0.43 (Figure 4F, blue curve). As another possibility, we considered simultaneous activation of P2Y1 and P2Y4, modeled as a linear combination of these receptors: θ(x) = ky1 × P2Y1 + ky4 × P2Y4. Interestingly, the best resulting fit had an R2 = 0.94 (Figure 4G) and required the contribution of P2Y4 to be inhibitory.
A Second Threshold was Generated by P2X7 at High Concentrations of ATP
We next examined ATP concentration dependence over 10−9–10−2 M in eight independent experiments using MC3T3-E1 cells. When the concentration of ATP was increased, an increase in the amplitude of the calcium response was observed (Figure 5A). The duration of the calcium signal increased only when [ATP] exceeded 10−4 M, a concentration at which P2X7 is activated (Figure 5B). The concentration dependence for the area under the curve (characterizing the amount of calcium released during the response) revealed the presence of a second threshold—a sharp increase in the area between 10−4 and 10−3 M ATP (Figure 5C). Similar to the low ATP concentration range, variability in the area under the curve was noticeably smaller when compared to variability in duration or amplitude. Though the negative correlation between duration and amplitude observed at low ATP was still significant at 10−6–10−4 M [ATP] (Figure 5D), it was completely lost at 10−3–10−2 M [ATP] (Figure 5E). The best fits for the duration curve (R2 = 0.96, Figure 5F) and the area curve (R2 = 0.97, Figure 5G) exhibited similar K1∕2 of (6.0 ± 0.6) × 10−4 M and (4.6 ± 0.3) × 10−4 M, respectively. The same cooperativity of h = 4 ± 1 and h = 4 ± 1 was also observed for both. Whereas the P2X7 fit obtained for the overexpressed receptor was similar to our study, we observed both higher K1∕2 and higher cooperativity in our experimental data (Figure 5H).
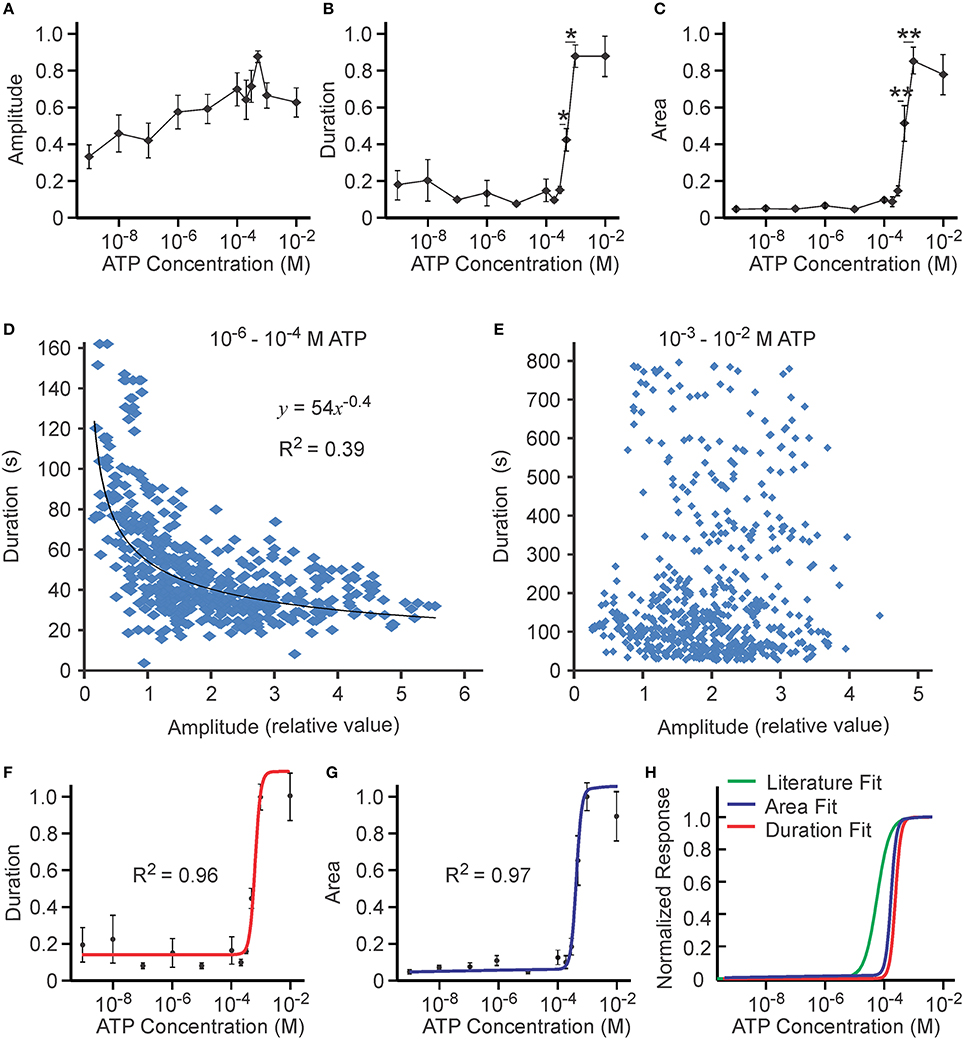
Figure 5. Ca2+ responses induced by high [ATP]. Changes in [Ca2+]i induced by bath application of 10−9–10−2 M ATP to MC3T3-E1 cells loaded with fluo-4 were analyzed. (A) [ATP] dependence of average peak amplitude. (B) [ATP] dependence of average response duration. (C) [ATP] dependence of average area under calcium response. For (A–C) data are means ± SEM, n = 8 independent experiments, 11–55 cells per condition in each experiment. Differences (indicated by horizontal lines) were analyzed by ANOVA and were significant for (B,C), p < 0.0001. Selected statistically significant differences are shown with asterisks that demonstrate significant increases with an increase in applied [ATP] assessed by Tukey post-test (*p < 0.05, **p < 0.01). (D,E) The correlation between the amplitude and duration of Ca2+ responses was examined in 520 individual cells exposed to 10−6–10−4 M ATP (D) and in 588 individual cells exposed to 10−3–10−2 M ATP (E). (F) The [ATP] dependence for the duration of calcium response was fit with the Hill equation with K1∕2 = (6.0 ± 0.6) × 10−4 M and h = 4 ± 1 and an offset of β = 0.13 ± 0.03. (G) The [ATP] dependence for the area under calcium response was fit with the Hill equation with K1∕2 = (4.6 ± 0.3) × 10−4 M and h = 4 ± 1 with an offset of β = 0.05 ± 0.02. (H) Comparison of published P2X7 fit (green line) obtained for the overexpressed receptor [K1∕2 = (1.3 ± 0.3) × 10−4 M and h = 2.2 ± 0.8; (Surprenant et al., 1996)] to the fits for average duration (red line, same as in F) and average area (blue line, same as in G) observed in our experimental data.
Complex Dependence of Amplitude on Concentration in the Intermediate Range of [ATP]
During the analysis, we noticed that the ATP concentration dependence for amplitude of calcium responses averaged for 8 independent experiments was described by a continuously increasing curve (Figure 5A). However, such a curve was not representative of any of the 8 individual experiments, leading us to conclude that, under this circumstance, average cannot be used as a measure of central tendency for the underlying ATP concentration dependence. In fact, within each individual experiment the [ATP]-dependence of amplitude averaged for 11–55 distinct cells exhibited significant non-linearity (3 examples are given in Figures 6A–C). Specifically, we observed that the amplitude decreased with increasing [ATP] and then increased again, resulting in peaks in the intermediate range of [ATP]. In one out of eight independent experiments, there was only one peak (Figure 6A); whereas, in the 7 others, there were at least 2 such peaks (Figures 6B,C). Since the position of these peaks within the ATP concentration dependence curves varied, we analyzed each experiment for the ATP concentrations at which we observed (a) the initial low response, (b) the first peak, (c) the lowest value between the peaks, (d) the second peak, and (e) the lowest value after the second peak, as well as the relative amplitudes at each point (Figure 6D). We found that such analyses revealed 2 distinct peaks in amplitude for the calcium response—a lower peak at 180 ± 140 nM ATP and a higher peak at 1.6 ± 1.2 mM ATP. We removed the highest [ATP] point from the concentration-dependence due to potential non-specific effects of 10 mM ATP (Grol et al., 2013). The resulting relationship was modeled with a linear combination of published [ATP] dependencies for P2Y1, P2Y4, and P2X7: θ(x) = ky1 × P2Y1 + ky4 × P2Y4 + kx7 × P2X7. An excellent fit (R2 = 0.99) was given by the following linear combination of constants: ky1 = 1.8 ± 0.4; ky4 = −1.4±0.4; kx7 = 0.6 ± 0.2 (note that the contribution from P2Y4 was again inhibitory; Figure 6E). This curve could also be successfully described by a linear combination of P2Y1 and P2X7 with inhibitory P2X5 (ky1 = 1.5 ± 0.3, kx5 = −1.4±0.4, kx7 = 0.91 ± 0.2, R2 = 0.99) or inhibitory P2X2 (ky1 = 1.5 ± 0.3, kx2 = −1.4±0.4, kx7 = 0.95 ± 0.3, R2 = 0.99).
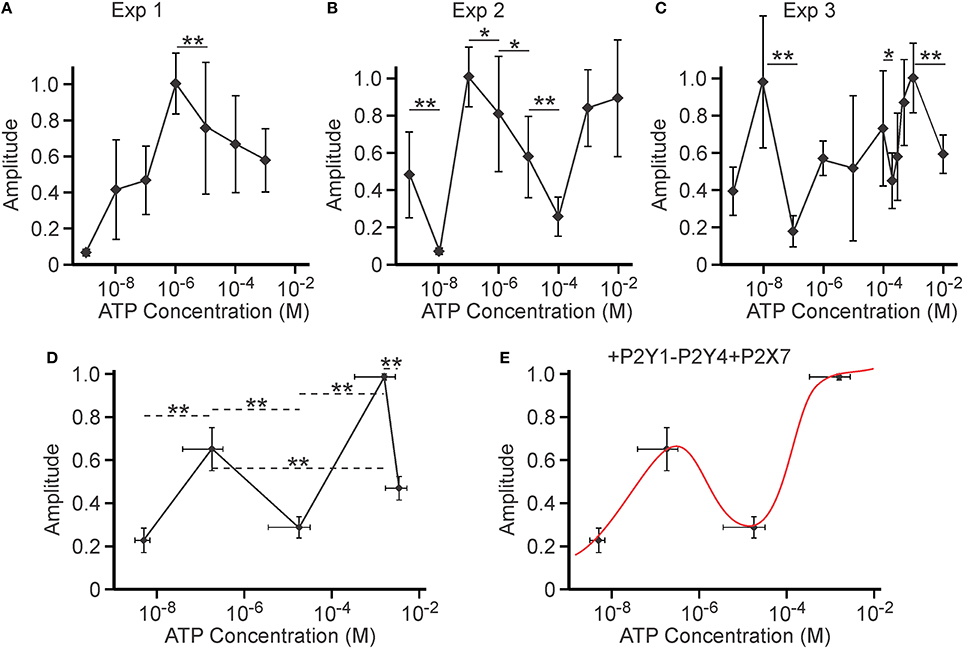
Figure 6. Potential inhibitory role of a P2 receptor activated at intermediate [ATP]. Amplitudes of Ca2+ responses induced by bath application of 10−9–10−2 M ATP to MC3T3-E1 cells loaded with fluo-4 were analyzed. (A–C) The examples of [ATP] dependencies of the peak amplitude of calcium response observed in three independent experiments. Data are means ± SEM, normalized to the maximal response (maximal response = 1) within an experiment, n = 19–25 cells/concentration for (A), 11–27 cells/concentration for (B), 17–31 cells/concentration for (C). Differences (indicated by horizontal lines) were analyzed by ANOVA and were significant for all cases, with p < 0.0001. Selected statistically significant differences are shown with asterisks that demonstrate significant decreases in amplitude with an increase in applied [ATP] assessed by Tukey post-test (*p < 0.05, **p < 0.01). (D) Eight experiments were analyzed for ATP concentrations and relative amplitudes of (i) the initial low response, (ii) the first peak, (iii) the lowest value between the peaks, (iv) the second peak, and (v) the lowest value after the second peak. Means ± SEM for [ATP] and relative amplitudes were plotted. Differences (indicated by horizontal dashed lines) were analyzed by ANOVA (p < 0.0001), followed by Tukey post-test; **p < 0.01. (E) The resulting concentration dependence was fit with the linear combination of P2Y1, P2Y4, and P2X7 functions (ky1 = 1.8 ± 0.4; ky4 = −1.4±0.4; kx7 = 0.6 ± 0.2, R2 = 0.99).
Discussion
In this study, we examined the interactions among P2 receptors endogenously expressed by mouse osteoblastic cells and how such interactions shape the profiles of transient Ca2+ elevations induced by ATP over a wide range of concentrations. Experimentally, we examined Ca2+ elevations in response to 10−9–10−2 M ATP and observed complex dependence on [ATP] for amplitude, duration and area under the curve. In particular, the area under the curve (reflecting the amount of calcium released) demonstrated the presence of two thresholds—the first at approximately 1 nM ATP and the second at approximately 1 mM ATP. At low [ATP], an increase in the amplitude of Ca2+ responses created a sensitivity threshold in the ATP concentration dependence. At high [ATP], an increase in the duration of response coincided with a second threshold. Finally, the amplitude of calcium responses demonstrated a complex two-peak pattern suggesting the presence of desensitization at intermediate concentrations of ATP. To explain these complex trends, we used published data for [ATP] dependencies of individual P2 receptors. We found that a linear combination of different receptor functions described calcium responses over a wide range of [ATP], if one of the receptors activated by mid-range concentrations of ATP was assumed to exhibit an inhibitory effect on the ATP-induced calcium response.
Sensitivity Threshold at Low Concentrations of ATP
At low ATP concentrations from 1 to 100 nM, P2Y1 is the predominant rodent receptor responsible for Ca2+ elevations. Published data on the P2Y1 receptor reported a K1∕2 of 50–200 nM ATP (Palmer et al., 1998; Vohringer et al., 2000); whereas, our experimental data on osteoblastic cells requires P2Y1 to be more sensitive to ATP (K1∕2 ~ 1 nM). We could partially account for this discrepancy by assuming that mechanical perturbation contributed to the calcium response, as previously described (Grol et al., 2013); however, the fit obtained with such an assumption was not very good (R2 = 0.36). On the other hand, when we considered the simultaneous activation of P2Y1 and P2Y4, we achieved an increase in the apparent sensitivity of P2Y1 to 1 nM ATP. Interestingly, the increased sensitivity of P2Y1 was only possible if we assumed an inhibitory effect of P2Y4 activation. P2Y4-mediated inhibition permits the situation where the response to P2Y1 stimulation is limited to an apparent maximum, while the actual maximal response is greater. As a result, the apparent K1∕2 for P2Y1 is shifted to the left. Although it is known that allosteric regulators can affect the apparent K1∕2 of receptor-ligand interactions (Hulme and Trevethick, 2010), we describe a mechanism in which the function of an individual receptor is not affected, but the simultaneous activation of stimulatory and inhibitory pathways changes the apparent K1∕2. Importantly, such heterologous desensitization allows for generation of a steep threshold, while at the same time limiting the maximal level of stimulation. This phenomenon may be relevant to diverse systems in which sharp response thresholds are observed and multiple receptors are activated by the same or similar ligands, such as eicosanoid signaling (Rundhaug et al., 2011), odor recognition (Dewan et al., 2013), and neurotransmission by nicotinic receptors (Exley and Cragg, 2008).
P2X7 is Responsible for Responses to ATP at High Concentrations
Our study suggests that cell responses to high [ATP] above 200 μM reflect activation of the P2X7 receptor. It was previously known that only activation of P2X7 results in prolonged elevation of calcium (Virginio et al., 1999; Naemsch et al., 2001; Grol et al., 2012; Jiang et al., 2013). In P2X7 knockout mice, the Ca2+ response is transient, similar to the response induced by low [ATP] (Grol et al., 2013). In the present study, we found that duration of calcium responses was not dependent on [ATP] at concentrations less than 10−4 M, but strongly increased at higher concentrations with K1∕2 of 600 ± 120 μM. We also found that the second threshold in area under the curve mirrored that of the increase in duration. In our study, the observed sensitivity of the P2X7 receptor was less than that reported for overexpressed receptors, whereas the cooperativity was greater (Surprenant et al., 1996; Roger et al., 2010). Millimolar levels of ATP represent the normal intracellular concentration range for ATP (Ataullakhanov and Vitvitsky, 2002). Therefore, extracellular ATP in the millimolar range likely occurs following cell damage, or in response to vigorous mechanical stimuli. It is well-known that bone adapts to mechanical loading by increasing its mass. In this regard, activation of P2X7 receptors by extracellular ATP in the millimolar range has been proposed to stimulate anabolic responses in bone (Ke et al., 2003; Li et al., 2005; Panupinthu et al., 2008; Grol et al., 2013, 2016). Therefore, we propose that the second, P2X7-mediated threshold in calcium responses to ATP provides an anabolic signal following robust mechanical stimulation as well as during the early stages of wound healing following trauma.
Inhibitory Contribution of a P2 Receptor with Mid-Range Sensitivity to ATP
We found that the amplitude of P2 receptor-induced calcium responses exhibited an unexpected dependence on ATP concentration. Specifically, a significant decrease in peak amplitude could be observed with increases in [ATP] at mid-range concentrations of 10−7–10−4 M. Agonist concentration dependencies that could not be simply explained by known P2 receptor characteristics have been described previously for neuronal cells (Patel et al., 2001) as well as taste buds cells (Fedorov et al., 2007). We found that, to describe this behavior using only a linear combination of known receptors, it was necessary to assume that one or more of the receptors activated by mid-range ATP concentrations contributes negatively to the overall response.
Although, none of the P2 receptors expressed individually demonstrates inverse agonism in response to ATP, several reasons for observing such behavior in naïve cells can be suggested. First, different P2 receptors can form heteromers with physiological and pharmacological properties distinct from homomeric receptors (Surprenant et al., 2000; Coddou et al., 2011b; Compan et al., 2012). Second, the availability of different receptors can be regulated in complex manner. For example, it was reported that P2X4 receptors undergo rapid internalization in olfactory neurons, whereas P2X2 are not regulated by translocation (Bobanovic et al., 2002). Third, simultaneous activation of several receptors may result in a crosstalk at the level of signaling events, potentially altering responses of some or all the receptors. In this regard, it was shown that membrane depolarization (as induced by activation of P2X receptors) can enhance P2Y-mediated Ca2+ responses, and that voltage-related potentiation of the P2Y1 receptor has an inverse relationship with agonist concentration (Gurung et al., 2008). Fourth, endogenously expressed receptors may be modulated by allosteric regulators or signaling pathways absent when the same receptor is expressed in heterologous systems (Coddou et al., 2011a). Finally, the possibility of a novel receptor subtype or splice variant cannot be discarded.
Notwithstanding the mechanism underlying this effect, our data suggest that the role of at least one of the P2 receptors active at 10−7–10−4 M [ATP] is to limit the responsiveness of the system over this range of ATP concentrations. Importantly, such behavior would result in a desensitization phase, and facilitate formation of a sharp threshold in response to ATP between 10−4 and 10−3 M.
Study Limitations
An important limitation of the current study is the application of P2 receptor characteristics obtained in studies of individual receptors in one cell type to the analysis of complex responses in another cell type. The following important assumptions were made during the initial stages of analysis. (1) We assumed that overexpression of an individual receptor in cells that do not normally express this receptor does not fundamentally change the characteristics of this receptor. While this may not be true, evidence of the contrary (that characteristics of P2 receptors change when overexpressed) has not yet been reported. Moreover, at this moment, there is no reliable way to obtain the concentration dependences of individual P2 receptors in an endogenous system due to overlapping action of the same ligand on different receptors. Therefore, we believe this assumption is important and unavoidable at the moment. (2) We assumed that characteristics of the receptors in related species of rodents (mice and rats) are similar and used them to model responses in a mouse cell line. While receptor characteristics may differ between mice and rats, limited data is available comparing responses. Of interest, we found that when receptors of rodent and human origin are compared, 4 out of 9 receptors have almost identical ATP concentration dependences, and 2 more have similar ATP concentration dependences (Figure 1). More studies are required to fully understand the differences between P2 receptors of different species.
Conclusion
Taken together, our data suggest that, rather than having distinct individual roles, P2 receptors work in concert with both additive and inhibitory interactions. The ensemble yields a complex pattern of dependence on ATP concentration. This relationship is characterized by the presence of two thresholds: the first (at lower concentrations of ATP) likely relevant for tissue maintenance in response to moderate mechanical stimulation, and the second (at high concentrations of ATP) for anabolic responses to stronger mechanical stimulation and tissue damage. In mouse models, deficiency of individual P2 receptors studied to date have resulted in a bone phenotype; however, each of the reported phenotypes demonstrate unique characteristics, for example, reduced bone mass in P2Y1 and P2X7 receptor knockout mice, increased bone mass in P2Y2 and P2Y6 receptor knockout mice, and lower trabecular bone volume and increased cortical thickness in P2Y13 receptor knockout mice (Wang et al., 2013). In future studies, it will be important to examine how dependence on ATP concentration is affected by the absence of individual P2 receptors. Moreover, it would be interesting to test for heterologous desensitization among P2 receptors, as predicted by our model. Such information may allow the design of targeted experiments aimed at determining how change in overall [ATP] dependence affects bone adaptation to low, intermediate or high mechanical strains.
Author Contributions
Study conception and design: SX, PG, SD, SK. Acquisition of data: SX, MG. Analysis and interpretation of data: SX, MG, SD, SK. Drafting of manuscript: SX, SK. All authors contributed to the critical revision of manuscript and approved the final version to be published.
Funding
This research was funded by the Canadian Institutes of Health Research (CIHR) grants number 77643 and 102542, and by the Natural Sciences and Engineering Research Council of Canada grant number RGPIN-2015-05579.
Conflict of Interest Statement
The authors declare that the research was conducted in the absence of any commercial or financial relationships that could be construed as a potential conflict of interest.
Acknowledgments
The authors thank Gabriela Monserratt Lopez Ayon for providing helpful advice for the data analysis and Victor Yu for proofreading the manuscript. MG was supported by a CIHR Frederick Banting and Charles Best Canada Graduate Scholarship Doctoral Award. SK holds the Canada Research Chair in Osteoclast Biology at McGill University.
Supplementary Material
The Supplementary Material for this article can be found online at: http://journal.frontiersin.org/article/10.3389/fphys.2016.00294
References
Allsopp, R. C., El Ajouz, S., Schmid, R., and Evans, R. J. (2011). Cysteine scanning mutagenesis (residues Glu52-Gly96) of the human P2X1 receptor for ATP: mapping agonist binding and channel gating. J. Biol. Chem. 286, 29207–29217. doi: 10.1074/jbc.M111.260364
Ataullakhanov, F. I., and Vitvitsky, V. M. (2002). What determines the intracellular ATP concentration. Biosci. Rep. 22, 501–511. doi: 10.1023/A:1022069718709
Bo, X., Jiang, L. H., Wilson, H. L., Kim, M., Burnstock, G., Surprenant, A., et al. (2003). Pharmacological and biophysical properties of the human P2X5 receptor. Mol. Pharmacol. 63, 1407–1416. doi: 10.1124/mol.63.6.1407
Bobanovic, L. K., Royle, S. J., and Murrell-Lagnado, R. D. (2002). P2X receptor trafficking in neurons is subunit specific. J. Neurosci. 22, 4814–4824.
Boue-Grabot, E., Archambault, V., and Seguela, P. (2000). A protein kinase C site highly conserved in P2X subunits controls the desensitization kinetics of P2X(2) ATP-gated channels. J. Biol. Chem. 275, 10190–10195. doi: 10.1074/jbc.275.14.10190
Bowler, W. B., Buckley, K. A., Gartland, A., Hipskind, R. A., Bilbe, G., and Gallagher, J. A. (2001). Extracellular nucleotide signaling: a mechanism for integrating local and systemic responses in the activation of bone remodeling. Bone. 28, 507–512. doi: 10.1016/S8756-3282(01)00430-6
Burnstock, G. (2007). Purine and pyrimidine receptors. Cell. Mol. Life Sci. 64, 1471–1483. doi: 10.1007/s00018-007-6497-0
Burnstock, G., and Knight, G. E. (2004). Cellular distribution and functions of P2 receptor subtypes in different systems. Int. Rev. Cytol. 240, 31–304. doi: 10.1016/S0074-7696(04)40002-3
Chambers, J. K., Macdonald, L. E., Sarau, H. M., Ames, R. S., Freeman, K., Foley, J. J., et al. (2000). A G protein-coupled receptor for UDP-glucose. J. Biol. Chem. 275, 10767–10771. doi: 10.1074/jbc.275.15.10767
Coddou, C., Stojilkovic, S. S., and Huidobro-Toro, J. P. (2011a). Allosteric modulation of ATP-gated P2X receptor channels. Rev. Neurosci. 22, 335–354. doi: 10.1515/rns.2011.014
Coddou, C., Yan, Z., Obsil, T., Huidobro-Toro, J. P., and Stojilkovic, S. S. (2011b). Activation and regulation of purinergic P2X receptor channels. Pharmacol. Rev. 63, 641–683. doi: 10.1124/pr.110.003129
Compan, V., Ulmann, L., Stelmashenko, O., Chemin, J., Chaumont, S., and Rassendren, F. (2012). P2X2 and P2X5 subunits define a new heteromeric receptor with P2X7-like properties. J. Neurosci. 32, 4284–4296. doi: 10.1523/JNEUROSCI.6332-11.2012
Dewan, A., Pacifico, R., Zhan, R., Rinberg, D., and Bozza, T. (2013). Non-redundant coding of aversive odours in the main olfactory pathway. Nature 497, 486–489. doi: 10.1038/nature12114
Dixon, S. J., and Sims, S. M. (2000). P2 purinergic receptors on osteoblasts and osteoclasts: Potential targets for drug development. Drug Dev. Res. 49, 187–200. doi: 10.1002/(SICI)1098-2299(200003)49:3<187::AID-DDR9>3.0.CO;2-F
Ennion, S. J., Powell, A. D., and Seward, E. P. (2004). Identification of the P2Y(12) receptor in nucleotide inhibition of exocytosis from bovine chromaffin cells. Mol. Pharmacol. 66, 601–611. doi: 10.1124/mol.104.000224
Evans, R. J., Lewis, C., Buell, G., Valera, S., North, R. A., and Surprenant, A. (1995). Pharmacological characterization of heterologously expressed ATP-gated cation channels (P2x purinoceptors). Mol. Pharmacol. 48, 178–183.
Exley, R., and Cragg, S. J. (2008). Presynaptic nicotinic receptors: a dynamic and diverse cholinergic filter of striatal dopamine neurotransmission. Br. J. Pharmacol. 153 (Suppl. 1), S283–S297. doi: 10.1038/sj.bjp.0707510
Fedorov, I. V., Rogachevskaja, O. A., and Kolesnikov, S. S. (2007). Modeling P2Y receptor-Ca2+ response coupling in taste cells. Biochim. Biophys. Acta 1768, 1727–1740. doi: 10.1016/j.bbamem.2007.04.002
Fumagalli, M., Trincavelli, L., Lecca, D., Martini, C., Ciana, P., and Abbracchio, M. P. (2004). Cloning, pharmacological characterisation and distribution of the rat G-protein-coupled P2Y(13) receptor. Biochem. Pharmacol. 68, 113–124. doi: 10.1016/j.bcp.2004.02.038
Gallagher, J. A. (2004). ATP P2 receptors and regulation of bone effector cells. J. Musculoskelet. Neuronal Interact. 4, 125–127.
Gallagher, J. A., and Buckley, K. A. (2002). Expression and function of P2 receptors in bone. J. Musculoskelet. Neuronal Interact. 2, 432–439.
Garcia-Guzman, M., Soto, F., Gomez-Hernandez, J. M., Lund, P. E., and Stuhmer, W. (1997a). Characterization of recombinant human P2X4 receptor reveals pharmacological differences to the rat homologue. Mol. Pharmacol. 51, 109–118. doi: 10.1124/mol.51.1.109
Garcia-Guzman, M., Soto, F., Laube, B., and Stuhmer, W. (1996). Molecular cloning and functional expression of a novel rat heart P2X purinoceptor. FEBS Lett. 388, 123–127. doi: 10.1016/0014-5793(96)00499-1
Garcia-Guzman, M., Stuhmer, W., and Soto, F. (1997b). Molecular characterization and pharmacological properties of the human P2X3 purinoceptor. Brain Res. Mol. Brain Res. 47, 59–66. doi: 10.1016/S0169-328X(97)00036-3
Gartland, A., Orriss, I. R., Rumney, R. M., Bond, A. P., Arnett, T., and Gallagher, J. A. (2012). Purinergic signalling in osteoblasts. Front. Biosci. (Landmark Ed). 17, 16–29. doi: 10.2741/3912
Genetos, D. C., Geist, D. J., Liu, D., Donahue, H. J., and Duncan, R. L. (2005). Fluid shear-induced ATP secretion mediates prostaglandin release in MC3T3-E1 osteoblasts. J. Bone Miner. Res. 20, 41–49. doi: 10.1359/JBMR.041009
Grol, M. W., Brooks, P. J., Pereverzev, A., and Dixon, S. J. (2016). P2X7 nucleotide receptor signaling potentiates the Wnt/beta-catenin pathway in cells of the osteoblast lineage. Purinergic Signal. doi: 10.1007/s11302-016-9517-4. [Epub ahead of print].
Grol, M. W., Panupinthu, N., Korcok, J., Sims, S. M., and Dixon, S. J. (2009). Expression, signaling, and function of P2X7 receptors in bone. Purinergic Signal. 5, 205–221. doi: 10.1007/s11302-009-9139-1
Grol, M. W., Pereverzev, A., Sims, S. M., and Dixon, S. J. (2013). P2 receptor networks regulate signaling duration over a wide dynamic range of ATP concentrations. J. Cell Sci. 126(Pt 16), 3615–3626. doi: 10.1242/jcs.122705
Grol, M. W., Zelner, I., and Dixon, S. J. (2012). P2X(7)-mediated calcium influx triggers a sustained, PI3K-dependent increase in metabolic acid production by osteoblast-like cells. Am. J. Physiol. Endocrinol. Metabol. 302, E561–E575. doi: 10.1152/ajpendo.00209.2011
Gurung, I. S., Martinez-Pinna, J., and Mahaut-Smith, M. P. (2008). Novel consequences of voltage-dependence to G-protein-coupled P2Y1 receptors. Br. J. Pharmacol. 154, 882–889. doi: 10.1038/bjp.2008.97
Hulme, E. C., and Trevethick, M. A. (2010). Ligand binding assays at equilibrium: validation and interpretation. Br. J. Pharmacol. 161, 1219–1237. doi: 10.1111/j.1476-5381.2009.00604.x
Jiang, L. H., Baldwin, J. M., Roger, S., and Baldwin, S. A. (2013). Insights into the Molecular Mechanisms Underlying Mammalian P2X7 Receptor Functions and Contributions in Diseases, Revealed by Structural Modeling and Single Nucleotide Polymorphisms. Front. Pharmacol. 4:55. doi: 10.3389/fphar.2013.00055
Ke, H. Z., Qi, H., Weidema, A. F., Zhang, Q., Panupinthu, N., Crawford, D. T., et al. (2003). Deletion of the P2X7 nucleotide receptor reveals its regulatory roles in bone formation and resorption. Mol. Endocrinol. 17, 1356–1367. doi: 10.1210/me.2003-0021
Kennedy, C., Qi, A. D., Herold, C. L., Harden, T. K., and Nicholas, R. A. (2000). ATP, an agonist at the rat P2Y(4) receptor, is an antagonist at the human P2Y(4) receptor. Mol. Pharmacol. 57, 926–931.
Lazarowski, E. R. (2012). Vesicular and conductive mechanisms of nucleotide release. Purinergic Signal. 8, 359–373. doi: 10.1007/s11302-012-9304-9
Lazarowski, E. R., Rochelle, L. G., O'Neal, W. K., Ribeiro, C. M., Grubb, B. R., Zhang, V., et al. (2001). Cloning and functional characterization of two murine uridine nucleotide receptors reveal a potential target for correcting ion transport deficiency in cystic fibrosis gallbladder. J. Pharmacol. Exp. Ther. 297, 43–49.
Le, K. T., Boue-Grabot, E., Archambault, V., and Seguela, P. (1999). Functional and biochemical evidence for heteromeric ATP-gated channels composed of P2X1 and P2X5 subunits. J. Biol. Chem. 274, 15415–15419. doi: 10.1074/jbc.274.22.15415
Lewis, C., Neidhart, S., Holy, C., North, R. A., Buell, G., and Surprenant, A. (1995). Coexpression of P2X2 and P2X3 receptor subunits can account for ATP-gated currents in sensory neurons. Nature 377, 432–435. doi: 10.1038/377432a0
Li, J., Liu, D., Ke, H. Z., Duncan, R. L., and Turner, C. H. (2005). The P2X7 nucleotide receptor mediates skeletal mechanotransduction. J. Biol. Chem. 280, 42952–42959. doi: 10.1074/jbc.M506415200
Marteau, F., Le Poul, E., Communi, D., Labouret, C., Savi, P., Boeynaems, J. M., et al. (2003). Pharmacological characterization of the human P2Y13 receptor. Mol. Pharmacol. 64, 104–112. doi: 10.1124/mol.64.1.104
Naemsch, L. N., Dixon, S. J., and Sims, S. M. (2001). Activity-dependent development of P2X7 current and Ca2+ entry in rabbit osteoclasts. J. Biol. Chem. 276, 39107–39114. doi: 10.1074/jbc.M105881200
Nicholas, R. A., Watt, W. C., Lazarowski, E. R., Li, Q., and Harden, K. (1996). Uridine nucleotide selectivity of three phospholipase C-activating P2 receptors: identification of a UDP-selective, a UTP-selective, and an ATP- and UTP-specific receptor. Mol. Pharmacol. 50, 224–229.
North, R. A. (2002). Molecular physiology of P2X receptors. Physiol. Rev. 82, 1013–1067. doi: 10.1152/physrev.00015.2002
Orriss, I. R., Burnstock, G., and Arnett, T. R. (2010). Purinergic signalling and bone remodelling. Curr. Opin. Pharmacol. 10, 322–330. doi: 10.1016/j.coph.2010.01.003
Orriss, I. R., Key, M. L., Brandao-Burch, A., Patel, J. J., Burnstock, G., and Arnett, T. R. (2012). The regulation of osteoblast function and bone mineralisation by extracellular nucleotides: the role of p2x receptors. Bone 51, 389–400. doi: 10.1016/j.bone.2012.06.013
Palmer, R. K., Boyer, J. L., Schachter, J. B., Nicholas, R. A., and Harden, T. K. (1998). Agonist action of adenosine triphosphates at the human P2Y1 receptor. Mol. Pharmacol. 54, 1118–1123. doi: 10.1124/mol.54.6.1118
Panupinthu, N., Rogers, J. T., Zhao, L., Solano-Flores, L. P., Possmayer, F., Sims, S. M., et al. (2008). P2X7 receptors on osteoblasts couple to production of lysophosphatidic acid: a signaling axis promoting osteogenesis. J. Cell Biol. 181, 859–871. doi: 10.1083/jcb.200708037
Patel, M. K., Khakh, B. S., and Henderson, G. (2001). Properties of native P2X receptors in rat trigeminal mesencephalic nucleus neurones: lack of correlation with known, heterologously expressed P2X receptors. Neuropharmacology 40, 96–105. doi: 10.1016/S0028-3908(00)00108-8
Pederson, L., Winding, B., Foged, N. T., Spelsberg, T. C., and Oursler, M. J. (1999). Identification of breast cancer cell line-derived paracrine factors that stimulate osteoclast activity. Cancer Res. 59, 5849–5855.
Qi, A. D., Zambon, A. C., Insel, P. A., and Nicholas, R. A. (2001). An arginine/glutamine difference at the juxtaposition of transmembrane domain 6 and the third extracellular loop contributes to the markedly different nucleotide selectivities of human and canine P2Y11 receptors. Mol. Pharmacol. 60, 1375–1382. doi: 10.1124/mol.60.6.1375
Roberts, J. A., Digby, H. R., Kara, M., El Ajouz, S., Sutcliffe, M. J., and Evans, R. J. (2008). Cysteine substitution mutagenesis and the effects of methanethiosulfonate reagents at P2X2 and P2X4 receptors support a core common mode of ATP action at P2X receptors. J. Biol. Chem. 283, 20126–20136. doi: 10.1074/jbc.M800294200
Roberts, J. A., Vial, C., Digby, H. R., Agboh, K. C., Wen, H., Atterbury-Thomas, A., et al. (2006). Molecular properties of P2X receptors. Pflugers Arch. 452, 486–500. doi: 10.1007/s00424-006-0073-6
Roger, S., Gillet, L., Baroja-Mazo, A., Surprenant, A., and Pelegrin, P. (2010). C-terminal calmodulin-binding motif differentially controls human and rat P2X7 receptor current facilitation. J. Biol. Chem. 285, 17514–17524. doi: 10.1074/jbc.M109.053082
Rundhaug, J. E., Simper, M. S., Surh, I., and Fischer, S. M. (2011). The role of the EP receptors for prostaglandin E2 in skin and skin cancer. Cancer Metastasis Rev. 30, 465–480. doi: 10.1007/s10555-011-9317-9
Schafer, R., Sedehizade, F., Welte, T., and Reiser, G. (2003). ATP- and UTP-activated P2Y receptors differently regulate proliferation of human lung epithelial tumor cells. Am. J. Physiol. Lung Cell. Mol. Physiol. 285, L376–L385. doi: 10.1152/ajplung.00447.2002
Shimegi, S. (1996). ATP and adenosine act as a mitogen for osteoblast-like cells (MC3T3-E1). Calcif. Tissue Int. 58, 109–113. doi: 10.1007/BF02529732
Sudo, H., Kodama, H. A., Amagai, Y., Yamamoto, S., and Kasai, S. (1983). In vitro differentiation and calcification in a new clonal osteogenic cell line derived from newborn mouse calvaria. J. Cell Biol. 96, 191–198. doi: 10.1083/jcb.96.1.191
Surprenant, A., Rassendren, F., Kawashima, E., North, R. A., and Buell, G. (1996). The cytolytic P2Z receptor for extracellular ATP identified as a P2X receptor (P2X7). Science 272, 735–738. doi: 10.1126/science.272.522.735
Surprenant, A., Schneider, D. A., Wilson, H. L., Galligan, J. J., and North, R. A. (2000). Functional properties of heteromeric P2X(1/5) receptors expressed in HEK cells and excitatory junction potentials in guinea-pig submucosal arterioles. J. Autonomic Nervous Syst. 81, 249–263. doi: 10.1016/S0165-1838(00)00123-5
Virginio, C., MacKenzie, A., Rassendren, F. A., North, R. A., and Surprenant, A. (1999). Pore dilation of neuronal P2X receptor channels. Nat. Neurosci. 2, 315–321. doi: 10.1038/7225
Vohringer, C., Schafer, R., and Reiser, G. (2000). A chimeric rat brain P2Y1 receptor tagged with green-fluorescent protein: high-affinity ligand recognition of adenosine diphosphates and triphosphates and selectivity identical to that of the wild-type receptor. Biochem. Pharmacol. 59, 791–800. doi: 10.1016/S0006-2952(99)00390-1
von Kugelgen, I. (2006). Pharmacological profiles of cloned mammalian P2Y-receptor subtypes. Pharmacol. Ther. 110, 415–432. doi: 10.1016/j.pharmthera.2005.08.014
Wang, D., Christensen, K., Chawla, K., Xiao, G., Krebsbach, P. H., and Franceschi, R. T. (1999). Isolation and characterization of MC3T3-E1 preosteoblast subclones with distinct in vitro and in vivo differentiation/mineralization potential. J. Bone Miner. Res. 14, 893–903. doi: 10.1359/jbmr.1999.14.6.893
Wang, N., Rumney, R. M., Yang, L., Robaye, B., Boeynaems, J. M., Skerry, T. M., et al. (2013). The P2Y13 receptor regulates extracellular ATP metabolism and the osteogenic response to mechanical loading. J. Bone Miner. Res. 28, 1446–1456. doi: 10.1002/jbmr.1877
Weidema, A. F., Barbera, J., Dixon, S. J., and Sims, S. M. (1997). Extracellular nucleotides activate non-selective cation and Ca2+-dependent K+ channels in rat osteoclasts. J. Physiol. 503(Pt 2), 303–315. doi: 10.1111/j.1469-7793.1997.303bh.x
White, P. J., Webb, T. E., and Boarder, M. R. (2003). Characterization of a Ca2+ response to both UTP and ATP at human P2Y11 receptors: evidence for agonist-specific signaling. Mol. Pharmacol. 63, 1356–1363. doi: 10.1124/mol.63.6.1356
Wildman, S. S., Unwin, R. J., and King, B. F. (2003). Extended pharmacological profiles of rat P2Y2 and rat P2Y4 receptors and their sensitivity to extracellular H+ and Zn2+ ions. Br. J. Pharmacol. 140, 1177–1186. doi: 10.1038/sj.bjp.0705544
Keywords: ATP, heterologous desensitization, Hill equation, modeling, osteoblast, P2 receptor
Citation: Xing S, Grol MW, Grutter PH, Dixon SJ and Komarova SV (2016) Modeling Interactions among Individual P2 Receptors to Explain Complex Response Patterns over a Wide Range of ATP Concentrations. Front. Physiol. 7:294. doi: 10.3389/fphys.2016.00294
Received: 11 April 2016; Accepted: 27 June 2016;
Published: 13 July 2016.
Edited by:
Jean-Marc Schwartz, University of Manchester, UKReviewed by:
Ranjan K. Dash, Medical College of Wisconsin, USAEdgar J. Paredes-Gamero, Universidade Federal de São Paulo, Brazil
Copyright © 2016 Xing, Grol, Grutter, Dixon and Komarova. This is an open-access article distributed under the terms of the Creative Commons Attribution License (CC BY). The use, distribution or reproduction in other forums is permitted, provided the original author(s) or licensor are credited and that the original publication in this journal is cited, in accordance with accepted academic practice. No use, distribution or reproduction is permitted which does not comply with these terms.
*Correspondence: Svetlana V. Komarova, svetlana.komarova@mcgill.ca
†Present Address: Matthew W. Grol, Department of Molecular and Human Genetics, Baylor College of Medicine, Houston, TX, USA