 Guido Gambara1,2
 Michele Salanova1,2
 Stefano Ciciliot3,4
 Sandra Furlan5Martina Gutsmann1,2Gudrun Schiffl1,2Ute Ungethuem6
 Pompeo Volpe7Hanns-Christian Gunga8
 Dieter Blottner1,2*
- 1Center of Space Medicine Berlin, Charité Universitätsmedizin Berlin, Berlin, Germany
- 2Institute of Anatomy, Charité Universitätsmedizin Berlin, Berlin, Germany
- 3Venetian Institute of Molecular Medicine, University of Padova, Padova, Italy
- 4Department of Medicine, University of Padova, Padova, Italy
- 5Institute of Neuroscience Consiglio Nazionale Delle Ricerche, Padova, Italy
- 6Laboratory of Functional Genomics, Charité Universitätsmedizin Berlin, Berlin, Germany
- 7Dipartimento di Scienze Biomediche, University of Padova, Padova, Italy
- 8Department for Physiology and Centre for Space Medicine, Charité Universitätsmedizin Berlin, Berlin, Germany
Microgravity as well as chronic muscle disuse are two causes of low back pain originated at least in part from paraspinal muscle deconditioning. At present no study investigated the complexity of the molecular changes in human or mouse paraspinal muscles exposed to microgravity. The aim of this study was to evaluate longissimus dorsi adaptation to microgravity at both morphological and global gene expression level. C57BL/N6 male mice were flown aboard the BION-M1 biosatellite for 30 days (BF) or housed in a replicate flight habitat on ground (BG). Myofiber cross sectional area and myosin heavy chain subtype patterns were respectively not or slightly altered in longissimus dorsi of BF mice. Global gene expression analysis identified 89 transcripts differentially regulated in longissimus dorsi of BF vs. BG mice. Microgravity-induced gene expression changes of lipocalin 2 (Lcn2), sestrin 1(Sesn1), phosphatidylinositol 3-kinase, regulatory subunit polypeptide 1 (p85 alpha) (Pik3r1), v-maf musculoaponeurotic fibrosarcoma oncogene family protein B (Mafb), protein kinase C delta (Prkcd), Muscle Atrophy F-box (MAFbx/Atrogin-1/Fbxo32), and Muscle RING Finger 1 (MuRF-1) were further validated by real time qPCR analysis. In conclusion, our study highlighted the regulation of transcripts mainly linked to insulin sensitivity and metabolism in longissimus dorsi following 30 days of microgravity exposure. The apparent absence of robust signs of back muscle atrophy in space-flown mice, despite the overexpression of Atrogin-1 and MuRF-1, opens new questions on the possible role of microgravity-sensitive genes in the regulation of peripheral insulin resistance following unloading and its consequences on paraspinal skeletal muscle physiology.
Introduction
Low back pain is a common concern for crew members in short or long term duration space flight. A complete retrospective study by Kerstman and co-workers showed that among 772 astronauts of the U.S space program, 382 were positive to low back pain (LBP), also called space adaptation back pain (SABP) (Kerstman et al., 2012). Back pain onset in the major part of the analyzed cases was reported during the first days of space flight (day 1–12; Wing et al., 1991). The pathophysiology of microgravity induced back pain has been previously investigated and it is likely to be discogenic and somatic. Microgravity abolishes the physiological loads of the spine with a consequent increase of body-length determined essentially by an intervertebral disk (IVD) swelling and an adaptation of the thoracic and lumbar spine curvature. Consequently the disk expansion can stimulate type IV mechanoreceptors contributing to lumbar back pain onset (Sayson and Hargens, 2008; Sayson et al., 2013).
Spinal stability in response to the gravity load is maintained through a stabilizing system assembled by a passive component (vertebrae, disks, and ligaments), an active component (muscle and tendons), and the nervous system. In this view, paraspinal muscles and tendons generate force required for the stability of the spine. The impairment of any component of this stabilizing system can induce spine instability, consequentially generating back pain (Panjabi, 1992a,b). The lack of gravity forces in the microgravity environment unavoidably impairs the muscle involved in posture and stability both at structural and functional level, potentially contributing directly, or indirectly to the onset of back pain. The intensity of SABP is usually mild or moderated, but it could also impact the activity of astronauts in space missions, increasing the risk of musculoskeletal injury, or other traumas (Scheuring et al., 2009). Moreover, it has also been shown that the risk of IVD herniation is increased in astronauts, particularly within the first year after landing, indicating the potentially risky effect of reloading after microgravity exposure and suggesting the application of specific behavioral/training protocols for re-adaptation to gravity in crew members in spaceflight (Johnston et al., 2010; Belavy et al., 2016). Therefore, further efforts are needed to better understand the effect of microgravity on spine and paraspinal muscles and to design effective new countermeasures able to prevent paraspinal myofascial and neuromuscular deconditioning.
Only few investigations were performed so far on the effect of microgravity on paraspinal skeletal muscles. LeBlanc et al. (1995, 2000) investigated the effect of spaceflight on different muscles of shuttle/Mir crew members, concluding that both short term (8 and 17-days) and medium term (16–28 weeks) flights significantly reduced the intrinsic back muscle volume. Recently, the functional cross sectional area of lumbar paraspinal muscle has been found significantly reduced in one astronaut following 6-months exposure to microgravity (Hides et al., 2016). Moreover, there is even less evidence about the effect of microgravity on the gene or protein expression in back muscle. For example, 14-days spaceflight reduced the number of type I muscle fibers, while the expression of 70 kDa heat shock protein, t complex polypeptide 1 and other mitochondrial proteins was upregulated in paraspinal rat muscle. On the other hand, myocyte-specific enhancing factor 2C and aldolase resulted downregulated following spaceflight (Yamakuchi et al., 2000). Recently, the E3-ligase MuRF-1 was found to be increased in longissimus dorsi of mice exposed to microgravity for 30 days (Mirzoev et al., 2014).
In 2013 male mice were flown onboard of the Russian BION-M1 biosatellite to evaluate the effect of 30 days microgravity exposure on different bio-parameters in vivo and in vitro. Ogneva I.V. and co-worker investigated changes in the cortical cytoskeleton structure in skeletal muscle of the BION-M1 flown mice, showing significant alteration in the content of alpha-actinin-1 and beta-actin respectively in soleus and tibialis anterior muscles (Ogneva et al., 2014). Among the BION-M1-based studies, it has been also observed a fiber type shift from slow to fast and a decrement of titin and nebulin proteins in gastrocnemius and tibialis anterior of flown mice (Ulanova et al., 2015).
The present study provides for the first time the global gene expression profile of longissimus dorsi in mice exposed to microgravity, which is central in further understanding of the structural, molecular and metabolic mechanism regulating vertebrate paraspinal muscle adaptation to spaceflight.
Materials and Methods
Ethical Approval
All procedures including animal were performed in agreement with the European Convention for the Protection of Vertebrate Animals used for Experimental and Other Scientific Purposes (Strasbourg, 18.03.1986). Institutional Animal Care and Use Committee (IACUC) of MSU Institute of Mitoengineering (Protocol 35, 1 November, 2012) and Biomedical Ethics Commission of Institute for Biomedical Problems (IBMP), Moscow (protocol 319, 4 April, 2013) approved the study protocol related to the BION-M1 mission.
Animals
C57BL/N6 male mice (22–25 g) were obtained from the Animal Breeding Facility Branch of Shemyakin & Ovchinnikov Institute of Bioorganic Chemistry, Russia. Mice were transported to the animal facility of Moscow State University (Institute of Mitoengineering) for training and selection and 19–20 weeks old mice were used in all the experiments. In detail, mice were randomly divided in 3 groups: BION Flown (BF), mice to be flown aboard the BION-M1 biosatellite exposed for 30 days to microgravity, BION Ground (BG) mice housed for 30 days in the same biosatellite habitat on ground, and Flight Control (FC) mice housed in the animal facility during the duration of the spaceflight.
Sample Preparation and Transportation
Mouse skeletal muscle tissue sampling of all the experimental groups (longissimus dorsi and tongue) and freezing was performed by our Russian partners on site (IMBP, Moscow, Russia, contract # Bion-M1/2013 between RF SRC-IMBP and the Charité Berlin, Germany). In particular post-flight tissue sampling was done within 12–14 h at the IMBP after landing in Kazakhstan. All frozen samples were delivered deeply frozen in dry ice and further processed in our laboratory.
Immunohistochemistry and Morphological Analysis
Cryosections (8 μm thickness) of mouse longissimus dorsi (n = 2) were cut with a Leica cryostat (CM 1850, Leica Microsystems, Bensheim, Germany), mounted on charged slides, stored frozen at −80°C. Immunofluorescence with anti-MyHC isoform monoclonal antibodies were performed as previously described (Gambara et al., 2017): BA-D5 that recognizes type 1 MyHC isoform; SC-71 for type 2A MyHC isoform; BF-F3, for type 2B MyHC isoform (DSHB, Developmental Studies Hybridoma Bank, University of Iowa, Iowa City, IA). The sections were stained also using an anti-dystrophin antibody (Santa Cruz Biotechnology, Santa Cruz, CA) to visualize myofiber membranes. As secondary antibody, goat anti rabbit Alexa-635 and goat anti-mouse Alexa-555, goat anti-mouse Alexa-488 and goat anti-mouse Alexa 405-conjugated secondary antibody diluted to a final concentration of 1 μg/ml were used. For mouse-derived monoclonal primary and secondary antibodies, the MOM Ig blocking reagent (Vector Laboratories, Burlingame, CA, USA) was used to block mouse IgG background. Immunofluorescence were analyzed with an epifluorescence microscope (Axioplan; Zeiss, Oberkochen, Germany) equipped with a Cool Snap digital camera (Visitron Systems GmbH, Puchheim, Germany) and with 4-channel laser confocal microscope (TCS SP-8 with supersensitive HyD SP GaAsP detectors, Leica Microsystems, Germany). Digitized images were acquired with MetaVue software (Meta Series 7.5.6; system ID: 33693; Molecular Devices, Sunnyvale, CA, USA) and LAS X SP8 control software (Leica). Cross-sectional area (CSA) of the different myofiber types was semi-automatically measured by means of ImageJ 1.45 g (NIH, freeware imaging software).
RNA Extraction and Sample Target Preparation
Total RNA was isolated from mouse longissimus dorsi (n = 5 for each group: BF, BG, and FC) and tongue (n = 3 for BF and BG; n = 2 for FC) muscles of each experimental group (BF, BG, and FC) by means of RNeasy micro Kit (Qiagen, Hilden, Germany). Frozen tissue samples were pulverized in liquid nitrogen and lysates were prepared in lysis buffer. Tissue lysate was centrifuged and the supernatant was used for RNA phenol/chloroform extraction. Single-step method of RNA isolation by acid guanidinium thiocyanate-phenol-chloroform extraction was performed. The aqueous layer was mixed with an equal volume of 70% ethanol and total RNA was extracted using RNeasy spin columns according to the manufacturer's protocol. RNA integrity was checked by 2100 Bioanalyzer (Agilent technologies, PA, USA). The amplification and labeling of the RNA samples were carried out according to the manufacturer's instructions (Affymetrix, Santa Clara, CA). Briefly, total RNA was quantified by and checked by analysis on a LabChip (BioAnalyzer, AGILENT Technologies, Santa Clara, CA). The GeneChip® 3′ IVT Express Protocol is based on the Eberwine or reverse transcription method (in vitro transcription, IVT). Starting from 100 nanogram total RNA, first strand DNA was synthesized, containing a T7 promotor sequence and then converted into a double-stranded DNA. The double strand DNA serves as template in the subsequent in vitro transcription (IVT) reaction. This amplification step generates Biotin labeled complementary RNA (cRNA). After cleanup the biotin-modified RNA was fragmented by alkaline treatment. Fifteen microgram of each cRNA sample was hybridized for 16 h at 45°C to an Affymetrix GeneChip Mouse 430A 2.0 Array. Arrays were washed and stained with streptavidin-phycoerythrin solutions using a fluidics station according to the protocols recommended by the manufacturer. Finally, probe arrays were scanned at 1.56-μm resolution using the Affymetrix GeneChip System confocal scanner 3000. Affymetrix Mouse Genome 430A 2.0 Array includes 22,600 probes sets to evaluate the expression level of more than 14,000 well-characterized mouse genes.
Microarray Data Analysis and Pathway Analysis
Partek® Genomics Suite® 6.6 software was used for data analysis, applying Robust Multichip Average algorithm (RMA) for data normalization. To find differentially expressed genes, Analysis of Variance (ANOVA) was applied (p < 0.05). In the analysis of differentially regulated genes, a step up false discovery rate (FDR) of 5% was applied. Lists of differentially regulated genes included transcripts with fold changes major than 2 or minor than −2. Mouse Genome 430A 2.0 Array Probe Set Annotations was applied. Microarray data were uploaded in Gene Expression Omnibus (GEO) repository, accession number: GSE94381.
Gene ontology and pathway analysis were performed using the Functional Annotation Clustering module of DAVID v6.7 (The Database for Annotation, Visualization and Integrated Discovery). Gene enrichment were considered significant with an EASE score <0.05 (modified Fisher's exact test).
Quantitative PCR Validation
Quantitative PCR was performed by SYBR Green method from total RNA isolated from longissimus dorsi (n = 5) and tongue muscle (n = 3) of each experimental group as described above. Briefly, 400 ng of RNA were converted to cDNA by using random hexamers and SuperScript® VILO™ (Invitrogen) following the manufacturer's instructions. Specific primers for qPCR were already published (Sandona et al., 2012) or designed using Primer3 software (http://frodo.wi.mit.edu/, Whitehead Institute for Biomedical Research). Their thermodynamic specificity was determined using BLAST sequence alignment (NCBI) and vector NTI® software (Invitrogen). Oligonucleotide primers used are listed in Table S1. The reaction mix consists of 10 μl of 2x iQ SYBR Green Supermix (Bio-Rad), 0.3 pmol/μl primers, 8 ng of cDNA, and DNase/RNase-free water up to 20 μl. The PCR parameters were initial denaturation at 95°C for 30 s followed by 40 cycles of 10 s at 95°C and 30 s at the corresponding annealing temperature (55–59°C) for acquisition of fluorescence signal. A melting curve was generated by the iQ5 software (Biorad) following the end of the final cycle for each sample, by continuous monitoring the SYBR Green fluorescence throughout the temperature ramp from 65° to 99°C in 0.5 s increments. All samples were run in triplicate, in parallel for each individual muscle sample and simultaneously with RNA-negative controls. Cyclophilin A (Ppia), glyceraldehyde 3-phosphate dehydrogenase (Gapdh), pyruvate carboxylase (Pcx), and Beta-actin (Actb) were tested as candidate reference genes being the latter the most stable to normalize Ct-values by ΔCt method. Same data were obtained if Ppia, Gapdh, or Pcx were used as housekeeping controls (data not shown).
Statistics
Data were analyzed by GraphPad software and expressed as means ± SE. Statistical differences between groups were determined by unpaired t-test. Differences were considered statistically significant at the p < 0.05 level of confidence.
Results
Morphological Analysis Showed Moderate Signs of Muscle Atrophy in longissimus dorsi of Mice Exposed to 30 Days of Microgravity
To assess whether microgravity exposure induced atrophy in longissimus dorsi of spaceflown mice (BF) compared to ground controls (BG and FC), haematoxylin-eosin (H.E.), and immunofluorescence analysis were performed. H.E. staining confirmed the absence of histopathological alterations, such as central nuclei, immune cell infiltration, or myofiber degeneration, in all experimental groups (BF, BG, and FC; data not shown).
To evaluate microgravity-induced myofiber cross sectional area (CSA) changes and phenotype shift (slow-to-fast) in skeletal muscle fibers, we performed multiple immunofluorescence staining using antibodies recognizing specific myosin heavy chain isoforms (MyHC I, 2A, 2B) and the sub sarcolemma marker dystrophin. As shown in Figure 1, no changes in CSA were observed in longissimus dorsi of spaceflown mice compared to ground controls. The comparison of the frequency distribution of CSAs in longissimus dorsi revealed no differences between the experimental groups (Figure S1A). Similar results were obtained calculating myofiber minimum Feret diameter (Figure S1B). In regard to myofiber type composition, we observed an increase in the percentage (Δ%) of fast 2B fibers in only one of the space-flown mice. Given the low number of animals analyzed (n = 2) for immunohistochemistry, these results suggest that 30 days of microgravity exposure may not be sufficient to induce robust CSA changes in mouse longissimus dorsi, though the onset of the phenotypic myofiber shift in the paraspinal muscle is already detectable.
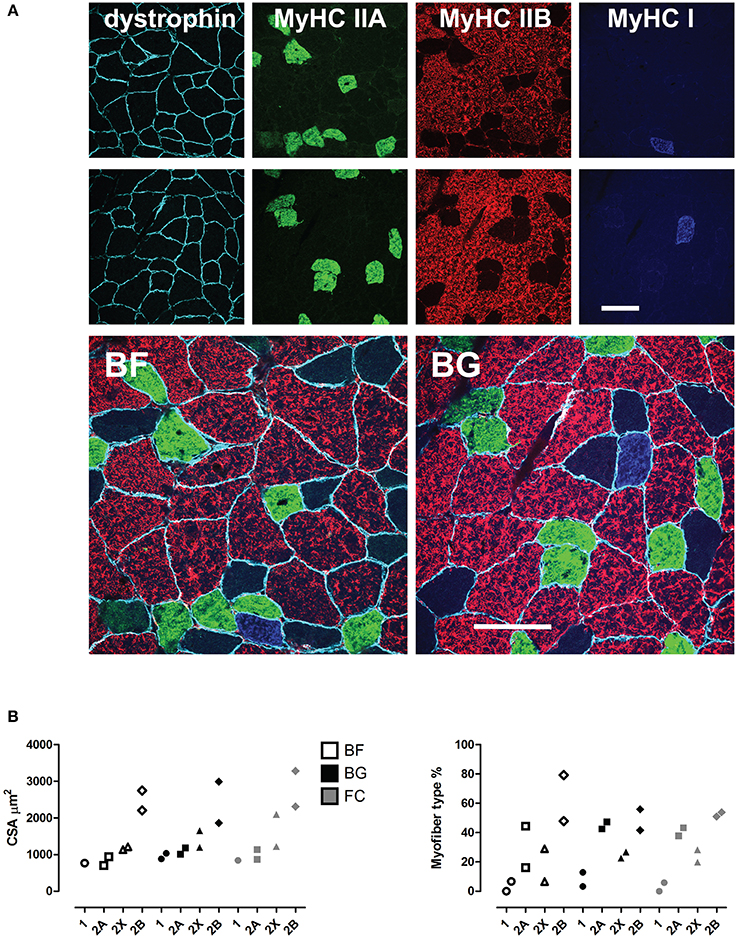
Figure 1. Morphological analysis of mouse longissimus dorsi of space flown mice. (A), Immunohistochemical analysis (upper panel), and (B), quantification of the myofiber cross sectional area (CSA, μm2) and type composition in longissimus dorsi back muscle of mice from the three experimental groups (BF, BG, and FC, each n = 2) shown as scatter plots (lower panel). Color-coded immuno-markers in (A): dystrophin = turquoise; myosin heavy chain (MyHC) isoforms: IIA, green; IIB, red; IIX, negative; IA, blue. Scale bar: 100 μm.
Microgravity-Induced Gene Expression Adaptation in longissimus dorsi
To analyse the adaptation to microgravity of the paraspinal muscle transcriptome, we performed an expression profile analysis of longissimus dorsi from space flown (BF) vs. ground control mice (BG: mice housed in the same biosatellite habitat on ground, and FC: mice housed in the animal facility). A total of 15 mouse longissimus dorsi (BF n = 5, BG n = 5, and FC n = 5) were analyzed. To identify genes differentially regulated in muscle of space flown mice, we compared the muscle transcriptome of BF vs. BG, FC vs. BG and BF vs. FC. The BF vs. BG and BF vs. FC comparisons (flown mice vs. ground controls) reflected the gene expression adaptation in skeletal muscle exposed to microgravity, while the comparison of the two ground controls (FC vs. BG) was needed to rule out possible gene expression changes originating from different housing conditions used in the present study protocol.
Affimetrix data were analyzed applying a False Discovery Rate (FDR) cut-off of 5% and a Fold Change (FC) cut-off < −2 and > 2. Venn diagram in Figure 2 shows the number of genes significantly differentially regulated in longissimus dorsi (BF vs. BG, FC vs. BG, and BF vs. FC). As expected, the higher number of differentially regulated genes were found comparing BF vs. BG (89 transcripts) and BF vs. FC (68 transcripts), indicating that microgravity exposure induced an adaptation of gene expression in longissimus dorsi of spaceflown mice (BF) compared to ground controls (BG and FC). On the other hand, the lower number of genes (33 genes) differentially regulated comparing the two ground controls (FC vs. BG), only 2 of which overlapping with transcripts found in BF vs. BG, indicated that the housing condition in the BION-M1 biosatellite on its own did not affect gene expression changes observed in muscle of flown mice compared with ground control (BG).
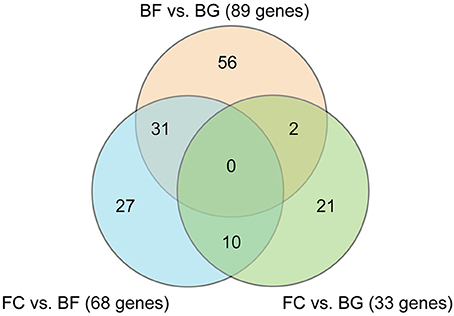
Figure 2. Venn diagram showing the number of genes differentially regulated in longissimus dorsi comparing all the different experimental groups. Venn diagram showing the number of genes differentially regulated comparing space flown (BF) with ground controls (BG and FC) in longissimus dorsi (each group n = 5). Comparisons between the three different experimental groups are shown (BF vs. BG, FC vs. BG, and BF vs. FC).
As shown in Figure 3, the two-way hierarchical clustering analysis centered on genes significantly differentially regulated in BF vs. BG revealed some similarity in the gene expression of the two ground controls (BG and FC) compared to longissimus dorsi muscles of microgravity exposed mice (BF) (Figure 3). Thus, BG and FC samples resulted in the same gene cluster arrangement.
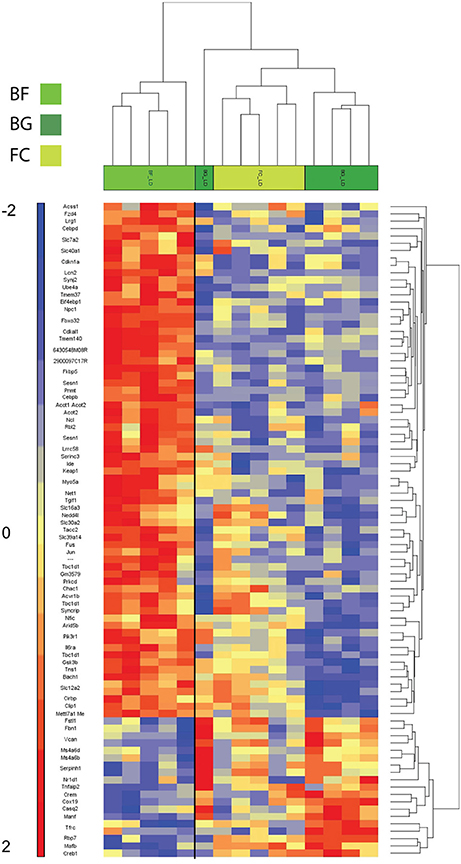
Figure 3. Heat map showing genes differentially regulated in longissimus dorsi of BION-M1 space flown mice. Two-way hierarchical clustering centered on BF vs. BG of mouse longissimus dorsi (each group n = 5). Differentially regulated genes meeting FDR < 0.05 and < −2 and > +2 fold change criteria are included in the heat map.
One major aim of this study was to identify molecular players involved in longissimus dorsi adaptation process induced by exposure to microgravity environment. Thus, we focused the present analysis only on BF vs. BG comparison. Within the complete list of 89 genes differentially regulated in BF vs. BG (Table 1), the expression of 19 genes was downregulated, while 70 genes were upregulated. Next we performed gene ontology (GO) analysis to identify genes specifically linked to biological functions or molecular pathways. Database for Annotation, Visualization and Integrated Discovery (DAVID) analysis identified genes linked to four main functional clusters (Table 2): transcription regulation, transporter activity, ErbB signaling pathway, RNA recognition motif and other genes of interest (classified as other/unknown in Table 2). All the genes included in these functional clustering were significantly and differentially regulated in BF vs. BG, while only few of such genes were differentially regulated significantly compared to the two ground controls (BG vs. FC) or with a fold change < −2 or > 2, thus confirming that the observed changes in gene expression were specifically induced by microgravity exposure (Figure 4).
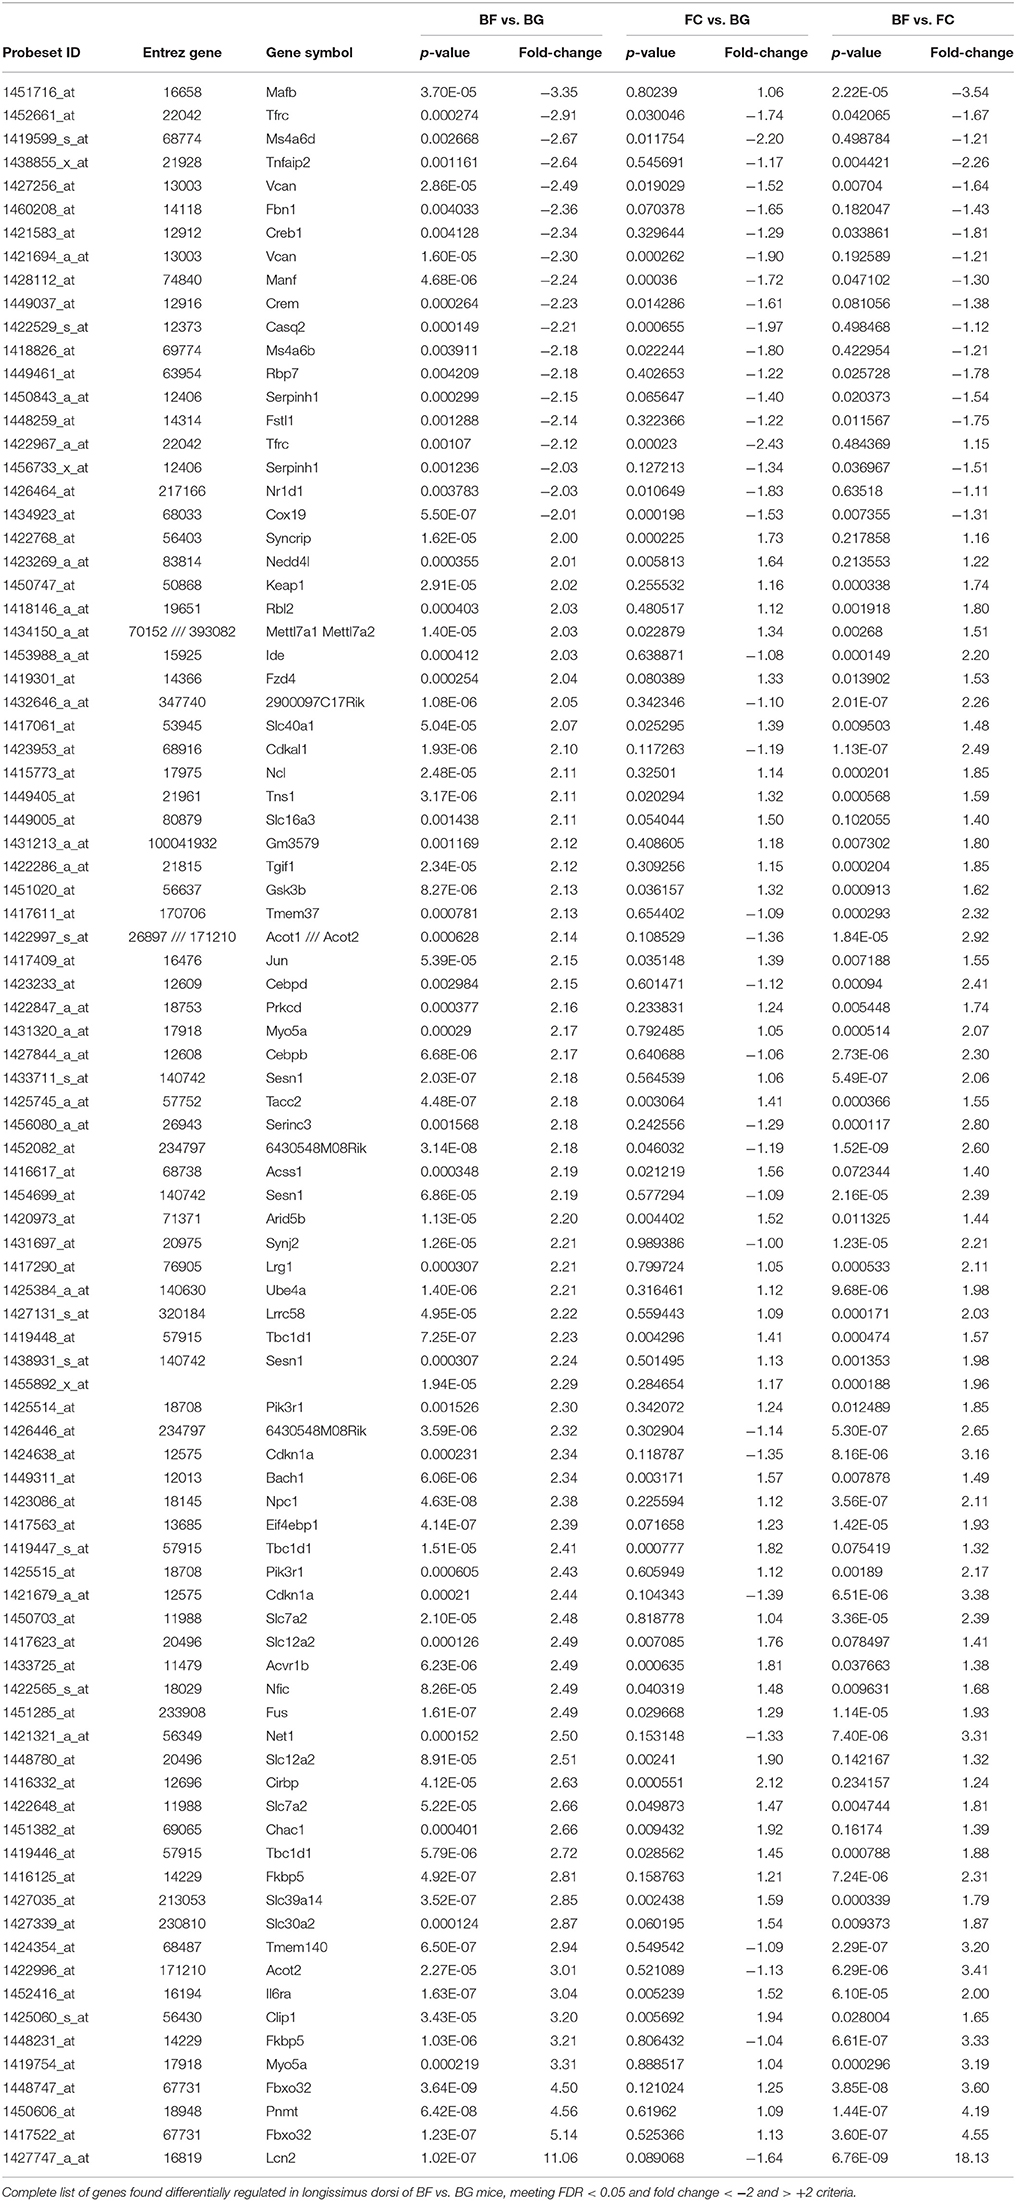
Table 1. Longissimus dorsi transcriptome adaptation to microgravity exposure.
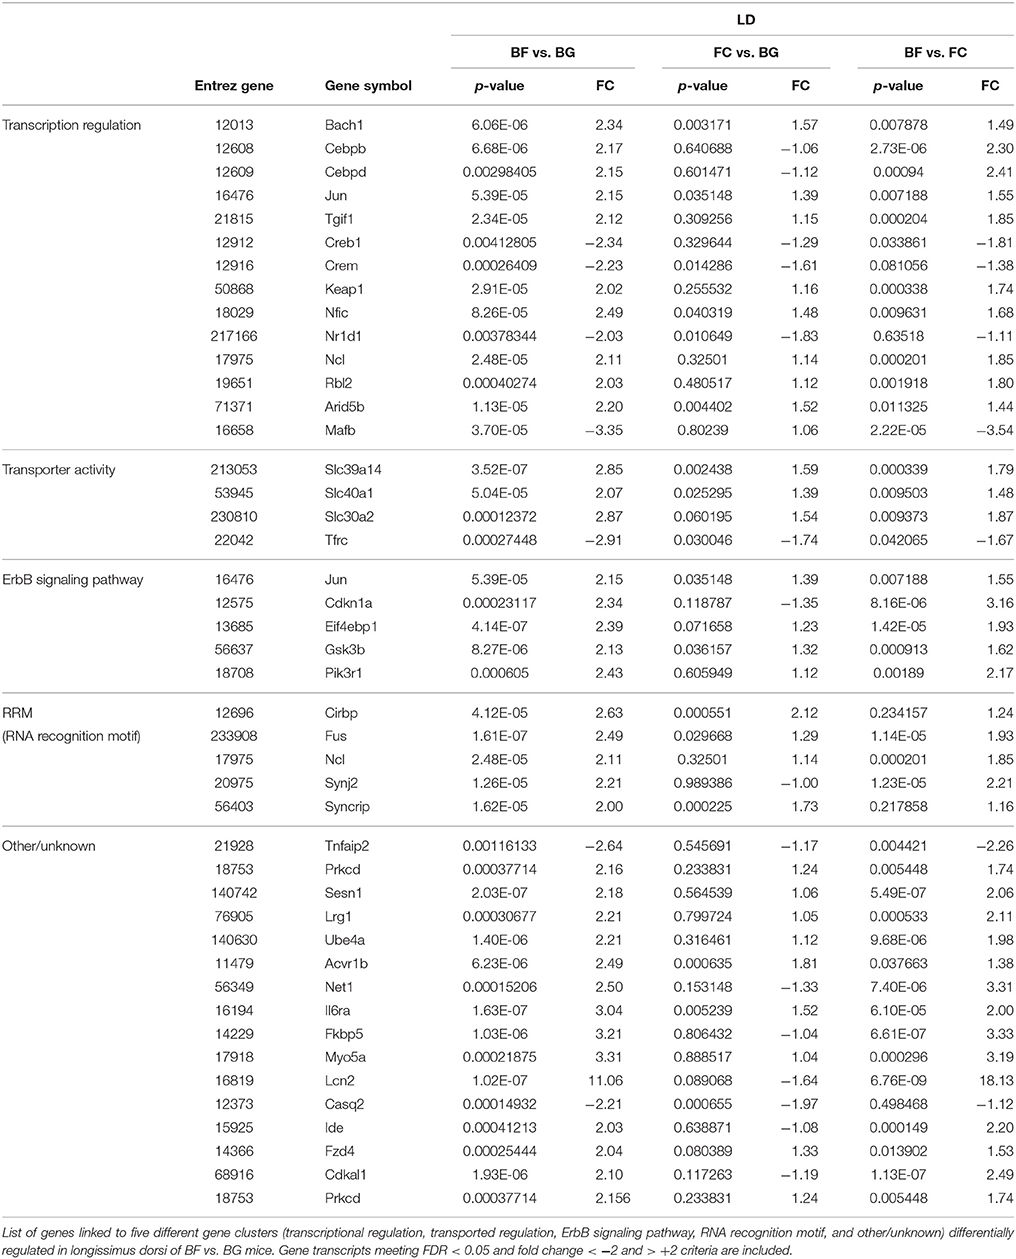
Table 2. Genes differentially regulated in longissimus dorsi of spaceflown mice linked to main functional clusters identified by DAVID.
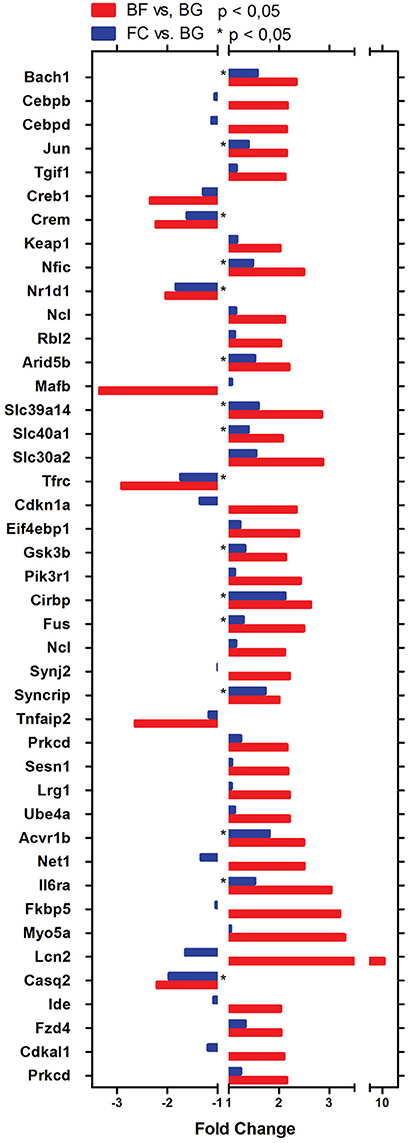
Figure 4. Genes differentially regulated in longissimus dorsi of spaceflown mice identified by DAVID analysis. Bar Chart representing genes linked to the main biological functions in BF vs. BG (red bars) and FC vs. BG (blue bars) comparison identified using DAVID analysis. All gene transcripts in BF vs. BG are significantly dysregulated (p < 0.05). For FC vs. BG transcripts significantly differentially regulated are indicated by *p < 0.05.
Real Time PCR Validation of Microgravity-Induced Gene Expression Changes in longissimus dorsi
Quantitative real time PCR (qPCR) was performed to validate gene expression changes observed in longissimus dorsi following 30 days spaceflight (n = 5 for each group: BF, BG, and FC). The choice of genes to be validated was essentially centered on their p-values, fold changes (> 2.0 or < −2.0), and the potential association with skeletal muscle pathophysiology. Due to the low amount of tissue used for RNA extraction, we evaluated only the expression of 10 genes by qPCR in flown mice (BF) compared to ground controls (BG and FC): lipocalin 2 (Lcn2), sestrin 1(Sesn1), kelch-like ECH-associated protein 1(Keap1), glycogen synthase kinase 3 beta (Gsk3b), phosphatidylinositol 3-kinase, regulatory subunit polypeptide 1 (p85 alpha) (Pik3r1), v-maf musculoaponeurotic fibrosarcoma oncogene family protein B (Mafb), synaptojanin 2 (Synj2), protein kinase C delta (Prkcd), Muscle Atrophy F-box (MAFbx/Atrogin-1/Fbxo32), and Muscle RING Finger 1 (MuRF-1). Table S1 includes the sequence of the primer used in qPCR analysis. Four housekeeping genes were selected as reference to calculate the delta Ct of the selected genes: Actb, beta actin; Ppia, cyclophilin A; Gapdh, glyceraldehyde-3-phosphate dehydrogenase and Pcx, pyruvate carboxylase. PCR data normalized using Actb confirmed that Lcn2, Sesn1, Pik3r1, Mafb, Prkcd, Atrogin-1, and MuRF-1 were differentially regulated significantly in longissimus dorsi of BF compared to BG mice (Lcn2 p = 0.0062, Sesn1 p = 0.0090, Pik3r1 p = 0.036, Mafb p = 0.0094, Prkcd p = 0.0030, Atrogin-1 p = 0.0003, and MuRF-1 p = 0.0029), confirming the reliability of the Affymetrix data analysis (Figure 5). Identical results were obtained using Gapdh, Ppia, and Pcx as housekeeping genes (Data not shown).
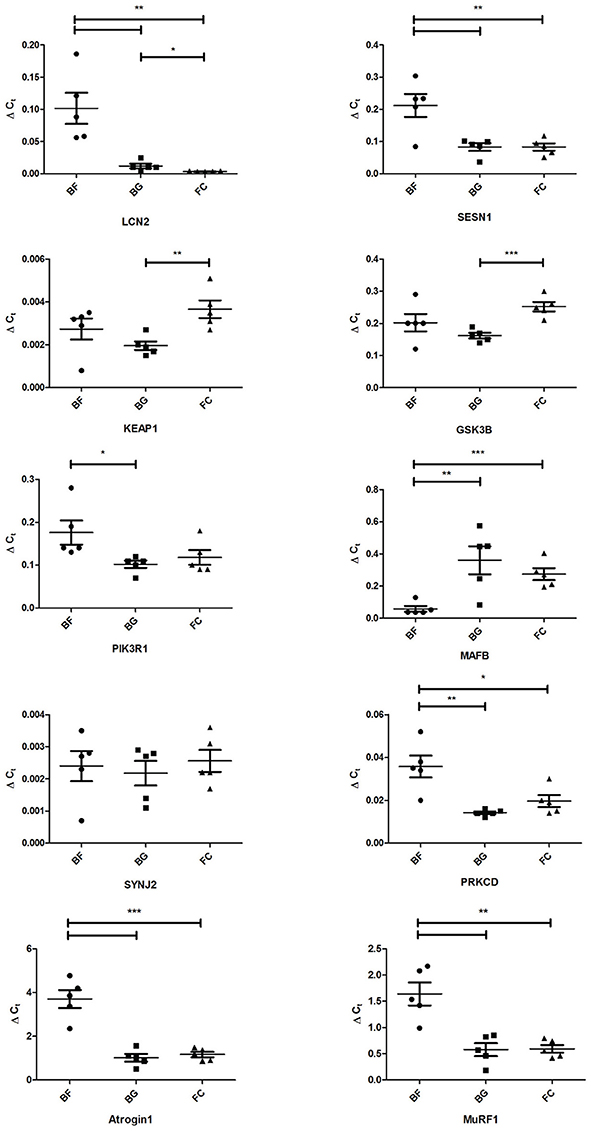
Figure 5. Real time qPCR analysis of selected genes differentially regulated in longissimus dorsi of space-flown mice compared to ground controls. Expression levels of lipocalin 2 (Lcn2), sestrin 1(Sesn1), kelch-like ECH-associated protein 1(Keap1), glycogen synthase kinase 3 beta (Gsk3b), phosphatidylinositol 3-kinase, regulatory subunit polypeptide 1 (p85 alpha) (Pik3r1), v-maf musculoaponeurotic fibrosarcoma oncogene family protein B (Mafb), synaptojanin 2 (Synj2), protein kinase C delta (Prkcd), Muscle Atrophy F-box (Atrogin-1), and Muscle RING Finger 1 (MuRF-1) were evaluated by real-time quantitative PCR in longissimus dorsi of space-flown mice (BF, n = 5) and ground controls (BG and FC, each n = 5). Graph shows ΔCt ± SEM; ***p < 0.0009, **p < 0.0095, and *p < 0.05.
Tongue Muscle as in-Flight Negative Control of Microgravity Transcriptome Adaptation
To investigate whether microgravity exposure affected gene expression also in muscles that are constantly “activity loaded” also in spaceflight, we analyzed the transcriptome of mouse tongue from spaceflown mice (BF) compared to ground control (BG). Affymetrix analysis of BF vs. BG (applying a FDR <5% and fold change < −2 and > 2 cut-off) showed that only 27 genes were differentially regulated in the tongue muscle of space-flown mice. Table S2 shows the complete list of differentially regulated genes in tongue. The two way hierarchical clustering analysis centered on genes differentially regulated in BF vs. BG showed similarity in the gene expression of the BF and FC groups (Figure 6), suggesting that in this particular non-appendicular visceral skeletal muscle gene expression regulation has a relatively low sensitivity to microgravity exposure compared to appendicular or somatic skeletal muscle in murine vertebrates.
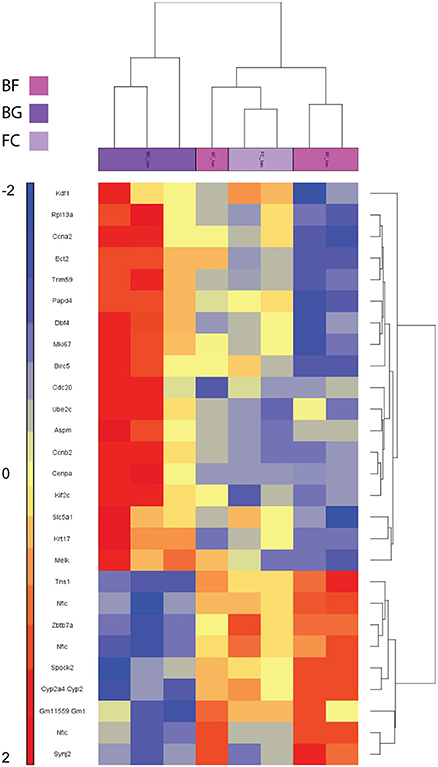
Figure 6. Heat map visualizing genes differentially regulated in the tongue of BION-M1 space flown mice. Two way hierarchical clustering centered on BF vs. BG of mouse tongue muscles (n = 3 for BF and BG; n = 2 for FC). Differentially regulated genes meeting FDR < 0.05 and fold change < −2 and > +2 criteria are included in the heat map.
Discussion
Our study investigated for the first time paraspinal muscle adaptation in 30 days space-flown mice both at morphological and gene expression level. At present, only few studies analyzed the effect of microgravity exposure on paraspinal skeletal muscle, and to our knowledge no study actually quantified the changes in either myofiber cross sectional area or fiber type composition neither in spaceflight crew member or space-flown rodent paraspinal back muscles. So far human studies on lumbar back muscle are mostly based on clinical imaging (magnetic resonance imaging) and physiological measurements (e.g., strength test). On the other hand, the effects on human paraspinal muscle deconditioned by the spaceflight analog bed rest have been already investigated to test efficacy of countermeasures able to prevent or reduce the impact of extended disuse or unloading of the spine. In a 60-days 6° head-down tilt (HDT) bed rest study, resistive exercise with or without superimposed whole body vibration reduced the whole muscle cross sectional area (CSA) loss observed in different paraspinal functional muscle groups such as lumbar multifidus (medial group), lumbar erector spinae (lateral group) and the anterior and medial hip group with the psoas (Belavy et al., 2010). Moreover, it has been recently reported that lower body negative pressure (LBNP) treadmill and flywheel significantly reduced total lumbar paraspinal muscle loss (76% represented by erector spinae) induced by 60 days of 6° HDT bed rest in women (Holt et al., 2016). Unfortunately, paraspinal back muscle biopsies, which would allow a more accurate view on disuse-induced structural and molecular tissue changes, may not be feasible from bed rest participants or even crew in Space because of two major constraints: firstly, the paraspinal back muscle shows some anatomical and functional complexity, for example subdivision into several muscular subgroups (e.g., medial deeper and lateral superficial columns), and secondly, there are obvious ethical constraints and risks of invasive biopsy sampling procedure on the back muscles of the participant's trunk staying supine for longer periods in bed rest.
However, the results reported in this study are based on the quantification of myofibers CSA and type composition of longissimus dorsi tissue samples from mice exposed to microgravity for as long as 30 days, showing that spaceflight only moderately affected the myofiber CSA and only slightly increased the amount of type 2B myofibers in longissimus dorsi of space-flown mice compared to ground controls. These results suggest that, despite elevated levels of Atrogin-1 and MuRF-1 found in muscle of space-flown mice, robust morphological changes distinctive of paraspinal muscle deconditioning are likely just to be set on in mice exposed for 30 days to microgravity. Our present data on mice partially disagree with those of Yamakuchi and co-workers, who described a “qualitative” decrease in the number and volume of type 1 MyHC positive myofibers in paraspinal rat muscle exposed to microgravity for 14 days (Yamakuchi et al., 2000). On the other hand, we expected to find some lower effects of microgravity adaptation in mouse longissimus dorsi compared to the robust changes previously observed in crewmembers after spaceflight or long term bed rest participants, considering the obvious differences in paraspinal muscle loading between bipedal humans and four-legged vertebrates on ground, and in particular during body movement adaptations of both species observed in the microgravity environment. Moreover, another possible source of discrepancy between our results and human studies might originate by the anatomical complexity of back muscles and the type of analysis performed. The major part of the human studies analyzing paraspinal muscle deconditioning focuses on imaging analysis (MRI) of functional groups of muscle in the lumbar region, such as the erector spinae (including components of different muscles such as multifidus, longissimus dorsi, iliocostalis, and spinalis dorsi (Belavy et al., 2010; Holt et al., 2016).
Though, the apparent lack of an atrophic structural phenotype in mouse longissimus dorsi (i.e., almost constant myofiber CSA with little slow-to-fast myofiber shift) was also confirmed by the global gene expression and gene ontology (GO) analysis, by which no genes linked to the sarcomere structure were found differentially regulated in space-flown mice. Surprisingly, transcripts coding for two ubiquitin ligases, Atrogin-1 and MuRF-1, involved in skeletal muscle atrophy (Bodine et al., 2001) were upregulated in space-flown mice compared with ground controls. Since Atrogin-1 and MuRF-1 expression levels have never been previously investigated in longissimus dorsi following unloading, different mechanisms could explain the overexpression of these two ubiquitin ligases without robust signs of muscle atrophy. For example, it is known that in rodent skeletal muscles the over-expression of transcripts coding for Atrogin-1 and MuRF-1 occurs relatively early following unloading and decreases back to baseline level within 15 days (Bodine et al., 2001; Bodine and Baehr, 2014). Thus, these data suggest that the expression of these two genes, usually considered an early event in the onset of the atrophic phenotype, is instead a relatively late event (30 days) in longissimus dorsi of space flown mice. Another possible explanation could involve a muscle specific mechanism regulating the translation of both transcripts. For example, it has been previously shown that miR-23 a suppresses the translation of both MAFbx/atrogin-1 and MuRF-1 in a 3_-UTR-dependent manner (Wada et al., 2011). Unfortunately, in the absence of time course experiments needed to evaluate Atrogin-1 and MuRF-1 expression in longissimus dorsi of space flown mice and the onset of back muscle atrophy, we can only speculate about the gap between the expression of these two genes and the translation of the corresponding transcripts. Further investigations are obviously needed to understand the role of Atrogin-1 and MuRF-1 in the regulation of the phenotype in mouse paraspinal muscle.
We recently investigated the morphological changes induced by 30 days microgravity in mouse soleus and extensor digitorum longus (EDL) (Gambara et al., 2017): reduced CSAs were observed in type I, IIa, IIb, and IIx myofibers in soleus of mice flown aboard of the biosatellite BION-M1 whereas no changes were observed in EDL, thus largely confirming the notion that soleus, the postural slow type muscle of lower murine limb, was highly responsive to microgravity unloading as compared to EDL, the fast type murine muscle. Moreover, the analysis of myofiber phenotype showed a myofiber type shift from slow to fast mainly in soleus muscle of flown mice (Gambara et al., 2017). Since the myofiber type composition of mouse longissimus dorsi is prevalently fast, as in the case of EDL, minor atrophying effect of microgravity on this specific back muscle was expected.
Among the genes linked to the transcriptional regulation that we found differentially regulated after microgravity exposure, Mafb (v-maf musculoaponeurotic fibrosarcoma oncogene family protein B) was found to be highly downregulated. Mafb (named also as Kreisler or Krml) is known to be essential for the hindbrain development and defects in the organization of facial motor neurons were found in Mafb mutant mice (McKay et al., 1997). More recently it has been demonstrated that Mafb has a pivotal role in the development of Duane syndrome, a congenital disorder generated by an aberrant cranial innervation (Park et al., 2016). To our knowledge, a role for Mafb in paraspinal muscle physiology has never been described yet, thus further investigation is needed to elucidate the function of Mafb in this particular context.
Focusing mainly on genes that were validated by real time qPCR, almost all these genes are directly or indirectly linked to insulin signaling and sensitivity in skeletal muscle, highlighting the impact of spaceflight on glucose metabolism in the longissimus dorsi back muscle. It is well-known that both spaceflight and bed rest induce a set of subclinical diabetogenic effects in humans, such as insulin resistance, decreased glucose tolerance, increased glucose level in plasma and reduced insulin (Tobin et al., 2002). Recently Rudrappa and co-workers reviewed the potential reciprocal influence of insulin resistance and muscle disuse atrophy (Rudrappa et al., 2016), concluding that further studies are needed to better understand the causative role of insulin resistance in determining the atrophic phenotype in skeletal muscle.
Among the genes differentially regulated in longissimus dorsi of spaceflown mice, Lipocalin-2 transcripts (Lcn2) were the most upregulated (Fold change = 11.06, BF vs. BG comparison) found in our study. This gene encodes for a small secreted protein that it is known to be involved in the onset of aging and obesity-induced systemic insulin resistance (Law et al., 2010). However, it has been shown that the phosphorylation of insulin receptor and Akt, and insulin-stimulated glucose uptake were not significantly altered in skeletal muscle of Lcn2 knockout mice compared to wild-type mice. These results may be in part explained by the low basal level of Lcn2 expression in murine skeletal muscle (Yan et al., 2007). On the other hand, Guo and co-workers showed opposite results, that is Lcn2 deficiency potentiated diet-induced insulin resistance in mice (Guo et al., 2010). Interestingly, Lcn2 protein level was found to be increased in sera of individuals following bed rest (Rucci et al., 2015), therefore based on our results we may speculate that Lcn2 protein could be at least in part secreted in a soluble form in blood by skeletal muscle tissue similar to the known myokines.
In our study, we also identified another well-known regulator of cell metabolism, Sestrin 1 (Sesn1), that we found to be upregulated in longissimus dorsi of spaceflown mice compared to ground controls. Sestrins are a family of stress activated proteins involved in the metabolism of reactive oxygen species (ROS), in the regulation of autophagy, and in insulin signaling. More in detail, Sestrins increase AMPK activation, consequentially inhibiting mTORC1 activity, known to induce insulin resistance through the inhibition insulin receptor substrates and the consequent reduction of phosphoinositide-3-kinase (PI3K)/Akt signaling (Lee et al., 2013). Moreover, it has been shown that only Sestrin 3 (Sesn 3) was upregulated in vastus lateralis of type 2 diabetes patients compared to healthy individuals but its role is more likely to be linked to skeletal muscle differentiation than regulating glucose and lipid metabolism. On the other hand, hydrogen peroxide increased only mRNA level of Sesn 1 and 2 in human myotubes, suggesting that these two isoforms are specifically involved in the response to oxidative stress in skeletal muscle (Nascimento et al., 2013). With regard to p85 alpha PI3K regulatory subunit (Pik3r1), we found upregulation of this transcript in longissimus dorsi of the spaceflown mice. This result agrees with the upregulation of Pik3r1 found in gastrocnemius of mice exposed to microgravity for 11 days (Allen et al., 2009). PI3K is known to be crucial for insulin-induced glucose transport (Hara et al., 1994) and it has been shown that in bed rest, for example, the glucose transporter GLUT4, Akt signaling, and Glycogen synthase activity are equally reduced (Bienso et al., 2012). Interestingly, Terauchi and co-workers showed an increased insulin sensitivity and increase in glucose transport in skeletal muscle of Pik3r1−/− mice due to the compensatory upregulation of the other two isoforms p55 and p50 alpha (Terauchi et al., 1999). To better understand the role of Pik3r1 in the onset or prevention of insulin resistance in disused skeletal muscle, the expression of all Pik3r1 isoforms should be further investigated in microgravity or other experimental models of unloading.
In the current study, we also found that protein kinase C delta (Prkcd) transcript were significantly upregulated in longissimus dorsi of spaceflown mice. This result supports the crucial role of Prkcd in skeletal muscle insulin sensitivity. In fact, an increase in the Prkcd levels related to the aging has been previously described, and the muscle-specific Prkcd knockout improved aging-related decline of glucose tolerance and insulin resistance (Li et al., 2015).
Interestingly, two of the validated genes differentially regulated in longissimus dorsi of space-flown mice and linked to insulin resistance, Lcn2 and Sesn1, and another gene coding for Mafb were previously identified as overexpressed genes in both soleus and EDL of mice flown for 30 days onboard the BION-M1 biosatellite (Gambara et al., 2017), suggesting that the regulation of only few genes following microgravity exposure may not be strictly muscle specific. On the other hand, microarray analysis of space-flown murine soleus and EDL compared to ground controls showed that the larger number of differentially regulated genes was highly muscle specific: only 24 differentially regulated genes were in common between the two functionally different muscles (Gambara et al., 2017). In the present study the tongue muscle was used as reference internal control of microgravity exposure as the tongue represents a visceral skeletal muscle with obviously constant activity load. A typical example of tongue loading is performed during daily nutritional activities in microgravity (i.e., water and food uptake) as recently proposed for mice masticatory muscle (masseter, MA). MA insensitivity to microgravity was explained by the protective effect against mass loss due to continuing chewing-induced loading following 13 days spaceflight onboard the STS-135 Space shuttle (Philippou et al., 2015). Further studies are however needed to show if tongue muscle also shares similar atrophy mechanisms than somatic/appendicular skeletal muscle following long-duration spaceflight.
In summary, a number of genes linked to insulin sensitivity and metabolism of skeletal muscle were found significantly dysregulated in the mouse longissimus dorsi back muscle following 30 days of microgravity exposure compared to ground control animals. The apparent absence of robust signs of muscle atrophy in paraspinal muscles following 30 days of microgravity opens new questions on the potential roles of these genes in the onset of peripheral insulin resistance following unloading and its consequences on vertebrate skeletal muscle structure and function. Finally, in the present study microgravity-induced transcriptional adaptation of mouse paraspinal muscles has been investigated by means of global gene expression profiling in space-flown mice, providing the basis for a deeper understanding of the complex mechanisms of molecular adaptation to microgravity in vertebrate back muscles as potential cause of lower back pain and spine destabilization processes following whole body unloading conditions in different clinical settings, bed rest, and spaceflight.
Author Contributions
Conceptualization: DB and MS; Data curation: GG, MS, and UU; Formal analysis: GG, UU, and SC; Funding acquisition: DB; Investigation: MS, DB, and GG; Methodology: GS, MG, UU, and SF; Project administration: DB and MS; Resources: DB; Supervision: HG; Validation: UU and SF; Writing—original draft: GG and DB; Writing—review and editing: GG and MS, DB, and PV.
Funding
This work was supported from grants of the Department of Economics and Technology of the German Government (BMWi) through the German AeroSpace Board, Deutsches Zentrum für Luft- und Raumfahrt (DLR), e.V. Bonn, Germany (grant # 50 WB821, 1121, and 1421 to DB). The funders had no role in study design, data collection and analysis, decision to publish, or preparation of the manuscript.
Conflict of Interest Statement
The authors declare that the research was conducted in the absence of any commercial or financial relationships that could be construed as a potential conflict of interest.
Acknowledgments
The BION-M1 mission was organized in 2013 by the Russian Space Agency (Roskosmos) in cooperation with the Institute of Biomedial Problems (IMBP); Moscow, Russia. We herewith acknowledge the operational support of the IMBP, in particular Professor B. Shenkman and his group, Moscow, Russia, for expert tissue dissection, sample freezing and tissue sharing between the IMBP and the Charité Berlin.
Supplementary Material
The Supplementary Material for this article can be found online at: http://journal.frontiersin.org/article/10.3389/fphys.2017.00279/full#supplementary-material
Figure S1. CSA heterogeneity and Myofiber minimum Feret diameter. (A) comparison of the frequency distribution of CSAs in longissimus dorsi of the three experimental groups (Figure S1). (B) Quantification of the minimum Feret diameter in longissimus dorsi of mice from the three experimental groups (BF, BG, and FC, each n = 2) shown as scatter plots.
Table S1. Quantitative PCR primers and conditions. HK, Reference genes; bp, expected product size; T°, annealing temperature. * Sandona et al. (2012) Adaptation of Mouse Skeletal Muscle to Long-Term Microgravity in the MDS Mission. PLoS ONE 7(3):e33232.
Table S2. Microgravity-induced gene expression changes in the tongue muscle of space -flown vs. ground control mice. List of genes differentially regulated in the tongue muscle (internal reference control) of BF vs. BG mice, meeting FDR < 0.05 and fold change < −2 and > +2 criteria. The comparisons between all the three experimental groups are shown.
References
Allen, D. L., Bandstra, E. R., Harrison, B. C., Thorng, S., Stodieck, L. S., Kostenuik, P. J., et al. (2009). Effects of spaceflight on murine skeletal muscle gene expression. J. Appl. Physiol. (1985) 106, 582–595. doi: 10.1152/japplphysiol.90780.2008
Belavy, D. L., Adams, M., Brisby, H., Cagnie, B., Danneels, L., Fairbank, J., et al. (2016). Disc herniations in astronauts: what causes them, and what does it tell us about herniation on earth? Eur. Spine J. 25, 144–154. doi: 10.1007/s00586-015-3917-y
Belavy, D. L., Armbrecht, G., Gast, U., Richardson, C. A., Hides, J. A., and Felsenberg, D. (2010). Countermeasures against lumbar spine deconditioning in prolonged bed rest: resistive exercise with and without whole body vibration. J. Appl. Physiol. (1985) 109, 1801–1811. doi: 10.1152/japplphysiol.00707.2010
Bienso, R. S., Ringholm, S., Kiilerich, K., Aachmann-Andersen, N. J., Krogh-Madsen, R., Guerra, B., et al. (2012). GLUT4 and glycogen synthase are key players in bed rest-induced insulin resistance. Diabetes 61, 1090–1099. doi: 10.2337/db11-0884
Bodine, S. C., and Baehr, L. M. (2014). Skeletal muscle atrophy and the E3 ubiquitin ligases MuRF1 and MAFbx/atrogin-1. Am. J. Physiol. Endocrinol. Metab. 307, E469–E484. doi: 10.1152/ajpendo.00204.2014
Bodine, S. C., Latres, E., Baumhueter, S., Lai, V. K., Nunez, L., Clarke, B. A., et al. (2001). Identification of ubiquitin ligases required for skeletal muscle atrophy. Science 294, 1704–1708. doi: 10.1126/science.1065874
Gambara, G., Salanova, M., Ciciliot, S., Furlan, S., Gutsmann, M., Schiffl, G., et al. (2017). Gene expression profiling in slow-type calf soleus muscle of 30 days space-flown mice. PLoS ONE 12:e0169314. doi: 10.1371/journal.pone.0169314
Guo, H., Jin, D., Zhang, Y., Wright, W., Bazuine, M., Brockman, D. A., et al. (2010). Lipocalin-2 deficiency impairs thermogenesis and potentiates diet-induced insulin resistance in mice. Diabetes 59, 1376–1385. doi: 10.2337/db09-1735
Hara, K., Yonezawa, K., Sakaue, H., Ando, A., Kotani, K., Kitamura, T., et al. (1994). 1-Phosphatidylinositol 3-kinase activity is required for insulin-stimulated glucose transport but not for RAS activation in CHO cells. Proc. Natl. Acad. Sci. U.S.A. 91, 7415–7419.
Hides, J. A., Lambrecht, G., Stanton, W. R., and Damann, V. (2016). Changes in multifidus and abdominal muscle size in response to microgravity: possible implications for low back pain research. Eur. Spine J. 25(Suppl. 1), 175–182. doi: 10.1007/s00586-015-4311-5
Holt, J. A., Macias, B. R., Schneider, S. M., Watenpaugh, D. E., Lee, S. M., Chang, D. G., et al. (2016). WISE 2005: aerobic and resistive countermeasures prevent paraspinal muscle deconditioning during 60-day bed rest in women. J. Appl. Physiol. (1985) 120, 1215–1222. doi: 10.1152/japplphysiol.00532.2015
Johnston, S. L., Campbell, M. R., Scheuring, R., and Feiveson, A. H. (2010). Risk of herniated nucleus pulposus among U.S. astronauts. Aviat. Space Environ. Med. 81, 566–574. doi: 10.3357/ASEM.2427.2010
Kerstman, E. L., Scheuring, R. A., Barnes, M. G., DeKorse, T. B., and Saile, L. G. (2012). Space adaptation back pain: a retrospective study. Aviat. Space Environ. Med. 83, 2–7. doi: 10.3357/ASEM.2876.2012
Law, I. K., Xu, A., Lam, K. S., Berger, T., Mak, T. W., Vanhoutte, P. M., et al. (2010). Lipocalin-2 deficiency attenuates insulin resistance associated with aging and obesity. Diabetes 59, 872–882. doi: 10.2337/db09-1541
LeBlanc, A., Lin, C., Shackelford, L., Sinitsyn, V., Evans, H., Belichenko, O., et al. (2000). Muscle volume, MRI relaxation times (T2), and body composition after spaceflight. J. Appl. Physiol. (1985) 89, 2158–2164.
LeBlanc, A., Rowe, R., Schneider, V., Evans, H., and Hedrick, T. (1995). Regional muscle loss after short duration spaceflight. Aviat. Space Environ. Med. 66, 1151–1154.
Lee, J. H., Budanov, A. V., and Karin, M. (2013). Sestrins orchestrate cellular metabolism to attenuate aging. Cell Metab. 18, 792–801. doi: 10.1016/j.cmet.2013.08.018
Li, M., Vienberg, S. G., Bezy, O., O'Neill, B. T., and Kahn, C. R. (2015). Role of PKCdelta in insulin sensitivity and skeletal muscle metabolism. Diabetes 64, 4023–4032. doi: 10.2337/db14-1891
McKay, I. J., Lewis, J., and Lumsden, A. (1997). Organization and development of facial motor neurons in the kreisler mutant mouse. Eur. J. Neurosci. 9, 1499–1506.
Mirzoev, T. M., Vil'chinskaia, N. A., Lomonosova Iu, N., Nemirovskaia, T. L., and Shenkman, B. S. (2014). [Effect of 30-day space flight and subsequent readaptation on the signaling processes in m. longissimus dorsi of mice]. Aviakosm. Ekolog. Med. 48, 12–15.
Nascimento, E. B., Osler, M. E., and Zierath, J. R. (2013). Sestrin 3 regulation in type 2 diabetic patients and its influence on metabolism and differentiation in skeletal muscle. Am. J. Physiol. Endocrinol. Metab. 305, E1408–E1414. doi: 10.1152/ajpendo.00212.2013
Ogneva, I. V., Maximova, M. V., and Larina, I. M. (2014). Structure of cortical cytoskeleton in fibers of mouse muscle cells after being exposed to a 30-day space flight on board the BION-M1 biosatellite. J. Appl. Physiol. (1985) 116, 1315–1323. doi: 10.1152/japplphysiol.00134.2014
Panjabi, M. M. (1992a). The stabilizing system of the spine. Part I. Function, dysfunction, adaptation, and enhancement. J. Spinal Disord. 5, 383–389; discussion 397.
Panjabi, M. M. (1992b). The stabilizing system of the spine. Part II. Neutral zone and instability hypothesis. J. Spinal Disord. 5, 390–396; discussion 397.
Park, J. G., Tischfield, M. A., Nugent, A. A., Cheng, L., Di Gioia, S. A., Chan, W. M., et al. (2016). Loss of MAFB function in humans and mice causes duane syndrome, aberrant extraocular muscle innervation, and inner-ear defects. Am. J. Hum. Genet. 98, 1220–1227. doi: 10.1016/j.ajhg.2016.03.023
Philippou, A., Minozzo, F. C., Spinazzola, J. M., Smith, L. R., Lei, H., Rassier, D. E., et al. (2015). Masticatory muscles of mouse do not undergo atrophy in space. FASEB J. 29, 2769–2779. doi: 10.1096/fj.14-267336
Rucci, N., Capulli, M., Piperni, S. G., Cappariello, A., Lau, P., Frings-Meuthen, P., et al. (2015). Lipocalin 2: a new mechanoresponding gene regulating bone homeostasis. J. Bone Miner. Res. 30, 357–368. doi: 10.1002/jbmr.2341
Rudrappa, S. S., Wilkinson, D. J., Greenhaff, P. L., Smith, K., Idris, I., and Atherton, P. J. (2016). Human skeletal muscle disuse atrophy: effects on muscle protein synthesis, breakdown, and insulin resistance-a qualitative review. Front. Physiol. 7:361. doi: 10.3389/fphys.2016.00361
Sandona, D., Desaphy, J. F., Camerino, G. M., Bianchini, E., Ciciliot, S., Danieli-Betto, D., et al. (2012). Adaptation of mouse skeletal muscle to long-term microgravity in the MDS mission. PLoS ONE 7:e33232. doi: 10.1371/journal.pone.0033232
Sayson, J. V., and Hargens, A. R. (2008). Pathophysiology of low back pain during exposure to microgravity. Aviat. Space Environ. Med. 79, 365–373. doi: 10.3357/ASEM.1994.2008
Sayson, J. V., Lotz, J., Parazynski, S., and Hargens, A. R. (2013). Back pain in space and post-flight spine injury: mechanisms and countermeasure development. Acta Astronaut. 86, 24–38. doi: 10.1016/j.actaastro.2012.05.016
Scheuring, R. A., Mathers, C. H., Jones, J. A., and Wear, M. L. (2009). Musculoskeletal injuries and minor trauma in space: incidence and injury mechanisms in U.S. astronauts. Aviat. Space Environ. Med. 80, 117–124. doi: 10.3357/ASEM.2270.2009
Terauchi, Y., Tsuji, Y., Satoh, S., Minoura, H., Murakami, K., Okuno, A., et al. (1999). Increased insulin sensitivity and hypoglycaemia in mice lacking the p85 alpha subunit of phosphoinositide 3-kinase. Nat. Genet. 21, 230–235. doi: 10.1038/6023
Tobin, B. W., Uchakin, P. N., and Leeper-Woodford, S. K. (2002). Insulin secretion and sensitivity in space flight: diabetogenic effects. Nutrition 18, 842–848. doi: 10.1016/S0899-9007(02)00940-1
Ulanova, A., Gritsyna, Y., Vikhlyantsev, I., Salmov, N., Bobylev, A., Abdusalamova, Z., et al. (2015). Isoform composition and gene expression of thick and thin filament proteins in striated muscles of mice after 30-day space flight. Biomed Res. Int. 2015:104735. doi: 10.1155/2015/104735
Wada, S., Kato, Y., Okutsu, M., Miyaki, S., Suzuki, K., Yan, Z., et al. (2011). Translational suppression of atrophic regulators by microRNA-23a integrates resistance to skeletal muscle atrophy. J. Biol. Chem. 286, 38456–38465. doi: 10.1074/jbc.M111.271270
Wing, P. C., Tsang, I. K., Susak, L., Gagnon, F., Gagnon, R., and Potts, J. E. (1991). Back pain and spinal changes in microgravity. Orthop. Clin. North Am. 22, 255–262.
Yamakuchi, M., Higuchi, I., Masuda, S., Ohira, Y., Kubo, T., Kato, Y., et al. (2000). Type I muscle atrophy caused by microgravity-induced decrease of myocyte enhancer factor 2C (MEF2C) protein expression. FEBS Lett. 477, 135–140. doi: 10.1016/S0014-5793(00)01715-4
Keywords: skeletal muscle, gene expression, microgravity, BION-M1, microarray, spaceflight, disuse, insulin resistance
Citation: Gambara G, Salanova M, Ciciliot S, Furlan S, Gutsmann M, Schiffl G, Ungethuem U, Volpe P, Gunga H-C and Blottner D (2017) Microgravity-Induced Transcriptome Adaptation in Mouse Paraspinal longissimus dorsi Muscle Highlights Insulin Resistance-Linked Genes. Front. Physiol. 8:279. doi: 10.3389/fphys.2017.00279
Received: 14 February 2017; Accepted: 18 April 2017;
Published: 05 May 2017.
Edited by:
Nandu Goswami, Medical University of Graz, AustriaReviewed by:
Yuji Ogura, St. Marianna University School of Medicine, JapanJohn Joseph McCarthy, University of Kentucky, USA
Copyright © 2017 Gambara, Salanova, Ciciliot, Furlan, Gutsmann, Schiffl, Ungethuem, Volpe, Gunga and Blottner. This is an open-access article distributed under the terms of the Creative Commons Attribution License (CC BY). The use, distribution or reproduction in other forums is permitted, provided the original author(s) or licensor are credited and that the original publication in this journal is cited, in accordance with accepted academic practice. No use, distribution or reproduction is permitted which does not comply with these terms.
*Correspondence: Dieter Blottner, dieter.blottner@charite.de