 Emily T. Farrell
 Adrian C. Grimes2†
 Willem J. de Lange
 Annie E. Armstrong
 J. Carter Ralphe
- 1Department of Pediatrics, University of Wisconsin School of Medicine and Public Health, Madison, WI, United States
- 2Department of Medicine, University of Wisconsin School of Medicine and Public Health, Madison, WI, United States
Rationale: Hypertrophic cardiomyopathy (HCM) occurs in ~0.5% of the population and is a leading cause of sudden cardiac death (SCD) in young adults. Cardiomyocyte hypertrophy has been the accepted mechanism for cardiac enlargement in HCM, but the early signaling responsible for initiating hypertrophy is poorly understood. Mutations in cardiac myosin binding protein C (MYBPC3) are among the most common HCM-causing mutations. Ablation of Mybpc3 in an HCM mouse model (cMyBP-C−/−) rapidly leads to cardiomegaly by postnatal day (PND) 9, though hearts are indistinguishable from wild-type (WT) at birth. This model provides a unique opportunity to explore early processes involved in the dramatic postnatal transition to hypertrophy.
Methods and Results: We performed microarray analysis, echocardiography, qPCR, immunohistochemistry (IHC), and isolated cardiomyocyte measurements to characterize the perinatal cMyBP-C−/− phenotype before and after overt hypertrophy. cMyBP-C−/− hearts showed elevated cell cycling at PND1 that transitioned to hypertrophy by PND9. An expanded time course revealed that increased cardiomyocyte cycling was associated with elevated heart weight to body weight ratios prior to cellular hypertrophy, suggesting that cell cycling resulted in cardiomyocyte proliferation. Animals heterozygous for the cMyBP-C deletion trended in the direction of the homozygous null, yet did not show increased heart size by PND9.
Conclusions: Results indicate that altered regulation of the cell cycling pathway and elevated proliferation precedes hypertrophy in the cMyBP-C−/− HCM model, and suggests that increased cardiomyocyte number contributes to increased heart size in cMyBP-C−/− mice. This pre-hypertrophic period may reflect a unique time during which the commitment to HCM is determined and disease severity is influenced.
Introduction
Hypertrophic cardiomyopathy (HCM) is a prevalent cause of heart failure in adults and a leading cause of sudden cardiac death (SCD) in apparently healthy young individuals (Fananapazir and Epstein, 1991). It is a primary cardiac disease inherited in autosomal dominant fashion and estimated to affect 1 in 200 individuals (Spirito et al., 1997; Semsarian et al., 2015). The features of HCM include left ventricular hypertrophy, myocardial disarray, fibrosis, diastolic dysfunction, and an increased risk of both SCD and congestive heart failure (Fananapazir and Epstein, 1994; Davies and McKenna, 1995). HCM has long been regarded as a disease of late adolescence and adulthood. Involvement in neonates and young children is relatively rare, but early-onset HCM is typically quite severe (Van Driest et al., 2004; Xin et al., 2007; Zahka et al., 2008). At least 14 HCM-causative genes have been identified, with the majority of genotype-positive cases of familial HCM resulting from mutations in the genes for either β-myosin heavy chain (MYH7) or MYBPC3, which encodes cardiac myosin binding protein C (cMyBP-C; Richard et al., 2003; Olivotto et al., 2008; Alfares et al., 2015). cMyBP-C is a thick filament regulatory protein that binds myosin (Okagaki et al., 1993; Gruen and Gautel, 1999), titin (Labeit et al., 1992), and actin (Razumova et al., 2006), and functions as an important determinant of cardiac contractile reserve (Tong et al., 2008; de Lange et al., 2013). Nearly 200 disease-associated mutations in cMyBP-C are described and include missense mutations and early truncations (Harris et al., 2011). While it is recognized that the majority of humans with genotype-positive HCM are heterozygotes, homozygosity, and compound heterozygosity do exist and are associated with early-onset and typically more severe HCM (Xin et al., 2007; Zahka et al., 2008; Ripoll Vera et al., 2010).
We and others previously reported a mouse model of HCM in which cMyBP-C is genetically ablated (Harris et al., 2002; Korte et al., 2003; Stelzer et al., 2006; de Lange et al., 2011, 2013). This model recapitulates several important aspects of human HCM with both sarcomere dysfunction and a pronounced and fully penetrant phenotype described as hypertrophic (Harris et al., 2002; Korte et al., 2003; Stelzer et al., 2006; Moss et al., 2015). However, a remarkable characteristic of this germline ablation of an important structural and regulatory protein is that it appears to have negligible impact on embryonic cardiac development, while producing a severe hypertrophic phenotype over a very rapid time frame after birth (de Lange et al., 2013). The heart of the postnatal day (PND) 1 cMyBP-C−/− mouse is indistinguishable from WT, but significantly and rapidly enlarges over the first 9 days of life—as demonstrated by histology and heart weight (HW) to body weight (BW) ratios (Harris et al., 2002; de Lange et al., 2011). The mechanisms involved in the rapid development of HCM during the perinatal transition have not been previously explored in the cMyBP-C−/− mouse. Our initial hypothesis was that hypertrophic signaling pathways would be differentially upregulated in the cMyBP-C−/− myocardium at PND1, prior to the observed gross morphologic changes seen by PND9. Full characterization and improved understanding of the molecular events during this period could identify potential therapeutic targets to modify disease course.
In this study, we performed a microarray analysis comparing WT and cMyBP-C−/− hearts at PND1 and PND9 to define differential gene regulation that may precede and contribute to the hypertrophic phenotype. Based on these results we then further examined the status of the perinatal heart in embryonic (E) day 18.5 to PND9 mice deficient in cMyBP-C to define the relative contribution of hyperplasia and/or hypertrophy in the development of the observed early cardiac enlargement. A recent study performed by Jiang et al. (2015) using a mouse model with a truncation mutation in MYBPC3 (cMyBP-Ct/t mouse; McConnell et al., 1999; Sadayappan et al., 2006; Jiang et al., 2015), identified elevated cardiomyocyte proliferation extending through PND17 (Jiang et al., 2015). Unlike the cMyBP-C−/− model, however, no cardiomyocyte hypertrophy was observed in the cMyBP-Ct/t mice through 5 weeks of age. Importantly, the cMyBP-C−/− and cMyBP-Ct/t mice are fundamentally different, as the cMyBP-Ct/t mouse has been shown to produce protein, albeit at a low level (McConnell et al., 1999), whereas the cMyBP-C−/− mouse is a true knockout with no protein expression. A comparison of the data from Jiang et al. with data presented here suggests that the two models develop cardiomyopathies through distinct cellular pathways, potentially highlighting a mutation-specific divergence in phenotype.
Methods
Animals
Heterozygous (cMyBP-C+/−) adults were derived from backcrosses of WT E129X1/SvJ mice (Taconic, Hudson, NY) with homozygous cMyBP-C−/− animals previously generated on the E129X1/SvJ background (Harris et al., 2002). Subsequent breedings of cMyBP-C+/− adults resulted in expected Mendelian frequencies (1:2:1) of WT (cMyBP-C+/+), heterozygous (cMyBP-C+/−) and homozygous knockout (cMyBP-C−/−) animals. Mice in this study were produced from MyBP-C heterozygote (MyBP-C+/−) crossings, with subsequent postmortem genotyping of pups. Littermate comparisons among genotypes were performed whenever possible.
Pups from these breedings were decapitated and intact hearts were harvested, rinsed in 1X PBS, and the blood ejected using blunt forceps. A post-mortem tail snip was taken from each mouse to allow subsequent genotyping and sex determination by PCR. Live postnatal day (PND) 1 and PND9 WT and cMyBP-C−/− pups used for echocardiographic measurements were derived from cMyBP-C−/− × cMyBP-C−/− and WT × WT crosses. PND0 is defined here as the day of birth. This study was approved by the Animal Care and Use Committee of the School of Medicine and Public Health at the University of Wisconsin Madison in accordance with the Guide for the Care and Use of Laboratory Animals (National Institutes of Health publication no. 85-23, revised 1985).
Generation of Embryonic Day (E)18.5 Pups and Extraction of Hearts
cMyBP-C+/− dams were bred to cMyBP-C+/− males for 24 h, after which the males were removed from the cages to establish the timing of pregnancy. Pregnant dams were anesthetized using inhaled isoflurane on day 19 after the breeding date. The abdomens of the dams were opened and the uterine horns containing the embryos were placed in a petri dish with 1X PBS. Embryos were removed from the uterine horn and embryonic sacs, and weighed prior to isolation of each heart. Hearts were rinsed in 1X PBS, weighed and snap frozen in liquid nitrogen.
Routine Histology
PND1 and PND9 mouse hearts harvested as described were fixed and embedded in paraffin according to standard histological procedures detailed in Supplementary Methods. Sections were then stained with hematoxylin and eosin (H&E) using SelecTec reagents and protocols (Surgipath) for general assessment of tissue structure, or by commercially available Masson's Trichrome or Elastic Trichrome stains (Sigma) to highlight elastic fibers and collagen, or by picrosirius red stain (Polysciences, Inc.) to highlight interstitial fibrosis.
Transthoracic Echocardiography on WT and cMyBPC−/− Mice
Hearts of conscious PND1 and anesthetized PND9 mice were imaged using a Vevo 770 ultrasonograph (Visual Sonics) with a 40-MHz transducer (Agilent Technologies). Details regarding anesthesia and animal preparation are available in Supplementary Methods. Two-dimensionally guided M-mode images were acquired at the tip of papillary muscles, and transmitral and aortic velocities measured using Doppler pulse wave imaging. End diastolic and systolic left ventricular (LV) diameter, as well as anterior wall (AW) and posterior wall (PW) thickness, were measured on-line from M-mode images using the leading edge to leading edge convention. All parameters were measured over at least three consecutive cardiac cycles and averaged. Heart rate was determined from at least three consecutive intervals from pulse wave Doppler tracings of the LV outflow tract. Ejection fraction was calculated by 100 × (LV volume diastole - LV volume systole)/LV volume diastole. Isovolumic relaxation time was measured as the time between closing of the aortic valve and the opening of the mitral value from pulse wave Doppler tracings of the LV outflow tract and mitral inflow region.
Microarray Hybridization and Data Analysis
The left ventricular free wall (LVFW) was dissected from the hearts of PND1 and PND9 pups generated from the breeding of heterozygous cMyBP-C+/− adults, and snap frozen in liquid nitrogen. After PCR determination of genotype and sex, the LVFW of seven males from each genotype and age was used for extraction of total RNA as described in Supplementary Methods. Quantification, quality and integrity of RNA were determined with the NanoDrop 2000 (Thermo Scientific), Agilent BioAnalyzer and Agilent RNA Nano Chip (Agilent Technologies). Four hundred nanograms of RNA (and 400 ng of poly-A RNA control) was used for overnight in-vitro labeling with the Ambion GeneChip WT Expression kit following manufacturer's protocols. Following labeling, samples were purified/quantified on the NanoDrop 2000 and 10 μg of purified cRNA used for template input to generate single strand cDNA, 5.5 μg of which was then fragmented and subjected to end-terminus labeling using the Affymetrix WT terminal Labeling Kit (Affymetrix). Samples were hybridized to Affymetrix Mouse Gene 1.0 ST whole genome arrays at 45°C for 16 h following procedures outlined in the GeneChip WT Terminal Labeling and Hybridization user manual. Arrays were post-processed on the Affymetrix GeneChip Fluidics Station 450, scanned on the GeneChip 3000 7G and the data extracted and processed using Affymetrix Command Console (version 3.1.1.1229) according to manufacturer's protocols. Resulting GeneChip.cel files were uploaded to iReport (Ingenuity Systems) or to Genesifter (Geospiza), and normalized via Robust Multi-array Average (RMA) using the default options of each system. Genes differentially expressed up or down >1.5-fold at p = 0.05) were identified using pairwise analysis (comparing WT to cMyBPC−/− and/or comparing PND1 to PND9) or using two-way ANOVA (for multi-factoral analysis). T-test statistics were performed using a Benjamini and Hochberg correction.
RT-qPCR
Whole hearts were dissected from E18.5, PND0, PND1, PND2, and PND9 pups generated from the breeding of heterozygous cMyBP-C+/− adults, and snap-frozen in liquid nitrogen. RNA isolation and qRT-PCR were performed on hearts of each age and genotype according to standard methods, as described in Supplementary Methods.
Immunohistochemistry for Cell Cycling Marker on Paraffin-Embedded Hearts
IHC on paraffin-embedded hearts were performed according to standard methods as detailed in Supplementary Methods, using the following antibodies: 1:20 anti-α-tropomyosin (CH-1; Developmental Studies Hybridoma Bank, University of Iowa, IA) to label myocardium, and 1:200 anti-Ki67 rabbit polyclonal antibody (Abcam, ab15580) to label cells actively participating in the cell cycle (Figure 2). For secondary detection, sections were incubated in 1:200 AlexaFluor 568 goat anti-mouse IgG1 and Alexafluor 488 goat anti-rabbit IgG(H+L)secondary antibodies (Molecular Probes, Eugene, OR, USA). In each case, as a control, similar sections were incubated with secondary antibodies only. Sections were coverslipped using warmed ProLong Gold Antifade Reagent (Invitrogen) with 4′,6-diamidino-2-phenylindole (DAPI) to label nuclei.
Analysis of Cell Cycling by IHC
The number of cycling cardiomyocytes was determined in images of LV and septum from coronal sections labeled with antibodies against α-tropomyosin and the Ki-67 antigen, and counterstained with DAPI. Ki-67- and α-tropomyosin-labeled cells were counted in representative sections of at least three hearts of each genotype and age, and the mean calculated. Cells labeled with Ki-67 but not α-tropomyosin were designated as non-cardiomyocytes and thus excluded from counts. All calculations were subjected to statistical analysis using standard Students' t-test.
Cryogenic Preservation of Hearts, Cryosectioning, and IHC
Hearts were cryogenically preserved and cryosectioned according to standard procedures detailed in Supplementary Methods. Sections were mounted on glass slides and IHC was performed using 1:1,000 anti-α-actinin mouse monocolonal antibody (Sigma, A7811) to label cardiomyocytes, followed by AlexaFluor 568 goat anti-mouse IgG1 (Molecular Probes) at 1:250. Following IHC, sections were incubated for 10 min with 5 μg/ml wheat germ agglutinin (WGA)—Alexa 647 [Molecular Probes; for the determination of cross-sectional area (CSA)] in 1X PBS.
Measurements of Hypertrophy in Cryogenic Heart Sections
For analysis of cardiomyocyte hypertrophy from cryogenic heart sections, measurements were taken from three hearts per genotype/age, with sampling from three cryosections per heart and three fields per section. The investigator performing the measurements and counts was blind to the genotype of all heart sections.
Hypertrophy was determined by measuring cardiomyocyte CSA on images of transversely cut heart cryosections labeled with anti-α-actinin, WGA-Alexa 647, and DAPI. Only images from LV and septum were imaged and quantified. Cells used in the analysis were confirmed as cardiomyocytes by the presence of α-actinin labeling. Manual tracing of the cardiomyocyte cross-sections was performed using the NIS-Elements 4.0 software which then calculated the CSA of individual cardiomyocytes. Ninety cardiomyocyte CSAs were measured per genotype/age. CSAs were averaged for each individual heart, and means were compared between genotypes within each age. All calculations were analyzed using Students' t-test.
Measurements of Hypertrophy in Fixed, Dissociated Cardiomyocytes
In a method adapted from Mollova et al. (2013) with some modifications, hearts freshly isolated from PND2 and PND9 mice were rinsed in 1X PBS with 30 mM 2,3-butanedione monoxime (BDM, Sigma). Left ventricles (LV) + septums were isolated, minced and fixed in 2% formaldehyde for at least 45 min. After fixation, minced LV + septum were washed 3 × 5 min in 1X PBS, then incubated in 250 μl (PND2) or 500 μl (PND9) Type II collagenase (Gibco) at 37°C for 1–4 h for digestion. After digestion, cells were gently triturated with a plastic transfer pipet to disperse cells. Fetal bovine serum (FBS, Hyclone) was added to the cell suspension to reach a final concentration of 10% FBS to quench collagenase activity. Sodium azide (Spectrum) was added for a final concentration of 0.03% to inhibit bacterial growth. A drop of cell suspension was placed on a labeled glass slide and covered with a coverslip that was then sealed with nail polish. Cells were then imaged in bright field at 40X as described in Supplementary Methods.
Data Analyses
Values are reported as means ± SE. Statistical analyses were performed using SPSS (IBM) or SAS software version 9.3. For comparisons in which there were only two groups (WT vs. cMyBP-C−/−), Students' t-test was performed within each age group. For comparisons of three groups (WT, cMyBP-C+/−, cMyBP-C−/−), one-way ANOVAs were conducted with a post-hoc Bonferroni correction to compare between genotypes at each time point. For analysis of cell size on fixed, isolated cardiomyocytes, a compound symmetry correlation structure was used to account for repeated measures from one heart (n = 50–100 cells/heart) and to account for any litter effect. Significance is reported at p < 0.05. All graphs were generated using GraphPad Prism.
Results
As described in the Methods Section, all comparisons were made using littermate offspring from heterozygous (cMyBP-C+/−) breedings to achieve more tightly controlled experimental conditions and reduce variance.
cMyBPC-Null Hearts Demonstrate a Rapid Increase in Size and Loss of Function Over First 10 Days of Life
There was no evidence of gross morphological differences at PND1 (1 day after birth) between hearts from cMyBP-C−/−mice and those of WT littermates (Figures 1A,B). In sharp contrast, by PND9 there was a pronounced difference in the thickness of the interventricular septum and LVFWin cMyBP-C−/− hearts compared to the hearts of WT littermates (Figures 1C,D). The HW to BW ratio was significantly elevated in PND9 cMyBP-C−/− pups vs. WT [(%) 0.624 ± 0.015 vs. 0.501 ± 0.0062, respectively, ± SE, p < 0.001, n = 13 (cMyBP-C−/−), 32 (WT)] but was not different at PND1 [(%) 0.602 ± 0.007 vs. 0.619 ± 0.01, ± SE, p = 0.833, n = 18 (cMyBP-C−/−), 13 (WT)], which has been previously observed (de Lange et al., 2013). These morphologic changes at PND9 are consistent with the described hypertrophic phenotype of this mouse model (Harris et al., 2002; de Lange et al., 2013).
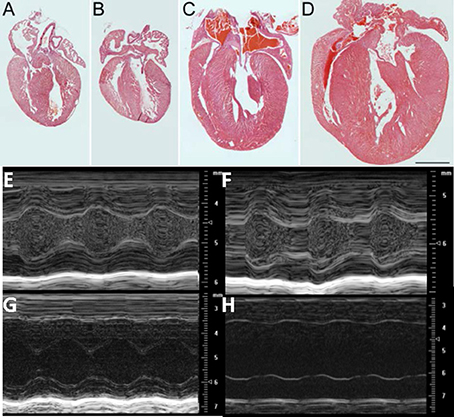
Figure 1. Morphologic and functional change in cMyBP-C−/− between PND 1 and PND9: Hematoxylin and Eosin (H&E) staining of representative sections from hearts of WT (A, C) and cMyBP-C−/− (B, D) mice at PND1 (A,B) and PND9 (C,D). Scale bar = 1 mm. (E–H) Representative M-mode echocardiographic images of WT (n = 6; E,G) and cMyBP-C−/− (n = 7; F,H) mice at PND1 (E,F) and PND9 (G,H). Note different scales for PND1 vs. PND9. Measurements listed in Table 1. PND1 images show increased echogenicity within LV cavity due to nucleated red blood cells that are absent by PND9.
The gross morphology was supported by echocardiography, which revealed no difference at PND1 between WT and cMyBP-C−/− hearts with regard to wall thickness and chamber diameter (Figures 1E–H and Table 1), except for a minimal but significantly lower left ventricular posterior wall thickness during systole (LVPWs) at PND1 in cMyBP-C−/− vs. WT hearts (Table 1). This difference was not present during diastole or in the anterior wall. At a functional level, cMyBP-C−/− mice showed no difference in ejection fraction at the same age. However, while ejection time appeared to be similar between WT and cMyBP-C−/− mice at PND1, isovolumic relaxation time (IVRT) was longer in cMyBP-C−/− pups, suggesting an early subtle functional deficit (Table 1) which was explored previously (de Lange et al., 2013).
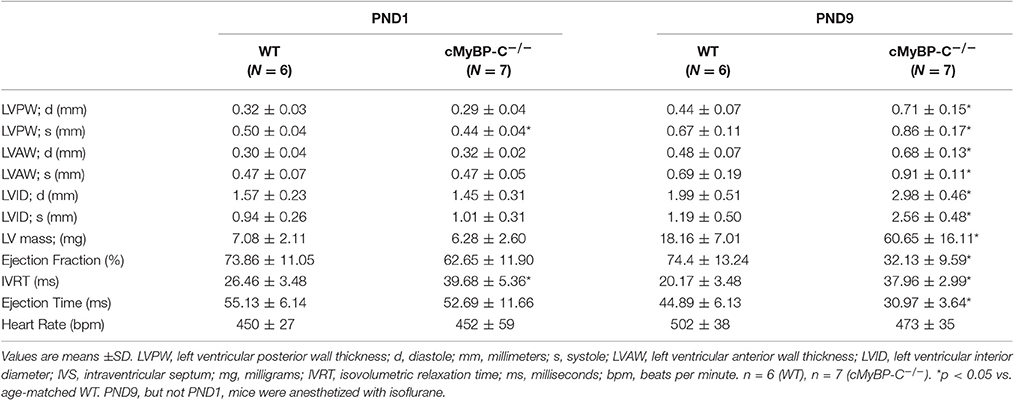
Table 1. Echocardiographic Measurements in WT and cMyBP-C −/−Mice at PND1 and PND9.
In sharp contrast to the virtual absence of morphological differences at PND1, by PND9 the cMyBP-C−/− ventricle walls were considerably thicker than WT (Figures 1E–H and Table 1), consistent with the gross morphology. Measured during systole, the cMyBP-C−/− anterior and posterior left ventricular wall thicknesses (LVAW and LVPW) were increased 32% and 29%, respectively, compared to WT hearts. The left ventricular internal diameter during diastole (LVIDd) and systole (LVIDs) was also significantly larger in the cMyBP-C−/− mice at PND9 vs. WT, suggesting that dilation exists at this early stage of the disease. Furthermore, a functional deficit virtually absent at PND1 was readily apparent in the PND9 cMyBP-C−/− mice. The ejection fraction was considerably lower (43% of WT), and the isovolumic relaxation time significantly prolonged (188% of WT), with a shortened ejection time (69% of WT) in the PND9 cMyBP-C−/− hearts (Table 1).
At PND1, Microarray Analysis of cMyBPC−/− Mice Reveals Upregulation of Genes Involved in Cell Cycling and Proliferation
Pairwise comparison using analysis software (iReport and Genesifter) of microarray data at PND1 identified many genes in the cell cycle pathway that were upregulated >1.5-fold (p < 0.05) in the cMyBP-C−/− hearts vs. (vs.) WT, indicating either an increase of cell cycling or a delay/persistence of developmental processes, or a combination of both. Genesifter analysis revealed that the highest scoring pathway in KEGG (The Kyoto Encyclopedia of Genes and Genomes) was the “cell cycle” pathway, which includes the differential expression of genes involved in several pathways linked to cell division, replication, and proliferation (Table 2).
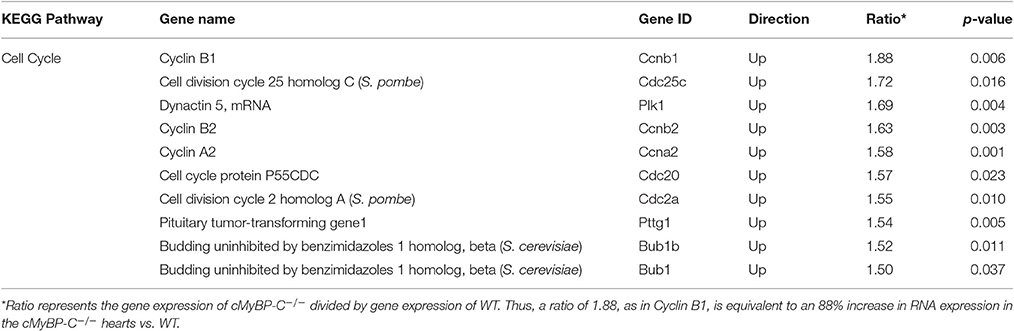
Table 2. “Cell Cycle” is the Most Differentially Regulated Pathway Between cMyBP-C−/− and WT Hearts at PND1.
Data from pairwise analysis of PND1, WT vs. cMyBP-C−/− hearts were further analyzed using Ingenuity Pathway Analysis (IPA, Ingenuity Systems). This analysis identified additional cell cycle pathway genes showing differential regulation, including but not limited to cyclin dependent kinase (Cdk), the anaphase-promoting complex (APC), importin α and β, and the extracellular-signal-regulated kinases (Erk1/2; Supplementary Figure 1, Supplementary Table 1). Taken together, the significant upregulation of genes involved in cell cycle, replication, and proliferation in cMyBP-C−/− mice compared to WT at PND1 suggests an early postnatal increase in cardiomyocyte cell cycling that precedes the hypertrophic phenotype.
Microarray Analysis Reveals a Switch to Hypertrophic Signaling in cMyBP-C−/− vs. WT by PND9
Pairwise analysis of microarray data comparing WT and cMyBP-C−/− hearts at PND9 revealed that the KEGG “cell cycle” pathway was no longer upregulated in cMyBP-C−/− hearts. In addition, none of the genes implicated in cell division, replication, and proliferation that were identified at PND1 were differentially expressed at PND9. In the PND9 hearts, the top scoring KEGG pathway was “hypertrophic cardiomyopathy,” which included eight upregulated genes and 1 (other than cMyBP-C itself) that was downregulated >1.5-fold at p = 0.05 (Supplementary Table 2). Supplementary Table 3 lists the most differentially regulated KEGG pathways in addition to “hypertrophic cardiomyopathy,” between WT and cMyBP-C−/− mice at PND9, along with their corresponding genes, as identified by Genesifter analysis. Genes listed in pathways outside of “hypertrophic cardiomyopathy” are nonetheless directly implicated in HCM or other cardiovascular diseases (Weizmann Institute of Science MalaCards Human Malady Compendium and/or the University of Copenhagen DISEASES database). Hypertrophic pathways were neither activated nor differentially regulated between WT and cMyBP-C−/− mice at PND1.
Cardiomyocyte Cell Cycling is Increased in Cardiomyocytes from PND1 cMyBP-C−/− Mice
To confirm the upregulation of cell cycling noted at the RNA level in the microarray in PND1 cMyBP-C−/− mice, we performed IHC on heart sections from WT and cMyBP-C−/− mice. Coronal, paraffin-embedded heart sections were labeled with an anti-α-tropomyosin antibody, identifying cardiac, and skeletal muscle cells. Co-labeling using the Ki-67 antibody (Figures 2A–D) revealed a significantly higher number of cardiomyocytes actively participating in the cell cycle in the PND1 cMyBP-C−/− hearts compared to that of WT littermates (59 ±4 vs. 25 ±4 Ki67-positive cardiomyocytes per section, n = 3 hearts per group, ±SE, p < 0.05, Figure 2I), in agreement with the microarray data. At PND9, further corroborating the microarray data, there was no statistical difference in the number of Ki67-positive cardiomyocytes in cMyBP-C−/− vs. WT hearts (23 ±4 vs. 17 ±5 cells per section, ± SE, p = 0.38, n = 3 hearts per group, Figure 2I). These data support elevated cell cycling of early postnatal cardiomyocytes in cMyBP-C−/− hearts that is absent by PND9.
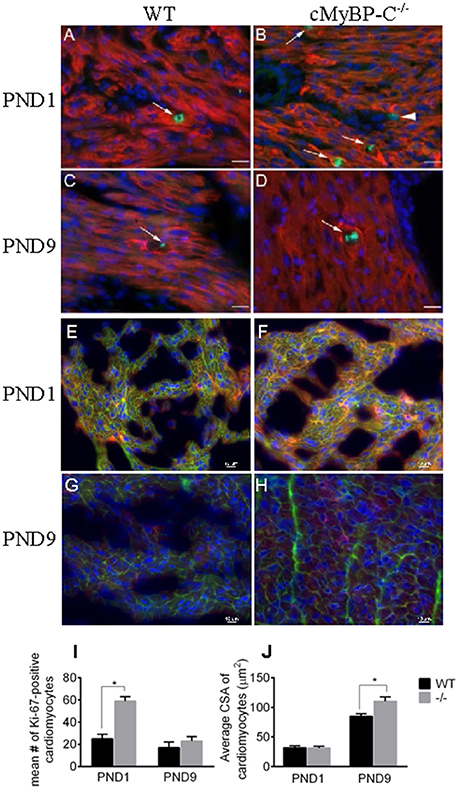
Figure 2. Hyperplasia precedes hypertrophy in cMyBP-C−/− hearts. (A–D) Representative sections of hearts of WT (A,C) and cMyBP-C−/− (B,D) mice at PND1 (A,B) and PND9 (C,D) labeled with α-tropomyosin (red), a muscle-specific marker, Ki-67 (green) to highlight active cell cycling, and counterstained with DAPI (blue) to highlight nuclei. Arrows highlight single Ki-67-expressing cardiomyocytes in each panel. Arrowhead in (B) highlights a Ki-67-positive, α-tropomyosin-negative, non-cardiomyocyte cell that was excluded from counts. Scale bars = 20 μm. E–H: Representative sections of WT (E,G) and cMyBP-C−/− (F,H) mouse hearts at PND1 (E,F) and PND9 (G,H) labeled with α-actinin (red) and WGA AlexaFluor 647 (pink) to highlight cell borders, and counterstained with DAPI (blue). Quantification of number of Ki-67-positive cardiomyocytes (I) and cardiomyocyte cross-sectional area (CSA; J) for WT and cMyBP-C−/− (-/-) at PND1 and PND9 in representative heart sections, as shown in (A-H). Means ±SE are reported, *p < 0.05.
Cardiomyocyte Hypertrophy Evident in PND9 But Not PND1 cMyBP-C−/− Hearts
To quantify the degree of hypertrophy of the cardiomyocytes at both PND1 and PND9, we determined cardiomyocyte size using cryopreserved WT and cMyBP-C−/− hearts. Hearts were cut in transverse sections and immunolabeled with WGA attached to the fluorophore Alexa 647 to visualize cell borders, anti-α-actinin to confirm cardiomyocyte cell type, and DAPI to visualize nuclei (Figures 2E–H). We measured cardiomyocyte cross-sectional area in 90 α-actinin-positive cells per heart from multiple individual sections from WT (n = 3 hearts) and cMyBP-C−/− littermates (n = 3 hearts). Averaged cross-sectional areas of individual myocytes are depicted in Figure 2J. There was no indication of hypertrophy at PND1 in cMyBP-C−/− hearts, evidenced by similar cardiomyocyte mean cross-sectional area vs. WT (31.30 ± 3.19 vs. 31.76 ± 3.60 μm2, respectively, ±SE, p = 0.93). In contrast, at PND9 cardiomyocytes from cMyBP-C−/− hearts were significantly hypertrophied compared to those from WT hearts, with a 30% higher mean cardiomyocyte cross-sectional area (110.30 ± 7.50 vs. 85.04 ± 4.35 μm2, ±SE, p < 0.05, Figure 2J).
Since cardiac fibrosis is often found in HCM and might contribute to heart mass and size, we stained sections of PND1 and PND9 hearts using Masson's Trichrome and Elastic Trichrome (Supplementary Figure 2). No difference in interstitial fibrosis or disarray was observed between genotypes at either age.
Timeline of Cell Cycling and Onset of Hypertrophy
The microarray and IHC data revealed that elevated cell cycling preceded the hypertrophic response, and that the enhanced cell cycling had normalized by PND9. These data raised the question of if differential hyperplasia precedes birth, and also how long it persists after PND1. The time course duration for cell cycling could have profound implications on the final cardiomyocyte number present in the cMyBP-C−/− hearts. Furthermore, the temporal relationship of potential hyperplastic vs. hypertrophic cellular signaling could lend insight as to a potential interaction between these two processes. Therefore, we expanded our study to include the investigation of cardiac morphology and gene expression at the added time points of embryonic day 18.5 (E18.5), PND0, and PND2 as well as at the previously established time points of PND1 and PND9, on an additional set of animals. Furthermore, we investigated heterozygote (cMyBP-C+/−) mice to determine whether any early, mild changes were present in these animals.
Timeline of Gross Hypertrophy
To assess gross cardiac hypertrophy, animals and hearts were weighed at their respective time points and HW to BW ratios were calculated, as previously. There were no differences in pup weights among WT, cMyBP-C+/− or cMyBP-C−/− mice at any time point, suggesting that the cMyBP-C−/− mice are not globally growth retarded (Figure 3, top). HW to BW ratios of cMyBP-C+/− mice did not differ from WT at any time point. cMyBP-C−/− HW to BW ratios were not different than WT at E18.5, PND0, or PND1. However, cMyBP-C−/− pups had higher HW to BW ratios than their time-matched WT littermates at the remaining time points of PND2 (%, 0.61 ±0.01 vs. 0.57 ±0.01, ±SE, respectively) and PND9 (%, 0.64 ±0.02 vs. 0.51 ±0.01, respectively, ±SE, P < 0.001; Figure 3, bottom), suggesting that gross cardiac hypertrophy exists at the organ level starting at PND2 in the homozygote null animals (See Supplementary Table 4 for numbers of mice per genotype/day point).
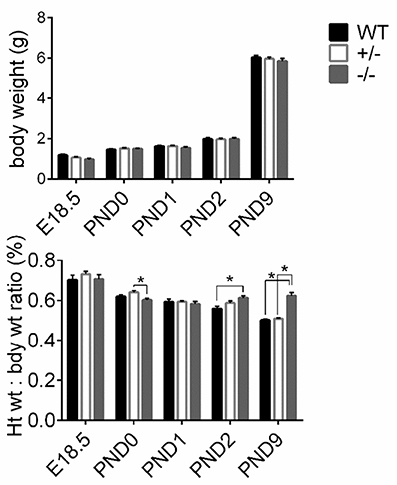
Figure 3. Assessment of gross cardiac hypertrophy in WT, cMyBP-C+/− (+/−), and cMyBP-C−/− (-/-) hearts from E18.5 to PND9. (Top) body weight and (bottom) heart weight to body weight ratio. Numbers of pups/hearts per day/genotype are listed in Supplementary Table 4. Means ±SE are reported, *p < 0.05.
Timeline of Cellular Hypertrophy Using Genetic Markers
Since gross cardiac enlargement may or may not be the result of cellular hypertrophy, we evaluated the timing of the onset of cardiomyoctye hypertrophy by assessing expression of two genes widely recognized as hypertrophic markers, Nppa (atrial natriuretic peptide) and Myh7 (expressed as the ratio of Myh7 [β-myosin heavy chain]/Myh6 [α-myosin heavy chain]), at the added time points starting before birth. Figure 4 shows expression of Nppa (A) and Myh7/Myh6 (B) relative to the housekeeping genes Gapdh and ß-actin, as well as when normalized to WT levels (C, D), measured through targeted qPCR (Separated Myh6 and Myh7 expression is shown in Supplementary Figure 3). Expression of Nppa was higher in cMyBP-C−/− and cMyBP-C+/− vs. WT hearts at PND0, prior to the onset of gross cardiac hypertrophy in cMyBP-C−/− mice (see Figure 3, bottom), and was also higher at PND2 and PND9 in cMyBP-C−/− hearts (Figures 4A,C). Although there were trends toward elevated Nppa both prior to birth (E18.5) and at PND1 in cMyBP-C−/− hearts, they were not statistically significant. The early elevation of Nppa, prior to gross hypertrophy in the cMyBP-C−/− mouse, and in the absence of gross hypertrophy in the cMyBP-C+/− mouse, raises the question of whether Nppa is a true marker for hypertrophy or rather a non-specific response to stress.
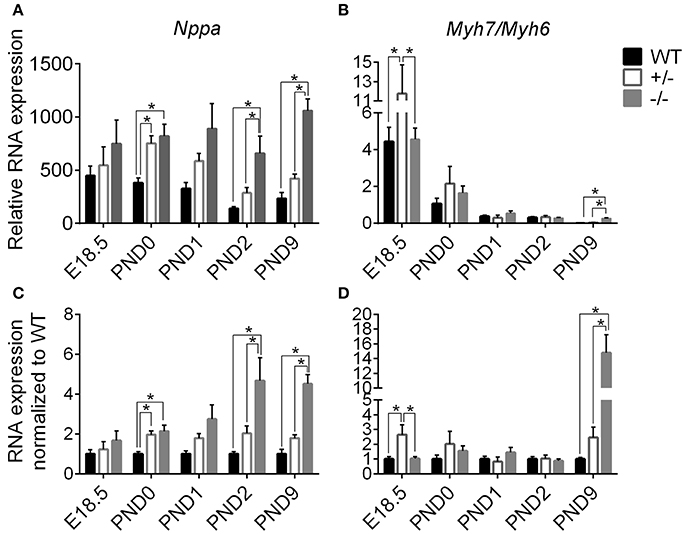
Figure 4. Markers of stress and hypertrophy in WT, cMyBP-C+/− (+/−), and cMyBP-C−/− (-/-) from E18.5 to PND9. RNA expression of Nppa (A,C) and the ratio of Myh7/Myh6 RNA expression (B,D) relative to the average of 2 housekeeping genes, Gapdh and ß-actin (A,B) and normalized to WT hearts at each corresponding time point (C,D). Inset in B is an expanded view of PND9. n = 5 hearts/group. Means ±SE are reported, *p < 0.05.
cMyBP-C+/− hearts showed elevated Myh7/Myh6 expression at E18.5 but at no other time point. Expression of Myh7/Myh6 in cMyBP-C−/− hearts was only elevated at PND9 (Figures 4B,D), although HW to BW ratio was increased at PND2 (see Figure 3, bottom). The lack of an elevated Myh7/Myh6 ratio at PND2 suggests that the increase in HW to BW ratio at PND2 may not be due to cellular hypertrophy but could be the result of cardiomyocyte hyperplasia, resulting from the observed increase in cell cycling.
Timeline of Cardiomyocyte Cell Cycling
We performed targeted qPCR at the expanded time points starting before birth to determine whether the enhanced postnatal cardiomyocyte cell cycling in cMyBP-C−/− hearts is a prolongation of the highly proliferative embryonic state or represents an independent postnatal increase. RNA expression was quantified for two cell cycling genes, cyclin A2 (Ccna2) and cell division cycle 25c (Cdc25c), both of which showed higher levels of expression in cMyBP-C−/− hearts at PND1 (Table 2) but no difference at PND9 in the microarray analysis. Targeted qPCR revealed that RNA expression levels of Ccna2 and Cdc25c were not different at E18.5 or PND0 between cMyBP-C−/− and WT hearts (Figure 5). However, at PND1, levels of expression of Ccna2 and Cdc25c were maintained at a higher level in cMyBP-C−/− hearts vs. WT (elevated 2.38 ± 0.39- and 2.23 ± 0.28-fold vs. WT, respectively). This elevated RNA expression continued through PND2 for Ccna2 (Figures 5A,C). Although the gene expression of Cdc25c trended toward being higher in cMyBP-C−/− vs. WT hearts at PND2, the difference was not significant at this time point. This elevated cell cycling in cMyBP-C−/− vs. WT hearts was also supported by increased IHC detection of Ki-67 in cMyBP-C−/− mice (Supplementary Figures 4A,B,E).
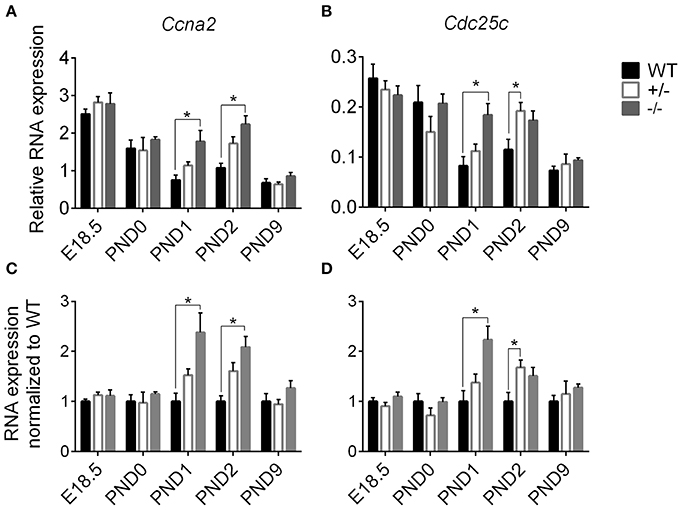
Figure 5. Higher cell cycling gene expression in cMyBP-C−/− vs. WT hearts. RNA expression of Ccna2 (A,C) and Cdc25c (B,D) relative to the average of 2 housekeeping genes, Gapdh and ß-actin (A,B) and normalized to WT hearts (C,D). n = 5 hearts/group. Means ±SE are reported, *p < 0.05.
The cMyBP-C+/− hearts showed no difference in Ccna2 expression at any time point, and showed elevated Cdc25c expression compared to WT only at PND2. However, there was a trend toward upregulation for Cdc25c at PND1 and PND2, and for Ccna2 at PND1. At PND9, RNA expression in the cMyBP-C−/− and cMyBP-C+/− hearts was not different from WT for either of the cell cycling genes. Thus, elevated expression of cell cycling genes in cMyBP-C−/− hearts appears to reflect a prolongation of physiologic neonatal cell cycling, while cMyBP-C+/− hearts show a trend, though mostly non-significant, in the same direction as cMyBP-C−/− hearts.
Increased cell cycling in the cMyBP-C−/− cardiomyocytes does not necessarily indicate increased cardiomyocyte proliferation. However, unless cellular hypertrophy is present at PND2, the increased HW to BW ratio at PND2 would only be reasonably explained by increased cardiomyocyte proliferation. The absence of an elevated Myh7/Myh6 expression at PND2 raises doubt as to if cellular hypertrophy exists at PND2 in the cMyBP-C−/− heart.
Assessment of Cardiomyocyte Size at PND2 and PND9
To confirm whether or not cardiomyocyte hypertrophy is present in the PND2 cMyBP-C−/− LV to contribute to the increased HW to BW ratio, we directly assessed cardiomyocyte size using a method adapted with modifications from Mollova et al. (2013). Freshly excised hearts were fixed in situ with formaldehyde prior to collagenase digestion, to yield striated, rod-shaped cardiomyocytes (Figure 6A). Cells were then imaged and measured for length and width. Cardiomyocyte area was calculated as the product of length × width. At PND2, cMyBP-C+/− cardiomyocytes were slightly longer in length compared to the cMyBP-C−/− cardiomyocytes, but were not different from WT (Figure 6B and Supplementary Table 5). Cardiomyocytes from cMyBP-C−/− LVs were not different from WT cardiomyocytes in length, width, or area, demonstrating that cardiomyocyte hypertrophy is not responsible for the increased HW to BW ratio in cMyBP-C−/− mice at PND2. The lack of cardiomyocyte hypertrophy at PND2 was further supported by measurements of cardiomyocyte CSA in IHC (Supplementary Figures 4C,D,F).
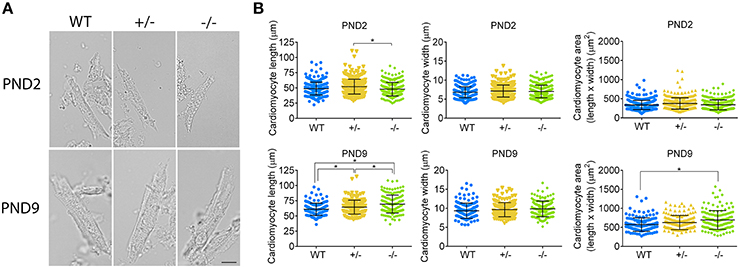
Figure 6. Cardiomyocyte hypertrophy is present at PND9 but not PND2 in cMyBP-C−/− hearts. (A) Representative cardiomyocytes from WT, cMyBP-C+/− (+/−), and cMyBP-C−/− (-/-) mice at PND2 and PND9. Scale bars = 10 μm. (B) Cardiomyocyte length, width, and area (length × width) plotted for each individual cell with horizontal line at the mean ±SD. n = 100 cells/heart (PND2), n = 50 cells/heart (PND9), n = 3 hearts/genotype. *p < 0.05.
At PND9, cardiomyocytes from cMyBP-C−/− LVs were longer than WT and cMyBP-C+/− cardiomyocytes, leading to an increased cell area compared to WT (Figure 6B, Supplementary Table 5). No changes in cell width were observed. Thus, at PND9, cardiomyocyte hypertrophy is at least partly responsible for the increased HW to BW ratio in cMyBP-C−/− hearts, as expected.
These data indirectly suggest that the increased cell cycling observed by microarray (Table 2, Supplementary Figure 1) RNA expression (Figure 5), and IHC (Figure 2, Supplementary Figures 4A,B,E) does in fact lead to cardiomyocyte proliferation, as further suggested by increased expression of genes involved in the cytokinetic processes of contractile ring assembly or in abcission (Supplementary Table 6). This proliferative response is substantial enough to be wholly responsible for the increased HW to BW ratio observed at PND2 in the cMyBP-C−/− cardiomyocytes, as cardiomyocyte hypertrophy is not present at PND2. By PND9, cardiomyocyte hypertrophy is present in the cMyBP-C−/− but not cMyBP-C+/− LVs, as indicated by cardiomyocyte area (Figure 6).
Discussion
We conclude from the data presented here that in an HCM model in which mice lack cMyBP-C there is a prolongation of postnatal cell cycling which results in increased cardiomyocyte proliferation, prior to activation of the hypertrophic response. These data further reveal that cellular signaling in the heterozygote (cMyBP-C+/−) heart trends in the same direction as the cMyBP-C−/− heart, but fails to elicit a hypertrophic phenotype by PND9. At 6 months of age, however, the cMyBP-C+/− mice show evidence of diastolic dysfunction, altered contractile kinetics, and pro-arrhythmic changes in their action potential, while remaining free of overt hypertrophy (Cheng et al., 2013). It is unknown whether the cMyBP-C+/− mice develop hypertrophy at a more advanced age.
We previously reported that newborn cMyBP-C−/− mice are grossly indistinguishable from their WT littermates, but by PND9 the cMyBP-C−/− hearts are significantly enlarged (de Lange et al., 2013). This response has been assumed to be purely hypertrophic. In performing a transcriptome comparison of newborn and PND9 mice from cMyBP-C−/− and WT pups, we expected to identify early hypertrophic signaling events. Unexpectedly, the data presented here, while confirming that germline ablation of cMyBP-C−/− does not cause any apparent overt pathology during cardiogenesis, does however indicate a prolonged phase of increased cell cycling and proliferation postnatally that precedes the significant cellular hypertrophic response apparent by PND9. While we recognize that counting cardiomyocyte number is the most direct method to assess proliferation, it is technically unfeasible in our experimental design. The pups in this study are obtained from heterozygote × heterozygote breedings, such that all litter mates are processed in parallel, with genotypes unknown at the time of harvest. Additionally, recovery and counting of cardiomyocytes from PND2 hearts proved highly unreliable and irreproducible. Therefore, we relied upon several indirect measures to differentiate a proliferative vs. hypertrophic response, including increased HW to BW ratio in the PND2 cMyBP-C−/− pups (n = 25) vs. WT (n = 24) in the absence of cardiomyocyte hypertrophy, increased cardiomyocyte Ki-67 positivity, and direct measure of cardiomyocyte areas.
The Potential Contribution of Cardiomyocyte Proliferation to Heart Size
Under normal processes of mammalian development, the fetal heart increases its size primarily through cell division, but transitions shortly after birth to physiologic hypertrophic growth to correlate heart size with somatic growth (Walsh et al., 2010; Porrello et al., 2011). In the context of HCM, elevated and persistent proliferation may have a significant impact on eventual disease severity. Enhanced early cardiomyocyte cell cycling at PND1 and PND2 in the cMyBP-C−/− hearts that is significant enough to lead to an increase in HW to BW ratio in the absence of cardiomyocyte hypertrophy at PND2, as observed here, could provide an additional pool of myocytes that later participate in the hypertrophic response. The impact of prolonged cell division on total cardiomyocyte number may be substantial. Between PND1 and PND4 in normal hearts of WT mice, cardiomyocyte population increases by as much as 40% (Naqvi et al., 2014). Any additional increase and/or prolongation of this exponential proliferative capacity in the neonate would be expected to profoundly influence total cardiomyocyte number. Whether or not the early proliferative responses observed in our murine model occur in human myocardium to exert an as yet unappreciated influence in disease manifestation remains to be determined. However, there are data suggesting that the presence and importance of cardiomyocyte proliferation early in life extends to humans, and that cardiomyocyte proliferation before 20 years of age contributes to heart size (Mollova et al., 2013). The question of if the degree of proliferation is altered in HCM in humans remains unanswered.
The Perinatal Period May Provide a Unique Opportunity for Modifying Disease Course
Evidence derived from other models of HCM further support the potential importance of this early pre-hypertrophic period in determining the course toward overt HCM (Jiang et al., 2013; Cannon et al., 2015). Silencing an HCM-causing Arg403Gln Myh6 mutation prior to hypertrophy prevented the development of hypertrophy, while silencing the mutation after hypertrophy was already apparent did not lead to a reversal of the phenotype (Jiang et al., 2013). When the same mutation is suppressed from conception through 6 weeks of age, the degree of hypertrophy and fibrosis at 40 weeks was significantly attenuated compared to non-suppressed controls. When suppression occurred after 6 weeks of age, the mice developed severe hypertrophy (Cannon et al., 2015). Additionally, cardiac-specific ablation of cMyBP-C during adulthood results in significantly less cardiac hypertrophy compared to mice with germline ablation of cMyBP-C (Chen et al., 2012). These data suggest that the proliferative capacity of the neonatal cardiomyocyte provides a unique, potentially modifiable mechanism that contributes to HCM in a manner that is unparalleled later in life.
Cell Proliferation and Cell Hypertrophy: Distinct or Interrelated Pathways?
The transition that we observe in the cMyBP-C−/− hearts from an early elevation in cardiomyocyte proliferation, associated with an increased HW to BW ratio, to a later cardiomyocyte hypertrophy raises the question of whether the proliferative and hypertrophic pathways are distinct from each other or interrelated. The phenomenon of increased cardiomyocyte proliferation prior to cellular hypertrophy was recently reported to also occur in non-sarcomere etiologies of pathologic cardiac hypertrophy (Kim et al., 2014; Schipke et al., 2015). Enhanced cardiomyocyte proliferation in the first 2 weeks of life was found in both Prkag2 cardiomyopathy, in which an adenosine monophosphate (AMP)-activated protein kinase mutation causes abnormal glycogen storage (Kim et al., 2014), as well as in mice with a deletion of guanylyl cyclase A (GC-A) that proceed to develop cardiac hypertrophy (Schipke et al., 2015). In both of these models, mice exhibited a prolonged phase of postnatal cardiomyocyte proliferation that occurred prior to the ensuing cellular hypertrophy, but coincident with an increased HW to BW ratio, echoing the results we obtained with the cMyBP-C−/− mice. The authors concluded, as do we, that the postnatal elevation in proliferation contributed to the hypertrophic phenotype. The study presented here extends the observation of enhanced hyperplasia preceding cardiomyocyte hypertrophy to the disease of HCM and proposes that communication between the two mechanisms facilitates HCM progression. Together, these studies support a more generalizable role for a cardiac hyperplastic response to gene mutations associated with the later development of hypertrophy. These data imply that variations in the increased pool of cells available to participate in the hypertrophic process may influence the eventual severity of the phenotype, a process further modified by the specific HCM mutation and/or the genetic background of the individual.
While the relevance of an interaction between hyperplastic and hypertrophic cellular response pathways remains to be fully explored, the implication that underlying pathologic conditions can influence the timing of exit of cardiomyocytes from the cell cycle is intriguing. In chondroblasts, the hypertrophic phase of growth is unable to initiate until completion of the proliferative phase, suggesting either cross-talk between the pathways or an absolute requirement for exit from the cell cycle before hypertrophy can proceed (Omelyanenko et al., 2013). The overlap between many of the proteins involved in both of these processes implies additional nuance in their regulation.
Heterogeneity in HCM
Recently, Jiang et al. (2015) reported the early postnatal phenotype of mice harboring a mutation that prematurely truncates cMyBP-C at amino acid 1,064 of 1,270 (cMyBP-Ct/t). Although both the cMyBP-C−/− and cMyBP-Ct/t exhibit an early postnatal hyperplastic response, resulting in a HW to BW ratio increase independent of cellular hypertrophy, the two mouse models also show some important divergent findings. While the cMyBP-C−/− mouse in our study showed cardiomyocyte hypertrophy following the early elevated proliferation, the cMyBP-Ct/t mouse exhibited a purely hyperplastic response without any subsequent cardiomyocyte hypertrophy. The resulting phenotype is a dilated cardiomyopathy, as opposed to HCM. Furthermore, Jiang et al. suggest that in contrast to the homozygote cMyBP-Ct/t mouse, the hearts of individual human patients heterozygous for cMyBP-C mutations are purely hypertrophic, and the difference in allelic expression between the cMyBP-Ct/t and heterozygous patients results in divergent cellular pathways both leading to cardiomyopathy (Jiang et al., 2015). In contrast, mice in our study heterozygous for the null mutation (cMyBP-C+/−) appear to have an early intermediate expression between WT and cMyBP-C−/− for genes involved in cell cycling and stress response, which then return to normal by PND9. These heterozygous mice ultimately fail to show a cardiomyopathic phenotype by PND9, but the trend in gene expression in the same direction as the cMyBP-C−/− mice suggests similar, not divergent cellular signaling between cMyBP-C−/− and cMyBP-C+/−. We propose that the difference in the cMyBP-C−/− vs. cMyBP-Ct/t phenotypes may be a product of differences in expressed protein. Although the cMyBP-Ct/t mouse has been regarded as equivalent to a cMyBP-C null animal (Sadayappan et al., 2006; Tanner et al., 2014; Jiang et al., 2015), initial reports of this model show expressed protein in myofibrillar preparations, albeit at low levels (McConnell et al., 1999). We hypothesize that small amounts of expressed, truncated cMyBP-C might trigger different cellular signaling than a pure absence of the protein. We also postulate that heterogeneity of disease severity observed in the human population might be influenced by differences in mutations which produce variably reduced amounts of abnormal protein vs. pure protein reduction. Understanding the pathways to HCM manifestation, and how the cardiomyocyte transition from hyperplasia to hypertrophy influences this course may provide novel insight into this enigmatic disease and allow development of more effective preventative treatments for families known to harbor pathologic mutations.
Conclusion
A murine HCM model in which cMyBP-C is genetically ablated presents shortly after birth with elevated cardiomyocyte hyperplasia before onset of pathologic cellular hypertrophy evident by PND9. This work implicates cell cycle pathway dysregulation and cardiomyocyte proliferation as early responses that precede the cellular hypertrophic response, and may have implications for the severity of hypertrophy. These data and those from other model systems suggest a relationship between cell cycle and hypertrophic signaling pathways occurring during a critical time period in HCM disease pathogenesis. Awareness of the potential for interplay between cell cycling/proliferation and the hypertrophic signaling pathways provides a new opportunity to expand our understanding of cardiac physiology in both health and disease.
Author Contributions
EF was involved in study design, data collection and analysis, interpretation, writing, and editing. AG was involved in study design, data collection and analysis, writing, interpretation, and editing. AA was involved in data collection and analysis, interpretation, and editing. WdL was involved in study design, data collection and analysis, interpretation, writing and editing. JR was involved in study design, interpretation, writing, and editing.
Funding
This work was supported by R01HL107367-01 (JR).
Conflict of Interest Statement
The authors declare that the research was conducted in the absence of any commercial or financial relationships that could be construed as a potential conflict of interest.
Acknowledgments
The authors would like to thank Tim Hacker, director of the Cardiovascular Physiology Core Facility at the University of Wisconsin, for echocardiography services, as well as Ella Ward and Joseph Hardin at the UW Carbone Cancer Center, Madison, WI, for preparing cryosections (Ella Ward) and for expert advice on IHC (Joe Hardin).
Supplementary Material
The Supplementary Material for this article can be found online at: http://journal.frontiersin.org/article/10.3389/fphys.2017.00414/full#supplementary-material
Abbreviations
AMP, adenosine monophosphate; APC, anaphase-promoting complex; BW, body weight; Ccna2, cyclin A2; Cdc25c, cell division cycle 25c; Cdk, cyclin dependent kinase; cMyBP-C, cardiac myosin binding protein C (protein); DCM, dilated cardiomyopathy; E, embryonic day; Erk 1/2, extracellular-signal-regulated kinases; GC-A, guanylyl cyclase A; HCM, hypertrophic cardiomyopathy; HW, heart weight; IPA, Ingenuity Pathway Analysis; IVRT, isovolumetric relaxation time; KEGG, The Kyoto Encyclopedia of Genes and Genomes; LVAW, left ventricular anterior wall thickness; LVPWs, left ventricular posterior wall thickness (during systole); MHC, myosin heavy chain; MYBPC3, human cardiac myosin binding protein C (gene); Mybpc3, mouse cardiac myosin binding protein C (gene); Myh6, beta myosin heavy chain (gene); Myh7, alpha myosin heavy chain (gene); Nppa, atrial natriuretic peptide A; PND, postnatal day; Prkag2, protein kinase AMP-activated non-catalytic subunit gamma 2; SCD, sudden cardiac death; WGA, wheat germ agglutinin; WT, wild-type.
References
Alfares, A. A., Kelly, M. A., McDermott, G., Funke, B. H., Lebo, M. S., Baxter, S. B., et al. (2015). Results of clinical genetic testing of 2,912 probands with hypertrophic cardiomyopathy: expanded panels offer limited additional sensitivity. Genet. Med. 17, 880–888. doi: 10.1038/gim.2014.205
Cannon, L., Yu, Z. Y., Marciniec, T., Waardenberg, A. J., Iismaa, S. E., Nikolova-Krstevski, V., et al. (2015). Irreversible triggers for hypertrophic cardiomyopathy are established in the early postnatal period. J. Am. Coll. Cardiol. 65, 560–569. doi: 10.1016/j.jacc.2014.10.069
Chen, P. P., Patel, J. R., Powers, P. A., Fitzsimons, D. P., and Moss, R. L. (2012). Dissociation of structural and functional phenotypes in cardiac myosin-binding protein C conditional knockout mice. Circulation 126, 1194–1205. doi: 10.1161/CIRCULATIONAHA.111.089219
Cheng, Y., Wan, X., McElfresh, T. A., Chen, X., Gresham, K. S., Rosenbaum, D. S., et al. (2013). Impaired contractile function due to decreased cardiac myosin binding protein C content in the sarcomere. Am. J. Physiol. Heart Circ. Physiol. 305, H52–65. doi: 10.1152/ajpheart.00929.2012
Davies, M. J., and McKenna, W. J. (1995). Hypertrophic cardiomyopathy–pathology and pathogenesis. Histopathology 26, 493–500. doi: 10.1111/j.1365-2559.1995.tb00267.x
de Lange, W. J., Grimes, A. C., Hegge, L. F., and Ralphe, J. C. (2013). Ablation of cardiac myosin-binding protein-C accelerates contractile kinetics in engineered cardiac tissue. J. Gen. Physiol. 141, 73–84. doi: 10.1085/jgp.201210837
de Lange, W. J., Hegge, L. F., Grimes, A. C., Tong, C. W., Brost, T. M., Moss, R. L., et al. (2011). Neonatal mouse-derived engineered cardiac tissue: a novel model system for studying genetic heart disease. Circ. Res. 109, 8–19. doi: 10.1161/CIRCRESAHA.111.242354
Fananapazir, L., and Epstein, N. D. (1994). Genotype-phenotype correlations in hypertrophic cardiomyopathy. Insights provided by comparisons of kindreds with distinct and identical beta-myosin heavy chain gene mutations. Circulation 89, 22–32. doi: 10.1161/01.CIR.89.1.22
Fananapazir, L., and Epstein, S. E. (1991). Value of electrophysiologic studies in hypertrophic cardiomyopathy treated with amiodarone. Am. J. Cardiol. 67, 175–182. doi: 10.1016/0002-9149(91)90441-M
Gruen, M., and Gautel, M. (1999). Mutations in beta-myosin S2 that cause familial hypertrophic cardiomyopathy (FHC) abolish the interaction with the regulatory domain of myosin-binding protein-C. J. Mol. Biol. 286, 933–949. doi: 10.1006/jmbi.1998.2522
Harris, S. P., Bartley, C. R., Hacker, T. A., McDonald, K. S., Douglas, P. S., Greaser, M. L., et al. (2002). Hypertrophic cardiomyopathy in cardiac myosin binding protein-C knockout mice. Circ. Res. 90, 594–601. doi: 10.1161/01.RES.0000012222.70819.64
Harris, S. P., Lyons, R. G., and Bezold, K. L. (2011). In the thick of it: HCM-causing mutations in myosin binding proteins of the thick filament. Circ. Res. 108, 751–764. doi: 10.1161/CIRCRESAHA.110.231670
Jiang, J., Burgon, P. G., Wakimoto, H., Onoue, K., Gorham, J. M., O'Meara, C. C., et al. (2015). Cardiac myosin binding protein C regulates postnatal myocyte cytokinesis. Proc. Natl. Acad. Sci. U.S.A. 112, 9046–9051. doi: 10.1073/pnas.1511004112
Jiang, J., Wakimoto, H., Seidman, J. G., and Seidman, C. E. (2013). Allele-specific silencing of mutant Myh6 transcripts in mice suppresses hypertrophic cardiomyopathy. Science 342, 111–114. doi: 10.1126/science.1236921
Kim, M., Hunter, R. W., Garcia-Menendez, L., Gong, G., Yang, Y. Y., Kolwicz, S. C. Jr., et al. (2014). Mutation in the gamma2-subunit of AMP-activated protein kinase stimulates cardiomyocyte proliferation and hypertrophy independent of glycogen storage. Circ. Res. 114, 966–975. doi: 10.1161/CIRCRESAHA.114.302364
Korte, F. S., McDonald, K. S., Harris, S. P., and Moss, R. L. (2003). Loaded shortening, power output, and rate of force redevelopment are increased with knockout of cardiac myosin binding protein-C. Circ. Res. 93, 752–758. doi: 10.1161/01.RES.0000096363.85588.9A
Labeit, S., Gautel, M., Lakey, A., and Trinick, J. (1992). Towards a molecular understanding of titin. EMBO J. 11, 1711–1716.
McConnell, B. K., Jones, K. A., Fatkin, D., Arroyo, L. H., Lee, R. T., Aristizabal, O., et al. (1999). Dilated cardiomyopathy in homozygous myosin-binding protein-C mutant mice. J. Clin. Invest. 104, 1235–1244. doi: 10.1172/JCI7377
Mollova, M., Bersell, K., Walsh, S., Savla, J., Das, L. T., Park, S. Y., et al. (2013). Cardiomyocyte proliferation contributes to heart growth in young humans. Proc. Natl. Acad. Sci. U.S.A. 110, 1446–1451. doi: 10.1073/pnas.1214608110
Moss, R. L., Fitzsimons, D. P., and Ralphe, J. C. (2015). Cardiac MyBP-C regulates the rate and force of contraction in mammalian myocardium. Circ. Res. 116, 183–192. doi: 10.1161/CIRCRESAHA.116.300561
Naqvi, N., Li, M., Calvert, J. W., Tejada, T., Lambert, J. P., Wu, J., et al. (2014). A proliferative burst during preadolescence establishes the final cardiomyocyte number. Cell 157, 795–807. doi: 10.1016/j.cell.2014.03.035
Okagaki, T., Weber, F. E., Fischman, D. A., Vaughan, K. T., Mikawa, T., and Reinach, F. C. (1993). The major myosin-binding domain of skeletal muscle MyBP-C (C protein) resides in the COOH-terminal, immunoglobulin C2 motif. J. Cell Biol. 123, 619–626. doi: 10.1083/jcb.123.3.619
Olivotto, I., Girolami, F., Ackerman, M. J., Nistri, S., Bos, J. M., Zachara, E., et al. (2008). Myofilament protein gene mutation screening and outcome of patients with hypertrophic cardiomyopathy. Mayo Clin. Proc. 83, 630–638. doi: 10.1016/S0025-6196(11)60890-2
Omelyanenko, N. P., Slutsky, L. I., and Mironov, S. P. (2013). Connective Tissue: Histophysiology, Biochemistry, Molecular Biology. Boca Raton, FL: Taylor & Francis.
Porrello, E. R., Mahmoud, A. I., Simpson, E., Hill, J. A., Richardson, J. A., Olson, E. N., et al. (2011). Transient regenerative potential of the neonatal mouse heart. Science 331, 1078–1080. doi: 10.1126/science.1200708
Razumova, M. V., Shaffer, J. F., Tu, A. Y., Flint, G. V., Regnier, M., and Harris, S. P. (2006). Effects of the N-terminal domains of myosin binding protein-C in an in vitro motility assay: evidence for long-lived cross-bridges. J. Biol. Chem. 281, 35846–35854. doi: 10.1074/jbc.M606949200
Richard, P., Charron, P., Carrier, L., Ledeuil, C., Cheav, T., Pichereau, C., et al. (2003). Hypertrophic cardiomyopathy: distribution of disease genes, spectrum of mutations, and implications for a molecular diagnosis strategy. Circulation 107, 2227–2232. doi: 10.1161/01.CIR.0000066323.15244.54
Ripoll Vera, T., Monserrat Iglesias, L., Hermida Prieto, M., Ortiz, M., Rodriguez Garcia, I., Govea Callizo, N., et al. (2010). The R820W mutation in the MYBPC3 gene, associated with hypertrophic cardiomyopathy in cats, causes hypertrophic cardiomyopathy and left ventricular non-compaction in humans. Int. J. Cardiol. 145, 405–407. doi: 10.1016/j.ijcard.2010.04.032
Sadayappan, S., Osinska, H., Klevitsky, R., Lorenz, J. N., Sargent, M., Molkentin, J. D., et al. (2006). Cardiac myosin binding protein C phosphorylation is cardioprotective. Proc. Natl. Acad. Sci. U.S.A. 103, 16918–16923. doi: 10.1073/pnas.0607069103
Schipke, J., Roloff, K., Kuhn, M., and Mühlfeld, C. (2015). Systemic, but not cardiomyocyte-specific, deletion of the natriuretic peptide receptor guanylyl cyclase A increases cardiomyocyte number in neonatal mice. Histochem. Cell Biol. 144, 365–375. doi: 10.1007/s00418-015-1337-z
Semsarian, C., Ingles, J., Maron, M. S., and Maron, B. J. (2015). New perspectives on the prevalence of hypertrophic cardiomyopathy. J. Am. Coll. Cardiol. 65, 1249–1254. doi: 10.1016/j.jacc.2015.01.019
Spirito, P., Seidman, C. E., McKenna, W. J., and Maron, B. J. (1997). The management of hypertrophic cardiomyopathy. N. Engl. J. Med. 336, 775–785. doi: 10.1056/NEJM199703133361107
Stelzer, J. E., Fitzsimons, D. P., and Moss, R. L. (2006). Ablation of myosin-binding protein-C accelerates force development in mouse myocardium. Biophys. J. 90, 4119–4127. doi: 10.1529/biophysj.105.078147
Tanner, B. C., Wang, Y., Robbins, J., and Palmer, B. M. (2014). Kinetics of cardiac myosin isoforms in mouse myocardium are affected differently by presence of myosin binding protein-C. J. Muscle Res. Cell Motil. 35, 267–278. doi: 10.1007/s10974-014-9390-0
Tong, C. W., Stelzer, J. E., Greaser, M. L., Powers, P. A., and Moss, R. L. (2008). Acceleration of crossbridge kinetics by protein kinase A phosphorylation of cardiac myosin binding protein C modulates cardiac function. Circ. Res. 103, 974–982. doi: 10.1161/CIRCRESAHA.108.177683
Van Driest, S. L., Vasile, V. C., Ommen, S. R., Will, M. L., Tajik, A. J., Gersh, B. J., et al. (2004). Myosin binding protein C mutations and compound heterozygosity in hypertrophic cardiomyopathy. J. Am. Coll. Cardiol. 44, 1903–1910. doi: 10.1016/j.jacc.2004.07.045
Walsh, S., Ponten, A., Fleischmann, B. K., and Jovinge, S. (2010). Cardiomyocyte cell cycle control and growth estimation in vivo–an analysis based on cardiomyocyte nuclei. Cardiovasc. Res. 86, 365–373. doi: 10.1093/cvr/cvq005
Xin, B., Puffenberger, E., Tumbush, J., Bockoven, J. R., and Wang, H. (2007). Homozygosity for a novel splice site mutation in the cardiac myosin-binding protein C gene causes severe neonatal hypertrophic cardiomyopathy. Am. J. Med. Genet. A 143A, 2662–2667. doi: 10.1002/ajmg.a.31981
Keywords: hypertrophic cardiomyopathy, HCM, myosin binding protein C, MyBP-C, hyperplasia, proliferation, cell cycling
Citation: Farrell ET, Grimes AC, de Lange WJ, Armstrong AE and Ralphe JC (2017) Increased Postnatal Cardiac Hyperplasia Precedes Cardiomyocyte Hypertrophy in a Model of Hypertrophic Cardiomyopathy. Front. Physiol. 8:414. doi: 10.3389/fphys.2017.00414
Received: 27 April 2017; Accepted: 30 May 2017;
Published: 14 June 2017.
Edited by:
P. Bryant Chase, Florida State University, United StatesReviewed by:
Sakthivel Sadayappan, University of Cincinnati, United StatesAaron Olson, University of Washington, United States
Copyright © 2017 Farrell, Grimes, de Lange, Armstrong and Ralphe. This is an open-access article distributed under the terms of the Creative Commons Attribution License (CC BY). The use, distribution or reproduction in other forums is permitted, provided the original author(s) or licensor are credited and that the original publication in this journal is cited, in accordance with accepted academic practice. No use, distribution or reproduction is permitted which does not comply with these terms.
*Correspondence: J. Carter Ralphe, jcralphe@pediatrics.wisc.edu
†These authors have contributed equally to this work.