 Kent M. Reed
 Kristelle M. Mendoza
 Gale M. Strasburg
 Sandra G. Velleman
- 1Department of Veterinary and Biomedical Sciences, University of Minnesota, St. Paul, MN, United States
- 2Department of Food Science and Human Nutrition, Michigan State University, East Lansing, MI, United States
- 3Department of Animal Sciences, Ohio Agricultural Research and Development Center, Ohio State University, Wooster, OH, United States
Background: Exposure of poultry to extreme temperatures during the critical period of post-hatch growth can seriously affect muscle development and thus compromise subsequent meat quality. This study was designed to characterize transcriptional changes induced in turkey muscle satellite cells by thermal challenge during differentiation. Our goal is to better define how thermal stress alters breast muscle ultrastructure and subsequent development.
Results: Skeletal muscle satellite cells previously isolated from the Pectoralis major muscle of 7-wk-old male turkeys (Meleagris gallopavo) from two breeding lines: the F-line (16 wk body weight-selected) and RBC2 (randombred control line) were used in this study. Cultured cells were induced to differentiate at 38°C (control) or thermal challenge temperatures of 33 or 43°C. After 48 h of differentiation, cells were harvested and total RNA was isolated for RNAseq analysis. Analysis of 39.9 Gb of sequence found 89% mapped to the turkey genome (UMD5.0, annotation 101) with average expression of 18,917 genes per library. In the cultured satellite cells, slow/cardiac muscle isoforms are generally present in greater abundance than fast skeletal isoforms. Statistically significant differences in gene expression were observed among treatments and between turkey lines, with a greater number of genes affected in the F-line cells following cold treatment whereas more differentially expressed (DE) genes were observed in the RBC2 cells following heat treatment. Many of the most significant pathways involved signaling, consistent with ongoing cellular differentiation. Regulation of Ca2+ homeostasis appears to be significantly affected by temperature treatment, particularly cold treatment.
Conclusions: Satellite cell differentiation is directly influenced by temperature at the level of gene transcription with greater effects attributed to selection for fast growth. At lower temperature, muscle-associated genes in the satellite cells were among the genes with the greatest down regulation consistent with slower differentiation and smaller myotubes. Fewer expression differences were observed in the differentiating cells than previously observed for proliferating cells. This suggests the impact of temperature on satellite cells occurs primarily at early points in satellite cell activation.
Introduction
Skeletal muscle hypertrophy is a multifaceted process. During embryonic development, undifferentiated cells in the mesoderm (myoblasts) proliferate, differentiate, and fuse to form multinucleated myotubes that further differentiate into muscle fibers. Subsequent muscle growth is dependent upon satellite cells; stem cells located between the basement membrane and sarcolemma of skeletal muscle fibers (Mauro, 1961; Moss and Leblond, 1971). Satellite cells are self-renewing mesenchymal cells that enable further hypertrophy, maintenance, and repair of damaged skeletal muscle. After initial muscle growth and development, satellite cells become quiescent unless activated by antagonized Notch and Wnt signaling (reviewed in Fujimaki et al., 2013). Evidence from cell culture studies suggest that satellite cells are multi-potential and can be induced to follow osteogenic or adipogenic cellular pathways in addition to myogenesis (Asakura et al., 2001; Powell et al., 2016).
In the early post-hatch period, avian satellite cells are highly active (Halevy et al., 2000; Mozdziak et al., 2002). This activity can be directly affected by environmental stimuli with potential long-lasting effects on skeletal muscle growth (Piestun et al., 2013; Loyau et al., 2014). Thermal challenge is especially impactful on poults. Newly-hatched birds have immature thermoregulatory systems and are more susceptible to the effects of extreme ambient temperature (Myhre, 1978; Modrey and Nichelmann, 1992; Shinder et al., 2007). Given the need to transfer poults from hatch to grow facilities, this is also the period where birds are often exposed to acute thermal conditions, either hot or cold. The timing of thermal stress can differentially affect production performance. For example, broilers exposed early posthatch to elevated temperatures show increased body weight and yield at market age (Yahav and Plavnik, 1999; Yahav and McMurtry, 2001). Birds reared in elevated temperatures during later posthatch growth had reduced feed intake, weight gain, and meat yield (Ain Baziz et al., 1996; Halevy et al., 2001; Zhang et al., 2012).
Genetic selection has resulted in poultry with greater breast muscle weights and shorter growth periods (Havenstein et al., 2007). Satellite cells are in part responsible for the increase degree of muscle growth as the rates of satellite cell proliferation and differentiation are higher in birds selected for increased growth (Velleman et al., 2000). Extreme growth however, can be accompanied by physiological muscle defects that affect yield (Siller and Wight, 1979; Wilson et al., 1990). For example, increase in muscle fiber size displaces capillaries causing reduced blood supply, reduced heat dissipation and the accumulation of metabolic waste products (Sosnicki et al., 1991a,b; Kurnoth et al., 1994). Growth-selected birds respond differently to elevated environmental temperatures. The effects of long-term thermal stress on skeletal muscle growth and muscle damage is greater in fast-growing meat-type broilers as compared to slow-growing broilers (Ain Baziz et al., 1996; Lu et al., 2007).
As satellite cells are the only posthatch myonuclear source, they may directly modify skeletal muscle growth if functionally altered by temperature. Clark et al. (2016a) demonstrated in vitro that turkey satellite cell function is sensitive to both hot and cold temperatures with expression of key myogenic regulatory factors (myogenic differentiation factor, MYOD1 and myogenin, MYOG) increasing with temperature. In addition, proliferation of satellite cells from growth-selected turkeys was increased compared to that of cells from a non-selected line when incubated at higher temperatures. The differential response of fast- and slow-growing turkeys to temperature may be due to differences in satellite cell thermal sensitivity. Understanding the interaction between temperature and muscle growth and its impact on yield is significant to the poultry industry.
Previously, we utilized cultured turkey satellite cells to study the effects of thermal challenge on the transcriptome of proliferating satellite cells (Reed et al., 2017). Significant gene expression differences were observed between cells incubated at both hot and cold temperatures. Enrichment analysis indicated a shift in cold-treated cells toward cell signaling whereas heat-treated cells had expression profiles shifted toward muscle development. Markers of cell proliferation such as MYOD1 and several interacting genes were significantly upregulated in the heat-exposed cells and differential expression of chief myogenic regulators and pathways activated by Wnt ligands were observed. Greater differences in gene expression were observed for satellite cells from growth-selected birds as compared to random bred controls. The present study uses RNAseq transcriptome analysis to characterize gene expression in differentiating satellite cells under the same thermal challenge model. Understanding how temperature affects satellite cell differentiation can potentially be used to develop thermal management strategies to improve skeletal muscle growth.
Methods
Turkey Myogenic Satellite Cells
Satellite cells used in this study were previously isolated from the pectoralis major (p. major) muscle of 7 wk old males from two turkey lines; the random bred control 2 (RBC2) and body weight-selected (F) (Velleman et al., 2000). The RBC2 line is maintained without conscious selection for any trait and the F line is derived from the RBC2 line and selected for 16 wk body weight (Nestor, 1977, 1984).
Turkey p. major satellite cells were replicate plated and proliferated as described in Reed et al. (2017). After 72 h of proliferation at 38°C, the growth medium was removed and the cells were fed a lower-serum medium containing DMEM, 3% horse serum (Gemini BioProducts), 1% antibiotics-antimycotics (Gemini BioProducts), 0.1% gentamicin (Gemini BioProducts), and 1 mg/mL bovine serum albumin (BSA, Sigma Aldrich) to induce differentiation. Cells were cultured in 95% air/5%CO2 incubators at 38°C (control) or at an experimental temperature (33 or 43°C). Medium was changed at 24 h. The control temperature of 38°C is approximately equal to that measured in newly hatched poults (38.0–38.5°C; Strasburg, unpublished). Initiation of differentiation was characterized by the visual observance of multinucleated myotubules. At the conclusion of the 48 h treatment, cell medium was removed, cells were rinsed with PBS and the plates were held at −80°C until RNA isolation.
RNA Isolation and Sequencing
Total RNA was isolated from each culture by TRIzol extraction (Ambion, Inc.), DNase-treated (Turbo DNA-freeTM Kit, Ambion, Inc.), and stored at −80°C. Initial RNA concentration and quality was measured (Nanodrop 1000) and samples were submitted for library preparation and sequencing at the University of Minnesota Genomics Center (UMGC). Samples were quantified by RiboGreen Assay and RNA integrity was measured on a 2100 Bioanalyzer (Aligent Technologies). All sample had clear peak separation (18S and 28S) and RNA Integrity Numbers (RIN) ranged between 5.1 and 8.8. Indexed libraries were constructed with the TruSeq RNA Sample Preparation Kit version 2 (Illumina, Inc.) from 1 μg of total RNA/sample. Libraries were multiplexed, pooled and sequenced (101-bp paired-end reads) on the HiSeq 2000 using v3 chemistry (Illumina, Inc.). Replicate samples were sequenced from each treatment group (n = 12 libraries).
RNAseq Data Analyses
Trimmomatic (Bolger et al., 2014) was used to remove sequence adapters and low quality bases and quality control checks were performed with FastQC (Andrews, 2010). Groomed reads were subsequently mapped to the turkey genome (UMD 5.0, NCBI Annotation 101) with Bowtie (v2.2.4.0). Read counts were normalized in CLC Genomics Workbench (CLCGWB v. 8.0.2, CLC Bio) as described in Reed et al. (2017). Using normalized read counts, samples were hierarchically clustered based on Euclidean sample distances with single linkage and principal component analysis (PCA) was performed in CLCGWB. Differential gene expression and ANOVA was performed in CLCGWB (Bonferroni and FDR corrected) and pair-wise comparisons between treatment groups were made in the Bioconductor (3.2) R package DESeq2 (Love et al., 2014) under the standard workflow. For all comparisons, p < 0.05 were considered significant. Affected gene pathways were investigated with Ingenuity Pathway Analysis (IPA, Qiagen Bioinformatics). For analysis, the turkey annotated gene set, was mapped to the IPA database (11,615 IDs) and Log2FC and FDR-corrected p-values were imported. Core and comparative analyses of gene expression were run with FDR p-val cutoff set at 0.05. The PANTHER Overrepresentation Test (release 20150430, Mi et al., 2013; http://geneontology.org/) was used to test for gene enrichment. Data are deposited in the NCBI's Gene Expression Omnibus (GEO) repository as part of SRA BioProject 341399.
Results
Total RNA isolated from satellite cell cultures was used to construct 12 individual barcoded libraries. Sequencing of the libraries produced over 394 M combined reads with the number of reads per library ranging from 12.4 to 18.5 M (average 16.4 M). After read trimming and filtering, median read quality was consistently high and ranged from 36.8 to 37.3. Replicate libraries for each treatment produced comparable results with the number of reads per treatment group ranging from 29 to 36.4 M (average 32.9 ± 1.25 M reads). Cumulatively, corrected reads comprised 39.9 Gb of sequence for transcriptome analysis. Mean library insert was estimated from mapping results as 213.4 bp (Table 1).
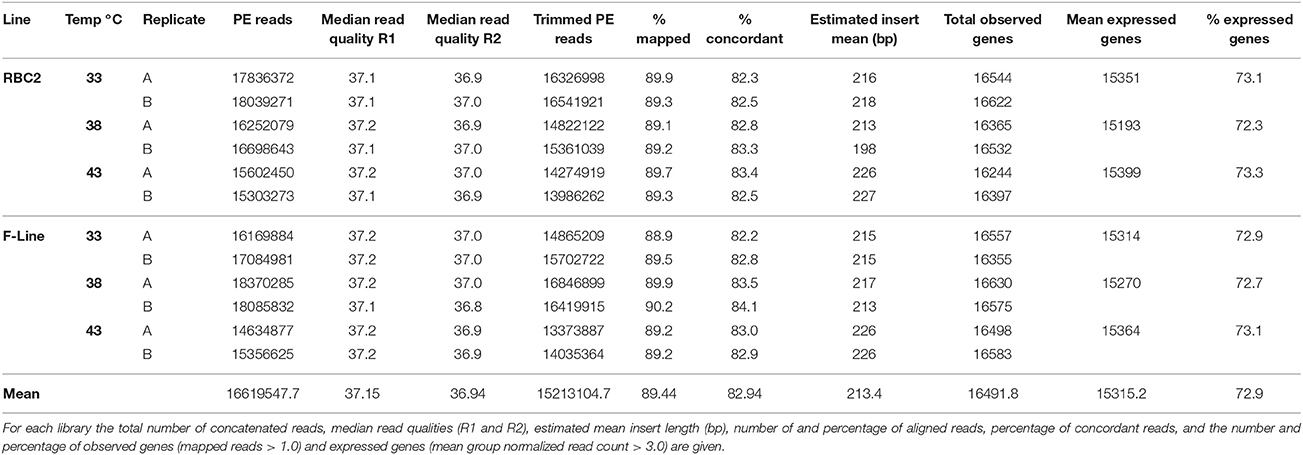
Table 1. Summary of RNA-seq data.
Gene Expression
Approximately 89% of the quality trimmed fragments mapped uniquely to the annotated turkey gene set, and on average, 82.9% mapped concordantly (Table 1). Evidence for expression (at least one mapped read) in at least one treatment group was observed for 18,917 genes (average 16,491 per group, 78.5% of the turkey gene set) with a mean depth of 464 ± 28.9 (SE) reads/gene (Table S1). Using an expression cutoff for the average number of mapped reads = 3.0 resulted in 16,582 experiment-wise expressed genes (tRNAs excluded) with 14,038 shared in common among the six treatment groups. Within treatment groups, the mean number of expressed genes (average # of mapped reads ≥ 3.0) ranged from 15,193 to 15,399 and included on average 72.9% of the turkey gene set (Table 1).
Variation among groups was evaluated by principal component analysis (PCA) of normalized read counts (Figure 1). Treatment groups clustered distinctly by Temp/Time within the first two principal components explaining ~98% of the observed variation. The relationships among treatment groups shown by PCA, with clustering by incubation temperature then turkey type, were reiterated in the hierarchical clustering of groups by Euclidean distance (Figure S1). Replicate treatment pairs clustered together as nearest neighbors, supporting the pooling of replicates for expression analyses.
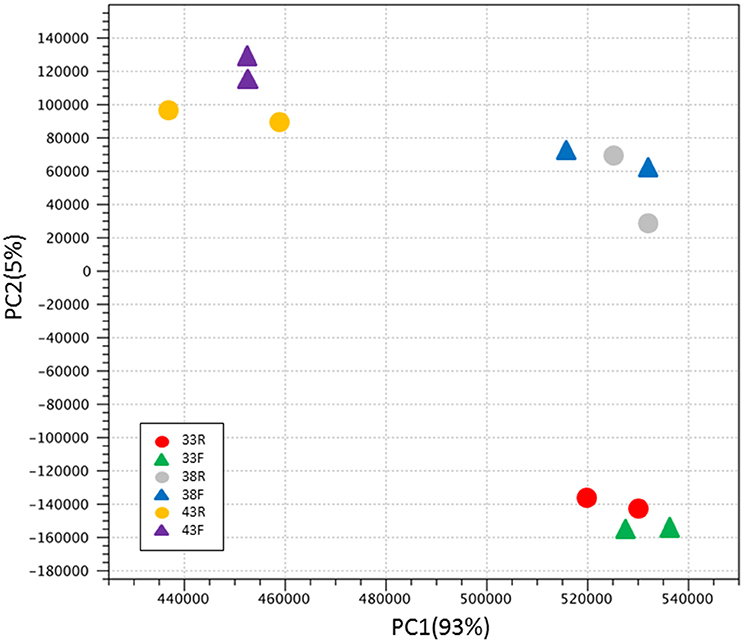
Figure 1. Principal component analysis (PCA) of normalized RNAseq read counts. Sample to sample distances (within- and between-treatments) are illustrated for each dataset on the first two principle components comprising ~98% of the variation. Samples are plotted according to treatment.
Distribution of expressed genes (unique and shared) among treatment groups is summarized in Table 2. The number of uniquely expressed genes in the satellite cells was higher at both cold and hot temperatures as compared to control (38°C) in both lines. In paired comparisons between temperature treatments, the number of uniquely expressed genes was higher in both the cold and hot treatments than the control temperature (38°C). Within temperature, 14,903 expressed genes were shared on average among the lines (Table 2). Numbers of uniquely expressed genes were comparable being higher for the RBC2 line cells at 33 and 43°C (414 and 437, respectively) but higher for the F-line cells at 38°C (459).
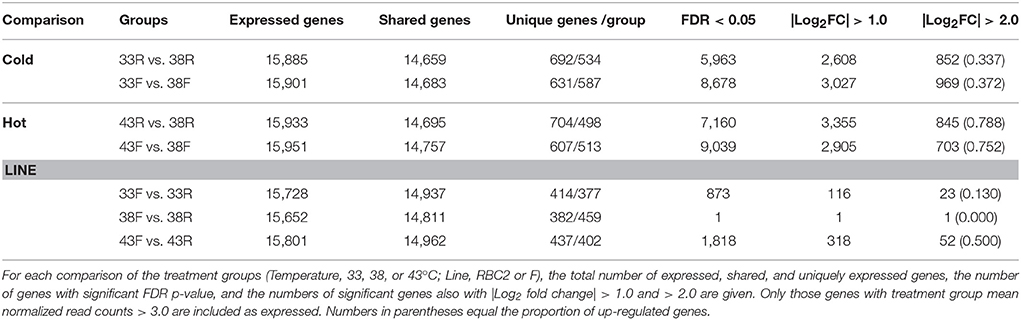
Table 2. Summary of gene expression and significant differential expression (DE) in pair-wise comparisons of differentiating cells.
Ordering and classification of the genes expressed at the control incubation temperature (38°C, Table S2) defines the baseline cellular processes of the satellite cells after 48 h of differentiation. The majority of gene products (68%) expressed by the RBC2 and F-line satellite cells is characterized as nuclear or cytoplasmic proteins (Figure S2). The largest represented functional class of gene products (49%, designated as other) included primarily structural proteins with enzymes (20%) and transcriptional regulators (9%) comprising the next two major groups. A Comparison Analysis between the RBC2 and F-line groups at 38°C was conducted using the normalized read counts for the 8,000 highest expressed genes from the 11,615 gene IDs mapped in the IPA database. The top Metabolic pathways included the tRNA charging pathway (33 of 39 pathway genes associated) and D-myo inositol pathway (Table 3). Myo-inositol is the structural basis for a number of secondary messengers in eukaryotic cells. The top two Signaling pathways included protein ubiquitination (177 of 255 genes associated) and EIF2 signaling (142 of 194 genes). Ubiquitination pathways primarily include the tagging of proteins for degradation by the proteasome whereas the eIF2 initiation complex regulates both global and specific mRNA translation in response to stress-related signals.
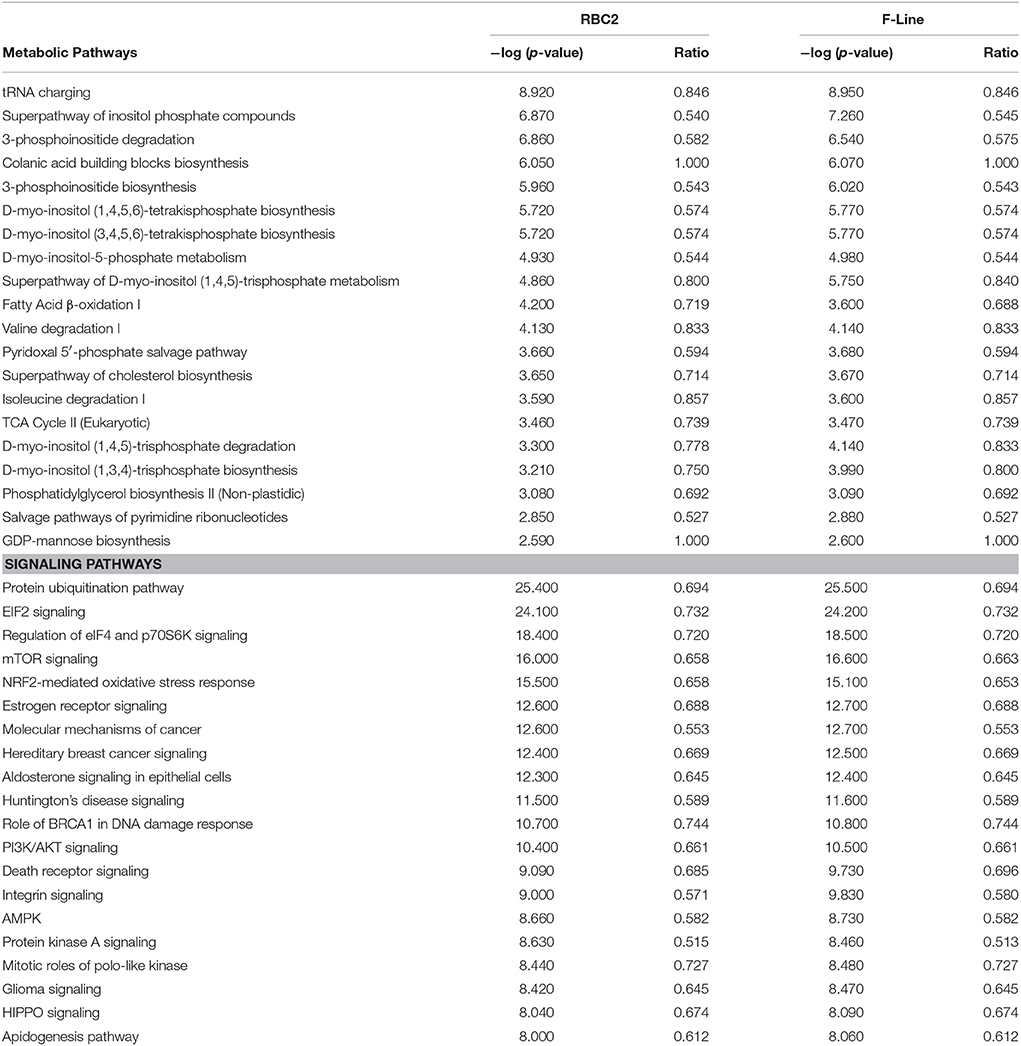
Table 3. Twenty most significant canonical pathways expressed in satellite cell cultures at 38°C after 48 h of differentiation.
RNA-Seq affords the opportunity to gain new insights into temporal gene expression patterns of differentiating satellite cells, particularly with respect to muscle fiber-type-specific proteins. Although, the adult turkey p. major muscle comprises almost exclusively Type IIa (fast-contracting) muscle fibers, the satellite cells in this study which had undergone differentiation for 48 h, primarily expressed mRNAs corresponding to cardiac or slow-contracting sarcomeric and sarcoplasmic reticulum protein isoforms (Table S1). For example, the dominant myosin heavy chain based on number of reads were MYH7B (slow/tonic, cardiac isoform) and the non-muscle isoforms MYH9 and MHY10. Likewise, the cardiac or slow-contracting muscle isoforms of actin (ACTC1), troponin C (TNNC1), troponin T (TNNT2), the sarcoplasmic/endoplasmic reticulum calcium ATPase (ATP2A2), and calsequestrin (CASQ2) predominate relative to their respective fast-contracting muscle isoforms. The adult isoforms of the myosin heavy chains associated with the myofibril (e.g., MYH1, MYH2), were not observed although it is possible that there are reads associated with gene loci that have not yet been annotated. Nevertheless, it is readily apparent that in direct comparisons between fast skeletal muscle isoforms and slow or cardiac isoforms, e.g., actin and the troponin subunits, the slow/cardiac isoforms are generally present in greater abundance.
Differential Expression
Gaussian-based ANOVA found 12,395 genes with significant (FDR p-val < 0.05) experiment-wise differential expression (Figure S3). Seven two-way contrasts were generated based on temperature treatment (cold and hot) and line (RBC2 and F). More significant differentially expressed (DE) genes were identified in the temperature contrasts than between genetic lines within temperature (Table 2, Table S4) and the majority of DE genes were unique to treatment groups (temperature/line; Figure S4).
On average, more genes were significantly affected by cold (33°C) treatment than by heat (43°C; Table 2). Comparison of the cold treated (33°C) to controls (38°C) found a greater number of DE genes in the F-line cells compared to the RBC2 cells (Figure 2, Figure S4). However, the opposite was observed in the 43 vs. 38°C comparison where a greater number of genes were significantly different in the RBC2 cells. Interestingly, the proportion of upregulated genes was ~2-fold higher in the heat-treated cells (0.77 vs. 0.36; Table 2). In the 33 vs. 38°C comparison (Figure 2), 571 (45.7%) of the DE genes were common to the two genetic lines and the number of unique DE genes was higher in the F-line cells compared to the RBC2 (398 [31.8%] and 281 [22.5%], respectively). Fewer DE genes (381, 32.6%) were shared between lines in the 43 vs. 38°C comparison, and the number of unique DE genes was higher in the RBC2 cells compared to the F-line (464 [39.8%] and 281 [27.6%], respectively).
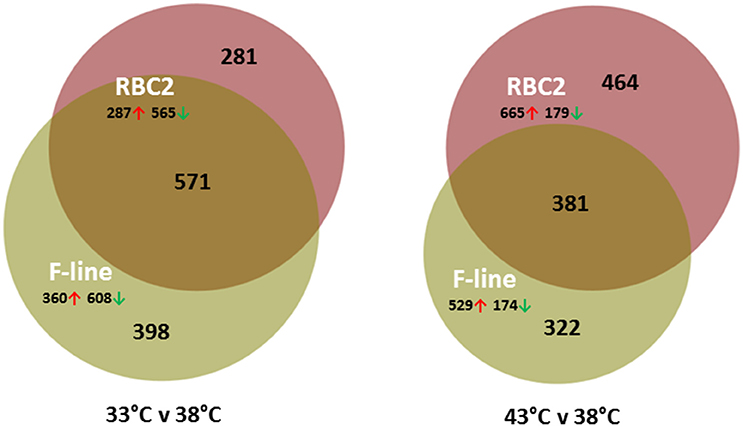
Figure 2. Distribution of differentially expressed genes during differentiation of cultured turkey p. major satellite cells. For each temperature comparison, the number of genes with FDR p < 0.05 and |Log2FC| > 2.0 that were shared or unique to each line (RBC2 and F) are indicated in the Venn diagram. Circle size is proportional to the number of genes.
The majority of DE genes identified in the treatment comparisons were unique to treatment groups (temperature/line; Figure S4). The 50 significant DE genes with the greatest expression change in each comparison are listed in Table S4. Prominent in the 33 vs. 38°C comparisons are the number of myosin-related genes that were significantly down regulated in the satellite cells. The gene with the greatest expression change was neuropeptide Y (NPY) with an average Log2FC = −10.63. In mammals, NPY is produced mainly by neurons in the brain and autonomic nervous system and can stimulate growth of adipose tissue (Wang et al., 2007).
Statistical overrepresentation tests (PANTHER) of genes differentially expressed between the 33 and 38°C found greatest enrichment for the GO Biological Processes of myofibril assembly, regulation of calcium ion import, muscle contraction and muscle development (Table 4). Greatest enrichment of Cellular Components included the troponin complex, muscle thin filament and myofilament, whereas actin and cytoskeletal protein binding were included in the top significantly enriched Molecular Functions. Myofibril assembly (over 13-fold enrichment), tropomyosin binding (28.97 x) and troponin complex (41.39 x) were the top overrepresented categories among the 457 DE genes shared among the F and RBC2 lines in the 33 vs. 38°C comparison. In contrast, overrepresentation tests of genes differentially expressed between the 43 and 38°C found very few significantly enriched categories and low enrichment values (Table 5).
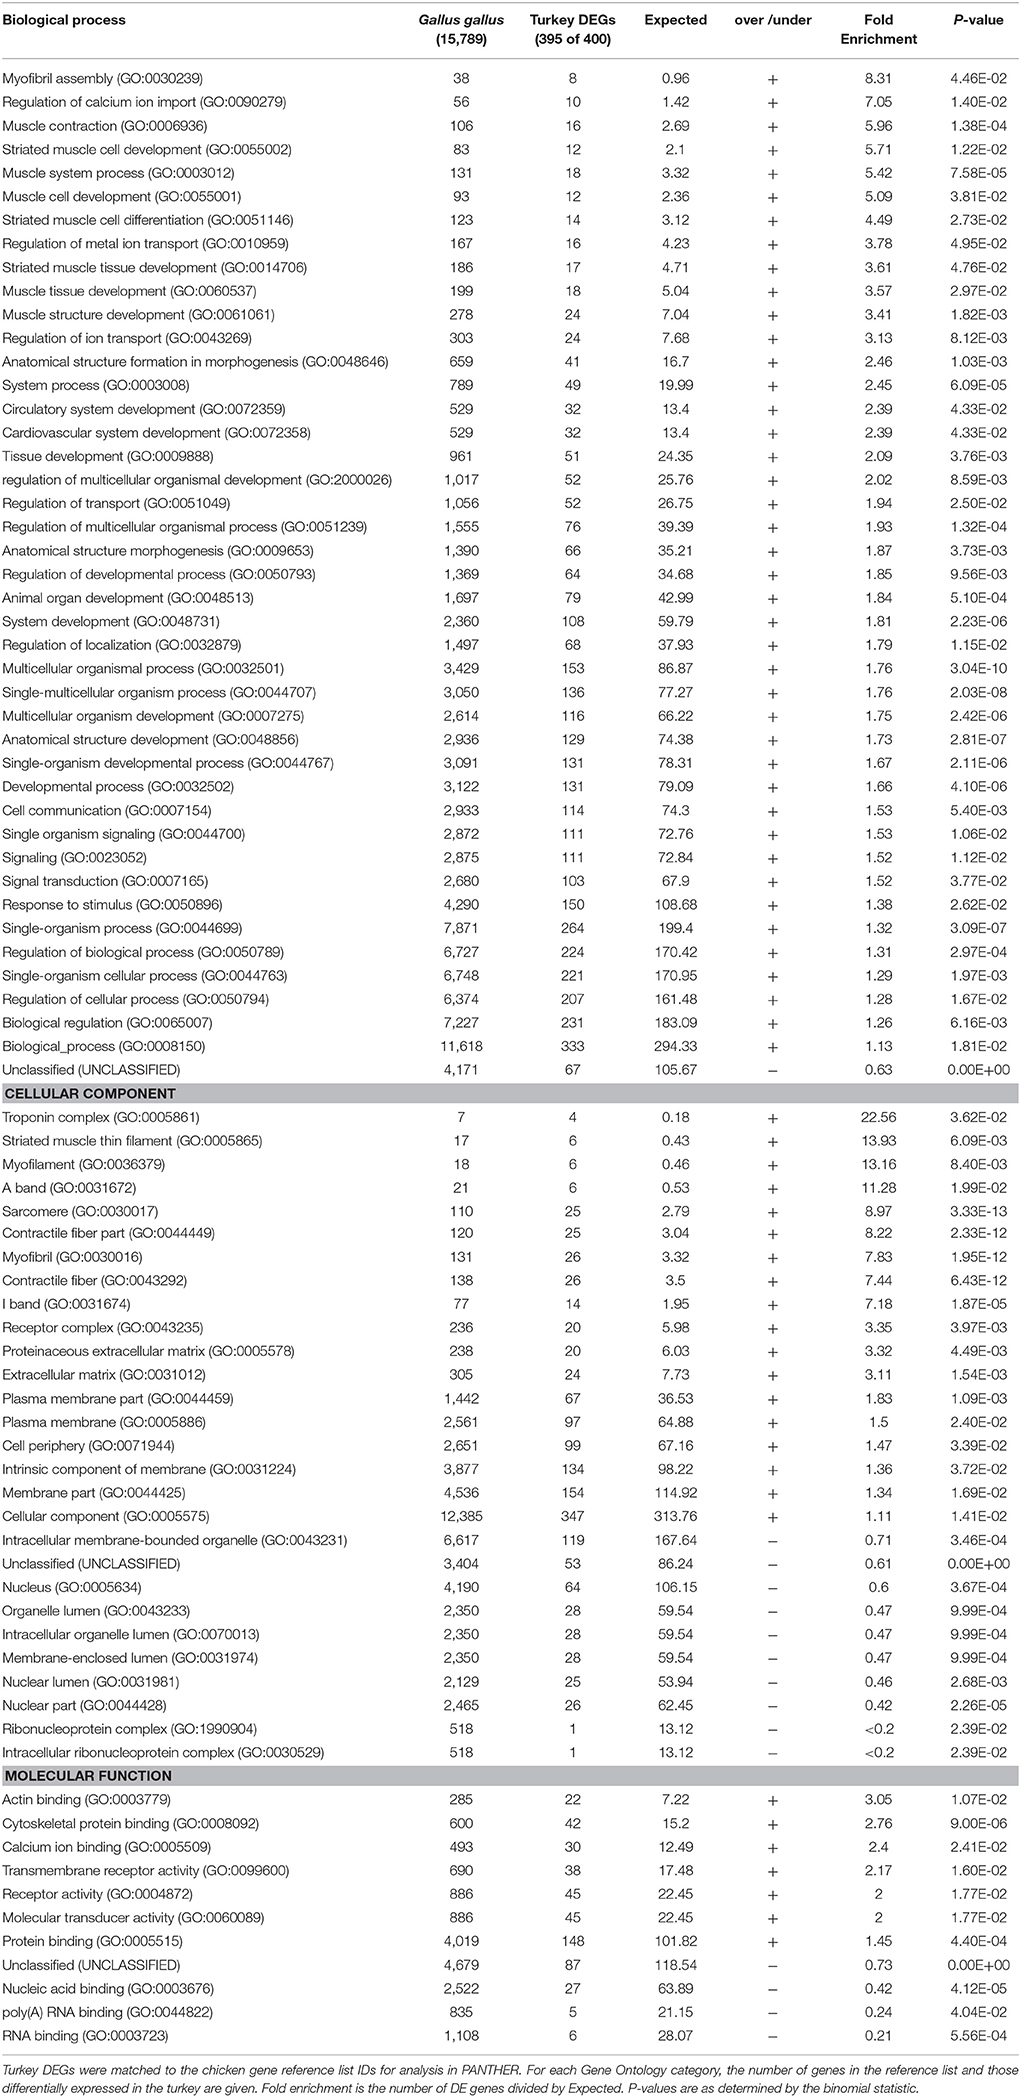
Table 4. Summary of PANTHER Overrepresentation test of the 939 genes differentially expressed in p. major satellite cell cultures after 48 h of differentiation at 33 vs. 38°C.
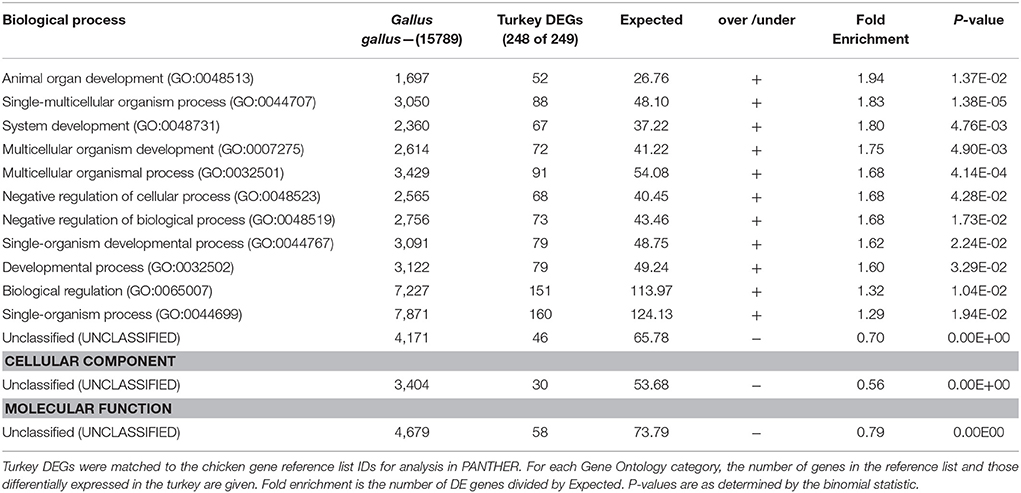
Table 5. Summary of PANTHER Overrepresentation test of the 856 genes differentially expressed in p. major satellite cell cultures after 48 h of differentiation at 43 vs. 38°C.
Analysis of DE genes in IPA outlined several temperature-induced shifts in the satellite cell transcriptomes. The top 10 canonical pathways for each temperature comparison are given in Table S5. Consistent with ongoing cellular development, many of the most significant pathways were signaling pathways. Comparison analysis across treatments identified EIF2 signaling, regulation of eIF4 and p70S6K signaling, mTOR signaling, protein ubiquitination and NRF2-mediated oxidative stress response as the most divergently altered pathways (Figure 3). In general, the first four pathways were most significantly altered in the cold treated cells (primarily by down regulation) whereas the differences seen in the NRF2-mediated OSR pathway were the result of greater bidirectional expression differences.
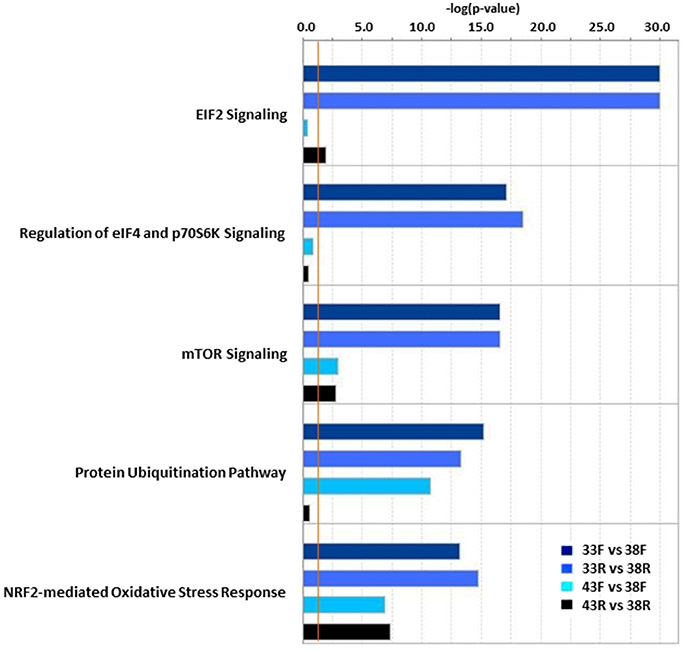
Figure 3. Significant pathway associations identified in IPA Comparison Analysis of thermal challenge vs. control temperature cells. In each pair-wise comparison, P-values are assigned to canonical pathways based on differential expression (DE). Bar plot provides the 5 most variable pathways with significance. Pathway associations must have a −log(p-value) > 1.3 (threshold, vertical orange line).
A total of 2,926 significant DE genes (|Log2FC| > 1.0) was shared among all treatment comparisons, but only 70 had |Log2FC| > 2.0 (Figure S4). The majority of these 70 genes (48) were up regulated in cells from both lines incubated at either higher (43°C) or lower temperatures (33°C) as compared to control (Table 6). In all but two genes, CD36 and GUCA1B, the directionality of the expression changes was the same for all comparisons. Expression of CD36 (thrombospondin receptor) was up regulated at 33°C (average Log2FC = 2.39) but down regulated at 43°C (average Log2FC = −2.37) compared to control. Conversely, expression of GUCA1B (guanylate cyclase activator 1B) was down regulated at 33°C (average Log2FC = −4.75) but up regulated at 43°C (average Log2FC = 3.15) compared to control. CD36 is a member of the class B scavenger receptor family of cell surface proteins and in mammals, acts to import fatty acids inside cells, whereas GUCA1B is a calcium-binding protein that activates guanylate cyclases. These two genes are also represented in the two most significant scoring gene networks identified in IPA analysis of the 70 DE genes shared among the treatment comparisons (Figure S5).
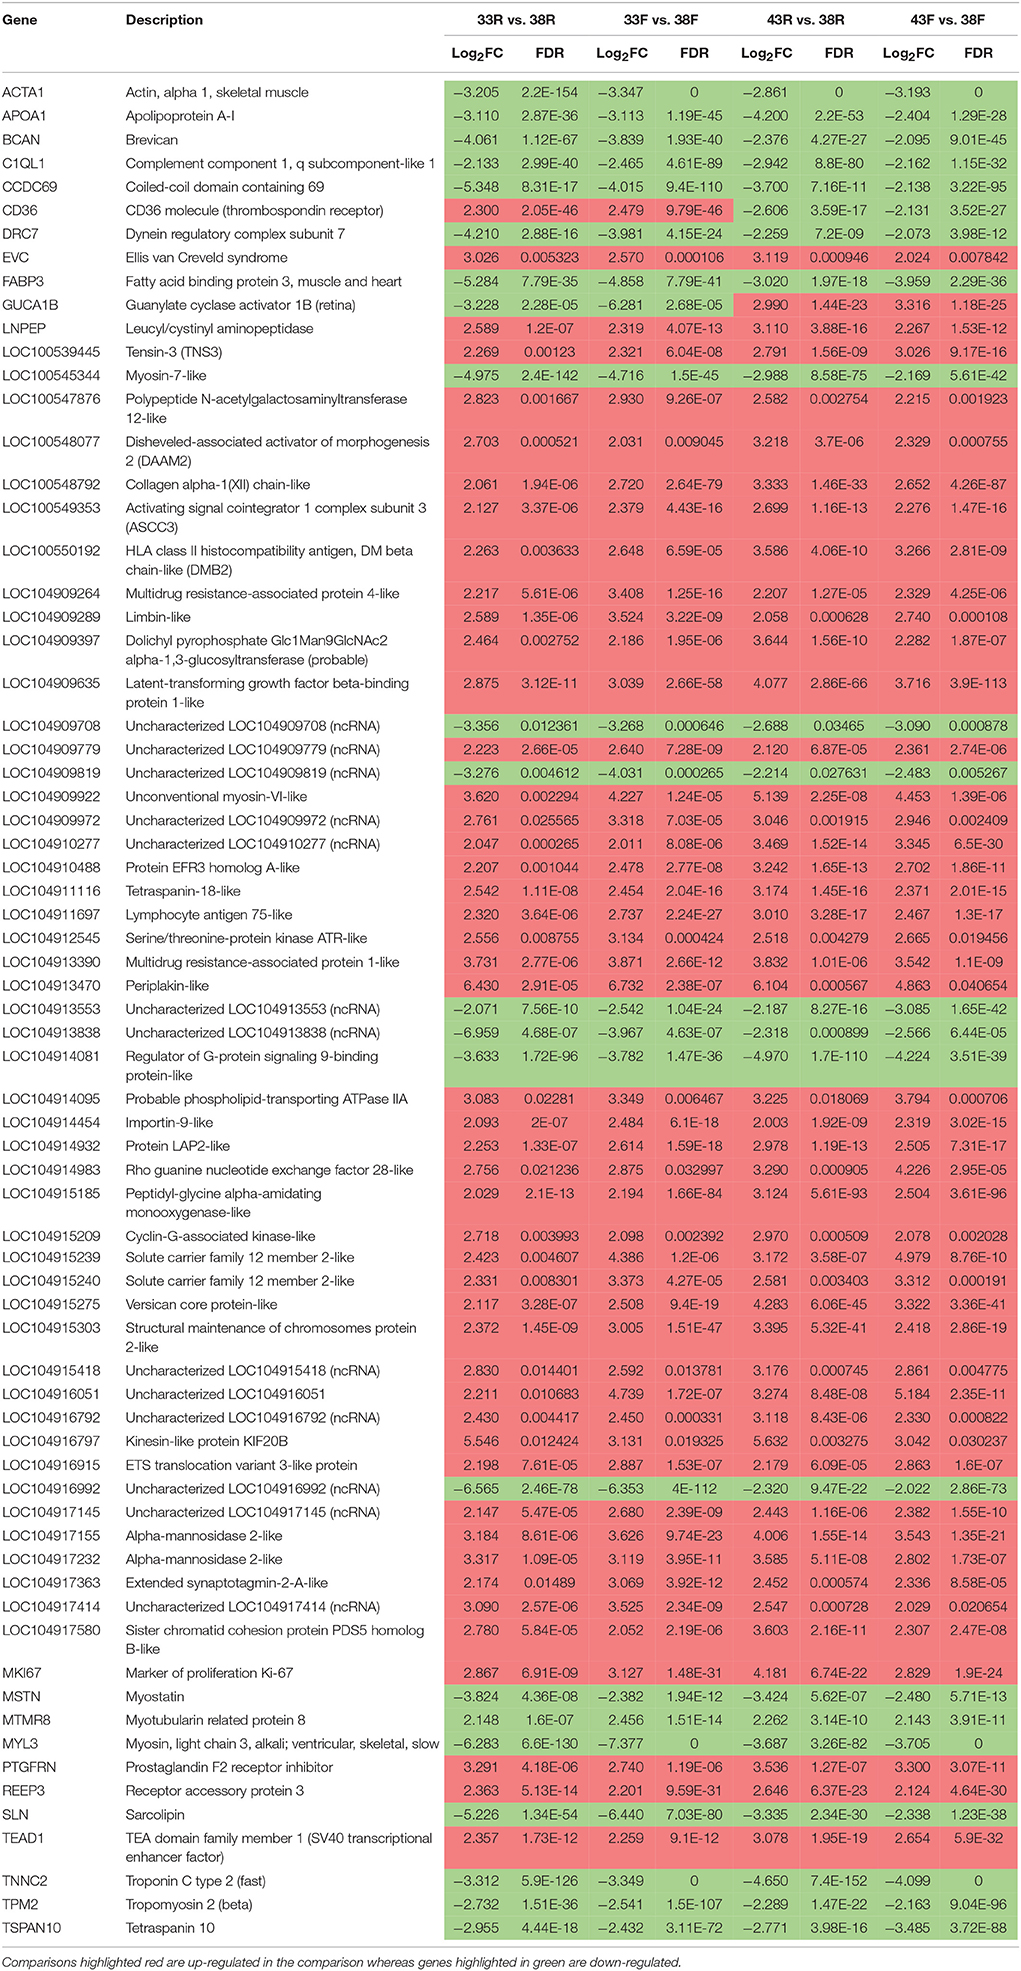
Table 6. Common significant DE genes [FDR p-values (< 0.05), |Log2FC| >1] across treatments.
To further examine differences between the temperature treatments, the 2,926 significant DE genes (|Log2FC| > 1.0) shared among all treatment comparisons were further investigated. These represent 23.3% of the total number of DE genes identified across treatments. Of the 2,926 DE genes, 637 showed consistent directional expression change, with the 33 vs. 38°C comparisons and the 43 vs. 38°C comparisons having the same directional response in both lines. Up regulation across all treatment comparisons was observed for 407 genes whereas 141 were down regulated. Of the remaining 89 genes, 53 were down regulated by cold treatment in both lines and 36 were down regulated by heat treatment (Table 7). These include CD36 and GUCA1B discussed above. IPA analysis of these 89 genes suggests upstream effects attributed to the AHR (Aryl Hydrocarbon Receptor) transcription factor, and the transforming growth factors TGFB1 and TGFB3 (Figure S6).
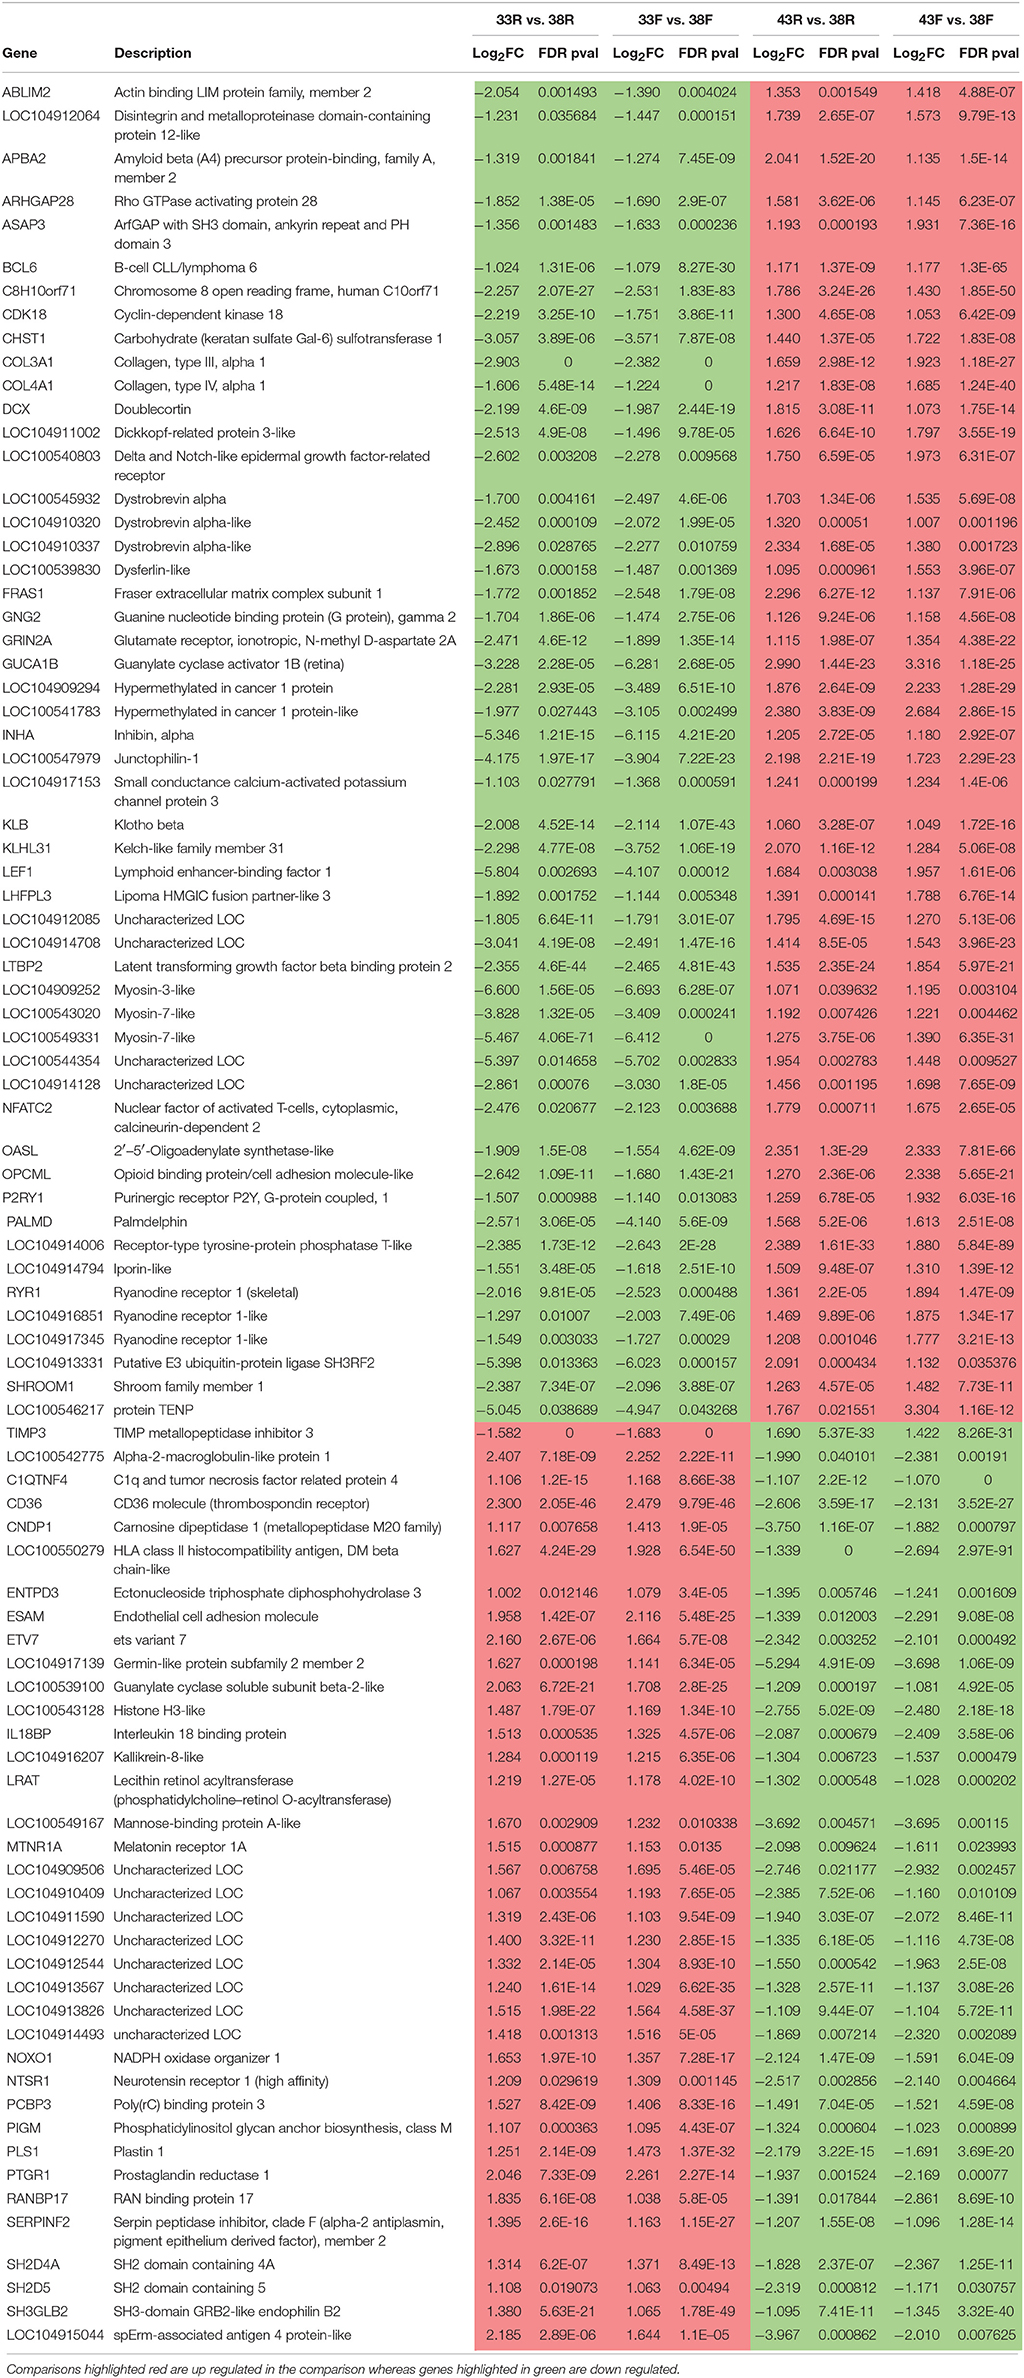
Table 7. Common DE genes [FDR p-values (< 0.05), |Log2FC| >1.0] showing consistent directional change by treatment.
Effects of Selection (Line Differences)
Comparisons between lines within temperature treatment found relatively few DE genes at the three incubation temperatures (Table 2, Figure 4) and the majority were down regulated in the RBC2 cells. Interestingly at the control temperature (38°C), only a single gene, Trans-2,3-Enoyl-CoA Reductase-Like (TECRL), showed significant DE between lines. This gene is a protein coding regulatory gene that catalyzes an oxidation-reduction (redox) reaction and is thought to be involved in the fatty acid biosynthesis pathway. This gene also had significant DE between lines at 33 and 43°C (Table 7). In all cases TECRL was down regulated in the F line vs. RBC2 (average Log2FC = −6.96).
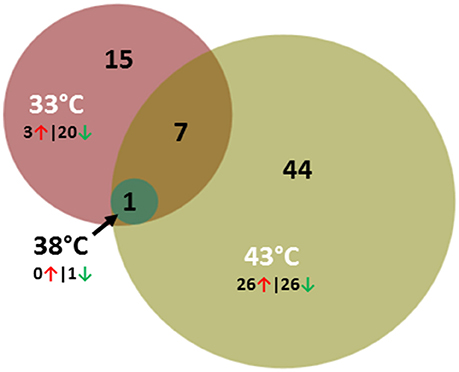
Figure 4. Distribution of differentially expressed genes between lines (F-line vs. RBC2) during p. major satellite cell differentiation. For each temperature comparison, the number of genes with FDR p < 0.05 and |Log2FC| > 2.0 that were shared or unique to each incubation temperature are indicated. The number and direction of expression change (↑ or ↓) for the genes included in each temperature group are listed outside the Venn diagram. Circle size is proportional to the number of genes.
In contrast to the control temperature, the numbers of genes where the cold (33°C) and hot (43°C) treatments significantly affected expression were considerably higher (Table 2). At 33°C, 873 genes showed significant FDR p-values with 116 also having |Log2FC| > 1.0. Of these 23 had |Log2FC| > 2.0 with the majority (87%) being down regulated in the F line compared to the RBC2 cells. Fifteen of the 23 genes were unique to the 33°C temperature comparison and 7 were shared with the 43°C comparison (Figure 4, Table 8). Included in the group of 15 unique genes were; arf-GAP with coiled-coil, ANK repeat and PH domain-containing protein 1-like (LOC104916358), Rho guanine nucleotide exchange factor (GEF) 16 (ARHGEF16), carbamoyl-phosphate synthase 1, mitochondrial (CPS1), neutrophil cytosolic factor 1 (NCF1), tocopherol (alpha) transfer protein (TTPA), histamine N-methyltransferase-like (LOC100542432), receptor tyrosine-protein kinase erbB-3-like (LOC100546071), fibrocystin-like (LOC104910058), semaphorin-6C-like (LOC104916327), and 6 uncharacterized loci (LOC104909501, LOC104910046, LOC104910133, LOC104911073, LOC104912259, LOC104916656). With the exception of LOC104911073, all were down regulated in the F-line cells. Although, the specific function of many of these genes are not known, they may have roles in such diverse processes as protein-protein and protein-lipid interactions, the removal of excess urea from cells, the regulation of vitamin E levels and secretion of vitamin E from hepatocytes to circulating lipoproteins. In regards to muscle biology, semaphorin-6C-like has been found to be concentrated at neuromuscular junctions suggesting a role in neuromuscular communication (Svensson et al., 2008).
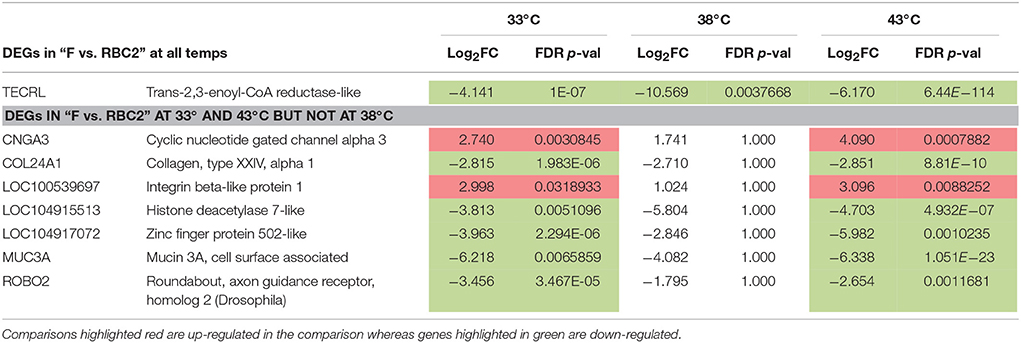
Table 8. Significant DE genes in between-line comparisons [FDR p-values (< 0.05), |Log2FC| >2.0] that were shared within temperature (see Figure 4).
Greater differential expression between the F and RBC2 cells was observed at 43°C (Table 2). Here the total number of DE genes (1818) was more than twice that observed at 33°C. In total 318 genes had |Log2FC| > 1.0 and of 52 had |Log2FC| > 2.0. Of these 52 genes, 44 were unique to this temperature comparison (Figure 4) and the directionality of expression changes was balanced with half of the genes being up regulated and half down regulated. Ten of these genes are annotated as uncharacterized loci. However, 14 (ALDH1A3, B4GALT6, CD55, CYGB, ENPP2, GREM1, NPY, NRTN, PKHD1, RAC2, RARB, RSAD2, SLIT3, and WASF3) co-occur in an IPA gene network corresponding to the processes of cell morphology, cellular assembly, organization, and development and 8 genes (ANKS4B, CAPN9, CYP26B1, GALNT3, PXDN, RASD2, RPS4X, SPON1, and SLC7A14) co-occur in a gene network corresponding to the processes of cellular movement, cell cycle and morphology. Interesting loci in these groups include genes involved in glycolipid biosynthesis (B4GALT6, Takizawa et al., 1999) down regulated in F-line cells, genes involved in regulating organogenesis, body patterning, cell and tissue differentiation [GREM1 (Michos et al., 2004) and RARB (Hauksdottir et al., 2003)], and NPY a neurotransmitter with regulatory functions in bone homeostasis (Gu et al., 2016). The latter 3 genes were all upregulated in the F-line cells.
Discussion
Muscle satellite cells are self-renewing and give rise to differentiated cell types, thus being true stem cells. Satellite cells and myofibers are of the same origin, being derived from somites (Armand et al., 1983). In mice, satellite cells are first identified morphologically toward the end of fetal development lying underneath the forming basement membrane (Ontell and Kozeka, 1984). They are the only undifferentiated cells present in the muscle at birth and during early postnatal growth, and are the primary source of myonuclei for skeletal muscle growth (Sherwood et al., 2004). During posthatch development in the chicken, satellite cells diversify in cell fate, with some cells entering quiescence (Halevy et al., 2004). In adult muscle, quiescent cells continue to provide nuclei for muscle hypertrophy and repair (Zammit et al., 2006; Zammit, 2008).
The function of satellite cells is modulated by the cellular microenvironment and quiescent satellite cells are identifiable and being both PAX7 and MYF5 positive. The state of satellite cells is defined by antagonistic Notch and Wnt signaling, with Notch maintaining PAX7 and Wnt signaling driving MYOD expression through beta-catenin (Fujimaki et al., 2013). Activation of satellite cells is thus marked by the onset of MYOD expression, downregulation of PAX7 and the subsequent increase in myogenin that marks the commitment of the activated cell to differentiation (Zammit, 2008).
Thermal challenge of the turkey satellite cells had no significant effect on expression of PAX7 in either the cold or heat-treated cells. Likewise, no significant expression differences were observed for MYOD1, and MYF5 was only slightly downregulated in the heat-treated RBC2 cells. However, myogenin (MYOG, LOC100303673), was significantly down regulated in the cold treated cells (33°C) of both the RBC2 and F-line compared to controls (38°C) (Log2FC = −2.17 and −2.30, respectively). In addition, myocyte enhancer factors MEF2B, MEF2C, and MEF2D were significantly downregulated in cold treated cells (Log2FC = −3.04, −2.43, and −0.95, respectively, for RBC2 line and −2.75, −4.48, and −0.60 for F line, respectively. This suggests that decreased temperature can directly influence satellite cell differentiation by acting at the level of gene transcription. In the heat-treated cells (43°C), MYOG was slightly downregulated (Log2FC = −1.11 and −1.06). This result is counter to a previous study using the same dissociated cell culture system that found increased MYOG expression, as measured by qPCR, in cells incubated at temperatures above 38°C (Clark et al., 2016a). However, expression of MYOG in that study was conducted after 72 h of differentiation as opposed to 48 h as in the present study. Satellite cells from both the RBC2 and F lines differentiate faster and produce larger myotubes at higher temperatures with slower growth at lower temperatures (Clark et al., 2016a). This is consistent with the RNAseq results in that many muscle-associated genes were among the genes with the greatest down regulation in cold-treated cells (33°C).
The gene MEF2B was also down regulated in heat-treated cells (Log2FC = −1.52 and −1.54 for RBC2 and F lines, respectively), whereas MEF2D was modestly upregulated (Log2FC = 0.92 and 1.15). Myocyte enhancer factor 2 proteins play key roles as transcriptional regulators of skeletal muscle development as well as myofibrillar gene expression, fiber type control, and glucose regulation (Richter and Hargreaves, 2013). Myocyte enhancer factor 2c binds to myogenin to activate skeletal muscle differentiation (Molketin et al., 1995). Moreover, recent work by Anderson et al. (2015) demonstrated that MEF2C knockout mice had significantly reduced body weight compared to controls beginning at day 10 and persisting to day 52. Reduced MEF2C expression observed at cold temperatures could be a factor in the extensive down regulation of other genes associated with sarcomeric gene expression as well as genes associated with carbohydrate metabolism and reduced rate of differentiation observed by Clark et al. (2016a).
In addition to maintaining PAX7, Notch may also signal satellite cells to stop proliferating (Conboy and Rando, 2002). The transcription factor prospero homeobox 1 (PROX1) appears to be essential for myoblast differentiation in that has a bidirectional interaction with Notch1. High Notch activity inhibits PROX1, which in turn represses Notch1 signaling (Kivelä et al., 2016). PROX1 is thought to regulate muscle phenotype via NFAT (nuclear factor of activated T cells). PROX1 was up regulated in the heat-treated turkey cells (Log2FC = 1.82 and 1.32 in the RBC2 and F line, respectively) consistent with enhanced differentiation.
The suggested upstream effects on AHR (Aryl Hydrocarbon Receptor) transcription factor, and the transforming growth factors TGFB1 and TGFB3 observed in comparison of the challenged cells are of interest because of the consistent directionality of expression changes and shared significance observed across treatment comparisons in the turkey satellite cells. Of particular interest is the effect of TGFB1 on genes like NFATC2. Both NFATC2 and the related NFATC3 are important transcription factors involved in muscle growth and differentiation. In the cold treated cells, NFATC2 was downregulated but modestly upregulated in the heat comparisons. These genes may also be affected by temporal/spatial calcium-signaling. In differentiating satellite cell, calcium enters the cytoplasm via TRPC channels. TRPC1 was modestly upregulated in cold but not hot-treated cells. Calcium increases translocation of both NFATC2 and NFATC3 to the nucleus. Increased translocation of NFATC2 and NFATC3 leads to increased expression of MYOD (Liu and Schneider, 2014).
In addition to TRPC channels, differentiating satellite cells beginning to express proteins responsible for regulation of Ca2+ homeostasis, including channel proteins, Ca2+-pumps, Ca2+-storage proteins, and proteins the regulate the activity of channels and pumps. These proteins are localized to the sarcoplasmic reticulum (SR) and the sarcolemma. The SR calcium release channels or ryanodine receptors RYR1 and RYR3 serve as conduits for Ca2+ to enter the sarcoplasm from the lumen of the sarcoplasmic reticulum (Rossi and Dirksen, 2006). In adult avian skeletal muscle, Ca2+ release via the ryanodine receptors is activated by voltage depolarization across the sarcolemma. This results in a conformational change in the α1s subunit of the calcium voltage-gated calcium channel. The ryanodine receptor RYR1, which interacts with the α1s subunit, responds by undergoing a conformational change causing the pore to open, thereby enabling calcium release from the SR. Increased cytosolic [Ca2+] activates RYR3 via a Ca2+ -induced Ca2+-release mechanism thereby amplifying Ca2+ release from the SR. The structure of the Ca2+-release complex includes associated proteins that modulate Ca2+-release activity. These include the Ca2+ storage protein calsequestrin (CASQ), the structural proteins junctophilin-2 (JPH2) and triadin (TRDN), and the Ca2+ pump protein (ATP2A1 and ATP2A2) and its associated inhibitory protein sarcolipin (SLN) (Rossi and Dirksen, 2006).
Interestingly, most of these genes associated with regulation of Ca2+ homeostasis were significantly affected by temperature treatment, particularly cold treatment. The RYR1 isoform was downregulated >2-fold in cold treated cells from both lines, but modestly increased in the heat-treated cells. (Table S3). The α1s subunit of the calcium voltage-gated calcium channel (CACNA1S) was significantly downregulated in both lines (Log2FC = −3.64 and −3.91 for RBC2 and F line, respectively), but was modestly upregulated by ~0.4-fold in heat-treated cells from both lines. Other Ca2+ regulatory, pump, and storage genes associated with the SR including, TRDN, ATP2A2, SLN, CASQ2 were also significantly downregulated. Log2FC ranged from −0.71 for ATP2A2 in the cold treated cells from RBC2 to −7.2 for TRDN from the same treatment (Table S3). Taken in total, the small increase in TRPC1 expression in cold treated cells may be offset by decreased of expression of these other genes. This has important implications for the ability of these cells to maintain normal Ca2+ homeostasis in response to cold temperatures. Heat stress can effect an increase in intracellular [Ca2+] (Mikkelsen et al., 1991) and there is some evidence that elevated temperatures result in decreased ability of the SR to sequester Ca2+ in muscle (van der Poel and Stephenson, 2007). The intracellular Ca2+ concentration regulates a plethora of metabolic and transcriptional activities, so exposure to hot or cold temperatures early in development may have long-term implications for the fate of the developing muscle.
Among the most significantly altered gene pathways in the turkey satellite cells based on activation score were those corresponding to the eIF2, eIF4, and p70S6K, and mTOR signaling. The eIF2 imitation complex integrates a diverse array of stress-related signals to regulate mRNA translation, especially in response to stress. Likewise, eIF4 and p70S6K signaling play critical roles in translation regulation (Sonenberg and Hinnebusch, 2009). Genes of the mTOR signaling pathway play a critical role in the regulation of skeletal muscle hypertrophy (Bodine et al., 2001; Ohanna et al., 2005; Rommel et al., 2013) this pathway is one of the main signaling pathways controlling protein synthesis and cell proliferation in myogenic satellite cells (Han et al., 2008). Muscle growth after hatch occurs through hypertrophic growth of existing muscle fibers. Thus, the accretion of breast muscle mass would involve mTOR signaling. Down regulation of genes in these pathways by cold treatment would significantly affect downstream gene action through altered translation.
The mTOR protein is central to two multi-protein complexes with distinct cellular functions that integrate cellular signals to regulate metabolism, proliferation and autophagy (Laplante and Sabatini, 2009). mTORC1 positively regulates cell growth, protein synthesis, and the activity of sterol regulatory element binding protein 1 (SREBP1) and peroxisome proliferator-activated receptor gamma (PPARG) which are key genes involved in lipid homeostasis. Less is known about the mTORC2 complex although it too plays key roles in cell survival, metabolism, proliferation and cytoskeleton organization (Laplante and Sabatini, 2009). The expanded mTOR pathway also overlaps with aspects of eIF4 translational regulation. Thus cellular stress can produce a temporal reduction in protein synthesis. In the present study a greater number of mTOR pathway genes were significantly affected by cold treatment, primarily through down regulation.
Temperature can also stimulate the transdifferentiation of satellite cells to an adipogenic phenotype. Harding et al. (2015) demonstrated that elevated temperatures in vitro increased lipid accumulation in both broiler p. major and b. femoris satellite cells, and decreased temperatures reduced lipid accumulation in both cell types. Clark et al. (2016b) showed that elevated temperatures in the F and RBC2 turkey p. major satellite cells impacted the expression of adipogenic genes and increased lipid deposition. In the current study, expression of key adipogenic genes CEBPB [CCAAT/enhancer binding protein (C/EBP), beta] and PPARG in the differentiating turkey cells was not affected by thermal treatment. However, SCD [stearoyl-CoA desaturase (delta-9-desaturase), an enzyme responsible for complex lipid production] was significantly up regulated in cold-treated cells (Log2FC = 1.403 and 1.338 in the RBC2 and F line, respectively), but also slightly up regulated in the RBC2 cells at 43°C (Log2FC = 1.13).
Further support for the conversion of breast muscle satellite cells to an adipogenic cell fate, was the change in expression of NPY in the 33–38°C comparison. NPY is a neuropeptide that is widely expressed in the central nervous system (Wang et al., 2007). The peptide is thought to function through G protein-coupled receptors to activate mitogen-activated protein kinase (MAPK), regulate intracellular calcium levels, and activate potassium channels (RefSeq, Oct 2014). Recently, Zhang et al. (2015) found that NPY plays a role in promoting adipogenesis in chickens. Although, there was no effect on proliferation, supplementation of stromal-vascular fraction cells with NPY during differentiation was associated with greater glycerol-3-phosphate dehydrogenase activity, increased expression of fatty acid binding protein 4 and lipoprotein lipase, indicative of increased lipid accumulation. Additional research on the role of NPY in satellite cells and more broadly in muscle is clearly warranted.
The post-hatch time-frame is critical and exposure of poultry to extreme temperatures, can seriously compromise the quality of meat. This study demonstrates significant alterations in gene expression and supports the hypothesis that satellite cell differentiation is directly altered in turkeys in response to ambient temperature. Numerous expression differences were observed between cells incubated at both lower (33°C) and higher (43°C) temperatures as compared to control (38°C). Greater expression differences were seen in the cold treatments where a greater number of the DE genes were down regulated. Fewer expression differences in the differentiating cells were observed between the genetic lines than observed for proliferating cells in the same experimental system (Reed et al., 2017). This suggests that the impact of temperature on satellite cells attributed to selection for fast growth may occur primarily at early points in satellite cell activation. Studies are currently underway to examine the effects of thermal challenge on in vivo gene expression and early muscle development of poults.
Author Contributions
KR, SV, and GS conceived and designed the experiments. SV and KM performed the experiments. KR and KM analyzed the data. KR, KM, SV, and GS drafted the manuscript. All authors read and approved the final manuscript.
Funding
The authors gratefully acknowledge support from the U.S. Department of Agriculture, National Institute of Food Agriculture, AFRI competitive grant no. 2014-67003-21812.
Conflict of Interest Statement
The authors declare that the research was conducted in the absence of any commercial or financial relationships that could be construed as a potential conflict of interest.
Acknowledgments
The authors thank Cindy Coy for technical assistance in culturing the satellite cells used in this study. Juan Abrahante, University of Minnesota Informatics Institute, assisted with data processing.
Supplementary Material
The Supplementary Material for this article can be found online at: https://www.frontiersin.org/articles/10.3389/fphys.2017.00948/full#supplementary-material
Figure S1. Hierarchical clustering of samples based on Euclidean distance reiterated relationships shown by PCA. Global gene expression differences among groups are illustrated in the heat map constructed from the co-expressed genes with the greatest experiment-wise differences in average normalized expression.
Figure S2. GO classification of genes expressed in cultured turkey p. major satellite cells after 48 h differentiation at 38°C.
Figure S3. Volcano plot showing the relationship between the ANOVA p-values and experiment-wise Log2 fold change for gene expression in p. major satellite cell transcriptomes during differentiation.
Figure S4. Distribution of differentially expressed genes for cold (33 vs. 38°C) and hot (43 vs. 38°C) comparisons of each line (RBC2 and F) during p. major satellite cell differentiation. For each temperature comparison, the number of genes with FDR p < 0.05 and |Log2FC| > 2.0 that were shared or unique to each group are indicated. Numbers in parentheses are the number of DE genes in the group that were also identified as DE in proliferating satellite cells (Reed et al., 2017).
Figure S5. Example gene networks identified from differentially expressed genes using QIAGEN's Ingenuity® Pathway Analysis (IPA®, QIAGEN Bioinformatics) software showing differential response of p. major satellite cell transcriptome to temperature. Depicted are the two most significant scoring gene networks identified in IPA analysis of the 70 DE genes shared among the treatment comparisons. In each panel the direction (red = up regulated, green = down regulated) and magnitude (color intensity) of expression changes are indicated. Shapes within the networks correspond to genes, gene products, or small molecules.
Figure S6. Predicted upstream effects for three DE genes (AHR, TGFB1, and TGFB3) shared among treatments that showed directional by-temperature differences in expression in IPA analysis (Ingenuity Pathway Analysis, Qiagen Bioinformatics).
References
Ain Baziz, H., Geraert, P. A., Padilha, J. C., and Guillaumin, S. (1996). Chronic heat exposure enhances fat deposition and modifies muscle and fat partition in broiler carcasses. Poult. Sci. 75, 505–513. doi: 10.3382/ps.0750505
Anderson, C. M., Hu, J., Barnes, R. M., Heidt, A. B., Cornelissen, I., and Black, B. L. (2015). Myocyte enhancer factor 2C function in skeletal muscle is required for normal growth and glucose metabolism in mice. Skelet. Muscle 5:7. doi: 10.1186/s13395-015-0031-0
Andrews, S. (2010). FastQC: A Quality Control Tool for High Throughput Sequence Data. Available online at: http://www.bioinformatics.babraham.ac.uk/projects/fastqc/
Armand, O., Boutineau, A. M., Mauger, A., Pautou, M. P., and Kieny, M. (1983). Origin of satellite cells in avian skeletal muscles. Arch. Anat. Microsc. Morphol. Exp. 72, 163–181.
Asakura, A., Komaki, M., and Rudnicki, M. (2001). Muscle satellite cells are multipotential stem cells that exhibit myogenic, osteogenic, and adipogenic differentiation. Differentiation 68, 245–253. doi: 10.1046/j.1432-0436.2001.680412.x
Bodine, S. C., Stitt, T. N., Gonzalez, M., Kline, W. O., Stover, G. L., Bauerlein, R., et al. (2001). Akt/mTOR pathway is a crucial regulator of skeletal muscle hypertrophy and can prevent muscle atrophy in vivo. Nat. Cell Biol. 3, 1014–1019. doi: 10.1038/ncb1101-1014
Bolger, A. M., Lohse, M., and Usadel, B. (2014). Trimmomatic: a flexible trimmer for Illumina sequence data. Bioinformatics 30, 2114–2120. doi: 10.1093/bioinformatics/btu170
Clark, D. L., Coy, C. S., Strasburg, G. M., Reed, K. M., and Velleman, S. G. (2016a). Temperature effect on proliferation and differentiation of satellite cells from turkeys with different growth rates. Poult. Sci. 95, 934–947. doi: 10.3382/ps/pev437
Clark, D. L., Strasburg, G. M., Reed, K. M., and Velleman, S. G. (2016b). Influence of temperature and growth selection on turkey pectoralis major muscle satellite cell adipogenic gene expression and lipid accumulation. Poult. Sci. 96, 1015–1027. doi: 10.3382/ps/pew374
Conboy, I. M., and Rando, T. A. (2002). The regulation of Notch signaling controls satellite cell activation and cell fate determination in postnatal myogenesis. Dev. Cell 3, 397–409. doi: 10.1016/S1534-5807(02)00254-X
Fujimaki, S., Machida, M., Hidaka, R., Asashima, M., Takemasa, T., and Kuwabara, T. (2013). Intrinsic ability of adult stem cell in skeletal muscle: an effective and replenishable resource to the establishment of pluripotent stem cells. Stem Cells Int. 2013:420164. doi: 10.1155/2013/420164
Gu, X. C., Zhang, X. B., Hu, B., Zi, Y., and Li, M. (2016). Neuropeptide Y accelerates post-fracture bone healing by promoting osteogenesis of mesenchymal stem cells. Neuropeptides 60, 61–66. doi: 10.1016/j.npep.2016.09.005
Halevy, O., Geyra, A., Barak, M., Uni, Z., and Sklan, D. (2000). Early posthatch starvation decreases satellite cell proliferation and skeletal muscle growth in chicks. J. Nutr. 130, 858–864.
Halevy, O., Krispin, A., Leshem, Y., McMurtry, J. P., and Yahav, S. (2001). Early-age heat exposure affect skeletal muscle satellite cell proliferation and differentiation in chicks. Am. J. Physiol. Regul. Intergr. Comp. Physiol. 281, R302–R309.
Halevy, O., Piestun, Y., Allouh, M. Z., Rosser, B. W., Rinkevich, Y., Reshef, R., et al. (2004). Pattern of Pax7 expression during myogenesis in the posthatch chicken establishes a model for satellite cell differentiation and renewal. Dev. Dyn. 231, 489–502. doi: 10.1002/dvdy.20151
Han, B., Tong, J., Zhu, M. J., Ma, C., and Du, M. (2008). Insulin-like growth factor-1 (IGF-1) and leucine activate pig myogenic satellite cells through mammalian target of rapamycin (mTOR) pathway. Mol. Reprod. Dev. 75, 810–817. doi: 10.1002/mrd.20832
Harding, R. L., Clark, D. L., Halevy, O., Coy, C. S., Yahav, S., and Velleman, S. G. (2015). The effect of temperature on apoptosis and adipogenesis on skeletal muscle satellite cells derived from different muscle types. Physiol. Rep. 3:e12539. doi: 10.14814/phy2.12539
Hauksdottir, H., Farboud, B., and Privalsky, M. L. (2003). Retinoic acid receptors beta and gamma do not repress, but instead activate target gene transcription in both the absence and presence of hormone ligand. Mol. Endocrinol. 17, 373–385. doi: 10.1210/me.2002-0340
Havenstein, G. B., Ferket, P. R., Grimes, J. L., Qureshi, M. A., and Nestor, K. E. (2007). Comparison of the performance of 1966- versus 2003-type turkeys when fed representative 1966 and 2003 turkey diets: growth rate, livability, and feed conversion. Poult. Sci. 86, 232–240. doi: 10.1093/ps/86.2.232
Kivelä, R., Salmela, I., Nguyen, Y. H., Petrova, T. V., Koistinen, H. A., Wiener, Z., et al. (2016). The transcription factor Prox1 is essential for satellite cell differentiation and muscle fibre-type regulation. Nat. Commun. 7:13124. doi: 10.1038/ncomms13124
Kurnoth, T., Salomon, F. V., and Gille, U. (1994). Quantitative changes in the capillary supply of selected muscles of turkeys, ducks, rats and swine during postnatal development. Anat. Histol. Embryol. 23, 21–39. doi: 10.1111/j.1439-0264.1994.tb00238.x
Laplante, M., and Sabatini, D. M. (2009). mTOR signaling at a glance. J. Cell Sci. 122, 3589–3594. doi: 10.1242/jcs.051011
Liu, Y., and Schneider, M. F. (2014). FGF2 activates TRPC and Ca(2+) signaling leading to satellite cell activation. Front. Physiol. 5:38. doi: 10.3389/fphys.2014.00038
Love, M. I., Huber, W., and Anders, S. (2014). Moderated estimation of fold change and dispersion for RNA-seq data with DESeq2. Genome Biol. 15:550. doi: 10.1186/s13059-014-0550-8
Loyau, T., Metayer-Coustard, S., Berri, C., Crochet, S., Cailleau-Audouin, E., Sannier, M., et al. (2014). Thermal manipulation during embryogenesis has long-term effects on muscle and liver metabolism in fast-growing chickens. PLoS ONE 9:e105339. doi: 10.1371/journal.pone.0105339
Lu, Q., Wen, J., and Zhang, H. (2007). Effect of chronic heat exposure on fat deposition and meat quality in two genetic types of chicken. Poult. Sci. 86, 1059–1064. doi: 10.1093/ps/86.6.1059
Mauro, A. (1961). Satellite cell of skeletal muscle fibers. J. Phiophys. Biochem. Cytol. 9, 463–496. doi: 10.1083/jcb.9.2.493
Mi, H., Muruganujan, A., and Thomas, P. D. (2013). PANTHER in 2013: modeling the evolution of gene function, and other gene attributes, in the context of phylogenetic trees. Nucleic Acids Res. 41(Database issue), D377–D386. doi: 10.1093/nar/gks1118
Michos, O., Panman, L., Vintersten, K., Beier, K., Zeller, R., and Zuniga, A. (2004). Gremlin-mediated BMP antagonism induces the epithelial-mesenchymal feedback signaling controlling metanephric kidney and limb organogenesis. Development 131, 3401–3410. doi: 10.1242/dev.01251
Mikkelsen, R. B., Reinlib, L., Donowitz, M., and Zahniser, D. (1991). Hyperthermia effects on cytosolic [Ca2+]: analysis at the single cell level by digitized imaging microscopy and cell survival. Cancer Res. 51, 359–364.
Modrey, P., and Nichelmann, M. (1992). Development of autonomic and behavioral thermoregulation in turkeys (Meleagris gallopavo). J. Therm. Biol. 17, 287–292. doi: 10.1016/0306-4565(92)90035-E
Molketin, J. D., Black, B. L., Martin, J. F., and Olson, E. N. (1995). Cooperative activation of muscle gene expression by MEF2 and myogenic bHLH proteins. Cell 83, 1125–1136. doi: 10.1016/0092-8674(95)90139-6
Moss, F. P., and Leblond, C. P. (1971). Satellite cells as the source of nuclei in muscles of growing rats. Anat. Rec. 170, 421–435. doi: 10.1002/ar.1091700405
Mozdziak, P. E., Walsh, T. J., and McCoy, D. W. (2002). The effect of early posthatch nutrition on satellite cell mitotic activity. Poult. Sci. 81, 1703–1708. doi: 10.1093/ps/81.11.1703
Myhre, K. (1978). Behavioral temperature regulation in neonate chick of Bantam hen (Gallus domesticus). Poult. Sci. 57, 1369–1375. doi: 10.3382/ps.0571369
Nestor, K. E. (1977). Genetics of growth and reproduction in the turkey. 5. Selection for increased body weight alone and in combination with increased egg production. Poult. Sci. 56, 337–347. doi: 10.3382/ps.0560337
Nestor, K. E. (1984). Genetics of growth and reproduction in the turkey. 9. Long-term selection for increased 16-week body weight. Poult. Sci. 63, 2114–2122. doi: 10.3382/ps.0632114
Ohanna, M., Sobering, A. K., Lapointe, T., Lorenzo, L., Praud, C., Petroulakis, E., et al. (2005). Atrophy of S6K1(−/−) skeletal muscle cells reveals distinct mTOR effectors for cell cycle and size control. Nat. Cell Biol. 7, 286–294. doi: 10.1038/ncb1231
Ontell, M., and Kozeka, K. (1984). The organogenesis of murine striated muscle: a cytoarchitectural study. Am. J. Anat. 171, 133–148. doi: 10.1002/aja.1001710202
Piestun, Y., Druyan, S., Brake, J., and Yahav, S. (2013). Thermal manipulations during broiler incubation alter performance of broilers to 70 days of age. Poult. Sci. 92, 1155–1163. doi: 10.3382/ps.2012-02609
Powell, D. J., Velleman, S. G., Cowieson, A. J., Singh, M., and Muir, W. I. (2016). Influence of hatch time and access to feed on intramuscular adipose tissue deposition in broilers. Poult. Sci. 95, 1449–1456. doi: 10.3382/ps/pew063
Reed, K. M., Mendoza, K. M., Abrahante, J. E., Barnes, N. E., Velleman, S. G., and Starburg, G. M. (2017). Response of turkey muscle satellite cells to thermal challenge. I. Transcriptome effects in proliferating cells. BMC Genomics 18:352. doi: 10.1186/s12864-017-3740-4
Richter, E. A., and Hargreaves, M. (2013). Exercise, GLUT4, and skeletal muscle glucose uptake. Physiol. Rev. 93, 993–1017. doi: 10.1152/physrev.00038.2012
Rommel, C., Bodine, S. C., Clarke, B. A., Rossman, R., Nunez, L., Stitt, T. N., et al. (2013). Mediation of IGF-1-induced skeletal myotube hypertrophy by PI(3)K/Akt/mTOR and PI(3)K/Akt/GSK3 pathways. Nat. Cell Biol. 3, 1009–1013. doi: 10.1038/ncb1101-1009
Rossi, A. E., and Dirksen, R. T. (2006). Sarcoplasmic reticulum: the dynamic governor of muscle. Muscle Nerve 33, 715–731. doi: 10.1002/mus.20512
Sherwood, R. I., Christensen, J. L., Conboy, I. M., Conboy, M. J., Rando, T. A., Weissman, I. L., et al. (2004). Isolation of adult mouse myogenic progenitors: functional heterogeneity of cells within and engrafting skeletal muscle. Cell 119, 543–554. doi: 10.1016/j.cell.2004.10.021
Shinder, D., Rusal, M., Tanny, J., Druyan, S., and Yahav, S. (2007). Thermoregulatory response of chicks (Gallus domesticus) to low ambient temperatures at an early age. Poult. Sci. 86, 2200–2209.
Siller, W. G., and Wight, P. A. L. (1979). The pathology of deep pectoral myopathy of turkeys. Avian Pathol. 7, 583–617. doi: 10.1080/03079457808418313
Sonenberg, N., and Hinnebusch, A. G. (2009). Regulation of translation initiation in eukaryotes: mechanisms and biological targets. Cell 136, 731–745. doi: 10.1016/j.cell.2009.01.042
Sosnicki, A. A., Cassens, R. G., Vimini, R. J., and Greaser, M. L. (1991a). Distribution of capillaries in normal and ischemic turkey skeletal muscle. Poult. Sci. 70, 343–348. doi: 10.3382/ps.0700343
Sosnicki, A. A., Cassens, R. G., Vimini, R. J., and Greaser, M. L. (1991b). Histopathological and ultrastructural alterations of turkey skeletal muscle. Poult. Sci. 70, 349–357. doi: 10.3382/ps.0700349
Svensson, A., Libelius, R., and Tågerud, S. (2008). Semaphorin 6C expression in innervated and denervated skeletal muscle. J. Mol. Histol. 39, 5–13. doi: 10.1007/s10735-007-9113-6
Takizawa, M., Nomura, T., Wakisaka, E., Yoshizuka, N., Aoki, J., Arai, H., et al. (1999). cDNA cloning and expression of human lactosylceramide synthase. Biochim. Biophys. Acta 1438, 301–304. doi: 10.1016/S1388-1981(99)00051-7
van der Poel, C., and Stephenson, D. G. (2007). Effects of elevated physiological temperatures on sarcoplasmic reticulum function in mechanically skinned muscle fibers of the rat. Am. J. Physiol. Cell Physiol. 293, C133–C147. doi: 10.1152/ajpcell.00052.2007
Velleman, S. G., Liu, X., Nestor, K. E., and McFarland, D. C. (2000). Heterogeneity in growth and differentiation characteristics in male and female satellite cells isolated from turkey lines with different growth rates. Comp. Biochem. Physiol. Part A Mol. Integr. Physiol. 125, 503–509. doi: 10.1016/S1095-6433(00)00178-1
Wang, C., Yang, N., Wu, S., Liu, L., Sun, X., and Nie, S. (2007). Difference of NPY and its receptor gene expressions between obesity and obesity-resistant rats in response to high-fat diet. Horm. Metab. Res. 39, 262–267. doi: 10.1055/s-2007-973073
Wilson, B. W., Nieberg, P. S., and Buhr, R. J. (1990). Turkey muscle growth and focal myopathy. Poult. Sci. 69, 1553–1562. doi: 10.3382/ps.0691553
Yahav, S., and McMurtry, J. P. (2001). Thermotolerance acquisition in broiler chickens by temperature conditioning early in life – the effect of timing and ambient temperature. Poult. Sci. 80, 1662–1666. doi: 10.1093/ps/80.12.1662
Yahav, S., and Plavnik, I. (1999). Effect of early-age thermal conditioning and food restriction on performance and thermotolerance of male broiler chickens. Br. Poult. Sci. 40, 120–126. doi: 10.1080/00071669987944
Zammit, P. S. (2008). All muscle satellite cells are equal, but are some more equal than others? J. Cell Sci. 121, 2975–2982. doi: 10.1242/jcs.019661
Zammit, P. S., Partridge, T. A., and Yablonka-Reuveni, Z. (2006). The skeletal muscle satellite cell: the stem cell that came in from the cold. J. Histochem. Cytochem. 54, 1177–1191. doi: 10.1369/jhc.6R6995.2006
Zhang, W., Bai, S., Liu, D., Cline, M. A., and Gilbert, E. R. (2015). Neuropeptide Y promotes adipogenesis in chicken adipose cells in vitro. Comp. Biochem. Physiol. Part A Mol. Integr. Physiol. 181, 62–70. doi: 10.1016/j.cbpa.2014.11.012
Keywords: satellite cell, skeletal muscle, growth-selected, turkey, differentiation
Citation: Reed KM, Mendoza KM, Strasburg GM and Velleman SG (2017) Response of Turkey Muscle Satellite Cells to Thermal Challenge. II. Transcriptome Effects in Differentiating Cells. Front. Physiol. 8:948. doi: 10.3389/fphys.2017.00948
Received: 07 September 2017; Accepted: 08 November 2017;
Published: 30 November 2017.
Edited by:
Yajun Wang, Sichuan University, ChinaReviewed by:
Qinghua Nie, South China Agricultural University, ChinaPaweł Tomasz Maćkowiak, Poznan University of Life Sciences, Poland
Copyright © 2017 Reed, Mendoza, Strasburg and Velleman. This is an open-access article distributed under the terms of the Creative Commons Attribution License (CC BY). The use, distribution or reproduction in other forums is permitted, provided the original author(s) or licensor are credited and that the original publication in this journal is cited, in accordance with accepted academic practice. No use, distribution or reproduction is permitted which does not comply with these terms.
*Correspondence: Kent M. Reed, reedx054@umn.edu