 Trine Krogh-Madsen
 Anna F. Jacobson3
 Francis A. Ortega
 David J. Christini
- 1Greenberg Division of Cardiology, Department of Medicine, Weill Cornell Medicine, New York, NY, United States
- 2Institute for Computational Biomedicine, Weill Cornell Medicine, New York, NY, United States
- 3Cardiovascular Research Institute, Weill Cornell Medicine, New York, NY, United States
- 4Physiology, Biophysics and Systems Biology Graduate Program, Weill Cornell Graduate School, New York, NY, United States
In silico cardiac myocyte models present powerful tools for drug safety testing and for predicting phenotypical consequences of ion channel mutations, but their accuracy is sometimes limited. For example, several models describing human ventricular electrophysiology perform poorly when simulating effects of long QT mutations. Model optimization represents one way of obtaining models with stronger predictive power. Using a recent human ventricular myocyte model, we demonstrate that model optimization to clinical long QT data, in conjunction with physiologically-based bounds on intracellular calcium and sodium concentrations, better constrains model parameters. To determine if the model optimized to congenital long QT data better predicts risk of drug-induced long QT arrhythmogenesis, in particular Torsades de Pointes risk, we tested the optimized model against a database of known arrhythmogenic and non-arrhythmogenic ion channel blockers. When doing so, the optimized model provided an improved risk assessment. In particular, we demonstrate an elimination of false-positive outcomes generated by the baseline model, in which simulations of non-torsadogenic drugs, in particular verapamil, predict action potential prolongation. Our results underscore the importance of currents beyond those directly impacted by a drug block in determining torsadogenic risk. Our study also highlights the need for rich data in cardiac myocyte model optimization and substantiates such optimization as a method to generate models with higher accuracy of predictions of drug-induced cardiotoxicity.
1. Introduction
Mathematical models of cardiac electrophysiology are at the cusp of usage in a variety of clinical and pre-clinical applications, including safety pharmacology (Mirams et al., 2012; Zhang et al., 2016). In particular, mathematical modeling forms a central component in the Comprehensive in Vitro Proarrhythmia Assay (CiPA) initiative, a proposed strategy for progressing drug safety testing (Sager et al., 2014; Colatsky et al., 2016; Fermini et al., 2016; Gintant et al., 2016).
In terms of cardiotoxicity, drug safety testing aims to avoid Torsades de Pointes (TdP), a life-threatening ventricular tachycardia. Indeed, occurrences of drug-induced TdP in patients have lead to regulatory bans and market withdrawals of several drugs (Mirams et al., 2011). TdP risk is associated with prolongation of the QT interval on the electrocardiogram, in particular due to block of the hERG channel, which carries the rapid delayed rectifier current (IKr; Sanguinetti et al., 1995; Straus et al., 2005; Hoffmann and Warner, 2006). However, multiple other currents and dynamics are of importance to torsadogenesis, and including measured effects of drugs on multiple channels, rather than just hERG, into TdP risk stratification improves risk prediction (Kramer et al., 2013; Mistry et al., 2015). Mechanistically, TdP initiation is linked to early afterdepolarizations (EADs) at the cellular level. Triggering of these EADs may depend directly on multiple different ionic currents, including the L-type calcium current (ICaL) and the late sodium current (INaL) (Lankipalli et al., 2005; Hale et al., 2008), and may also depend on intracellular calcium and sodium dynamics (Terentyev et al., 2014; Kim et al., 2015; Xie et al., 2015; Krogh-Madsen and Christini, 2017), implying that the levels of the ionic transporters that control these concentrations (e.g., the sodium-calcium exchanger and the sodium-potassium pump) are important for torsadogenesis. Indeed, recent in silico work have pointed to the magnitudes of these two transporters as having large impact on TdP risk (Lancaster and Sobie, 2016).
Despite the proposed usage of mathematical models in safety pharmacology, even recent and sophisticated models of human ventricular myocyte electrophysiology perform poorly when simulating each of the most typical congenital long QT (LQT) syndromes (Mann et al., 2016). This naturally raises concerns about the ability of these in silico models to predict drug-induced LQT and TdP. However, using a global optimization strategy, in silico models can optimized to reproduce repolarization delays consistent with those seen clinically in the congenital LQT patient datasets, providing optimism for clinically-related model usage (Mann et al., 2016). A concern remains, however, as to whether these in silico models, optimized in terms of action potential properties, replicate dynamics of intracellular ionic concentrations well enough to reliably predict TdP risk. For example, when optimizing a model in terms of its electrical activity only, it can be difficult to correctly identify parameters that mainly control ionic concentrations (Groenendaal et al., 2015). Indeed, previous modeling studies have shown how identical-looking action potentials, modeled using different combinations of model parameters, can have differing calcium transients (Sarkar and Sobie, 2010).
To investigate this possible limitation, we therefore carried out a multi-variable optimization, using both clinical congenital LQT data and constraints on the concentrations on intracellular Ca2+ and intracellular Na+ ([Ca2+]i and [Na+]i). We then asked whether optimized models that better represent the congenital LQT syndromes might allow for more accurate and more reliable modeling of acquired LQT and TdP risk. To this end, we simulated 86 cases of multi-channel drug block with known TdP risk level (Lancaster and Sobie, 2016) and found that the model optimized in terms of both action potential and [Ca2+]i, and [Na+]i data, better predicts TdP risk.
2. Methods
2.1. Cell Model and Drug Simulations
Simulations were performed using the O'Hara-Rudy (ORd; O'Hara et al., 2011) human ventricular ionic model as the baseline model, as this is the model proposed to be used in the CiPA initiative (Colatsky et al., 2016; Fermini et al., 2016). We used endocardial myocyte parameter settings except where otherwise noted (Figure 4A). We used a 1 Hz pacing rate and corresponding steady-state initial conditions (O'Hara et al., 2011). For each perturbation to the model (simulating drug block or LQT syndromes and parameter changes during the optimization; detailed below), the model was simulated for 500 beats prior to collecting data. We quantified action potential duration to 90% (APD90) or 50% (APD50) repolarization, as indicated. Calcium transients were characterized by diastolic level (the minimum [Ca2+]i attained within an action potential cycle cycle) and systolic concentration (the peak [Ca2+]i reached during an action potential). The [Na+]i varies little within a single action potential and was measured as the maximum value.
For our drug simulations, we used the datasets of Kramer et al. (2013) and Mirams et al. (2011) as curated by Lancaster and Sobie (2016) with an associated yes/no risk of torsadogenesis. For each drug, the dataset gives its estimated effective free therapeutic plasma concentration (EFTPC), along with IC50 values for block of the channels generating IKr, ICaL, and the fast sodium current (INa). Drug effect on each channel type was modeled as a conductance block based on a Hill equation with a coefficient of 1:
where Gx, drug is the maximal conductance of channel x in the presence of the drug. The dataset contains 86 entries, with some duplicate drugs modeled differently by the two original sources. There are therefore 68 different compounds in the set, covering a variety of intended clinical use, including anti-arrhythmics, anti-histamines, antipsychotics, hypertension/angina drugs, and others.
2.2. Drug Classification
To classify model output generated by these drug simulations we used a Support Vector Machine (SVM; Ben-Hur et al., 2008). We used linear decision boundaries separating two categories of data: TdP risk and no TdP risk. These decision boundaries were computed as the solution to a minimization of an error (E) calculated as the sum of squared distances between the location of miscategorized points and the boundary. Because the two variables used in the classification (APD50 and diastolic [Ca2+]i) have very different absolute values, we normalized them to baseline (i.e., no drug) values.
In general, the minimum value of E will take on different values when using different cell models to simulate drug effects, indicating that the separation of data points by category is better for some models than others. Therefore, to compare goodness of the classification between models and also to determine sensitivity of the decision boundaries, we calculate regions for which E remains below a threshold value (E*), which we set to twice the value of the lowest value of E found among the four tested models.
2.3. Model Optimization
We optimized the baseline ORd model based on clinical data from LQT patients, following a similar strategy as Mann et al. (2016) and using their QT interval data for control patients and patients with one of the three most prevalent congenital LQT syndromes: LQT1, LQT2, or LQT3. The QT interval data from LQT1 and LQT2 patients came from a patient cohort with heterozygote nonsense mutations only, as that can be mimicked in the model by decreasing the conductances of IKs and IKr by 50%, respectively. The LQT3 cohort data is more heterogenous and the subtype was simulated by increasing the conductance of INaL by a factor that was allowed to vary as part of the optimization process. The amount of QT interval prolongation in these patient groups was 12.2% for LQT1, 16.6% for LQT2, and 16.2% for LQT3. Mapping the delayed repolarization measured clinically as QT interval prolongation directly to APD90 prolongation in the cell model, the objective data set was 267.97 ms (control), 301.14 ms (LQT1), 312.20 ms (LQT2), and 311.55 (LQT3).
In its simplest setup, the optimization was designed to minimize a sum-of-squares error from the APD90 objective when subjecting the model to control conditions and each of the LQT subtypes 1, 2, and 3. We refer to this as the “APDLQT" optimization. In other optimizations, we included [Ca2+]i and [Na+]i information in the objective to improve the optimization outcome. This “multi-variable” optimization was done by adding a hefty error (200 ms squared) if [Ca2+]i and [Na+]i fell outside a certain range during the control condition. We used a range of 0.05–0.15 μM for diastolic [Ca2+]i, 0.3–0.7 μM for systolic [Ca2+]i, and 7–10 mM for [Na+]i based on measurements in human ventricular myocytes and recent modeling work (Beuckelmann et al., 1992; Piacentino et al., 2003; Grandi et al., 2010).
For the optimization method, we used a genetic algorithm (GA), which is a global optimization method that has been successful in optimizing cardiac ionic models to experimental and simulated data (Syed et al., 2005; Bot et al., 2012; Kaur et al., 2014; Groenendaal et al., 2015). We used a population size of 200 individual model instantiations and ran each GA for 50 generations. All other settings specific to the GA (detailing selection, crossover, mutation, and elitism) were defined as detailed previously (Bot et al., 2012). Because of the stochasticity inherent to the GA, each optimization was run ten times. We used the run resulting in the lowest error as the optimized model.
The parameters to be determined in the optimization process are scaling factors for the currents IKr, ICaL, INaL, the slow delayed rectifier current (IKs), the sodium-calcium exchange current (INCX), the sodium-potassium pump current (INaK), and the extent of INaL increase with simulated LQT3. All scaling parameters were allowed to vary from 0.1% to 10-fold their values in the baseline model.
Note that for ease and consistency we will refer to current scaling factors as scaling of maximal conductances (and use GKr, GCaL, GNaL, GKs, GNCX, and GNaK for the currents defined above), although some currents are technically scaled by a permeability or a maximal charge carried.
3. Results
3.1. Sensitivity of APD, [Ca2+]i, and [Na+]i in Baseline Model
To help guide our optimization procedure, we first did a sensitivity analysis to the major conductances as parameters with low sensitivity are problematic to determine in an optimization.
In the baseline ORd model, the action potential duration of the ORd model is highly sensitive to changes in IKr (Figure 1A). For example, when decreasing GKr by 50% to simulate LQT2, the response is a prolongation of APD90 by 117 ms (44%), substantially larger than the QT interval prolongation of 68 ms (16.6%) seen in LQT2 patients with heterozygote nonsense mutations (Mann et al., 2016). The APD has an intermediate sensitivity on GCaL, but shows little sensitivity to variations in GKs and GNaL, the currents associated with LQT1 and LQT3, respectively. For example, reducing GKs by 50% to mimic LQT1, gives a modest 8-ms (3%) APD90 prolongation, much shorter than the 51 ms (12%) QT interval prolongation seen clinically (Mann et al., 2016).
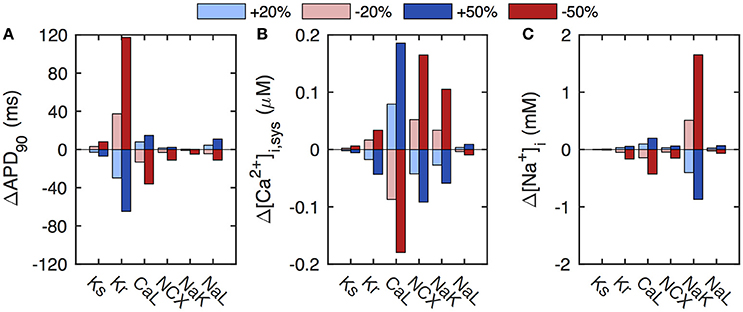
Figure 1. Sensitivity of baseline ORd model to select conductances. (A) The APD of the baseline model has a strong sensitivity to the conductance of IKr. (B) The calcium transient (quantified here as systolic [Ca2+]i) depends sensitively on GCaL, GNCX, and GNaK. (C) The level of [Na+]i depends mainly on GNaK. Conductances were varied by ±20% (light blue/red) and ±50% (dark blue/red) of baseline values.
As expected, the calcium transient has a very different parameter sensitivity dependence. It depends strongly on the conductances of ICaL and INCX, with a 50% increase in GCaL or a 50% reduction of GNCX increasing systolic [Ca2+]i by almost 0.2 μM (Figure 1B). The calcium dynamics also has a significant dependence on GNaK, which only controls [Ca2+]i indirectly via [Na+]i changes that regulate INCX. Indeed, [Na+]i depends sensitively on GNaK, with a 50% reduction in GNaK resulting in a 1.7 mM increase in [Na+]i (Figure 1C). Variations in the remaining key conductances have little influence on [Na+]i levels.
These results are consistent with those presented previously for ±10 and ±20% parameter variations in the ORd model (O'Hara et al., 2011).
3.2. Model Optimization
As it is difficult to estimate parameters to which an output is not sensitive, the above analysis suggests that if optimizing the baseline ORd model to APD data only, it will be problematic to estimate many of the conductance parameters. Including repolarization delay data from LQT types 1, 2, and 3 as additional information to the objective may help determine the scaling of GKs, GKr, and GNaL. Further, pinpointing these parameters may narrow down other conductances that correlate with these more directly determined parameters (Groenendaal et al., 2015). The sensitivity analysis also indicates that inclusion of calcium transient data to the optimization objective should help determine GNCX and GNaK scaling, and that incorporation of [Na+]i may further help determination of GNaK scaling.
We therefore optimized the baseline ORd model to both clinical QT interval data from LQT patients and [Ca2+]i and [Na+]i as detailed in section 2.3. The model optimized to this multi-variable objective produces APD90 values that are within 3% of their target values (Figure 2). The optimized parameter scaling factors are given in Table 1. The optimized model has a much increased GKs, resulting in a larger response to the simulated LQT1 condition, matching the target data (Figure 2).
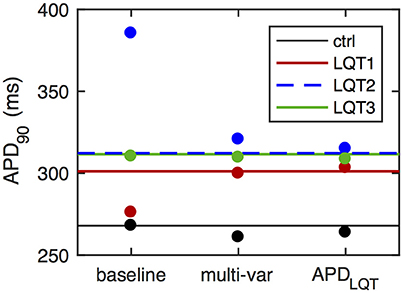
Figure 2. APD values of optimized models. Horizontal lines give control APD90 (black) as well as APD90 surrogates for QT interval prolongation in LQT patients (colored). These APD values form the optimization objective in the simplest case (“APDLQT”). For the multi-variable optimization (“multi-var”), the objective also include constraints on [Ca2+]i and [Na+]i. Dots give APD90 values under control simulations (black) and during LQT simulations (LQT1, red; LQT2, blue; LQT3, green). The overestimation of the LQT2 response and the underestimation of the LQT1 response in the baseline ORd model are eliminated in the optimized models. Relative APD90 prolongation in the baseline model is 3.0, 43.8, and 15.8%, for LQT1, LQT2, and LQT3, respectively. For the multi-variable optimized model, relative APD90 prolongation is 14.9, 22.9, and 18.6% for LQT1-3, while for the APDLQT-optimized model the corresponding values are 14.5, 19.4, and 17.0%. The target QT interval values are 12.2, 16.6, and 16.2%.
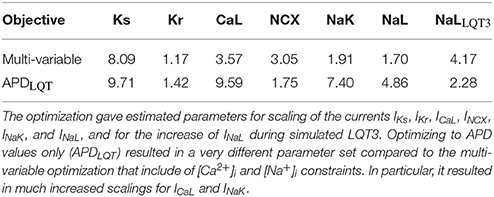
Table 1. Scaling factors for optimized models.
Optimizing the baseline model to APD values only (i.e., omitting the [Ca2+]i and [Na+]i constraints) results in slightly better matching of the objective (Figure 2; errors with 2%). Optimized parameter values are very different, with large increases in scaling of GCaL and GNaK in addition to the enhanced GKs scaling (Table 1).
Despite the diversity in parameter scalings among the baseline and the optimized models, the action potential morphology is quite similar across these differently parameterized models (Figure 3A). We also include for comparison the action potential generated by Mann et al. in an optimization to clinical LQT data under both baseline and β-adrenergic conditions (“APDLQT±βAdr” optimization, Mann et al., 2016). The main difference among the action potential waveforms is a depolarization of phase 2 of the action potential, the amount of which correlates with the upscaling of GCaL from the baseline model (about 2–4 in the multivariable and APDLQT±βAdr models, and almost 10 in the APDLQT model).
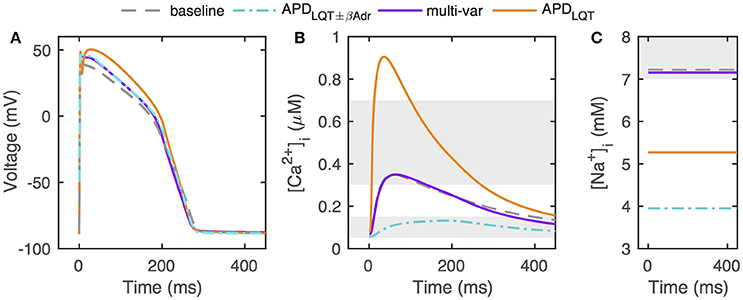
Figure 3. Action potentials, calcium transients, and [Na+]i in optimized models. (A) Optimized models have similar action potentials under control conditions, but the different parameter sets underlying the different solutions give rise to some waveform variation. (B) Despite having comparable action potentials, models optimized without constraints on [Ca2+]i and [Na+]i can have widely different calcium transients. Shaded areas give constraints on minimum and maximum [Ca2+]i (0.05–0.15 and 0.3–0.7μM, respectively). (C) Without constraints on [Ca2+]i and [Na+]i, optimization can result in models with very low [Na+]i levels. Shaded area indicate constraint on [Na+]i (7–10mM). “APDLQT±βAdr” designates the original optimization to clinical LQT data under normal and β-adrenergic stimulation conditions by Mann et al. (2016).
However, calcium transients and [Na+]i levels are vastly different across models (Figures 3B,C). When including [Ca2+]i and [Na+]i constraints in the optimization, the optimized calcium transient and [Na+]i level are very close to those of the baseline model, despite the allowed ranges being relatively large (0.05–0.15 μM for diastolic [Ca2+]i, 0.3–0.7 μM for systolic [Ca2+]i, and 7–10 mM for [Na+]i). In our optimizations, when optimizing to APD only, the calcium transient is significantly enhanced. This is consistent with the much boosted GCaL and the decreased GNCX scaling (relative to the multi-variable optimization) both of which favor a larger calcium transient. In addition, the GNaK scaling is much increased when optimizing to APD only, consistent with the lower [Na+]i. For the APDLQT±βAdr optimized model (Mann et al., 2016), both GNCX and GNaK were much increased relative to baseline (scaling of 2.95 and 9.12, respectively), resulting in a small-amplitude calcium transient and a low [Na+]i.
3.3. TdP Prediction
To test how well the optimized models predict TdP risk, we used a dataset consisting of drugs blocking IKr, ICaL, and INa to varying degrees, and their associated risk of torsadogenesis (TdP positive or TdP negative; Lancaster and Sobie, 2016). As demonstrated previously, while many of the drugs in this dataset that carry a TdP risk do prolong APD, some drug simulations predict an increased APD for TdP negative drugs (Figure 4A, Lancaster and Sobie, 2016). In particular, in the baseline model, simulations of three non-torsadogenic drugs results in action potential prolongation of 15–25 ms (one of these is noted by a black dot in Figure 4A). As demonstrated by Lancaster and Sobie, simulations of those three drugs also led to a decreased diastolic [Ca2+]i, which was not seen in the TdP positive drugs. Therefore, including diastolic [Ca2+]i as a second metric (APD50 being the first) by which to classify the drugs, allows for a correct TdP risk categorization of these three otherwise false positives (Figure 4A, Lancaster and Sobie, 2016). Indeed, using APD50 and diastolic [Ca2+]i in combination correctly classifies drugs in the dataset with high specificity and sensitivity (Figure 4A, Lancaster and Sobie, 2016).
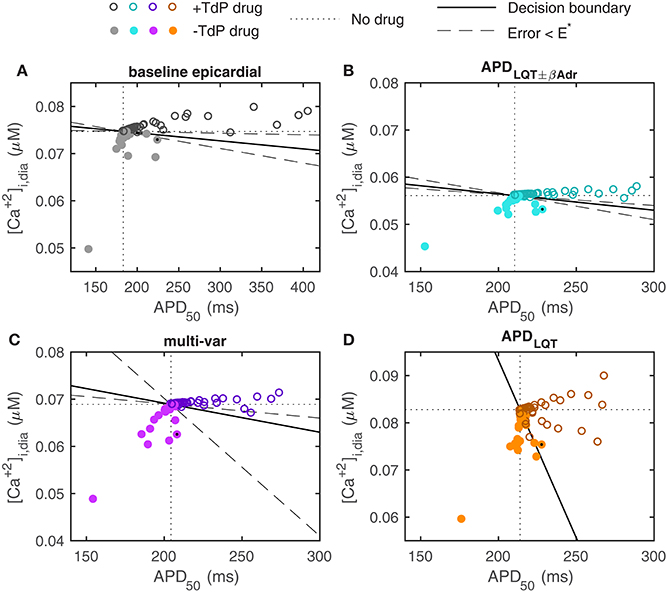
Figure 4. Prediction of TdP risk from model simulations. (A) Baseline ORd model with epicardial myocyte parameter settings (the epicardial configuration is shown here as it was determined to give the best classification in Lancaster and Sobie, 2016. Using the endocardial baseline model yields very similar results). (B) APDLQT±βAdr optimized model. (C) Multi-variable optimized model. (D) APDLQT optimized model. Dotted lines indicate no-drug control values of APD50 and diastolic [Ca2+]i. Colors for the different models correspond to the color scheme in Figure 3. Solid lines give decision boundaries between torsadogenic (open circles) and non-torsadogenic drugs (filled circles). Dashed lines demarcate regions within which the categorization error remains below a threshold value (E*). Using the multi-variable optimized model, all drugs that prolong APD50 by more than 5 ms are known TdP risk drugs. Verapamil (marked by black dot) is an example of a TdP negative drug that significantly prolongs the AP in the baseline and APD-optimized models but not in the multi-variable optimized model.
For the APDLQT±βAdr optimized model (Mann et al., 2016), qualitatively similar results are observed (Figure 4B). The particular values of diastolic [Ca2+]i over which TdP positive drugs are separated from TdP negative drugs are shifted, reflecting baseline differences. The same three TdP negative compounds that resulted in APD prolongation in the baseline model, give increased APD50 in this optimized model as well.
When simulating drug application in the multi-variable optimized model, predictions are improved (Figure 4C). In particular, none of the TdP negative drugs result in APD50 prolongation beyond 5 ms, implying that APD50 prolongation in itself is a strong predictor of torsadogenic risk in this model. In addition, many of the TdP negative compounds result in more substantial reductions in APD50 and/or diastolic [Ca2+]i compared to the baseline and the APDLQT±βAdr optimized models. There is therefore an increased flexibility to the positioning of the decision boundary separating the TdP positive from the TdP negative drugs (dashed lines in Figure 4C mark off area within which the categorization error remains less than the threshold value, E*).
For the APDLQT optimized model, the classification is less successful (Figure 4D). The same three TdP negative drugs that resulted in false positive APD prolongation in the baseline and in the APDLQT±βAdr optimized model do so here. Further, simulation of several TdP positive drugs result in decreased diastolic [Ca2+]i without much change in APD and therefore form false negatives in this categorization. The presence of these false positives and negatives pose a challenge to the classification and prevents the categorization error from getting below the threshold value regardless of the location of the decision boundary.
What are the ionic mechanisms underlying the improvement in predictive ability by the multi-var model? The simulated drugs that give the false positive APD prolongations for the baseline and APD-optimized models are piperacillin and verapamil (note that two independent measurements for verapamil are included in the dataset). These drugs block both ICaL and IKr. We investigated the ionics of verapamil (black dots in Figure 4) in more detail, as verapamil is a well-known example of an IKr-blocking agent that does not prolong the QT-interval and is not torsadogenic (Redfern et al., 2003).
A simulation of verapamil application in the baseline model is shown in Figure 5A. Drug-induced reductions in outward IKr and inward ICaL are seen to be of similar amplitude and balance each other during the first 200 ms of the action potential. When ICaL inactivates at this time, the loss of outward IKr is largely unopposed, leading to a decreased rate of repolarization and APD prolongation. In the multi-variable optimized model, the non-drug action potential is generated through a near-balance between a much increased ICaL and a larger INCX providing inward current against the outward currents IKr and IKs, with IKs now being of similar size as IKr (Figure 5B). When simulating verapamil application in the multi-var optimized model, there is a loss of inward current by the direct effect of ICaL conductance block and because of a reduction of INCX due to the decreased calcium transient. As both ICaL and INCX are increased in the multi-variable optimized model relative to the baseline model, the loss of inward current with verapamil application is amplified, preventing repolarization delays. Further, the increased IKs in the multi-var model helps maintain repolarization under verapamil application. Thus, factors beyond the scaling of the directly blocked currents IKr and ICaL contribute to the drug-induced response.
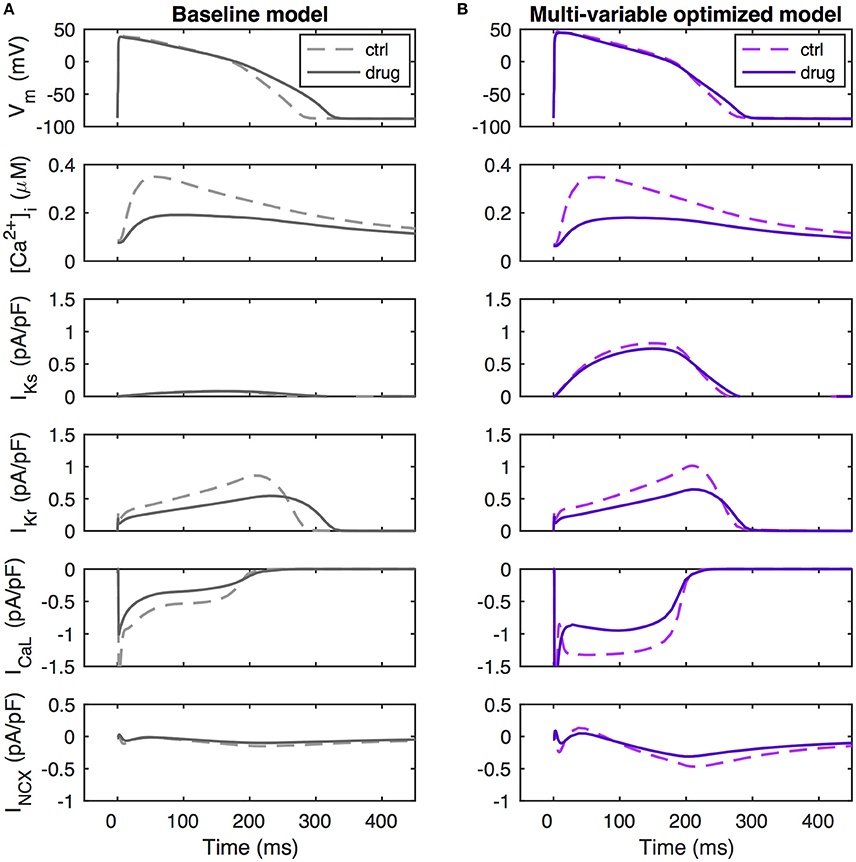
Figure 5. Ionic mechanisms of repolarization dynamics during verapamil application. (A) Baseline model. (B) Multi-variable optimized model. Verapamil (simulated as a scaling of GCaL by 0.64, a scaling of GKr by 0.55, and a scaling of GNa by 0.998) decrease IKr by similar amounts in the baseline and in the multi-variable optimized models. However, due to the up-regulated ICaL and INCX in the optimized model, it sustains a larger loss of inward current than the baseline model. Further, the increased IKs in this model provides a repolarization reserve. Together, these effects lead to a maintained APD50 value and an only slightly increased value of APD90.
4. Discussion
We investigated optimization of conductance parameters in a human ventricular myocyte model to match clinical data from LQT patients using constraints on the concentrations of intracellular calcium and sodium ions. Without these constraints, parameter optimization can lead to models with unphysiological calcium transient and [Na+]i. To test the hypothesis that the optimization would allow the model to make improved predictions of drug-induced arrhythmogenesis, we investigated the ability of the model to determine TdP risk in a large set of known drugs. We found that using the optimized model improves TdP prediction in two complementary manners. First, simulations of three TdP negative drugs that result in APD prolongation using the baseline model result in no or minimal APD prolongation when using the optimized model. Second, when using both diastolic [Ca2+]i and APD50 for the model-based drug classification, the optimized model gives an improved separation between the TdP positive and negative drugs, measured as an increased flexibility in the positioning of the decision boundary. Based on these findings, our main conclusion is that intracellular ionic concentrations are important for safety pharmacology modeling.
4.1. In Silico TdP Prediction
Other studies have investigated ionic-model-based TdP prediction using different approaches. It is clear from these studies that a range of strategies can be applied to improve TdP prediction. First, there is improvement to the baseline model, which in itself can involve a number of approaches. One is to optimize a model to clinical LQT data, as done here or previously (Mann et al., 2016). Conceptually, fitting a cellular model to clinical ECG data rather than to experimental cellular-level data may appear counter-intuitive, but it makes sense given that the model is used to predict an organ-level, rather than a cellular-level, arrhythmia risk. Another model optimization approach is to tune the model to experimental data obtained with ion channel blockers. Such data can be additional to the data used originally to build the baseline model, as in the example of a canine model that upon optimization delivered improved prediction of test drug data (Davies et al., 2012). In another article in this Research Topic, Dutta et al. (2017) used drug data presented in the original ORd model paper to reparameterize the ORd model. This optimization was done in conjunction with another model improvement strategy: re-casting the IKr description as a Markov model with state- and voltage-dependent drug block (Li et al., 2017). An alternative strategy to optimizing a model is to generate a population of models to represent inter-individual and/or inter-cell variability, potentially recapitulating variability in drug response across a heterogeneous population (Lancaster and Sobie, 2016; Britton et al., 2017). Another contribution to this Research Topic demonstrates that such population models predict TdP risk better than using a single baseline model (Passini et al., 2017). Population models may also be used to gain mechanistic insights into arrhythmogenesis. For example, Passini et al. determined that different sub-populations of models had different propensities to repolarization abnormalities, with low conductances for the outward currents IKr and INaK and increased levels of ICaL and INCX making models more prone to repolarization abnormalities, emphasizing that currents other than IKr are important in this aspect.
Second, TdP prediction may be improved by selection of better risk measures. While repolarization delay (APD or QT interval prolongation) has high sensitivity to TdP positive drugs, its specificity is more limited, with some drugs prolonging QT interval, yet carrying only low TdP risk (e.g., amiodarone; Sager et al., 2014). Measures that may be useful in risk stratification include diastolic [Ca2+]i (Lancaster and Sobie, 2016) as employed here. While this measure was selected, in combination with APD50, from a range of action potential and calcium transient biomarkers through a machine learning process, there is a mechanistic basis as to why [Ca2+]i levels may be associated with TdP risk, as abnormal intracellular calcium dynamics and spontaneous calcium release is associated with EAD formation, a cellular-level trigger of TdP (Lancaster and Sobie, 2016; Němec et al., 2016). Another risk measure proposed from in silico work is the net charge carried during the action potential by six major ionic currents (Dutta et al., 2017; Li et al., 2017). This measure may also be mechanistically linked to TdP arrhythmogenesis, as it is indicative of robustness against EAD generation under a GKr-reduction challenge (Dutta et al., 2017). Use of repolarization abnormality occurrence (i.e., EADs or incomplete repolarization) in simulations as a metric for TdP risk may also present a viable stratification pathway (Passini et al., 2017). Given the direct link to arrhythmogenesis, this seems like a promising risk marker, but a possible limitation lies in its use of highly elevated drug concentrations to trigger the repolarization abnormalities, which may lead to an overestimation of the number of false negatives. Use of this metric rather than APD prolongation improves TdP prediction in a population of models, but not in the baseline ORd model (Passini et al., 2017).
In summary, it is clear that in silico cell models can be improved to better predict TdP risk and that measures beyond APD prolongation are helpful to this end, but it also apparent that significant uncertainties remain as to how to best carry out the modeling and the arrhythmia risk prediction.
4.2. Kr/Ks Balance
Our optimization resulted in significant rescaling of many parameters, in particular GKs, which was increased approximately eight-fold. This is comparable to the scaling of 5.75 found in Mann et al. (2016). In the baseline ORd model, IKs is relatively small under control conditions, its peak value during an action potential being roughly 10 times smaller than peak IKr. Significant upscaling of this current is therefore necessary to recapitulate the clinical LQT1 phenotype showing substantial QT interval prolongation with loss of IKs. Likewise, the Grandi-Bers model, another recent human ventricular myocyte model (Grandi et al., 2010) that has little reliance on IKs under control conditions, requires sizeable upscaling of GKs (about 25-fold) to reproduce the LQT1 clinical data (Mann et al., 2016). In contrast, the ten Tusscher-Panfilov human ventricular myocyte model (ten Tusscher and Panfilov, 2006) which has similarly sized IKs and IKr, requires increased GKr (2.65-fold) and decreased GKs (0.41-fold) to reproduce the clinical LQT dataset (Mann et al., 2016).
These substantial increases in GKs required for the ORd and the Grandi-Bers models to reproduce the clinical LQT data are at odds with the IKs ranges recorded experimentally. Factors that may contribute to this disagreement include: (1) Differences between levels of β-adrenergic-dependent kinases and phosphorylation which regulate IKs and exacerbate LQT1 (Wu et al., 2016); (2) Transmural or other intra-heart heterogeneity with some regions having especially delayed repolarization; (3) Methodological experimental limitations with IKs rundown and/or damage of the IKs channel due to enzymatic digestion—however, the recordings that formed the basis of GKs in the ORd model were done in small tissue preparations using microelectrodes for the express purpose of mitigating these complications (O'Hara et al., 2011).
The IKs conductance was also increased (by 87%) in the recent optimization of the ORd model with the Markov IKr formulation to the original O'Hara et al. data (Dutta et al., 2017). While this approximately doubled IKs at baseline, IKs remained much smaller than IKr (by about five-fold) and would not be expected to be able to reproduce the LQT1 phenotype. Because the particular balance between IKr and IKs can be important for action potential stability and EAD generation (Devenyi et al., 2017), one may expect a model with large GKs to behave differently from a model with smaller GKs model in terms of arrhythmogenesis. Because the reasons for the discrepancy between the experimental and the clinical IKs data are not known, it will likely be useful to the field to have both a model with large GKs, replicating the clinical LQT data, and a model with smaller GKs, replicating the experimental data.
The mismatch between the experimental and the clinically-based estimations of GKs also raises broader questions regarding how to best handle inconsistent data in model development. Our approach here has been to use data of perceived highest relevance to the particular type of predictions made, i.e., to use clinically-based parameter estimations to predict clinical arrhythmia risk. This approach is in line with the general strategy of using data specific to a particular system (e.g., a cell or a patient) to generate a model specific to that system. However, the best way forward may be to couple rigorously uncertainty in model parameters to uncertainty in model predictions using uncertainty quantification tools (Johnstone et al., 2016).
4.3. Effect of Verapamil on Action Potential Duration
The balance between different currents is also important for determining a model's response to simulated drug block. The anti-hypertension and anti-angina drug verapamil blocks ICaL and IKr, does not prolong the QT interval, and does not prolong APD in recordings from human trabeculae (Redfern et al., 2003; Britton et al., 2017). However, different human in silico models give different responses to simulated verapamil application. The Grandi-Bers and the ten Tusscher-Panfilov models predict action potential shortening in response to verapamil (Mirams et al., 2011, 2012). In variations of the ORd model, verapamil almost always prolongs the APD, but the response varies depending on drug concentration, on how block is modeled, and on whether a Markov model is used for IKr (Britton et al., 2017; Dutta et al., 2017; Passini et al., 2017).
One hypothesis as to why verapamil does not prolong APD is that its block of IKr is compensated for by block of ICaL. Using our multi-var optimized model, we show here that in addition to the block of ICaL, a secondary reduction in INCX (due to the decreased calcium transient) is important in off-setting the IKr block by verapamil. The size of the IKs current is also important in determining APD under IKr block conditions as IKs provides a repolarization reserve. However, IKs level in itself is not predictive of APD shortening with verapamil since in the APDLQT optimized model, which has a much increased repolarization reserve in IKs, verapamil leads to APD prolongation.
4.4. Limitations
There are several limitations to our modeling and optimization approach. We allowed large ranges of the scaling (0.1% to 10-fold) of the parameters to be estimated in the optimization. Consequentially, the conductance scalings may be unphysiologically large, with, e.g., GKs becoming larger than estimated experimentally. However, we are explicitly not attempting to make the best model of a single cell or small tissue, but, rather, a model capable of making clinically relevant predictions. We did not include the clinical data from control and LQT types 1, 2, and 3 patients during β-adrenergic stimulation (Mann et al., 2016) in the optimization objective as preliminary optimizations with this addition resulted in adrenergically stimulated action potentials having unsmooth repolarization profiles, characterized by slow late repolarization. Due to experimental difficulties in determining absolute values of [Ca2+]i and [Na+]i, we based the allowed ranges of these mainly on modeling work, particularly the ORd and the Grandi-Bers models. While experimental measurements of [Ca2+]i in human ventricular myocytes are consistent with the simulated values (Beuckelmann et al., 1992; Piacentino et al., 2003), reported measurements of [Na+]i are much higher (~20 mM), but may be overestimated (Pieske et al., 2002; Grandi et al., 2010). While the inclusion of bounds on [Ca2+]i and [Na+]i provided additional information to constrain conductance parameters, it is likely that inclusion of more data into the objective would help constrain parameters further. Such data could include more repolarization markers, further calcium transient features, and drug block data.
We modeled the drug application using a simple conductance block, although some drugs are known to block in a state-dependent manner (Mirams et al., 2011; Di Veroli et al., 2014; Britton et al., 2017; Dutta et al., 2017). However, use of this simpler approach allowed us to simulate a larger drug data set. We used a single model for the drug simulations. It might be valuable in future work to generate a population of models around the optimized model to potentially improve predictions and to give insights into ionic mechanisms underlying population heterogeneity in drug responses.
Author Contributions
TK-M: Designed study, carried out simulations, and analyzed data; AFJ and FAO: Implemented the optimization software. All authors contributed to critical revision of the manuscript.
Funding
This work was supported by funding from the National Institutes of Health grant U01HL136297 (to DJC). AFJ acknowledges funding from the Weill Cornell Medicine & Memorial Sloan Kettering Cancer Center Computational Biology Summer Program.
Conflict of Interest Statement
The authors declare that the research was conducted in the absence of any commercial or financial relationships that could be construed as a potential conflict of interest.
References
Ben-Hur, A., Ong, C. S., Sonnenburg, S., Schölkopf, B., and Rätsch, G. (2008). Support vector machines and kernels for computational biology. PLoS Comput. Biol. 4:e1000173. doi: 10.1371/journal.pcbi.1000173
Beuckelmann, D. J., Näbauer, M., and Erdmann, E. (1992). Intracellular calcium handling in isolated ventricular myocytes from patients with terminal heart failure. Circulation 85, 1046–1055.
Bot, C. T., Kherlopian, A. R., Ortega, F. A., Christini, D. J., and Krogh-Madsen, T. (2012). Rapid genetic algorithm optimization of a mouse computational model: benefits for anthropomorphization of neonatal mouse cardiomyocytes. Front. Physiol. 3:421. doi: 10.3389/fphys.2012.00421
Britton, O. J., Abi-Gerges, N., Page, G., Ghetti, A., Miller, P. E., and Rodriguez, B. (2017). Quantitative comparison of effects of dofetilide, sotalol, quinidine, and verapamil between human ex vivo trabeculae and in silico ventricular models incorporating inter-individual action potential variability. Front. Physiol. 8:597. doi: 10.3389/fphys.2017.00597
Colatsky, T., Fermini, B., Gintant, G., Pierson, J. B., Sager, P., Sekino, Y., et al. (2016). The Comprehensive in Vitro Proarrhythmia Assay (CiPA) initiative - Update on progress. J. Pharmacol. Toxicol. Methods. 81, 15–20. doi: 10.1016/j.vascn.2016.06.002
Davies, M. R., Mistry, H. B., Hussein, L., Pollard, C. E., Valentin, J. P., Swinton, J., et al. (2012). An in silico canine cardiac midmyocardial action potential duration model as a tool for early drug safety assessment. Am. J. Physiol. Heart Circ. Physiol. 302, H1466–H1480. doi: 10.1152/ajpheart.00808.2011
Devenyi, R. A., Ortega, F. A., Groenendaal, W., Krogh-Madsen, T., Christini, D. J., and Sobie, E. A. (2017). Differential roles of two delayed rectifier potassium currents in regulation of ventricular action potential duration and arrhythmia susceptibility. J. Physiol. 595, 2301–2317. doi: 10.1113/JP273191
Di Veroli, G. Y., Davies, M. R., Zhang, H., Abi-Gerges, N., and Boyett, M. R. (2014). hERG inhibitors with similar potency but different binding kinetics do not pose the same proarrhythmic risk: implications for drug safety assessment. J. Cardiovasc. Electrophysiol. 25, 197–207. doi: 10.1111/jce.12289
Dutta, S., Chang, K. C., Beattie, K. A., Sheng, J., Tran, P. N., Wu, W. W., et al. (2017). Optimization of an in silico cardiac cell model for proarrhythmia risk assessment. Front. Physiol. 8:616. doi: 10.3389/fphys.2017.00616
Fermini, B., Hancox, J. C., Abi-Gerges, N., Bridgland-Taylor, M., Chaudhary, K. W., Colatsky, T., et al. (2016). A new perspective in the field of cardiac safety testing through the Comprehensive In Vitro Proarrhythmia Assay paradigm. J. Biomol. Screen. 21, 1–11. doi: 10.1177/1087057115594589
Gintant, G., Sager, P. T., and Stockbridge, N. (2016). Evolution of strategies to improve preclinical cardiac safety testing. Nat. Rev. Drug. Discov. 15, 457–471. doi: 10.1038/nrd.2015.34
Grandi, E., Pasqualini, F. S., and Bers, D. M. (2010). A novel computational model of the human ventricular action potential and Ca transient. J. Mol. Cell. Cardiol. 48, 112–121. doi: 10.1016/j.yjmcc.2009.09.019
Groenendaal, W., Ortega, F. A., Kherlopian, A. R., Zygmunt, A. C., Krogh-Madsen, T., and Christini, D. J. (2015). Cell-specific cardiac electrophysiology models. PLoS Comput. Biol. 11:e1004242. doi: 10.1371/journal.pcbi.1004242
Hale, S. L., Shryock, J. C., Belardinelli, L., Sweeney, M., and Kloner, R. A. (2008). Late sodium current inhibition as a new cardioprotective approach. J. Mol. Cell. Cardiol. 44, 954–967. doi: 10.1016/j.yjmcc.2008.03.019
Hoffmann, P., and Warner, B. (2006). Are hERG channel inhibition and QT interval prolongation all there is in drug-induced torsadogenesis? A review of emerging trends. J. Pharmacol. Toxicol. Methods 53, 87–105. doi: 10.1016/j.vascn.2005.07.003
Johnstone, R. H., Chang, E. T. Y., Bardenet, R., de Boer, T. P., Gavaghan, D. J., Pathmanathan, P., et al. (2016). Uncertainty and variability in models of the cardiac action potential: Can we build trustworthy models? J. Mol. Cell. Cardiol. 96, 49–62. doi: 10.1016/j.yjmcc.2015.11.018
Kaur, J., Nygren, A., and Vigmond, E. J. (2014). Fitting membrane resistance along with action potential shape in cardiac myocytes improves convergence: application of a multi-objective parallel genetic algorithm. PLoS ONE 9:e107984. doi: 10.1371/journal.pone.0107984
Kim, J. J., Němec, J., Li, Q., and Salama, G. (2015). Synchronous systolic subcellular Ca2+-elevations underlie ventricular arrhythmia in drug-induced long QT type 2. Circ. Arrhythm. Electrophysiol. 8, 703–712. doi: 10.1161/CIRCEP.114.002214
Kramer, J., Obejero-Paz, C. A., Myatt, G., Kuryshev, Y. A., Bruening-Wright, A., Verducci, J. S., et al. (2013). MICE models: superior to the HERG model in predicting Torsade de Pointes. Sci. Rep. 3:2100. doi: 10.1038/srep02100
Krogh-Madsen, T., and Christini, D. J. (2017). Slow [Na+]i dynamics impacts arrhythmogenesis and spiral wave reentry in cardiac myocyte ionic model. Chaos 27, 93907–93912. doi: 10.1063/1.4999475
Lancaster, M. C., and Sobie, E. A. (2016). Improved prediction of drug-induced Torsades de Pointes through simulations of dynamics and machine learning algorithms. Clin. Pharmacol. Ther. 100, 371–379. doi: 10.1002/cpt.367
Lankipalli, R. S., Zhu, T., Guo, D., and Yan, G.-X. (2005). Mechanisms underlying arrhythmogenesis in long QT syndrome. J. Electrocardiol. 38(4 Suppl.), 69–73. doi: 10.1016/j.jelectrocard.2005.06.008
Li, Z., Dutta, S., Sheng, J., Tran, P. N., Wu, W., Chang, K., et al. (2017). Improving the in silico assessment of proarrhythmia risk by combining hERG (Human Ether-à-go-go-Related Gene) channel-drug binding iinetics and multichannel pharmacology. Circ. Arrhythm. Electrophysiol. 10:e004628. doi: 10.1161/CIRCEP.116.004628
Mann, S. A., Imtiaz, M., Winbo, A., Rydberg, A., Perry, M. D., Couderc, J.-P., et al. (2016). Convergence of models of human ventricular myocyte electrophysiology after global optimization to recapitulate clinical long QT phenotypes. J. Mol. Cell. Cardiol. 100, 25–34. doi: 10.1016/j.yjmcc.2016.09.011
Mirams, G. R., Cui, Y., Sher, A., Fink, M., Cooper, J., Heath, B. M., et al. (2011). Simulation of multiple ion channel block provides improved early prediction of compounds' clinical torsadogenic risk. Cardiovasc. Res. 91, 53–61. doi: 10.1093/cvr/cvr044
Mirams, G. R., Davies, M. R. M., Cui, Y. Y., Kohl, P. P., and Noble, D. D. (2012). Application of cardiac electrophysiology simulations to pro-arrhythmic safety testing. Br. J. Pharmacol. 167, 932–945. doi: 10.1111/j.1476-5381.2012.02020.x
Mistry, H. B., Davies, M. R., and Di Veroli, G. Y. (2015). A new classifier-based strategy for in-silico ion-channel cardiac drug safety assessment. Front. Pharmacol. 6:59. doi: 10.3389/fphar.2015.00059
Němec, J., Kim, J. J., and Salama, G. (2016). The link between abnormal calcium handling and electrical instability in acquired long QT syndrome - Does calcium precipitate arrhythmic storms? Prog. Biophys. Mol. Biol. 120, 210–221. doi: 10.1016/j.pbiomolbio.2015.11.00
O'Hara, T., Virág, L., Varró, A., and Rudy, Y. (2011). Simulation of the undiseased human cardiac ventricular action potential: model formulation and experimental validation. PLoS Comput. Biol. 7:e1002061. doi: 10.1371/journal.pcbi.1002061
Passini, E., Britton, O. J., Lu, H. R., Rohrbacher, J., Hermans, A. N., Gallacher, D. J., et al. (2017). Human in silico drug trials demonstrate higher accuracy than animal models in predicting clinical pro-arrhythmic cardiotoxicity. Front. Physiol. 8:668. doi: 10.3389/fphys.2017.00668
Piacentino, V., Weber, C. R., Chen, X., Weisser-Thomas, J., Margulies, K. B., Bers, D. M., et al. (2003). Cellular basis of abnormal calcium transients of failing human ventricular myocytes. Circ. Res. 92, 651–658. doi: 10.1161/01.RES.0000062469.83985.9B
Pieske, B., Maier, L. S., Piacentino, V., Weisser, J., Hasenfuss, G., and Houser, S. (2002). Rate dependence of [Na+]i and contractility in nonfailing and failing human myocardium. Circulation 106, 447–453.
Redfern, W. S., Carlsson, L., Davis, A. S., Lynch, W. G., MacKenzie, I., Palethorpe, S., et al. (2003). Relationships between preclinical cardiac electrophysiology, clinical QT interval prolongation and torsade de pointes for a broad range of drugs: evidence for a provisional safety margin in drug development. Cardiovasc. Res. 58, 32–45.
Sager, P. T., Gintant, G., Turner, J. R., Pettit, S., and Stockbridge, N. (2014). Rechanneling the cardiac proarrhythmia safety paradigm: a meeting report from the Cardiac Safety Research Consortium. Am. Heart J. 167, 292–300. doi: 10.1016/j.ahj.2013.11.004
Sanguinetti, M. C., Jiang, C., Curran, M. E., and Keating, M. T. (1995). A mechanistic link between an inherited and an acquired cardiac arrhythmia: HERG encodes the IKr potassium channel. Cell 81, 299–307.
Sarkar, A. X., and Sobie, E. A. (2010). Regression analysis for constraining free parameters in electrophysiological models of cardiac cells. PLoS Comput. Biol. 6:e1000914. doi: 10.1371/journal.pcbi.1000914
Straus, S. M. J. M., Sturkenboom, M. C. J. M., Bleumink, G. S., Dieleman, J. P., van der Lei, J., de Graeff, P. A., et al. (2005). Non-cardiac QTc-prolonging drugs and the risk of sudden cardiac death. Eur. Heart J. 26, 2007–2012. doi: 10.1093/eurheartj/ehi312
Syed, Z., Vigmond, E., Nattel, S., and Leon, L. J. (2005). Atrial cell action potential parameter fitting using genetic algorithms. Med. Biol. Eng. Comput. 43, 561–571.
ten Tusscher, K. H. W. J., and Panfilov, A. V. (2006). Alternans and spiral breakup in a human ventricular tissue model. Am. J. Physiol. Heart Circ. Physiol. 291, H1088–H100. doi: 10.1152/ajpheart.00109.2006
Terentyev, D., Rees, C. M., Li, W., Cooper, L. L., Jindal, H. K., Peng, X., et al. (2014). Hyperphosphorylation of RyRs underlies triggered activity in transgenic rabbit model of LQT2 syndrome. Circ. Res. 115, 919–928. doi: 10.1161/CIRCRESAHA.115.305146
Wu, J., Ding, W.-G., and Horie, M. (2016). Molecular pathogenesis of long QT syndrome type 1. J. Arrhythm. 32, 381–388. doi: 10.1016/j.joa.2015.12.006
Xie, Y., Liao, Z., Grandi, E., Shiferaw, Y., and Bers, D. M. (2015). Slow [Na]i changes and positive feedback between membrane potential and [Ca]i underlie intermittent early afterdepolarizations and arrhythmias. Circ. Arrhythm. Electrophysiol. 8, 1472–1480. doi: 10.1161/CIRCEP.115.003085
Keywords: cardiac modeling, model optimization, safety pharmacology, long QT, in silico drug trial, cardiotoxicity
Citation: Krogh-Madsen T, Jacobson AF, Ortega FA and Christini DJ (2017) Global Optimization of Ventricular Myocyte Model to Multi-Variable Objective Improves Predictions of Drug-Induced Torsades de Pointes. Front. Physiol. 8:1059. doi: 10.3389/fphys.2017.01059
Received: 07 October 2017; Accepted: 04 December 2017;
Published: 19 December 2017.
Edited by:
Stefano Morotti, University of California, Davis, United StatesReviewed by:
Jamie Vandenberg, Victor Chang Cardiac Research Institute, AustraliaThomas Hund, The Ohio State University, United States
Kelly C. Chang, United States Department of Health and Human Services, United States
Copyright © 2017 Krogh-Madsen, Jacobson, Ortega and Christini. This is an open-access article distributed under the terms of the Creative Commons Attribution License (CC BY). The use, distribution or reproduction in other forums is permitted, provided the original author(s) or licensor are credited and that the original publication in this journal is cited, in accordance with accepted academic practice. No use, distribution or reproduction is permitted which does not comply with these terms.
*Correspondence: David J. Christini, dchristi@med.cornell.edu