 Clare Stawski
 Paweł Koteja
 Edyta T. Sadowska
- 1Faculty of Biology and Earth Sciences, Institute of Environmental Sciences, Jagiellonian University, Kraków, Poland
- 2Department of Biology, Norwegian University of Science and Technology, Trondheim, Norway
According to the “aerobic capacity model,” endothermy in birds and mammals evolved as a result of natural selection favoring increased persistent locomotor activity, fuelled by aerobic metabolism. However, this also increased energy expenditure even during rest, with the lowest metabolic rates occurring in the thermoneutral zone (TNZ) and increasing at ambient temperatures (Ta) below and above this range, depicted by the thermoregulatory curve. In our experimental evolution system, four lines of bank voles (Myodes glareolus) have been selected for high swim-induced aerobic metabolism and four unselected lines have been maintained as a control. In addition to a 50% higher rate of oxygen consumption during swimming, the selected lines have also evolved a 7.3% higher mass-adjusted basal metabolic rate. Therefore, we asked whether voles from selected lines would also display a shift in the thermoregulatory curve and an increased body temperature (Tb) during exposure to high Ta. To test these hypotheses we measured the RMR and Tb of selected and control voles at Ta from 10 to 34°C. As expected, RMR within and around the TNZ was higher in selected lines. Further, the Tb of selected lines within the TNZ was greater than the Tb of control lines, particularly at the maximum measured Ta of 34°C, suggesting that selected voles are more prone to hyperthermia. Interestingly, our results revealed that while the slope of the thermoregulatory curve below the lower critical temperature (LCT) is significantly lower in the selected lines, the LCT (26.1°C) does not differ. Importantly, selected voles also evolved a higher maximum thermogenesis, but thermal conductance did not increase. As a consequence, the minimum tolerated temperature, calculated from an extrapolation of the thermoregulatory curve, is 8.4°C lower in selected (−28.6°C) than in control lines (−20.2°C). Thus, selection for high aerobic exercise performance, even though operating under thermally neutral conditions, has resulted in the evolution of increased cold tolerance, which, under natural conditions, could allow voles to inhabit colder environments. Further, the results of the current experiment support the assumptions of the aerobic capacity model of the evolution of endothermy.
Introduction
One of the central issues in evolutionary physiology is the question of what mechanisms led to the evolution of complex adaptations. The evolution of endothermy, the internal production of heat, has been of particular interest as this mode of living not only provides benefits, but also harbors many costs (Bartholomew, 1982; Withers et al., 2016). Endothermy allowed birds and mammals to uncouple their lives from external sources of heat to become nocturnal and also to be active in cold habitats. However, to fuel such an existence endotherms must consume large amounts of food to provide enough energy to maintain a high and stable body temperature (Tb). Therefore, the question of what selection forces have led to such an energetically wasteful strategy has been subject to vivid discussion for already several decades (e.g., Bennett and Ruben, 1979; Hayes and Garland, 1995; Farmer, 2000, 2003; Koteja, 2000, 2004; Angilletta and Sears, 2003; Grigg et al., 2004; Kemp, 2006; Geiser, 2008; Clarke and Pörtner, 2010; Lovegrove, 2012, 2016). According to one of the hypotheses, the aerobic capacity model, high basal metabolic rates (BMR), i.e., a key feature of mammalian and avian endothermy, evolved as a correlated response to selection for high perpetual locomotion fueled by aerobic metabolism (Bennett and Ruben, 1979). The assumption of a positive correlation between aerobic capacity and BMR has been subject to numerous comparative, individual-level phenotypic and quantitative genetic analyses, which have generally provided convincing support (e.g., Hayes and Garland, 1995; Sadowska et al., 2005; Auer et al., 2017). However, to our knowledge, the question of how selection for high aerobic exercise performance affects other thermoregulatory traits has not been intensively studied. Therefore, the present study is based on a unique experimental evolution model system, with lines of the bank vole (Myodes glareolus) selected for several generations toward an increased exercise-induced aerobic metabolism (Sadowska et al., 2008; Konczal et al., 2015). In our previous reports, we showed that the selection indeed resulted in an increased BMR (Sadowska et al., 2015) and increased thermogenic capacity (the maximum cold-induced rate of oxygen consumption; Dheyongera et al., 2016). Here we ask, how the selection affected the “thermoregulatory curve” and other thermoregulatory traits.
The thermoregulatory curve (Figure 1), also known as the Scholander-Irving model, depicts the pattern of changes of resting metabolic rate (RMR) of an endothermic homeotherm over a range of ambient temperatures (Ta) (Scholander et al., 1950; McNab, 2002; Riek and Geiser, 2013; Levesque et al., 2016). In a range of Ta termed the thermoneutral zone (TNZ), heat balance can be maintained without producing extra heat above the level of BMR. At Ta below the lower boundary of TNZ (i.e., the lower critical temperature; LCT), RMR increases to compensate for greater heat loss. According to a simplified linear model, the heat loss, and hence RMR, is proportional to a total thermal conductance coefficient (c), which incorporates both the properties of thermal insulation of the animal's body and characteristics of evaporative heat loss: RMR = c(Tb−Ta) (McNab, 2002). If heat loss exceeds the thermogenic capacity of the animal, hypothermia occurs. On the other hand, at Ta above the upper boundary of the TNZ (i.e., the upper critical temperature; UCT), costly mechanisms of dissipating excess heat must be engaged to avoid overheating, such as increased evaporative cooling and increased blood circulation to distal body parts (these are depicted by the entire thermoregulatory curve model and cannot be explained by the Scholander-Irving model itself). Such processes, as well as passive thermodynamic effects due to an increased Tb, result in an elevated RMR, and consequently an enhanced thermoregulatory burden. Therefore, the increase of RMR above the TNZ is typically more rapid than that below the TNZ, and animals may become severely hyperthermic at Ta's just above the TNZ.
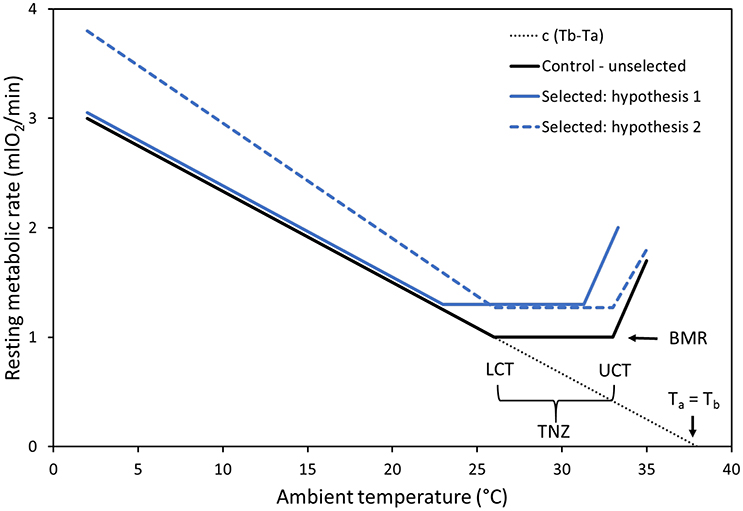
Figure 1. Graphical representation of the thermoregulatory curve and hypotheses concerning changes in response to selection for high activity-related metabolism. Control (C) lines are represented by the solid black line, with the thermoneutral zone (TNZ) depicted and encompassed by the lower critical temperature (LCT) and upper critical temperature (UCT). As we already know that BMR is increased in selected (A) lines, RMR in the TNZ should also be increased (blue lines). The solid blue line represents hypothesis 1, according to which in the A lines: (1a) both the LCT and the UCT are markedly shifted downwards, (1b) above the UCT the increase of RMR is higher, and (1c) below the LCT the thermoregulatory curve overlaps with that of the C lines. The dashed blue line represents hypothesis 2, according to which in the A lines: (2a) the position of the TNZ remains unaffected, (2b) above the UCT the increase of RMR is less steep, and (2c) below the LCT the thermoregulatory curve is steeper than in the control lines. See Introduction for justification of the hypothetical patterns. The dotted line represents heat balance = 0, condition extended to body temperature (Tb) equal to ambient temperature (Ta).
In the current study we aimed to quantify how the above-described thermoregulatory characteristics changed in lines of bank voles subject to selection for high rates of oxygen consumption achieved during swimming (O2swim; Sadowska et al., 2008, 2015, 2016). In generations 11–14 of the selection experiment, voles from the selected “Aerobic” (A) lines achieved about a 50% higher O2swim than those from unselected, control (C) lines. Not surprisingly, both the spontaneous locomotor activity in cages and the maximum forced-running oxygen consumption (the aerobic capacity per se) were also increased in the A lines (Jaromin et al., 2016a), as well as some other morphological and biochemical traits related to exercise metabolism (Stawski et al., 2015b; Jaromin et al., 2016b). Importantly, the swimming trials are performed at 38°C, therefore the direct selection is imposed on locomotor performance only, and not on thermoregulatory capability. According to the aerobic capacity model, however, we predicted that the evolution of aerobic exercise performance should also drive the evolution of thermoregulatory properties. Indeed, voles from the A lines evolved also a 7.3% higher mass-adjusted BMR, increased rate of food consumption (and hence presumably an increased average daily heat production), and increased thermogenic capacity (Sadowska et al., 2008, 2015; Dheyongera et al., 2016). Thus, a few traits crucial in shaping the thermoregulatory curve have changed in response to selection for aerobic exercise performance (although others, namely the capacity for nonshivering thermogenesis, NST, remained unaffected; Stawski et al., 2015a). Therefore, we hypothesize that other characteristics, especially the boundaries of the TNZ, thermal conductance, and Tb at high Ta have also changed.
As we already know that BMR (i.e., RMR measured in the TNZ in fasted animals; McNab, 2002), measured at a Ta of 28°C chosen to be plausibly within the TNZ of voles based on published data (Górecki, 1968), increased in the A lines (Sadowska et al., 2015), a straightforward expectation is that RMR measured at Ta around 28°C should be also higher in the A than in the C lines. However, further predictions can be only conditional, depending on how thermal conductance and Tb have changed (Figure 1). Under the laboratory conditions of our selection experiment, the voles are housed at 20°C, i.e., at a temperature below the TNZ. Thus, there is no strong argument to expect that increased BMR should result in a change of thermal insulation in the A lines. If this is the case we should expect that in the A lines: (1a) both the LCT and the UCT will be markedly shifted downwards (although not necessarily by the same amount, as the values are determined by distinct physical and physiological process), (1b) as a consequence of a lower UCT, at a particular Tb above the UCT the increase of RMR will be higher and a more profound hyperthermia will occur, and (1c) below the LCT the thermoregulatory curve will overlap with that of the C lines. However, if the thermal insulation of the selected voles has decreased proportionally to the increase of BMR, and they evolved a more efficient mechanism for dissipating excess heat by evaporative cooling or transferring excess heat to distal body parts, we can expect that in the A lines: (2a) the position of the TNZ will remain unaffected, (2b) above the UCT the increase of RMR will be less steep, and (2c) below the LCT the thermoregulatory curve will be steeper than in the C lines as a result of higher heat loss. If, on the other hand, voles from the A lines have an increased Tb yet their thermal insulation properties have not changed, then we might expect that: (3) the entire thermoregulatory curve will be shifted upwards, but the lines will remain parallel. Still more scenarios can be envisioned if we consider the possibility that both thermal insulation and Tb have evolved. Thus, even though the physical process we consider is relatively simple and technically “hard” predictions can be formulated, the experiment has, inevitably, an exploratory nature.
Materials and Methods
This study was undertaken on bank voles (M. glareolus) from the 13th and 14th generations of the artificial selection experiment. Information about the base population, the rationale of the ongoing experiment, selection protocol, and direct response to the selection has been presented in our earlier work (Sadowska et al., 2008, 2015; Konczal et al., 2015). To summarize, the base colony was founded using ~320 voles captured in the Niepołomice Forest in southern Poland in 2000 and 2001. The animals were bred randomly for 6–7 generations, and the colony was used for quantitative genetic analyses of metabolic rates (Sadowska et al., 2005). In 2004, the multidirectional selection experiment was established (Sadowska et al., 2008). In the selected “Aerobic” (A) lines used in this current work, the selection criterion was the maximum mass-independent (residual from regression) 1-min rate of oxygen consumption achieved during an 18-min swimming trial, performed at the age of 75–85 days. The swim test was conducted at 38°C, at a temperature close to Tb of the voles, so that no thermoregulatory burden was imposed (neither excessive heat loss nor overheating load; see Supplementary Material 1). The test was terminated earlier than the maximum 18-min if an animal was struggling to swim, irrespective of the selection direction of the individual. Four replicate A-selected lines and four unselected Control (C) lines are maintained (to allow valid tests of the effects of selection; Henderson, 1997), with 15–20 reproducing families in each of the eight lines (which prevents excess inbreeding). The selection was applied mostly within families, but if more than 16 families were available, families in which all individuals scored below the adjusted line mean were excluded. The animals were kept in standard plastic mouse cages with sawdust bedding at a constant temperature (20 ± 2°C) and photoperiod (16:8 L:D) and supplied with food (a standard rodent chow: 24% protein, 3% fat, 4% fiber; Labofeed H, Kcynia, Poland) and water ad libitum. All of the procedures associated with the breeding scheme and the selection protocol were approved by the Local Bioethical Committee in Kraków, Poland (No. 99/2006, 21/2010, and 22/2010).
One week before measurements of RMR all individuals were implanted with miniature data loggers to measure Tb (resolution 0.125°C, iButton thermochron DS1921H, Maxim Integrated Products, Inc., Sunnyvale, California, USA). These data loggers were programmed to record Tb every 5-min yielding ~2,144 data points per animal (3 iButtons malfunctioned and no data were retrieved). Data loggers were coated in wax (mean total mass: 2.43 g) and calibrated over a temperature range of 15–43°C against an Albhorn precision thermometer (Albhorn Therm 2244-1, probe: NTC type C 856-1). The procedure was performed as described in Jefimow and Wojciechowski (2014). The surgery was performed under Nembutal (95 mg kg−1; Morbital, Biowet, ZAP, Poland) anesthesia in voles from generation 13 or under ketamine (40 mg kg−1; Ketamine 10%, Biowet, Puławy, Poland) followed by xylazine (8 mg kg−1; Sedazin 2%, Biowet, Puławy, Poland) in voles from generation 14. A 1 to 1.5-cm incision was made to the skin and muscle layers and a sterilized (95% alcohol) logger was inserted into the abdominal cavity. The muscle and skin were sutured using absorbable suture (Safil 5/0, AesculapAG, Tuttlingen, Germany) and voles were provided water containing the antibiotic enrofloxacin (50 mg L−1) ad libitum. Post-surgical care was continued for the next 3 days.
RMRs of voles were measured as rates of O2 consumption (mLO2 min−1) at Ta ranging from 10 to 34°C (10°C: selected n = 61, control n = 61; 20°C: selected n = 71, control n = 71; 25–34°C: selected n = 32, control n = 32). Throughout all experiments Ta was measured once every 10-min with data loggers (the same type as used for Tb) placed in the experimental chambers.
Four hours before measurements the voles were weighed and placed in plastic respirometric chambers (850 mL), without access to food or water, at the required Ta to allow animals to acclimatize to the chambers. The chambers were fitted with wire tops suspended 3 cm below the ceiling of the chamber. With the air inlet near the bottom and the outlet at the top of the chamber. This was to ensure that the voles could not exhale air directly into the outgoing air and the incoming air was mixed with the air in the chamber.
The measurements were performed at two time intervals (the actual timing varied ±0:30 h from the following values): the “Morning” group of voles were placed in the chambers at 06:00, the chambers were connected to the system only at 10:00 and the recordings continued until 13:00. The “Afternoon” group was placed in the respirometric chambers at 09:00, the chambers were connected to the system only at 13:00 and the recordings continued until 16:00. The “Timing” group was included as a cofactor in all statistical analyses.
Rates of oxygen consumption (O2) were measured using an open-flow positive-pressure respirometric system. Fresh air was dried (silica gel) and pumped into the chambers containing the animals. The rate of air flowing into the chambers was stabilized at either 350 mL min−1 (for Ta of 20–34°C) or 450 mL min−1 (for Ta of 10°C) (STPD) with thermal mass-flow controllers (Alborg, Orangeburg, NY, USA). The actual flow was corrected after calibrating the mass-flow controllers against a precise LO 63/33 rotameter (Rota, Germany). Samples of air flowing out of the animal chamber were pre-dried with ND2 non-chemical drier (Sable Systems Inc.), dried with a small volume of chemical absorbent (magnesium perchlorate) and passed through the O2 analyzers. Mean values of analog outputs from the O2 analyzer were recorded once per second with Lab Jack UE-9 AD interface and a custom-made protocol using DAQ Factory acquisition system (Azotech, Ashlans, OR, USA). O2 was calculated according to equation 1b in Koteja (1996). We assumed RQ equals 0.85, which was confirmed by measurements performed together with a CO2 analyzer in a subset of the animals.
Two experimental setups were used, one for stable temperatures of 10 and 20°C and another for increasing Ta from 25 to 34°C.
The rates of oxygen consumption for Ta of 10 and 20°C were measured with a five-channel respirometric system with a FOX O2 analyzer (Sable Systems Inc. Las Vegas, NV, USA). Samples of air flowing out of a reference (empty) and four measurement chambers (with animals) were analyzed sequentially, in a 13-min cycle. In each cycle, the reference channel and the first measurement channel were active for 165-s, and the remaining three measurement channels were active for 150-s, which ensured a complete washout of the system after switching channels (the time was longer for the reference and the first measurement channels because the change of air composition after switching to those channels is larger than in the case of the other channels). The last 20-s before switching channels was used to calculate the rate of O2 uptake. Importantly, as the air flow/chamber volume ratio was low (0.44), the last 20-s effectively represented a signal integrated from a longer period.
For the second protocol only two animals were measured simultaneously during each trial during which Ta was increased from 25 to 34°C in 3°C increments. Throughout the measurements animals were kept at 25 and 28°C for 1 h and at 31 and 34°C for 30-min. The shorter time periods at high Ta were to prevent hyperthermia, particularly in individuals from the A lines. The rates of oxygen consumption for Ta 25 to 34°C were measured continuously with either a FOX O2 analyzer or FC-10a analyzer (Sable Systems Inc. Las Vegas, NV, USA). The rate of O2 uptake was obtained for the lowest 1-min reading for each experimental Ta.
Maximum thermogenic capacity (O2cold) was measured as the rate of oxygen consumption (ml min−1) in completely soaked individuals placed in a wet chamber for up to 18-min at +23°C (procedure similar to Sadowska et al., 2005 and Dheyongera et al., 2016). The voles were weighed, soaked in warm (+38°C) water containing a drop of dog shampoo to ensure complete saturation and then placed in wet respirometric chambers (500 mL) maintained at +23°C in a temperature-controlled cabinet (PTC-1 Peltier; Sable Systems, Las Vegas, NV, USA). The respirometric chambers were connected to one of two separate open-flow, positive pressure respirometric systems. The airflow rate through the chambers (about 2,000 mL min−1 at standard temperature and pressure), was controlled to ±1% with mass flow controllers (either Model ERG3000, Beta-Erg, Warsaw, Poland: or Model GFC-171S, Aalborg Instruments, Orangeburg, NY, USA). Excurrent air was pre-dried with ND2 non-chemical drier (Sable Systems, Las Vegas, NV, USA) or DG-1 Dewpoint Generator with Pelt-4 Condenser PC-2 (Sable Systems, Las Vegas, NV, USA) and dried with a small volume of chemical absorbent (magnesium perchlorate) and passed through the O2 analyzers. (FC-10A or FC2 Oxzilla: Sable Systems, Las Vegas, NV, USA). In both systems, the concentration of gases was recorded every second with UI2 (Sable Systems, Las Vegas, NV, USA) interface and protocol using Expedata acquisition system. Thermogenic capacity was defined as the highest 1-min instantaneous rates of oxygen consumption (Bartholomew et al., 1981; effective volume of the chambers was 650 and 700 mL, respectively). At the end of each trial we measured rectal temperature (Tbcold) using an Albhorn thermometer (Albhorn Therm 2244-1, probe: NTC type C 856-1).
Two values of Tb were calculated from the data: (1) Tbmean is the mean Tb from 30-min of data that were recorded 4.5–5-h after putting the animal in the chamber and (2) Tbrmr is the Tb recorded at the time of the lowest RMR measurement. From measurements of Tbrmr and RMR we also calculated the thermal conductance [CT, mLO2/(min × °C)] of the voles at each of the measurement Tas:
For statistical analyses we used SAS (v. 9.4, SAS Institute, Inc., Cary, NC, USA). To compare Tbmean, Tbrmr, RMR and CT of voles from A and C lines at each of the measurement Tas and also for Tbcold and O2cold from the maximum thermogenic capacity trials we applied a cross-nested Mixed ANCOVA model implemented with the Mixed Procedure (with REML method) with Selection (A vs. C) as the main, top-level fixed factor, and replicated Lines as a random effect nested within Selection. Further, we also included fixed cofactors and covariates: Sex, Generation (13 or 14), Timing (Morning or Afternoon), Age, and Body Mass. The model included also a fixed interaction of Selection × Sex and the random interaction of Sex × Line. Values that were obtained from active individuals were omitted from the analyses. Additionally, studentized residuals were analyzed and observations with residuals below −3 or above 3 were considered outliers and removed from the final analyses.
Next, we used a repeated-measures extension of the above model to perform analyses for combined results from the trial performed at temperatures around the TNZ (25, 28, 31, and 34°C). In addition to the factors described above, the model included a fixed repeated-measures factor for Ta (treated as a grouping factor), interactions of Ta with Selection, Sex and Line, and the random effect of Individual (“subject”). As the analyses performed separately for each Ta revealed large differences of residual variance, in the repeated measures model an “unstructured” type of residual (co)variance matrix was assumed. To compare the four Ta groups, Tukey-Kramer post-hoc tests were performed. A similar but simpler model (with no interactions between Ta and other factors and compound symmetry variance structure) was used to analyze initial body mass measured before the three trials (at 10, 20, and 25–34°C). In all of the above analyses, variance was constrained to non-negative values (default approach in SAS), and Satterthwaite approximation for non-orthogonal models was applied to calculate the denominator degrees of freedom.
Finally, to analyze the main characteristics of the thermoregulatory curve we applied a stage-regression model, implemented in SAS mixed nonlinear procedure (NLMIXED). The data available could not allow a reliable estimate of the UCT and therefore the analyses were performed only for the temperature range of 10–31°C, and was focused on the question of whether selection affected LCT, the level of RMR above LCT (RMRTNZ; conceptually equivalent to BMR), and the slope of the relationship between RMR and Ta below LCT (Ct; i.e., another measure of thermal conductance). The model includes also random effects of individuals (ID) and residual error e, each assumed to have a normal distribution. The logic of the model was as follows:
However, all of the three parameters of the model are known to depend on body mass (e.g., McNab, 2002). Therefore, they were introduced to the model as linear functions of body mass (Mb), each with an intercept and a mass-slope coefficient:
Finally, each of the six parameters were introduced to the model as either a value common for both of the selection directions or specific for the A and C lines. Thus, the initial “full” model had a total of 12 fixed parameters (in addition to two random effects), i.e., allowed not only difference in intercepts between the selection directions, but also heterogeneous mass-slopes. The model was then stepwise reduced, first by removing the coefficients responsible for differences in mass-slope coefficients (which resulted in a model with homogeneous mass-slopes), and then by removing other components. We first compared the models using AIC criterion, and then to formally test significance of difference in a particular parameter between the A and C lines a likelihood ratio test (LRT) was applied.
Here we present adjusted least square means (with standard error) for the main factor only (Selection). In the supplementary files we also provide the complete tables with descriptive statistics and results of the mixed ANCOVA models and NLMIXED (Supplementary Material 2) and also raw data (Supplementary Material 3).
Results
Body mass (Mb) measured before the three respirometric trials (at 10, 20, and 25–34°C) increased with age [F(1, 148) = 4.91, p = 0.028] and was on average 0.32 ± 0.15 g lower in the afternoon than in the morning trials [F(1, 215) = 4.19, p = 0.042], but did not differ between generations [F(1, 135) = 0.94, p = 0.33] or the three trials [F(2, 198) = 0.96, p = 0.39]. The Mb adjusted for these cofactors was higher in the selected (A) than in control (C) lines, and higher in males than in females [LSM ± SE for the age of 140 days; A line females: 24.6 ± 0.9 g, males: 28.0 ± 0.9 g, C line females: 21.6 ± 0.9 g, males 25.3 ± 0.9 g; effect of selection: F(1, 6.1) = 6.55, p = 0.042; effect of sex: F(1, 5.6) = 39.8, p = 0.001].
The results for Tbmean and Tbrmr were similar and here we only present the results for Tbrmr (see Table 1 for values of both variables). Tbrmr was elevated in the A lines at higher Ta but not at lower Ta, in comparison to the C lines. Specifically, at 10°C Tbrmr was virtually identical in the lines, and at 20°C it was only 0.08°C higher in the A lines (p > 0.71; Table 1, Figure 2A). At Tas around the TNZ, Tbrmr tended to be higher in the A than in the C lines (at 25°C: 0.38°C difference, at 28°C: 0.23°C, at 31°C: 0.25°C), but the difference was nearly significant only at 25°C (p = 0.07; otherwise p > 0.44; Table 1, Figure 2A). The difference in Tbrmr between the A and C lines was greatest at the Ta of 34°C (1.01°C), but because individual variance dramatically increased the difference was still not significant (p = 0.15; Table 1, Figure 2A). However, the repeated measures analysis performed for combined Tas around TNZ (25, 28, 31, and 34°C) showed that Tbrmr, averaged across the four temperatures, was clearly significantly higher in the A than in the C lines [A lines = 38.72 ± 0.13°C; C lines = 38.12 ± 0.12; effect of Selection: F(1, 8.7) = 10.8, p = 0.009]. The analysis showed also that Tbrmr averaged across the A and C lines was similar at 25°C (38.03°C) and 28°C (38.01°C), slightly increased at 31°C (38.13°C), and increased significantly at 34°C [39.51°C; effect of Ta: F(3, 55.9) = 24.0, p < 0.0001]. Further, the analysis also revealed a significant interaction between the effects of Ta and Selection [F(3, 55.8) = 5.12, p = 0.003]; while the differences in Tbrmr between the lines at Ta ranging from 25 to 31°C were similar (~0.3°C), at 34°C Tbrmr in the A lines was more than 1.5°C higher than that in the C lines.
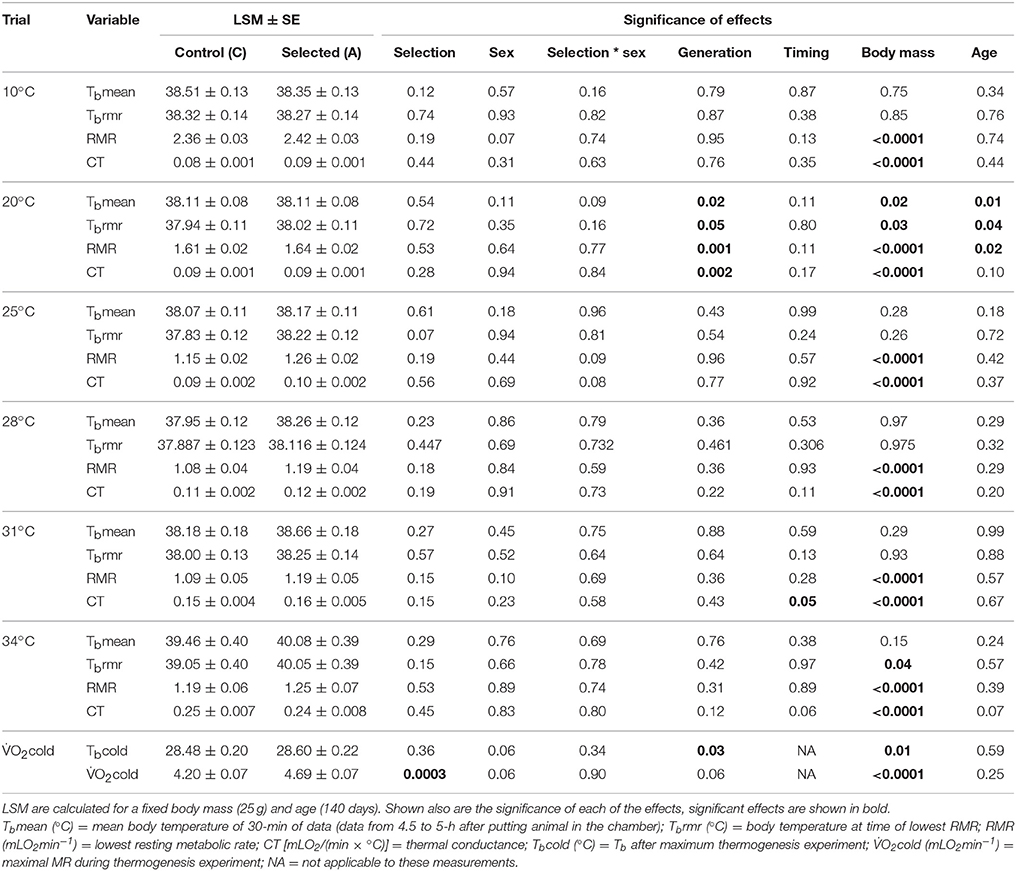
Table 1. Summary statistics showing values (adjusted least square means ± standard error, LSM ± SE) for control (C) and selected (A) lines for each measured variable for each experimental procedure.
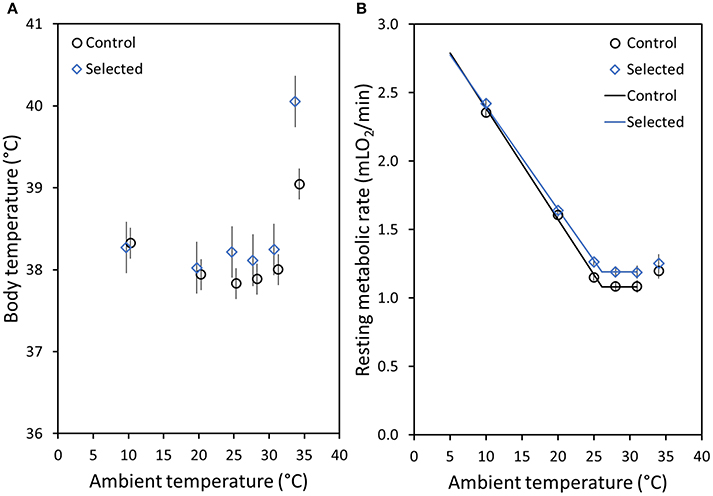
Figure 2. (A) Mean body temperatures (Tbrmr) of bank voles at the time of the lowest measured resting metabolic rate (RMR) at each measurement temperature (Ta) for control (C: black dots) and selected (A: blue diamonds) lines. (B) Mean RMR of bank voles at each measurement Ta for the C (black dots) and the A (blue diamonds) lines. For both figures means are the adjusted least square means (LSM calculated for a fixed body mass, 25 g, and age, 140 days) and the whiskers above and below each mean value represent the standard error (note: for most RMR results the SE range is not visible, because it is smaller than the size of the symbols). The lines on (B) represent the best-fit model, with a common lower critical temperature (LCT = 26.1 ± 0.27°C), but different levels of RMR above LCT (RMRTNZ, for a 25 g vole; A lines: 1.19 mLO2/min, C lines: 1.08 mLO2/min), and different slopes [Ct, for a 25 g vole; A lines: 0.055 mLO2/(min × °C), C lines: 0.061 mLO2/(min × °C)].
At all measurement Tas, RMR increased with increasing body mass (p < 0.0001; Table 1). At Tas below the LCT (10 and 20°C), RMR did not differ between the A and C lines (p > 0.19; Table 1). Specifically, RMR for A lines was only 2.6% higher at 10°C and 2.1% higher at 20°C (Table 1, Figure 2B). In contrast, at measurement Tas between 25 and 31°C RMR was ~9% higher in the A than in the C lines, however, these differences were not significant (p > 0.15; Table 1, Figure 2B). At 34°C RMR in the A lines was 4.2% higher than in the C lines (Table 1, Figure 2B), but this difference was also not significant (p = 0.53). Yet, similarly to Tbrmr, the repeated measures analysis performed for combined Tas around TNZ (25, 28, 31, and 34°C) revealed that RMR, averaged across the four temperatures, was significantly higher in the A than in the C lines [A lines = 1.24 ± 0.03 mLO2min−1; C lines = 1.12 ± 0.03 mLO2min−1; effect of Selection: F(1, 19.4) = 7.65, p = 0.01]. Additionally, the RMR of the lines combined was significantly affected by Ta [F(3, 8.5) = 12.08, p = 0.002]: it was higher at 25°C (1.21 ± 0.02 mLO2min−1) and 34°C (1.24 ± 0.03 mLO2min−1) in comparison to 28°C (1.14 ± 0.02 mLO2min−1) and 31°C (1.13 ±0.03 mLO2min−1). However, unlike for Tbrmr, the interaction between Selection and Ta was not significant for RMR [F(3, 8.5) = 0.32, p = 0.81], i.e., the differences between the A and C lines were consistent across the Tas (and vice versa).
Similarly to RMR, thermal conductance (CT) increased significantly with increasing body mass at all measurement Tas (p < 0.0001; Table 1). Further, CT followed a similar trend to Tbrmr and RMR, such that at the lower Tas of 10 and 20°C the CT values were nearly identical in the A and C lines (p > 0.28; Table 1). At measurement Tas between 25 and 31°C the CT of the A lines was ≈6% higher than that measured in the C lines. However, this was reversed at 34°C, such that the CT of control voles was 3% higher than that of the selected voles. While these results were not significant, the repeated measures analysis performed for combined Tas (25, 28, 31, and 34°C) revealed that CT, averaged across the four temperatures, was nearly significantly higher in the A than in the C lines [A lines = 0.15 ± 0.003 mLO2/(min × °C); C lines = 0.14 ± 0.002 mLO2/(min × °C); p = 0.07]. As expected, the CT of the lines combined increased significantly with increasing Ta (25°C = 0.09±0.001 mLO2/(min × °C); 28°C = 0.11±0.002 mLO2/(min × °C); 31°C = 0.16±0.003 mLO2/(min × °C); 34°C = 0.24±0.005 mLO2/(min × °C); p = 0.04). Further, similarly to RMR, the interaction between the effect of Selection and Ta was not significant for CT (p = 0.19).
The analysis of the stage-regression model applied to characterize the thermoregulatory curve showed that the best fit model according to the AIC Fit statistic (Table 2, model 8) had a common LCT (26.1 ± 0.3°C), which did not depend significantly on either body mass or selection direction. The rate of metabolism above LCT (RMRTNZ), adjusted for the effect of body mass, was 0.11 ± 0.03 mlO2/min higher in the A than in the C lines (χ2 = 13.2, p < 0.001). The slope of the increase of RMR below LCT (Ct), which can be treated as another characteristic of thermal conductance, increased with body mass (χ2 = 4.8, p = 0.028), and was significantly lower in the A than in the C lines [for a vole with a mean mass of 25 g: A lines: 0.078 mLO2/(min × °C), C lines: 0.081 mLO2/(min × °C), difference: 0.006 ± 0.003 mLO2/(min × °C); χ2 = 5.0, p = 0.025]. Thus, the thermoregulatory curve lines for the A and C voles meet at 7.5°C (Figure 2B). However, as RMR was not measured at even lower temperatures, the results do not allow us to resolve whether the lines intersect or converge. Below the LCT, RMR increased so that for the A lines at 20°C it was about 1.4-fold higher, and at 10°C was 2-fold higher, than RMR in the TNZ. As RMR in the TNZ was lower for the C lines, these differences were greater, such that RMR at 20°C was 1.5-fold higher, and at 10°C was 2.2-fold higher, than RMR in the TNZ.
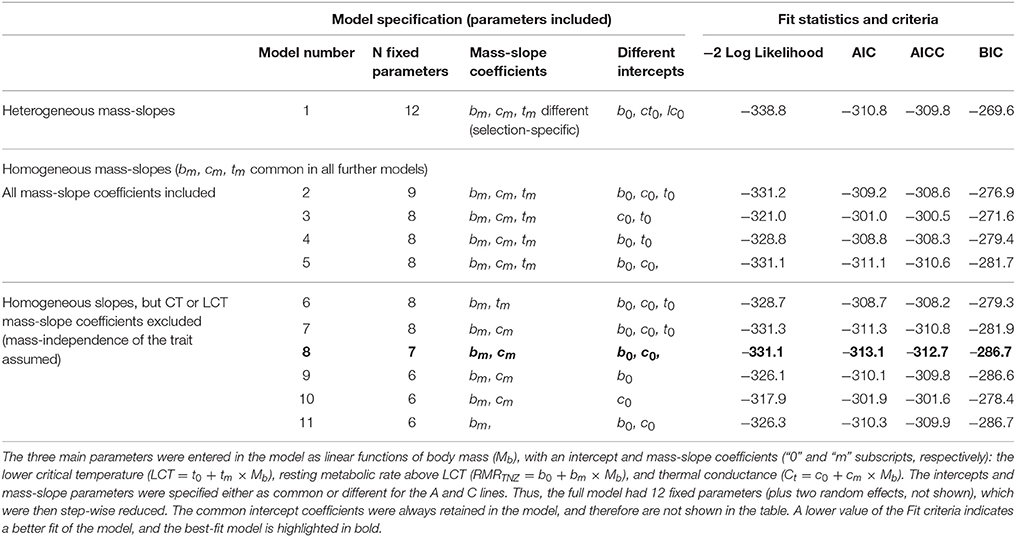
Table 2. Summary of Fit statistics for nonlinear, stage-regression models (implemented in SAS NLMIXED procedure), applied to determine how selection affected the main characteristics of the thermoregulatory curve in bank voles.
The maximum thermogenesis (O2cold) of voles from the A lines was 10% higher than that measured in voles from the C lines (p < 0.0001; Table 1). However, the O2cold measured during the maximum thermogenesis trials did not differ between the A and C lines (p = 0.70; Table 1). An extrapolation of the thermoregulatory curve toward low temperatures and O2cold values allows an estimation of the lower lethal temperature (LLT), at which the thermoregulatory demand meets the ceiling of maximum thermogenesis. Although the slope of the curve was lower for the A lines, the difference may not hold at lower temperatures. Therefore, for the extrapolation below 7.5°C (where the lines meet) we used a common slope of 0.058 mLO2/(min × °C). The LLT calculated in this way for a 25 g vole was 8.4°C lower in the A (−28.6°C) than in the C lines (−20.2°C).
Discussion
Our study provides data that fill in the gaps in our knowledge on how selecting for high-activity related aerobic metabolism can also result in correlated changes in thermal physiological traits. Specifically, as predicted by our previous studies on BMR (Sadowska et al., 2015), RMR within the TNZ was higher in selected (A) lines in comparison to control (C) lines. Resting metabolism is correlated with many life history traits, such as growth, survival, or reproductive output, which suggests that the fitness of an individual can be associated with RMR (Boratynski and Koteja, 2009, 2010; Burton et al., 2011). Thus, the increase in RMR in the TNZ in the voles from the A lines suggests that the evolution of increased aerobic exercise capacity leads to many other correlated changes. In addition, the Tb of selected voles in the TNZ was ≈0.3°C higher in comparison to control voles, and the difference increased to ≈1.5°C at a Ta of 34°C, revealing that the increased heat production resulting from higher RMR was not completely balanced by increased heat dissipation. While there are advantages for animals to have a high BMR or RMR, such as increased maximal MR for longer activity periods, there are also advantages to having a low BMR or RMR (Larivée et al., 2010). For example, individuals with a low BMR or RMR do not have to eat as much (Dheyongera et al., 2016); therefore their foraging requirements are reduced along with exposure to predators (Larivée et al., 2010). Importantly, while endotherms can maintain high metabolism and a stable Tb to remain active over a range of Ta, this comes at a cost.
Selection for high-activity related metabolism could influence RMR at Ta below the LCT in several ways (Figure 1). The results of the stage-regression analysis supported a model in which the LCT does not differ between the A and C lines, and the slope of the thermoregulatory curve is lower in A lines, so that the lines meet at Ta = 7.5°C (Table 2, Figure 2B). Because we do not have results for Tas below 10°C or between 10 and 20°C, we could not attempt to fit a more complex model, which would allow to determine whether the thermoregulatory curves for the A and C lines converge at low Ta, or if indeed they intersect, so that below ≈ 7°C RMR would become lower in the A than in the C lines. However, as the thermal conductance (CT), calculated from individual values of RMR and Tb measured at Ta = 10°C, does not differ significantly between the lines, and the CT value is actually even slightly higher in the A than in the C lines (Table 1), we can predict that the lines actually converge, rather than intersect. In addition to the similar RMR in the A and C lines measured at the moderately low temperatures, there were also no significant differences in Tb. This result suggests that RMR and Tb at cold Ta are conserved regardless of selection for higher MR during activity, possibly to reduce the amount of energy needed to maintain normothermia below the LCT.
Importantly, while many endotherms employ physiological mechanisms to deal with cold temperatures, such as non-shivering thermogenesis (NST) and torpor, such tools are not employed by all species (Jackson et al., 2001; Ruf and Geiser, 2015; Stawski et al., 2015a). Interestingly, NST capacity measured in bank voles from the same generations as those in the current study did not differ between the A and C lines (Stawski et al., 2015a). Therefore, in bank voles NST capacity does not appear to be genetically correlated to activity-related metabolism and is likely a plastic trait, which would be advantageous in predictable environments such as those that bank voles occupy (Stawski et al., 2015a). By conserving RMR and NST capacity at low Ta regardless of selection pressures acting on activity-related aerobic metabolism, bank voles with high BMR can also survive these cold temperatures by not increasing the amount of energy used to remain normothermic (however, their overall energy needs may be increased if they maintain a higher locomotor activity). Importantly, as RMR in the TNZ is higher for the A lines in comparison to the C lines, the selected voles do not need to increase their RMR as much at Ta below the LCT. This smaller increase in energy expenditure as the temperature drops was likely important during the evolution of endothermy and also currently in terms of adapting rapidly to colder weather. Additionally, our data also revealed that voles from the A lines have a 10% higher thermogenic capacity (Table 1). Consequently, as RMR and CT below the LCT practically do not differ between the selection directions, the selected voles presumably have a 7°C lower LLT than voles from the C lines, i.e., have a higher capacity to withstand very cold Ta.
Hotter temperatures can be more difficult for endotherms to cope with than cold. Endotherms in particular can overheat rapidly and this can lead to organ failure and death. Therefore, for Ta above the UCT endotherms need to dissipate heat and often do so by increasing evaporative water loss and MR (Pis, 2010; Rezende and Bacigalupe, 2015). Due to the higher RMR and Tb of the selected voles in the TNZ, we predicted that the slope of the line would be steeper above the UCT in comparison to control lines. While we were unable to estimate the UCT based on our data, the RMR and Tb of some voles already showed an increase at the measurement Ta of 31°C, and an even greater increase at 34°C. Therefore, while there appears to be considerable individual variation, we hypothesize that the UCT of voles is around 31°C. Importantly, the Tb of voles from the A lines at 34°C was much higher in comparison to the C lines. This result suggests that selection for high activity-related metabolism can reduce the capacity of effective thermoregulation at high Ta, and therefore decrease the upper lethal temperature.
The results of our current and previous studies show that selection for increased aerobic capacity during activity leads to many other correlated changes, such as a shift in the thermoregulatory curve as shown here. Specifically, the selection for high aerobic exercise performance, even though operating under thermally neutral conditions, has resulted in the evolution of increased cold tolerance, which, under natural conditions, could allow voles to inhabit colder environments. Conversely, this selection has also resulted in voles overheating at high Ta, which may lead to difficulties in a warming climate. Bank voles offer an ideal model to analyse metabolic adjustments to differing climates as they have a wide distribution throughout Europe, extending in the North all the way into the Arctic Circle and down to the Mediterranean in the South (Raczyński, 1983). In the West they are found in Ireland and in the East they inhabit a large portion of Russia (Raczyński, 1983). Throughout this large range bank voles experience a variety of climates, suggesting they may display physiological flexibility to enable adaptation to differing weather patterns. Yet, surprisingly, the possibility of geographical variation of their metabolic traits has not been explored extensively and we are only aware of one study (Aalto et al., 1993). This research revealed that bank voles do not appear to display evident variation in BMR across a wide geographical range, from Northern Finland to the Balkan Peninsulas. The authors suggested that throughout this wide climatic range voles can select similar microclimates (Aalto et al., 1993). However, the methodology of this study was not perfect, because the measurements were conducted neither on voles' immediately after capture nor on ones maintained under common-garden conditions. Thus, the data do not represent effects of current local conditions, and do not represent genetically-based differences, either. Therefore, it would be beneficial to repeat such an experiment with a more robust experimental design, and compare the outcome with that of our selection experiment. To conclude, the results of the current thermoregulatory curve experiment and the results from the whole experimental evolutionary model research support the assumptions of the aerobic capacity model of the evolution of endothermy.
Author Contributions
All authors designed the study, analyzed the results, worked on the manuscript and gave approval for publication. CS and ES performed the experiments.
Funding
This research was funded by the Jagiellonian University and the European Union under the European Social Fund (POKL.04.01.01-053/09) to CS, a grant for the development of young scientists and doctoral students from Jagiellonian University (DS/MND/WBiNoZ/INoS/2/2011) to CS and ES, Jagiellonian University (DS/WBINOZ/INOS/757) to PK, the Polish Ministry of Science and Higher Education (8167/B/P01/2011/40 to PK and 0595/B/P01/2011/40 to ES), and the National Science Centre Poland (2016/22/E/NZ8/00416) to ES.
Conflict of Interest Statement
The authors declare that the research was conducted in the absence of any commercial or financial relationships that could be construed as a potential conflict of interest.
Acknowledgments
For their help with this research we would like to thank Katarzyna Baliga-Klimczyk, Katarzyna M. Chrzaścik, Agata Rudolf, and Paulina Szymanska. We are grateful to Michał S. Wojciechowski for lending us his data loggers and teaching us the implantation surgery.
Supplementary Material
The Supplementary Material for this article can be found online at: https://www.frontiersin.org/articles/10.3389/fphys.2017.01070/full#supplementary-material
References
Aalto, M., Górecki, A., Meczeva, R., Wallgren, H., and Weiner, J. (1993). Metabolic rates of the bank voles (Clethrionomys glareolus) in Europe along a latitudinal gradient from Lapland to Bulgaria. Ann. Zool. Fennici 30, 233–238.
Angilletta, M. J., and Sears, M. W. (2003). Is parental care the key to understanding endothermy in birds and mammals? Am. Nat. 162, 821–825. doi: 10.1086/380921
Auer, S. K., Killen, S. S., and Rezende, E. L. (2017). Resting vs. active: a meta-analysis of the intra-and inter-specific associations between minimum, sustained, and maximum metabolic rates in vertebrates. Funct. Ecol. 31, 1728–1738. doi: 10.1111/1365-2435.12879
Bartholomew, G. A. (1982). “Energy metabolism,” in Animal Physiology: Principles and Adaptations, ed M. S. Gordon (New York, NY: MacMillian Publishing Co., Inc.), 46–93.
Bartholomew, G. A., Vleck, D., and Vleck, C. M. (1981). Instantaneous measurements of oxygen consumption during pre-flight warm-up and post-flight cooling in sphingid and saturnid moths. J. Exp. Biol. 90, 17–32.
Bennett, A. F., and Ruben, J. A. (1979). Endothermy and activity in vertebrates. Science 206, 649–654. doi: 10.1126/science.493968
Boratynski, Z., and Koteja, P. (2009). The association between body mass, metabolic rates, and survival of bank voles. Funct. Ecol. 23, 330–339. doi: 10.1111/j.1365-2435.2008.01505.x
Boratynski, Z., and Koteja, P. (2010). Sexual and natural selection on body mass and metabolic rates in free-living bank voles. Funct. Ecol. 24, 1252–1261. doi: 10.1111/j.1365-2435.2010.01764.x
Burton, T., Killen, S. S., Armstrong, J. D., and Metcalfe, N. B. (2011). What causes intraspecific variation in resting metabolic rate and what are its ecological consequences? Proc. R. Soc. B 278, 3465–3473. doi: 10.1098/rspb.2011.1778
Clarke, A., and Pörtner, H.-O. (2010). Temperature, metabolic power and the evolution of endothermy. Biol. Rev. 85, 703–727. doi: 10.1111/j.1469-185X.2010.00122.x
Dheyongera, G., Grzebyk, K., Rudolf, A. M., Sadowska, E. T., and Koteja, P. (2016). The effect of chlorpyrifos on thermogenic capacity of bank voles selected for increased aerobic exercise metabolism. Chemosphere 149, 383–390. doi: 10.1016/j.chemosphere.2015.12.120
Farmer, C. G. (2000). Parental care: the key to understanding endothermy and other convergent features in birds and mammals. Am. Nat. 155, 326–334. doi: 10.1086/303323
Farmer, C. G. (2003). Reproduction: the adaptive significance of endothermy. Am. Nat. 162, 826–840. doi: 10.1086/380922
Geiser, F. (2008). Ontogeny and phylogeny of endothermy and torpor in mammals and birds. Comp. Biochem. Physiol. A 150, 176–180. doi: 10.1016/j.cbpa.2007.02.041
Górecki, A. (1968). Metabolic rate and energy budget in the bank vole. Acta Theriol. 13, 341–365. doi: 10.4098/AT.arch.68-20
Grigg, G. C., Beard, L. A., and Augee, M. L. (2004). The evolution of endothermy and its diversity in mammals and birds. Physiol. Biochem. Zool. 88, 982–997. doi: 10.1086/425188
Hayes, J. P., and Garland, T. (1995). The evolution of endothermy: testing the aerobic capacity model. Evolution 49, 836–847. doi: 10.1111/j.1558-5646.1995.tb02320.x
Henderson, N. D. (1997). Spurious associations in unreplicated selected lines. Behav. Genet. 27, 145–154.
Jackson, D. M., Trayhurn, P., and Speakman, J. R. (2001). Associations between energetics and over-winter survival in the short-tailed field vole Microtus agrestis. J. Anim. Ecol. 70, 633–640. doi: 10.1046/j.1365-2656.2001.00518.x
Jaromin, E., Sadowska, E. T., and Koteja, P. (2016a). A dopamine and noradrenaline reuptake inhibitor (bupropion) does not alter exercise performance of bank voles. Curr. Zool. 62, 307–315. doi: 10.1093/cz/zow026
Jaromin, E., Wyszkowska, J., Labecka, A. M., Sadowska, E. T., and Koteja, P. (2016b). Hindlimb muscle fibre size and glycogen stores in bank voles with increased aerobic exercise metabolism. J. Exp. Biol. 219, 470–473. doi: 10.1242/jeb.130476
Jefimow, M., and Wojciechowski, M. S. (2014). Effect of dietary fatty acids on metabolic rate and nonshivering thermogenesis in golden hamsters. J. Exp. Zool. A 321, 98–107. doi: 10.1002/jez.1840
Kemp, T. S. (2006). The origin of mammalian endothermy: a paradigm for the evolution of complex biological structure. Zool. J. Linn. Soc. 147, 473–488. doi: 10.1111/j.1096-3642.2006.00226.x
Konczal, M., Babik, W., Radwan, J., Sadowska, E. T., and Koteja, P. (2015). Initial molecular-level response to artificial selection for increased aerobic metabolism occurs primarily through changes in gene expression. Mol. Biol. Evol. 32, 1461–1473. doi: 10.1093/molbev/msv038
Koteja, P. (1996). Measuring energy metabolism with open-flow respirometric systems: which design to choose. Funct. Ecol. 10, 675–677. doi: 10.2307/2390179
Koteja, P. (2000). Energy assimilation, parental care and the evolution of endothermy. Proc. R. Soc. Lond. B 267, 479–484. doi: 10.1098/rspb.2000.1025
Koteja, P. (2004). The evolution of concepts on the evolution of endothermy in birds and mammals. Physiol. Biochem. Zool. 77, 1043–1050. doi: 10.1086/423741
Larivée, M. L., Boutin, S., Speakmean, J. R., McAdam, A. G., and Humphries, M. M. (2010). Associations between over-winter survival and resting metabolic rate in juvenile North American red squirrels. Funct. Ecol. 24, 597–607. doi: 10.1111/j.1365-2435.2009.01680.x
Levesque, D. L., Nowack, J., and Stawski, C. (2016). Modelling mammalian energetics: the heterothermy problem. Clim. Change Responses 3:7. doi: 10.1186/s40665-016-0022-3
Lovegrove, B. G. (2012). The evolution of endothermy in the Cenozoic mammals: a plesiomorphic-apomorphic continuum. Biol. Rev. 87, 128–162. doi: 10.1111/j.1469-185X.2011.00188.x
Lovegrove, B. G. (2016). A phenology of the evolution of endothermy in birds and mammals. Biol. Rev. 92, 1213–1240. doi: 10.1111/brv.12280
McNab, B. K. (2002). The Physiological Ecology of Vertebrates. Ithaca, NY: Cornell University Press.
Pis, T. (2010). The link between metabolic rate and body temperature in galliform birds in thermoneutral and heat exposure conditions: the classical and phylogenetically corrected approach. J. Therm. Biol. 35, 309–316. doi: 10.1016/j.jtherbio.2010.06.010
Raczyński, J. (1983). Taxonomic position, geographical range and the ecology of distribution. Acta Theriol. 28(Suppl. 1), 3–30.
Rezende, E. L., and Bacigalupe, L. D. (2015). Thermoregulation in endotherms: physiological principles and ecological consequences. J. Comp. Physiol. B 185, 709–727. doi: 10.1007/s00360-015-0909-5
Riek, A., and Geiser, F. (2013). Allometry of thermal variables in mammals: consequences of body size and phylogeny. Biol. Rev. 88, 564–572. doi: 10.1111/brv.12016
Ruf, T., and Geiser, F. (2015). Daily torpor and hibernation in birds and mammals. Biol. Rev. 90, 891–926. doi: 10.1111/brv.12137
Sadowska, E. T., Baliga-Klimczyk, K., Chrzaśik, K. M., and Koteja, P. (2008). Laboratory model of adaptive radiation: a selection experiment in the bank vole. Physiol. Biochem. Zool. 81, 627–640. doi: 10.1086/590164
Sadowska, E. T., Król, E., Chrzaścik, K. M., Rudolf, A. M., Speakmam, J. R., and Koteja, P. (2016). Limits to sustained energy intake. XXIII. Does heat dissipation capacity limit the energy budget of lactating bank voles? J. Exp. Biol. 219, 805–815. doi: 10.1242/jeb.134437
Sadowska, E. T., Labocha, M. K., Baliga, K., Stanisz, A., Wróblewska, A. K., Jagusiak, W., et al. (2005). Genetic correlations between basal and maximum metabolic rates in a wild rodent: consequences for evolution of endothermy. Evolution 59, 672–681. doi: 10.1111/j.0014-3820.2005.tb01025.x
Sadowska, E. T., Stawski, C., Rudolf, A., Dheyongera, G., Chrzaścik, K. M., Baliga-Klimczyk, K., et al. (2015). Evolution of basal metabolic rate in bank voles from a multidirectional selection experiment. Proc. R. Soc. B. 282:20150025. doi: 10.1098/rspb.2015.0025
Scholander, P. F., Hock, R., Walters, V., and Irving, L. (1950). Adaptation to cold in arctic and tropical mammals in relation to body temperature, insulation, and basal metabolic rate. Biol. Bull. 99, 259–271. doi: 10.2307/1538742
Stawski, C., Koteja, P., Sadowska, E. T., Jefimow, M., and Wojciechowski, M. S. (2015a). Selection for high activity-related aerobic metabolism does not alter the capacity of non-shivering thermogenesis in bank voles. Comp. Biochem. Physiol. A 180, 51–56. doi: 10.1016/j.cbpa.2014.11.003
Stawski, C., Valencak, T. G., Ruf, T., Sadowska, E. T., Dheyongera, G., Rudolf, A., et al. (2015b). Effect of selection for high activity-related metabolism on membrane phospholipid fatty acid composition in bank voles. Physiol. Biochem. Zool. 88, 668–679. doi: 10.1086/683039
Keywords: bank vole, body temperature, endothermy, evolution, mammals, metabolic rate, thermal conductance, thermoneutral zone
Citation: Stawski C, Koteja P and Sadowska ET (2017) A Shift in the Thermoregulatory Curve as a Result of Selection for High Activity-Related Aerobic Metabolism. Front. Physiol. 8:1070. doi: 10.3389/fphys.2017.01070
Received: 01 July 2017; Accepted: 05 December 2017;
Published: 18 December 2017.
Edited by:
Elias T. Polymeropoulos, Institute for Marine and Antarctic Studies (IMAS), AustraliaReviewed by:
Steve Portugal, Royal Holloway, University of London, United KingdomStewart C. Nicol, University of Tasmania, Australia
Copyright © 2017 Stawski, Koteja and Sadowska. This is an open-access article distributed under the terms of the Creative Commons Attribution License (CC BY). The use, distribution or reproduction in other forums is permitted, provided the original author(s) or licensor are credited and that the original publication in this journal is cited, in accordance with accepted academic practice. No use, distribution or reproduction is permitted which does not comply with these terms.
*Correspondence: Clare Stawski, clare.stawski@ntnu.no