 Leidy Y. Serna
94% of researchers rate our articles as excellent or good
Learn more about the work of our research integrity team to safeguard the quality of each article we publish.
Find out more
ORIGINAL RESEARCH article
Front. Physiol. , 07 February 2018
Sec. Computational Physiology and Medicine
Volume 9 - 2018 | https://doi.org/10.3389/fphys.2018.00069
Respiratory system modeling has been extensively studied in steady-state conditions to simulate sleep disorders, to predict its behavior under ventilatory diseases or stimuli and to simulate its interaction with mechanical ventilation. Nevertheless, the studies focused on the instantaneous response are limited, which restricts its application in clinical practice. The aim of this study is double: firstly, to analyze both dynamic and static responses of two known respiratory models under exercise stimuli by using an incremental exercise stimulus sequence (to analyze the model responses when step inputs are applied) and experimental data (to assess prediction capability of each model). Secondly, to propose changes in the models' structures to improve their transient and stationary responses. The versatility of the resulting model vs. the other two is shown according to the ability to simulate ventilatory stimuli, like exercise, with a proper regulation of the arterial blood gases, suitable constant times and a better adjustment to experimental data. The proposed model adjusts the breathing pattern every respiratory cycle using an optimization criterion based on minimization of work of breathing through regulation of respiratory frequency.
The respiratory system is a complex and feedback system which is responsible for supplying sufficient oxygen (O2) for metabolism and eliminating carbon dioxide (CO2) produced by metabolic reactions in order to keep the homeostasis of arterial blood gases and pH in any situation and, particularly, during exercise (Duffin, 2013). For achieving this goal, the respiratory control system regulates pulmonary ventilation so that at equilibrium gas exchange in the lungs matches metabolism: O2 provision and CO2 elimination in the lungs equal O2 consumption and CO2 production in the tissues (Bell, 2006; Duffin, 2013; Guyton, 2015).
The regulation of O2 is achieved keeping a partial pressure of O2 (PO2), in the arterial blood, that saturates arterial hemoglobin and provides a sufficient gradient to supply the tissue metabolic. Because of the hemoglobin can be saturated within a wide range of PO2, oxygen is mainly regulated when its saturation falls to hypoxia limits (PO2 < 70 mmHg) (Roussos and Koutsoukou, 2003; Duffin, 2013). On the other hand, due to CO2 diffuses more easily than O2 and quickly reacts with H2O, generating hydrogen ion concentrations ([H+]), the regulation of CO2 is more difficult to achieve although it can carry out by controlling the partial pressure of CO2 (PCO2) and, therefore, [H+] (Duffin, 2013).
Pulmonary ventilation () is normally generated through controlled contraction and relaxation of respiratory muscles during inspiration and expiration, respectively. The pressures generated by them combined with the airway flow resistance, and the lung elastance determine the airflow and lung volume, correspondingly (Bianchi et al., 1995). For this, the respiratory control system, which is responsible for automatic control of breathing, (a) receives and integrates several afferent inputs from both central and peripheral chemoreceptors and pulmonary sensors, to determine ventilatory demand and efficiently adjust tidal volume (VT) and respiratory frequency (fR); and (b) provides signals to the phrenic and intercostal moto-neurons, which drive the diaphragm and intercostal muscles (Duffin, 1994; Bianchi et al., 1995). Due to this, the respiratory control system is frequently seen as a pattern central generator that seeks to maintain healthy levels of O2, CO2, and pH in body and brain tissues (Feldman et al., 2013; Richter and Smith, 2014). This control can also be affected by behavioral inputs such as speech, voluntary control of respiratory muscles and wakefulness state (Duffin, 2013).
The central chemoreceptors, which are located in the medulla, sense increases of [H+] in their local environment and, therefore, increases in the brain partial pressure of CO2 (PbCO2) (Nattie and Li, 2009). On the other hand, peripheral chemoreceptors, which are located in the carotid bodies, sense changes in the arterial partial pressures of CO2 and O2 (PaCO2 and PaO2, respectively) (Marshall, 1994). In this way, both the central and the peripheral chemoreceptors allow matching pulmonary ventilation to tissue metabolism via a chemical arc that includes the respiratory control system, the chemoreceptors and respiratory muscles (Duffin, 2013). Recently, changes in PaO2 have been related to increases of chemoreceptor sensitivity to [H+] at extreme hypoxia (Blain et al., 2010; Duffin, 2013).
During mild and moderate exercise, metabolic rate and pulmonary exchange increase as a result of muscular activity, such increases quickly produce a higher ventilation which seeks to prevent hypercapnia (due to increase in CO2 production) and hypoxia (due to increase in O2 consumption) (Turner et al., 1997; Whipp and Ward, 1998; Haouzi, 2006). Because of increases nearly immediately at the onset of exercise, levels of CO2 and O2 remain practically unchanged from their rest values so, for this reason, a respiratory drive is not compatible with sensing an error signal transported in the blood (Duffin, 1994).
In recent decades, several clinical and experimental investigations have been carried out to determine the control mechanisms responsible for adjusting ventilation during exercise. A challenging aspect of this ventilatory stimulus is that increases while the brain and arterial partial pressures of CO2 and O2 remain almost unchanged. A generally accepted theory is the so-called neurohumoral theory (Turner, 1991; Mateika and Duffin, 1995; Turner et al., 1997; Whipp and Ward, 1998), which is mainly based on the respiratory system response to a step workload. In this theory, respiratory dynamic response from rest or light to moderate exercise is characterized by three phases: the first one, determined by a sudden increase of , the second one, by a gradual and exponential increase of and the third one, by its value in the steady state. The “abrupt” increase of is usually attributed to neurogenic mechanisms, since this increase is considered too fast to be explained by humoral agents, such as central and peripheral chemoreceptors, due to delayed transport. Until now, such mechanisms are not yet well-understood, because they seem to involve feed-forward control systems or learned processes that have not been clearly figured out (Bell, 2006; Williamson, 2010).
Some studies establish that the behavior of ventilatory response during moderate exercise is related to the frequency of limb movement, and the force carried out by exercising muscles (Duffin, 1994). On the other hand, other studies establish that such response is mainly based on factors related to gas exchange more than factors related to the motor activity (Haouzi, 2006). A broad review on the mechanisms currently implicated in the control of breathing at the onset of exercise from a perspective of an integrated system can be found in Bell (2006) and Duffin (2014).
Many empirical and functional models have been proposed in the literature to describe numerous aspects of the respiratory system (Fincham and Tehrani, 1983; Butera et al., 1999a,b; Cheng et al., 2010; Williamson, 2010; Tsai and Lee, 2011; Cheng and Khoo, 2012; Serna Higuita et al., 2014; Serna et al., 2016; Diekman et al., 2017). Due to the primary goal of this system is to regulate the CO2 and O2 in the brain and body tissues, ventilatory stimuli like exercise, hypoxia and hypercapnia are frequently used to evaluate the performance of such models. Exercise has been one of the most used ventilatory stimuli for validating this kind of models and their control mechanisms (Magosso and Ursino, 2005; Hermand et al., 2016).
Particularly, Hermand et al. (2016) have presented a mathematical model that allows analyzing the mechanisms responsible for the instability of the respiratory control system under simultaneous metabolic (exercise), and environmental (hypoxia) stresses. In this case, the model analysis is mainly focused on variations of and fR taking into account several settings to simulate the central and peripheral chemoreceptor responses. On the other hand, Maggoso and Ursino have presented a respiratory model that allows obtaining the transient and steady-state cardiorespiratory response to exercise with a good performance, but it does not include a comprehensive cardiovascular model like that published in Cheng et al. (2010) and the variables related to breathing pattern (i.e., inspiratory time, respiratory frequency, and tidal volume) are not evaluated. Our group has previously analyzed and developed several models and tools in the framework of this research (Mañanas et al., 2003; Hernandez et al., 2008; Serna et al., 2010). However, although the steady-state response of such models has been thoroughly evaluated (Mañanas et al., 2003, 2004), the transient behavior had not been studied enough. For these reasons, there is a need to provide computational models that allow, with a physiological meaning, simulating a comprehensive dynamic response of the respiratory system under ventilatory stimuli like exercise.
The aim of this study is two-fold. Firstly, to propose an improved model of the respiratory system that allows simulating its dynamic response to ventilatory stimuli like exercise. Secondly, to compare its transient and static responses with those obtained from two known respiratory models (Fincham and Tehrani, 1983; Cheng et al., 2010; Cheng and Khoo, 2012) and from which the proposed model is based on. The comparison was performed by simulation and by using experimental data from healthy subjects who carried out the cardiopulmonary exercise testing (CPET). The former allowed to analyze differences among model responses and, the latter, to assess the prediction capability of each one. Due to complex structures and mechanism that may be involved during exercise, this study was focused on the dynamic response analysis of respiratory system under moderate exercise (below the lactate threshold). All models were implemented in SIMULINK/MATLAB®.
A database of ten healthy male volunteers (aged 54.0 ± 13.5 years, weight 75.6 ± 10.3 kg, and height 169.9 ± 7.0 cm), non-smoking subjects, normotensive, normal lung function, and with no history of lower limb or cardiopulmonary disorders under a CPET in an electromagnetically-braked cyclorgometer (CardiO2; MedGraphics Corp., St. Paul, MN), was used in this study. The experimental protocol was carried out by a trained medical staff of the Pulmonary Function Laboratory of the Hospital Clínico de Barcelona for evaluation of exercise tolerance. This study, which was performed following the Helsinki declaration regarding the investigation with human subjects, had been previously approved by the Committee on Investigations Involving Human Subjects at the Hospital Clinic, University of Barcelona, Barcelona, Spain. Informed consent was obtained from all individual participants included in the study.
After a warming-up session consisting of five min of stretching and three min of unloaded pedaling on the cycloergometer, the exercise workload was increased by 5 or 10 W/min every minute until the subject stopped due to symptoms (i.e., dyspnea and/or leg fatigue) or no longer maintained the constant pedal rate required. The following signals were registered by the cycloergometer every 15 s: exercise workload (W), minute ventilation (), tidal volume (VT), inspiration time (TI), expiration time (TE), O2 consumptions (), CO2 productions , expired fraction of O2 (PetO2) and CO2 (PetCO2), and heart rate (HR). Taking into account that no subject had gas exchange impartments, arterial blood pressures of CO2 and O2 were adjusted considering average normal values at rest, 39.156 mmHg and 104.37 mmHg respectively (Batzel et al., 2007), as follows:
Figure 1 describes registered data in median and interquartile distance of the database analyzed. It can see that, excepting TI, PaCO2 and PaO2 whose values remained almost constant, all variables increased with the exercise workload. This latter was related to increments of both and that, in turn, had a linear relationship with .
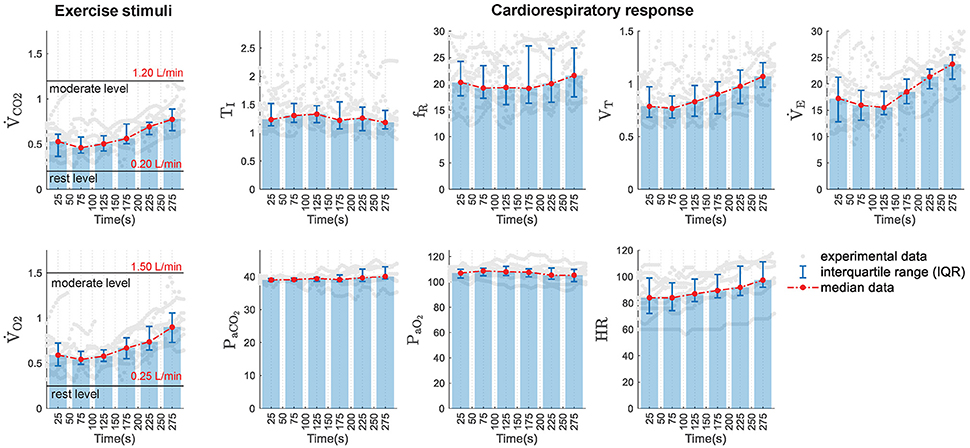
Figure 1. Experimental data distribution in function of time. (Left) Experimental exercise stimuli used to simulate the models under study: ventilated values of CO2 () and O2 (). Rest and moderate exercise levels are also marked in both variables. (Right) Experimental data of the cardiorespiratory variables analyzed: inspiratory time (TI), respiratory frequency (fR), tidal volume (VT), minute ventilation (), arterial partial pressure of CO2 (PaCO2) and O2 (PaO2), and heart rate (HR). Gray dots show original experimental data, bar plots and red lines display the median values obtained in 50-s consecutive time intervals and error bars show the interquartile ranges calculated in each interval.
RS1 is the respiratory model described in Fincham and Tehrani (1983) which has been extensively studied by many researchers for teaching and research purposes (Mañanas et al., 2003; Tehrani et al., 2004; Batzel et al., 2007; Hernandez et al., 2008). Additionally, it has been used to predict the effects of ventilatory settings on blood gases of mechanically ventilated patients and to adjust the ventilation parameters to optimize such a treatment both adult and infant (Tehrani and Abbasi, 2012). A schematic diagram of this model is provided in the Supplementary Material Section (see Figure S1).
RS1 includes a self-adaptive and discrete controller (Priban and Fincham, 1965), which self-adjusts the ventilation and the breathing pattern, every respiratory cycle, from signals captured by different afferent pathways, as it happens physiologically. It incorporates complex peripheral processes like the gas exchange between lungs and body tissues and brain, transport delays due to blood circulation and blood gas dissociation.
To adjust , RS1 controller continuously receives information sent by the central (PbCO2) and peripheral chemoreceptors (delayed by transport through the circulatory system, P′aCO2 and P′aO2), computes the mean value of such pressures in each respiratory cycle and sends these signals to the ventilatory controller which calculates the alveolar ventilation, cycle to cycle, through the following expression:
where,
In this case, is defined by the sum of and dead space ventilation (), where VD is, in turn, a function of :
The first term of Equation (3) represents the response generated by the central chemoreceptors, where PbCO2 is defined as a function depending on the brain venous and cerebrospinal fluid partial pressures of CO2 (PvbCO2 and PCSFCO2, respectively) and, therefore, on PaCO2 (see Figure S1). The second and third terms define the response of peripheral chemoreceptors to the arterial partial pressure of CO2 and O2, respectively; the fourth term, the neural control related to metabolism or exercise and, the last one β, is a controller constant equals 17.4. is the basal alveolar ventilation for a healthy adult, and it is ~0.0673 L/s (Fincham and Tehrani, 1983).
MRV, the neural impulse derived from metabolism, represents in RS1 the neurogenic mechanism of the respiratory control system during exercise, and it is determined by the following expression:
where MRR is the metabolic ratio defined by the current and basal of metabolic rates of the brain (MRB) and tissues (MRT), as follows:
and an exercise level increment can be simulated by a change in the input RTT (the magnitude of the step defining the final value of MRT) which is given by:
In this way, Equations (6–8) allow determining the metabolic dynamics of body and brain tissues as well as the subject's neural response during exercise. These equations represent first order dynamic systems whose response rates are determined by the time constants τ4 = 50 and τ3 = 30, respectively (Fincham and Tehrani, 1983).
There are essential conditions on which Equation (3) is invalid. Under conditions of acute hypoxia associated with low levels of the arterial partial pressure of CO2, this equation can produce a negative value of , clearly inadmissible. In this case, apnea occurs and immediately equals zero.
Once is determined, which in turn is equal to the product of VT and fR, breathing pattern is adjusted by the regulation of fR through an optimization criterion based on minimizing the work of breathing (Otis et al., 1950), as is shown in the following expression:
where, Rrs and Ers are the resistance and the elastance of the respiratory system, respectively. For that, the RS1 controller generates a neural signal at the beginning of each cycle such that:
In RS1, the blood flows control, this is, the “brain blood flow controller” and “the cardiac output controller” were modeled through algebraic relationships that allow calculating brain blood flow () and total cardiac output () depending on partial pressures of CO2 and O2 and metabolic rate ratio (MRR).
RS2 comprises the cardiorespiratory model described in Cheng et al. (2010) and Cheng and Khoo (2012) and it is referred by its authors as “PNEUMA.” This model is the result of the integration of key published models of the respiratory and cardiovascular system. It has been designed to simulate the cardiorespiratory control dynamic during wakefulness and sleep, so that provides realistic predictions of the physiological responses under a wide variety of conditions such as the day-to-day sleep-wake cycle, Cheyne-Stokes respiration in chronic heart failure, obstructive sleep apnea (OSA) and hypoxia-induced periodic breathing. It can be used to investigate several types of interventions: isocapnic and hypercapnic and/or hypoxemic gas administration, the Valsalva and Mueller maneuvers, and the application of continuous positive airway pressure (CPAP). The most recent version incorporates a sub-model of glucose-insulin-fatty acid regulation to simulate also the metabolic control of glucose-insulin dynamics and its interaction with the autonomic control in obese individuals (Cheng and Khoo, 2012). RS2 is available at the USC Biomedical Simulation http://bmsr.usc.edu/software/pneuma/.
RS2 has been developed using a hierarchical structure in such a way that the degree of complexity associated with each level of organization is adapted appropriately to the investigation of physiological processes at each level. This feature allows that the whole model can be presented in a compact and efficient way. RS2 is mainly composed of five principal interconnected compartments: the respiratory system, the cardiovascular system, the central control system, the sleep mechanism, and the metabolic control system. The last one allows simulating the metabolic control over the glucose-insulin dynamics and its interaction with the autonomic control in obese individuals (Cheng and Khoo, 2012). A schematic diagram of the model is given in the Supplementary Material Section (see Figure S2).
In this model, the respiratory subsystem allows the simulation of both gas exchange system and ventilatory mechanics. Unlike RS1, RS2 provides a more detailed description of chemical and physical processes generated during respiration. It includes the progressive decline of inspiratory gas pressure (PICO2and PIO2), due to different sectors of anatomic dead space, using a first-order dynamic approach to calculate the arterial partial pressures of CO2 and O2 in the areas closer to the alveoli and five small serial compartments (Khoo, 1990). It also considers the phenomena of convection and dissociation of respiratory gases during cardiovascular mixing by using a second-order dynamic system that relates the arterial pressures to the alveolar pressures (Spencer et al., 1979). In general, RS2 presents more elaborate expressions to describe in greater detail the different processes that comprise respiration, as well as its control and interaction with the cardiovascular system (Cheng et al., 2010). Only the variables directly related to ventilation control are considered here for brevity, as shown below.
The ventilatory controller in RS2 incorporates the contribution of the central (Dc) and peripheral (Dp) chemoreceptors. In this model, the central chemoreceptors only respond to variations in the brain partial pressure of CO2 (PbCO2) while the peripheral chemoreceptors are influenced by the arterial partial pressures of CO2 (PaCO2) and the oxygen saturation in arterial blood (SAO2) and their multiplicative interaction (Khoo, 1990). During wakefulness, the total ventilatory demand (DT) is defined by the sum of the central and peripheral chemoreceptors responses as follows:
where, Ic, IpCO2, and IpO2 represent the central and peripheral chemoreceptors activation threshold and, they are equal to 45, 38, and 102.4, respectively. In this case, PbCO2 is controlled by the metabolic rate (MRbCO2) and the brain blood flow (QB) and it is defined as a function of PaCO2 (Read and Leigh, 1967).
To adjust the breathing pattern, RS2 computes the respiratory frequency in function of ventilatory demand by using the following expressions (Duffin et al., 2000):
where, Fb is the basal frequency and TD and Tp are thresholds of DT that determine the behavior of respiratory rate. For the last two options of Equation (9) the respiratory rate varies linearly respect to DT with a slope established by the scaling factors S1F and S2F, which indirectly determine the adopted ventilatory pattern by the subject (frequency and depth) depending on the level of ventilation.
Once fR is determined, the neural control, derived from the respiratory centers, establishes the muscular activity integrating the total ventilatory demand and modulating it, in turn, by an auto-rhythmic and square signal. Such a signal determines each breathing cycle (TTOT) by using a relation 1.5:4 to define TI and TE, as follows:
In the case of assisted mechanical ventilation, internal neural activity is decreased. Depending on the type of ventilatory assistance, the respiratory period would be determined by the ventilator, the subject or the interaction between both.
The cardiovascular subsystem allows simulating the heart nature pulse and blood flow through the pulmonary and systemic circulations. Unlike RS1, this subsystem includes several processes like atria-ventricular mechanics, circulatory hemodynamics, SA node, change of total peripheral resistance and baroreflex (see Figure S2). Through these mechanisms, the system calculates the arterial blood pressure, ABP, heart period, HP, cardiac output, CO, and blood flow to lung for gas exchange depending on inputs from the autonomic control system, the respiratory system, and the sleep control system (Cheng et al., 2010).
Additionally, considering Equations (7, 8) of RS1, metabolic dynamics of CO2 and O2 were incorporated in RS2 to simulate exercise stimuli.
A third model called RS3 has been proposed in this study to get a completed and detailed model with a more appropriate dynamic response to exercise stimuli. This model is based on RS2 to take advantages of its associated subsystems, but mainly two key features from RS1 are replaced: (a) the estimation of ventilatory demand as a function of PbCO2, PaCO2, PaO2, and MRV and (b) the adjustment of breathing pattern by using the optimization criteria set by Otis et al. (1950).
Schematic diagram of RS3 is shown in Figure 2. The main changes, highlighted in orange color, are associated with the replacement of “ventilatory drive” and “respiratory rhythm” blocks of the original model RS2 by a clock pulse generator, similar to RS1 (see Figures S1, S2). The latter allows determining the onset and the end of each breath as follows: (a) the “mean value detector” block determines average values of PbCO2, PaCO2, and PaO2; (b) the “ventilation controller” block uses previous mean values and MRV to calculate by using Equation (3) and, finally, (c) the “frequency optimizer” block computes fR using the Otis' Equation (Equation 9).
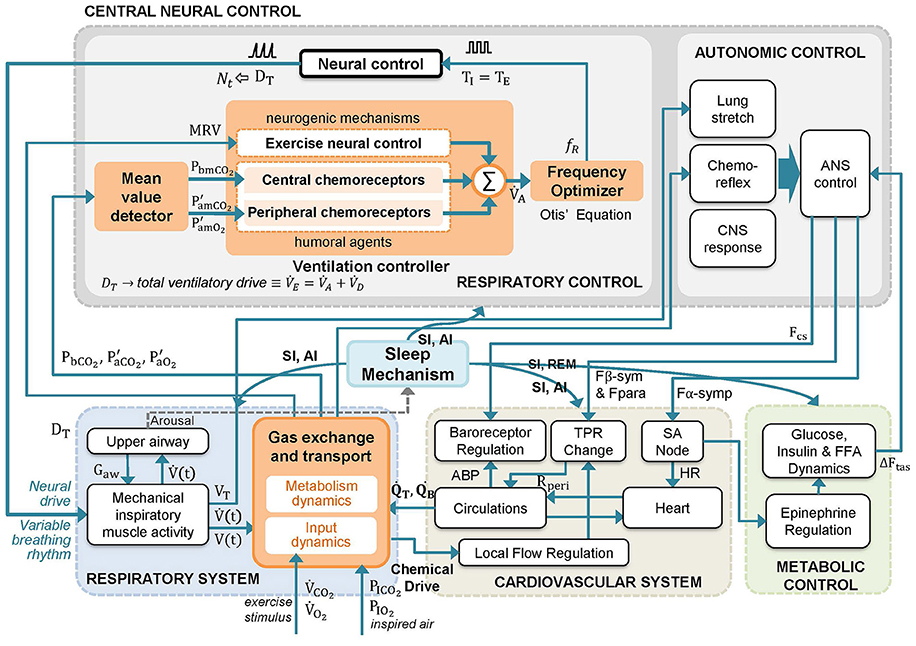
Figure 2. Schematic diagram of the proposed respiratory system model RS3. A model based on RS2 (Cheng et al., 2010; Cheng and Khoo, 2012) that integrates key features of RS1 (Fincham and Tehrani, 1983). The changes introduced in RS2 have been highlighted in orange. In the model, mean values of P′aCO2, P′aO2 and PbCO2 (Pm) and a metabolically related neural drive component to the ventilation (MRV) are used by the central neural control system to compute the alveolar ventilation () and the total ventilatory drive (). Then, is used to adjust the respiratory frequency (fR) each breathing cycle following the optimization principle set in Otis et al. (1950). A detailed description of model variables is provided in the Supplementary Material Section (Table S1).
Moreover, three significant changes were added to the gas exchange subsystem, which is also highlighted in orange color in Figure 2, according to:
• Production of CO2 and consumption of O2 into brain tissues were included into the mass balance equations for the rate of change of the lung CO2 and O2 volumes, because they constitute ~20% of the metabolic rate at the basal level.
During inspiration,
During expiration,
where VLCO2 and VLO2 denote the volume storage of CO2 and O2 in the lungs. Likewise, ṖACO2 and ṖAO2 represent the alveolar partial pressures of CO2 and O2; CaCO2, CaO2, CvCO2, and CvO2 symbolize the arterial and venous concentrations in body tissues of these gases, respectively; CBCO2, CBO2 denote the brain concentrations and QT and QB the blood rate in body and brain tissues.
• The exchange in the brain considered as follows:
where VBCO2 and VBO2 denoted volume storage of CO2 and O2 in the brain.
• Calculation of VD as a function of (see Equation 5).
These changes provide to RS3 a more detailed gas exchange plant, and although they do not improve its transient response, they provide additional information that can be useful in future studies connected to, for example, analysis of brain-tissues relationship implicated in the pulmonary gas exchange.
Furthermore, to guarantee that ventilation generated by the mechanical plant matched ventilatory demand, the neural signal N(t) in RS3 was adjusted through the following expression:
where,
RC denotes the muscle constant time (0.060s) and VC the vital capacity (5 L).
Like in RS1 and RS2, metabolism dynamic of CO2 and O2 was incorporated in the gas exchange plant with the aim of simulating exercise stimuli, see Equations (7, 8).
Responses and features of the three models were evaluated considering different levels of exercise. In this stimulus, the consumption of O2 and the production of CO2 rise significantly increasing the ventilated values of CO2 and O2. For this reason, a step input of and from rest (0.20 and 0.25 L/min), to moderate exercise (1.20 and 1.50 L/min), under conditions of normoxia, was considered to analyze their transient responses. Then, similarly, 11 equidistant step inputs among such intervals were taken into account to evaluate their stationary responses. These values were selected considering those published in Mañanas et al. (2002) and Guyton (2015) for moderated exercise and experimental data obtained in the CPET test (see Figure 1). Additionally, a sensitivity analysis was carried out with RS3 to assess the individual roll of the neurogenic and neuro-humoral mechanisms implemented to simulate exercise.
To assess the prediction capability of each model, experimental values of and were used to simulate exercise stimulus. Then, the output cardiorespiratory variables predicted by the models were analyzed concerning the ones obtained experimentally. Comparison of each model response regarding experimental data was evaluated quantitatively by the prediction error (PE) calculated from the following variables:
• , TI, fR, and VT, which provide information about ventilatory strategy or breathing pattern adopted for each model (controller) to adjust ventilation,
• HR, which provides information about cardiac activity, and
• PaCO2 and PaO2, which allow assessing the regulation of CO2 and O2 respectively.
PE was calculated by measuring percent differences between simulated, SIM, and experimental, EXP, variable as follows:
where k denotes the number of samples. Overall prediction error was obtained averaging the PE for all variables.
Regarding HR, due to RS1 does not provide direct information about it, this variable was obtained indirectly from the cardiac output (Q), considering a constant stroke volume (SV = 70 mL) and using the expression HR = Q/SV (Fincham and Tehrani, 1983; Batzel et al., 2007). Although this is a simple approximation, it allows comparing the cardiac response of RS1 with the other models.
Non-parametric tests, Friedman and Wilcoxon-Mann-Whitney (WMW), were used to identify statistical differences between prediction capability with a significance level of ρ = 0.05. The former was used in order to find differences between the model errors, and the latter to identify the model with the best fitting to experimental data. Each simulation was run once due to models are determinists (i.e., their responses do not change if the initial conditions and stimulus step size remain unchanged).
The models RS1, RS2, and RS3 can be interactively tested through a Matlab app, which is available at https://bioart.upc.edu/en/virtual-laboratories/modules upon query. Additionally, median values and interquartile distances of experimental data analyzed in this study as well as the stimulus levels used during simulation models are also provided.
Figure 3 shows a time series breath-to-breath of airflow signal for each model at the onset of exercise when a step input of 1.25 L/min and 1.50 L/min was applied to simulate each model (0.2 and 0.25 L/min values were considered as rest levels, respectively). In all models, it can be seen an increase in ventilation, which is higher and faster in RS3.
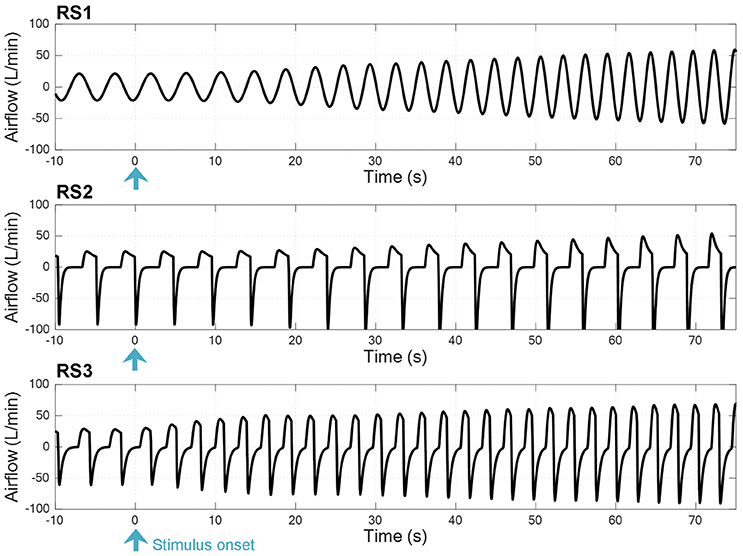
Figure 3. Time series breath-to-breath of airflow signal at the onset of exercise when a step input was used to simulate the respiratory system models RS1, RS2, and RS3 (see text).
Figure 4 shows the transient response obtained by the models. An additional interval, after of the stimulus, was also considered to simulate the recovery phase. Values of each variable are shown regarding their basal or rest values. Table 1 shows the constant times obtained in each of them.
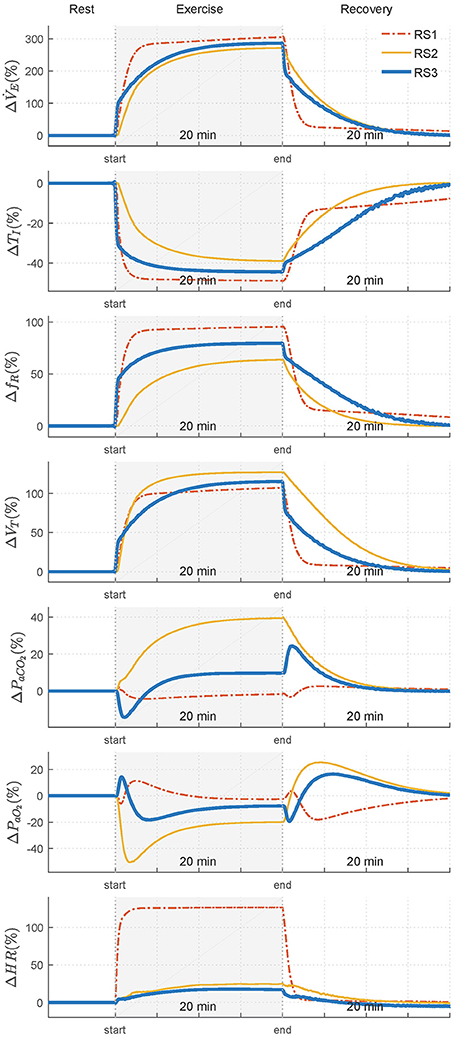
Figure 4. Transient responses of analyzed variables—ventilation (), inspiratory time (TI), respiratory frequency (fR), tidal volume (VT), arterial CO2 pressure (PaCO2), arterial O2 pressure (PaO2), and heart rate (HR)—when a step exercise input ( 1.20 L/min and 1.50 L/min) was used to simulate RS1, RS2, and RS3. Variations of each variable are showing regarding their respective values in rest.
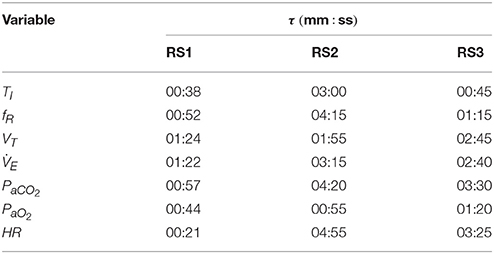
Table 1. Rise time (τ) of the dynamic response of RS1, RS2, and RS3 obtained when a step exercise input of 1.20 L/min and 1.50 L/min was used to simulate them.
Regarding variables related to breathing pattern, TI, fR, and VT, for RS1 and RS2, an exponential behavior was observed both exercise and recovery, being RS1 faster than RS2. For RS3, such responses were characterized by two main temporal phases during exercise: an initial phase determined by an instantaneous increase of almost 100% of and a second phase defined by a gradual increase of to its steady state-value. During recovery, and VT presented a similar behavior and opposite to that obtained during exercise while fR and, therefore, TI were given by the dynamics defined in Equation (9) (Otis et al., 1950).
Regarding the variables related to gas exchange and for RS1, PaCO2 presented initially a slight overshoot, which was followed by a decrease and subsequent exponential evolution toward a value close to its basal level. By contrast, PaO2 exhibited an initial slight drop, which was followed by a positive overshoot of about 10% and an exponential evolution that, as PaCO2, converged to a value close to that obtained during rest. This behavior was also reported by the same authors in Fincham and Tehrani (1983). For RS2, PaCO2 increased exponentially until overcomes its basal value by 40% (≈56 mmHg), while PaCO2 rapidly declined to 50% (≈50 mmHg), reaching values close to hypoxia (PaCO2 < 70 mmHg) (Roussos and Koutsoukou, 2003), for then evolves exponentially at a steady-state value of 80 mmHg.
For RS3, PaCO2 was characterized by an initial decrease, of about 15% from its basal value, followed by an exponential growth toward a steady-state value 10% higher than its basal value. PaO2 was defined by, first, an overshoot that, after ~1 min, evolved almost exponentially toward its stationary value with a negative overshoot that was not as critical as that found in RS2. During recovery, both PaCO2 and PaO2 presented similar and opposite behaviors in all models. In addition, evolution of PaCO2 was slower than PaO2, especially for RS2 and RS3 (see Table 1), possibly due to the larger storage capacity available for CO2 (VTCO2 = 15 L) compared to O2(VTO2 = 6 L). A similar behavior has been reported in Mateika and Duffin (1995).
Finally, for all models, HR exponentially evolved with different velocities toward its final value. Particularly for RS1, the response time of HR was lower than that obtained by the other models, and its increase from baseline was quite higher (≈170 bpm) than that expected for moderate exercise (85–110 bpm), see Figure 1.
Figure 5 shows the final values of analyzed variables in function of different levels of exercise. Eleven step inputs from 0.2 to 1.2 L/min for , with PIO2 fixed to its sea level value (150 mmHg), were applied to simulate the models and analyze their steady-state responses under moderated exercise.
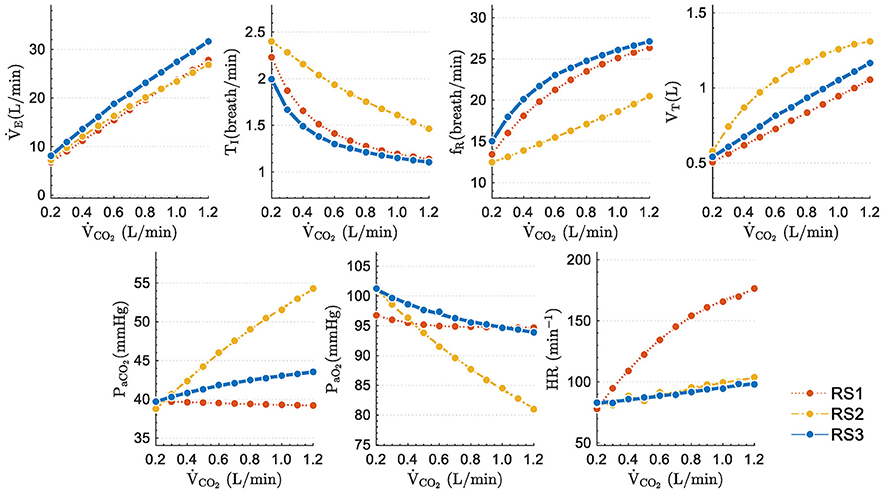
Figure 5. Steady state values obtained when step inputs of exercise from 0.25 to 2.50 L/min of were used to simulate the respiratory system models under study.
Excepting PaCO2, variables of all models increased followed similar trends: TI and PaO2 decreased while fR, VT, and increased with higher stimuli. Static performance in RS1 and RS3 for TI, fR, VT, and was quite similar since both models include the same neural ventilatory control to calculate , optimize fR and, therefore, set TI and VT.
The slight differences found among the model responses were mainly due to: (a) model basal values no related to exercise, (b) differences among the gas exchange plant, and (c) the control systems implemented in each model. The steady-state values of PaCO2 and PaO2 further evidence these differences. RS1 and RS3 were able properly to regulate PaCO2 and PaO2, while RS2 converged to values very different from those expected during moderate exercise (PaCO2 ≈ 40 mmHg and PaO2 ≈ 104 mmHg) (Guyton, 2015). For RS1 and RS3, the proper regulation of such gases could be because was adjusted to match the ventilatory demand generated by exercise.
Regarding HR, in RS2 and RS3, this variable raised slightly and linearly with the stimulus level, reaching approximately an increase of 20% at the highest stimulus. On the contrary, in the RS1 model, HR increased considerably (up to 130%), moving away from the expected range for this type of stimulus.
Figure 6 shows the results obtained in the sensitivity analysis carried out in RS3. , PaCO2 and PaO2 are shown in two different conditions: first, with all mechanisms working and second, without the neurogenic mechanism MRV (exercise neural control component). Results are compared with those obtained with RS2.
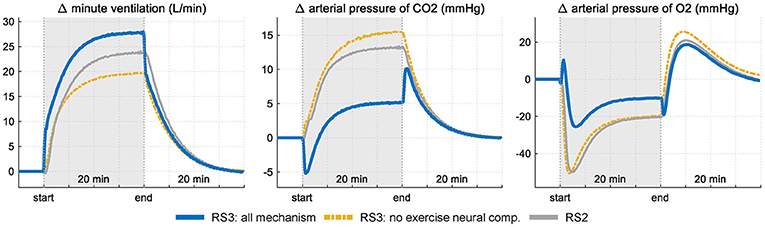
Figure 6. Response of RS3 to a step exercise input under two conditions: firstly, with all mechanism of respiratory control operative and, secondly, without the neurogenic mechanism MRV (see Equation 3). Results are compared with those obtained in RS2 for the same stimulus. Variations of each variable are showing regarding their respective rest values.
Selective elimination of neurogenic mechanism MRV leads to a slower increase of during exercise with a consequent and important drop of PaO2 at the onset of exercise (up to 50 mmHg) and an exponential increase in PaCO2 (up to 12 mmHg from baseline). During the stimulus, the final ventilation value of RS3 differs only by 5 L/min from the value reached when all the mechanisms are considered, case in which PaCO2 and PaO2 vary slightly from their values at rest. This is because the absence of a neurogenic mechanism is compensated by central and peripheral chemoreceptors, which are greatly stimulated by the large decompensation of arterial pressures, especially PaCO2. On the other hand, the action of the humoral mechanism (central chemoreceptors response) of RS2 generates a ventilation inferior to that obtained by RS3, a fact that contributed to a greater increase of PaCO2 for the same stimulus level.
Figure 7 shows the contribution from each controller component of RS3 regarding its basal value. In this case, it can be seen that, during exercise, the presence of the exercise neural control component (neurogenic mechanism) generates a change in ventilation of up to 16 L/min (67%) while central and peripheral chemoreceptors contribute only with 8 L/min (33%) in the total ventilation. For the latter, this contribution is mainly generated by the changes given in PaCO2 due to the relationship between and PaCO2 (i.e., changes in by PaO2 only are significant when this is lower than ≈ 60 mmHg, see Equation 4).
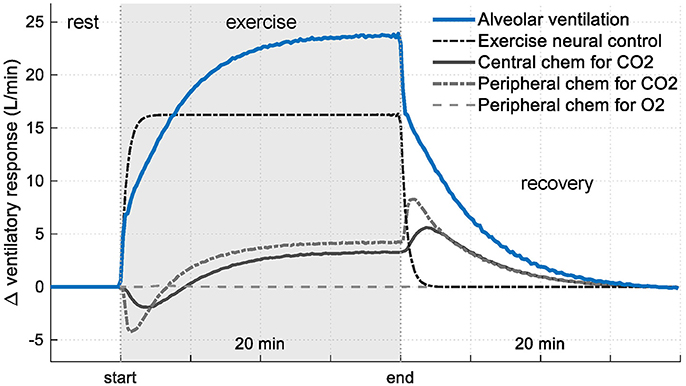
Figure 7. Contribution of each controller component of RS3 on ventilatory response (see Equation 3). Results are shown regarding their respective rest values.
Given the nature of the stimuli used to simulate the models from experimental data (a progressive increase, contrary to step function), only responses in “transient regime” were analyzed. Figure 8 shows simulation results in median and interquartile distance. In this case, both experimental data and model responses of , fR, and VT increased with the increment of exercise stimulus whereas TI decreased slightly. Regarding PaCO2 y PaO2, RS1 and RS3 showed an appropriate regulation. For RS2, these latter variables took values a little apart from experimental data at the highest stimulus levels. Respect to HR, RS2 and RS3 showed a good fitting whereas RS1 presented values far away of experimental data.
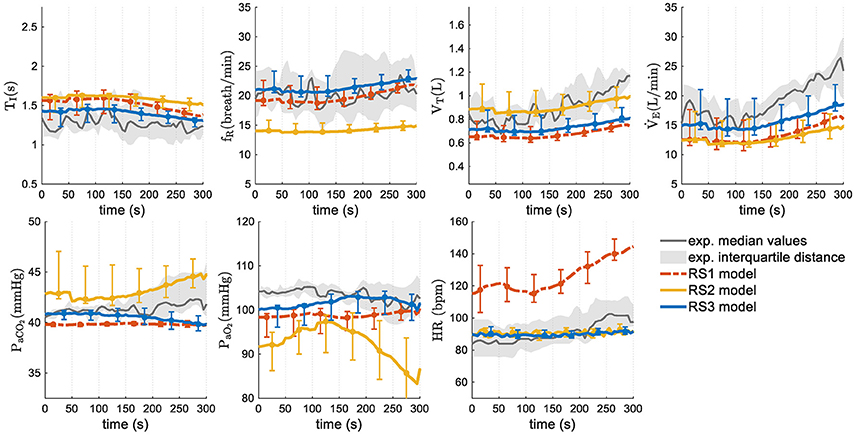
Figure 8. Transient responses of models analyzed in this study. Median values and interquartile distance of experimental and simulated data are presented for each variable and model. Gray shadows show the IQR of experimental data and error bars the IQR of simulated data obtained by each model.
Figure 9 shows the median values and interquartile distance of prediction error calculated from Equation (24). Friedman test showed statistically significant differences in all variables except fR and VT, where the ρ-values were 0.149 and 0.122 respectively. In general, RS3 was the model with the best adjustment. It reached the lowest overall PE (13.76 vs. 20.92% for RS1 and 16.57% for RS2). Wilcoxon signed-rank test showed statistical differences between RS3 and the other models (ρ < 0.01) whereas RS1 and RS2 did not have any statistically significant difference (ρ = 0.432). Regarding each variable, RS3 presented the best fitting for , TI, PaO2, PaCO2, and HR with ρ < 0.01 for the first three variables. RS1 and RS2 showed a better adjustment for fR and VT, respectively, but without any significant statistical difference respect to RS3 (see Figure 9).
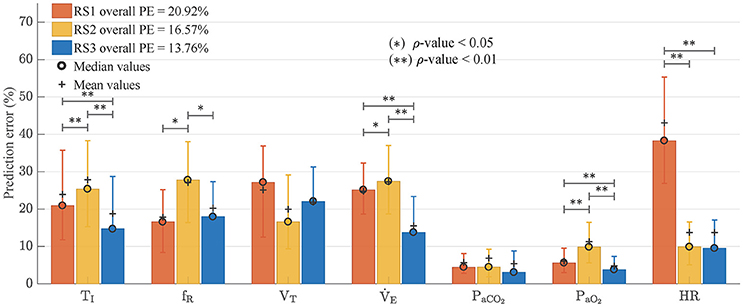
Figure 9. Prediction errors (PE) obtained by each one of analyzed models. Bars graph shows median values and error bars indicate interquartile distance (range of values from 25 to 75% quartile). Wilcoxon signed-rank test was used to find statistically significant differences between the obtained PE. (*) for ρ < 0.05 and (**) for ρ < 0.01.
On the other hand, HR in RS1, which was calculated from and a stroke volume of 70 mL, presented a very high prediction error. In this case, the absence of a more complex cardiovascular subsystem impeded a suitable simulation of HR response to exercise.
Dynamic responses of three respiratory system models under exercise stimuli have been analyzed in this study. The performances of these models were evaluated by using two settings: first, through simulation to assess the realism of the dynamics of their responses and second, using experimental data to estimate the prediction capability of each model.
Transient response of each model was evaluated by using a moderate exercise step input. In this case, RS1 presented a relatively fast response at the onset of exercise (see Table 1), with an exponential response for and an appropriate regulation for PaCO2 and PaO2 at the end of the stimulus. RS2 presented an exponential growth in that was not enough to regulate the arterial gases. Due to this, PaO2 decreased dramatically, during the transient phase reaching hypoxemic values (PaO2 ≈ 50 mmHg) and PaCO2 increased by 40% its basal value reaching hypercapnic values (PaCO2 ≈ 56 mmHg). This fact invalidates its simulation for this kind of stimulus. Finally, RS3 presented at the onset of exercise an sudden increase of which was followed by an intermediate phase characterized by an exponential growth, and a final phase defined by its static value. The “abrupt” increase of caused PaCO2 to decrease slightly and that PaO2 obtained an overshoot at the beginning of the stimulus. Then, in the intermediate phase, PaO2 decreased while PaCO2 raised as a result of the increase in consumption of O2 and production of CO2, respectively, and its dissociation with (Whipp and Ward, 1991) and, at the final phase, PaCO2 and PaO2 took values near their basal values (see Figure 4).
Regarding variables involved in breathing pattern (TI, fR, and VT), it was found that, except RS3 at the onset of the stimulus, all variables evolved similarly and exponentially toward their steady-state values. Differences found among them were mainly given by the ventilatory controller implemented in each model. On the other hand, behavior of HR in RS2 and RS3 was very similar, and its values were within the range defined for moderate exercise, contrary to RS1, where HR took values far away to those expected (see Figures 1, 4).
The steady-state model responses were evaluated considering a sequence of step inputs from rest to moderate exercise. In all models, linearly increased with the stimulus level (see Figure 5). Changes between consecutive stimulus were quite similar. Respect to fR, this variable also linearly augmented in RS2 according to Equation (14), while in RS1 and RS3 it was determined by Equation (9), which guarantees the minimum respiratory work of breathing (Otis et al., 1950). These adjustments affected the behavior of TI and VT due to their relationship with and fR ().
On the other hand, RS1 and RS3 presented an appropriate regulation for PaCO2 y PaO2 (the final values were closer to normal ones at rest, PaCO2 ≈ 40 mmHg and PaO2 ≈ 104 mmHg) (Guyton, 2015). Particularly in RS3, PaCO2 and PaO2 shown slight variation regarding their basal values such has been reported from several studies (Krogh and Lindhard, 1913; Pearce and Milhorn, 1977; Magosso and Ursino, 2005). RS2 did not show a proper regulation of the arterial gases due to PaCO2 increased toward hypercapnic values (PaCO2 ≈ 54 mmHg) while PaO2 decreased toward hypoxemic values (PaO2 ≈ 80 mmHg), lower than expected ones (Guyton, 2015).
In RS3, the abrupt increase of at the onset of exercise and, therefore, the initial changes in PaCO2 and PaO2, was mainly determined by the “MRV” component incorporated in its controller (see Equation 4). This component played an important role in the determination of anticipatory ventilatory response and allowed simulating, with a straightforward approach, the neurogenic mechanism of ventilation to exercise, i.e., the so-called central command (direct activation of the respiratory control centers by the locomotor stimulus), chemoreceptors in large vessels and mechanoreceptors located in exercising muscles (Dempsey and Smith, 2014), see Figures 6, 7. Although, an only “exercise” component in the respiratory controller could not be enough to simulate each underlie mechanism to this type of control, similar results to those obtained in RS3, especially with regard to the behavior of , PaCO2, and PaO2, have been reported in several sources (Krogh and Lindhard, 1913; Pearce and Milhorn, 1977; Whipp et al., 1982; Mateika and Duffin, 1995; Turner et al., 1997; Whipp and Ward, 1998; Magosso and Ursino, 2005; Wasserman et al., 2011; Parkes, 2013; Guyton, 2015).
Particularly, the changes in ventilation, blood flow, pulse rate, respiratory exchange and alveolar CO2 tension, which take place in men during the first minute of light (moderate) or heavy work, presented in Krogh and Lindhard (1913) agree with the transient responses obtained in RS3, see Figure 4. They found in all the cases examined (six subjects, three of them subject trained to sudden exertions) a sudden rise in ventilation when an exercise step was used to stimulate the subjects. This abrupt increase was greater with heavier work. Although differences were found between trained and no-trained subjects, the latter presented a higher increase in that, although was not as pronounced as in trained subjects, was always present even during moderate exercise. Regarding gases regulation, as in RS3 a considerable fall in alveolar CO2 tension was detected, which was, likewise, followed by a CO2 increase. A similar behavior was also reported in Parkes (2013). They found a nearly exponential increment of ventilation during exercise, while PaO2 decreased regarding its rest value at the beginning of stimulus for, then, growing up exponentially to its steady state. Moreover, the simulated data reported in Magosso and Ursino (2005), which were found according to experimental dynamic responses of human subjects to bicycle exercise published in Pearce and Milhorn (1977), were also consistent with RS3.
It is important to note that respiratory drive and therefore, ventilatory response () in RS3 (and RS1) is related to PbCO2, PaCO2, PaO2 and MRV through Equation (3). Thus, there is a linear relationship with PbCO2, PaCO2, and MRV and an exponential dependence with PaO2 (see Equation 4). So, unitary changes in PbCO2, PaCO2, and MRV would modify by a quantity of 0.2332, 0.2025, and 1 of its basal value (). By contrast, decreases of PaO2 would exponentially increase only if PaO2 < 104.9 (see Figure 7).
On the other hand, in this study, exercise stimulus was used to generate different levels of ventilation and evaluate how the models adjust ventilation and breathing pattern to accomplish metabolic demand and regulate arterial blood gases. RS1 and RS3 used an optimization principle that allows adjusting fR by minimizing work of breathing. In this sense, the minimization of WOB has been extensively considered as a control criterion to adjust the breathing pattern (Yamashiro and Grodins, 1971; Poon et al., 1992; Serna Higuita et al., 2014; Serna et al., 2016). Moreover, recent formulations seek to describe how sensory information influences the dynamics of respiratory rhythm under the hypothesis that “respiratory rhythms arise from the interplay of central rhythm generation circuits, biomechanics and feedback from peripheral signaling pathways” (Butera et al., 1999a,b; Diekman et al., 2017). Particularly, rhythmogenesis is investigated in Diekman et al. (2017) in a simple model of close-loop control, incorporating biomechanics, oxygen handling, metabolism and chemo-sensation. In such study, the Butera-Rinzel-Smith model (Butera et al., 1999a) of bursting pacemaker neurons in the preBötzinger complex is adopted as their central pattern generator. Although, peripheral processes modeled in Diekman et al. (2017) are not as comprehensive as RS1, RS2, and RS3, this approach to simulate the dynamics of rhythm respiratory could be interesting to provide RS3 a more realistic pattern generator.
Finally, highly regulated neural inputs are critical to maintaining normal cardiovascular function. Although the cardiovascular central command during exercise is typically associated with a perception of effort, there is not a clear understanding of the role of central command in the integration of sensory information that can define more completely the relevance of central command for the neural control of exercise (Williamson, 2010).
Regarding the model goodness of fit, RS3 presented the overall best adjustment to experimental data with the lowest prediction error and an improvement of 17% respect to RS2 (overall PE = 13.51%, see Figure 9). RS3 also presented the lower prediction errors for TI, , PaCO2, PaCO2, and HR with statistically significant differences for the first three.
While the reduction of the prediction error in RS3 (13.76%) is lower concerning RS2 (16.57%) than to RS1 (20.92%) when using experimental data, in both cases, these reductions were statistically significant (ρ < 0.01). This improvement is more evident if only the respiratory variables TI, fR, VT, and are considered. In this case, the prediction errors are 23.0, 26.4, and 16.3%, for RS1, RS2, and RS3 respectively, and RS3 presents an improvement of 38% regarding RS2. Such difference is due to prediction errors of PaCO2 and PaO2in all models were relatively small by the magnitude of these variables.
Three respiratory system models have been analyzed in this paper. Two of them published Fincham and Tehrani (1983), Cheng et al. (2010), and Cheng and Khoo (2012), named RS1 and RS2 respectively, and the other one is a model proposed in this study, called RS3 and based on the integration of key features of the first two.
The first analyzed model, RS1 (Fincham and Tehrani, 1983), is a complex model that adjusts and the breathing pattern by minimizing the work of breathing through regulation of fR (see Equation 9) (Otis et al., 1950). It integrates several peripheral processes and self-adjust the ventilation and breathing pattern at the end of each breath from signals captured by humoral and neurogenic afferent pathways. Simulation of this model, under exercise stimuli, showed a good adjustment of and a proper regulation of arterial gases (PaCO2 and PaO2). This was the key feature that motivated us to use the neural controller of RS1 in RS3.
The second model analyzed, RS2 (Cheng et al., 2010; Cheng and Khoo, 2012) is a more comprehensive model. It integrates the interaction between the respiratory and cardiovascular systems and allows simulating the dynamic of cardiorespiratory control during wakefulness and sleep. However, unlike RS1, respiratory control is carried out through a proportional controller that does not take into account the work of breathing done by the subject. It adjusts in function of the brain and arterial partial pressures of CO2 and O2 and regulates fR and VT through lines predefined in Duffin et al. (2000). Moreover, RS2 considers a multiplicative interaction among peripheral chemoreceptors more than a higher sensitive to hypoxia than hypercapnia (Blain et al., 2010; Cui et al., 2012; Kumar and Prabhakar, 2012), such as it is described in RS1 (see Equations 3, 4). It also does not take into account the control neural performed by the central controller to changes in the subject's metabolic rates during exercise (Williamson, 2010; Duffin, 2014; Guyton, 2015). Furthermore, it is not clear why in RS2 both PaO2 and SaO2 were indicated as independent variables since peripheral chemoreceptors are more sensitive to PaO2 rather than SaO2 (Kumar and Prabhakar, 2012). Simulations of this model, using exercise stimuli, did not show a proper regulation of blood gases for both transient and steady-state responses. This fact is understandable if it considers that RS2 is a model designed for sleep-related studies and not for another kind of stimuli such as exercise. One of the challenges of this study was to adapt RS2 to simulate exercise.
The third analyzed model, RS3, was proposed in this study to take advantages of completeness and versatility of RS2 and some properties of RS1. This model was proposed integrating key features of RS1 into RS2. In this sense, the proposed model, RS3, provided to RS2 the ability to adjust the ventilation in function of (a) the brain partial pressure of CO2 and the arterial partial pressure of CO2 and O2 and (b) the tissue metabolic demand. Unlike RS2, RS3 controller allows describing the highest sensitive of such chemoreceptors to hypoxia (see second and third terms of Equations 3, 4). Additionally, this model also supplied to RS2 the capacity to adjust breathing pattern considering an efficiency criterion based on minimization of work of breathing through regulation of fR (see Equation 9). These features enable RS3 to accomplish appropriate transient and stationary responses during exercise. Likewise, the model improvement is not only related to prediction error. RS3 showed transient responses faster than RS2 with a better physiological meaning. This was especially important in the dynamics found for PaCO2 and PaO2 (see Figure 4), which were consistent with results published in previous studies (Krogh and Lindhard, 1913; Pearce and Milhorn, 1977; Whipp et al., 1982; Mateika and Duffin, 1995; Turner et al., 1997; Whipp and Ward, 1998; Magosso and Ursino, 2005; Wasserman et al., 2011; Parkes, 2013; Guyton, 2015). On the other hand, although RS3 is more complex and complete than RS1, there is not a higher complexity in RS3 respect to RS2, but there is a substitution of some blocks and equations (from RS1) that allowed getting the improvements mentioned above.
Even though RS3 showed a good regulation of ventilation and blood gases partial pressures and, unlike RS1, it provides information related to cardiac activity such as heart rate, stroke volume, and cardiac output, we are still far to reproduce a real response to this type of stimulus. One of the found handicaps is related to many theories that have been developed so far to describe the underlying mechanism to the cardiorespiratory response during exercise. Particularly, RS3 (like RS1) has a component in its controller that allows it to simulate exercise stimulus from metabolic rate ratio (MRR) and, therefore, from and (see Equations 3, 6). This feature allowed RS3 to reproduce transient responses similar to those reported in the literature, especially at the onset of exercise, and achieve a better performance when experimental data were used. We are aware that this “exercise component” is a straightforward approach to simulate this type of control and additional efforts will be necessary to reproduce detailed changes in ventilation due to, for example, the central command, large vessels chemoreceptors and mechanoreceptors located in exercising muscles. Nonetheless, we consider results obtained here represent one-step beyond simulation of this kind of stimulus because they allowed contrasting the models, taking advantages of their key features, reproducing transient responses more realistic from a physiological point of view and getting a better prediction error.
Another handicap is related to published studies include many variables that influence the subject's response: mode exercise (walking, pedaling), posture, initial conditions, state of the subject (trained, inexperienced, uncomfortable, anxious, anticipating, distracted, tired, etc.), and metabolic rate (Bell, 2006; Fadel, 2013; Duffin, 2014). On the other hand, due to the significant individual variation in the ventilatory responses reported in the literature, a better prediction of real breathing patterns can be achieved only by fitting procedures (i.e., estimation of individual parameters).
Finally, the proposed model RS3 will need a validation in a sample of healthy controlled subjects in different exercise conditions to go in deep in the controller mechanism of the respiratory system during exercise.
All authors made substantial contributions to the conception and design of the paper. LS: Carried out the model simulations, processed the obtained data, and drafted the review; MM, AH, and RR: Revised it critically for content; All authors approved the final submission of the document and agreed to be accountable for all aspects of the work.
This study was supported by the Spanish government MINECO (DPI2014-59049-R), the Universitat Politècnica de Catalunya (FPU-707.707), and Fondo Nacional de Regalías from Republic of Colombia (Ruta-n 139C-2014), Universidad de Antioquia UdeA.
The authors declare that the research was conducted in the absence of any commercial or financial relationships that could be construed as a potential conflict of interest.
The authors would like to thank the Pulmonary Function Laboratory of Hospital Clínic de Barcelona, led by RR, for its help in designing experimental protocol and signal recording.
The Supplementary Material for this article can be found online at: https://www.frontiersin.org/articles/10.3389/fphys.2018.00069/full#supplementary-material
Batzel, J. J., Kappel, F., Schneditz, D., and Tran, H. T. (2007). Cardiovascular and Respiratory Systems: Modeling, Analysis, and Control. Philadelphia, PA: Society for Industrial Mathematics.
Bell, H. J. (2006). Respiratory control at exercise onset: an integrated systems perspective. Respir. Physiol. Neurobiol. 152, 1–15. doi: 10.1016/j.resp.2006.02.005
Bianchi, A. L., Denavit-Saubié, M., and Champagnat, J. (1995). Central control of breathing in mammals: neuronal circuitry, membrane properties, and neurotransmitters. Physiol. Rev. 75, 1–45. doi: 10.1152/physrev.1995.75.1.1
Blain, G. M., Smith, C. A., Henderson, K. S., and Dempsey, J. A. (2010). Peripheral chemoreceptors determine the respiratory sensitivity of central chemoreceptors to CO2. J. Physiol. 588, 2455–2471. doi: 10.1113/jphysiol.2010.187211
Butera, R. J., Rinzel, J., and Smith, J. C. (1999a). Models of respiratory rhythm generation in the pre-Bötzinger complex. I. bursting pacemaker neurons. J. Neurophysiol. 82, 382–397. doi: 10.1152/jn.1999.82.1.382
Butera, R. J., Rinzel, J., and Smith, J. C. (1999b). Models of respiratory rhythm generation in the pre-Bötzinger complex. II. populations of coupled pacemaker neurons. J. Neurophysiol. 82, 398–415. doi: 10.1152/jn.1999.82.1.398
Cheng, L., Ivanova, O., Fan, H. H., and Khoo, M. C. (2010). An integrative model of respiratory and cardiovascular control in sleep-disordered breathing. Respir. Physiol. Neurobiol. 174, 4–28. doi: 10.1016/j.resp.2010.06.001
Cheng, L., and Khoo, M. C. (2012). Modeling the autonomic and metabolic effects of obstructive sleep apnea: a simulation study. Front. Physiol. 2:111. doi: 10.3389/fphys.2011.00111
Cui, Z., Fisher, J. A., and Duffin, J. (2012). Central-peripheral respiratory chemoreflex interaction in humans. Respir. Physiol. Neurobiol. 180, 126–131. doi: 10.1016/j.resp.2011.11.002
Dempsey, J. A., and Smith, C. A. (2014). Pathophysiology of human ventilatory control. Eur. Respir. J. 44, 495–512. doi: 10.1183/09031936.00048514
Diekman, C. O., Thomas, P. J., and Wilson, C. G. (2017). Eupnea, tachypnea, and autoresuscitation in a closed-loop respiratory control model. J. Neurophysiol. 118, 2194–2215. doi: 10.1152/jn.00170.2017
Duffin, J. (1994). Neural drives to breathing during exercise. Can. J. Appl. Physiol. 19, 289–304. doi: 10.1139/h94-025
Duffin, J. (2013). “Model validation and control issues in the respiratory system,” in Mathematical Modeling and Validation in Physiology Lecture Notes in Mathematics, eds J. J. Batzel, M. Bachar, and F. Kappel (Berlin; Heidelberg; Springer), 133–162.
Duffin, J. (2014). The fast exercise drive to breathe. J. Physiol. 592, 445–451. doi: 10.1113/jphysiol.2013.258897
Duffin, J., Mohan, R. M., Vasiliou, P., Stephenson, R., and Mahamed, S. (2000). A model of the chemoreflex control of breathing in humans: model parameters measurement. Respir. Physiol. 120, 13–26. doi: 10.1016/S0034-5687(00)00095-5
Fadel, P. J. (2013). Neural control of the circulation during exercise in health and disease. Front. Physiol. 4:224. doi: 10.3389/fphys.2013.00224
Feldman, J. L., Del Negro, C. A., and Gray, P. A. (2013). Understanding the rhythm of breathing: so near, yet so far. Annu. Rev. Physiol. 75, 423–452. doi: 10.1146/annurev-physiol-040510-130049
Fincham, W. F., and Tehrani, F. T. (1983). A mathematical model of the human respiratory system. J. Biomed. Eng. 5, 125–133. doi: 10.1016/0141-5425(83)90030-4
Guyton, A. C. (2015). “Respiration: regulation of respiration,” in Guyton and Hall Textbook of Medical Physiology, ed J. E. Hall (Philadelphia, PA: Elsevier Health Sciences), 539–546.
Haouzi, P. (2006). Theories on the nature of the coupling between ventilation and gas exchange during exercise. Respir. Physiol. Neurobiol. 151, 267–279. doi: 10.1016/j.resp.2005.11.013
Hermand, E., Lhuissier, F. J., Voituron, N., and Richalet, J. P. (2016). Ventilatory oscillations at exercise in hypoxia: a mathematical model. J. Theor. Biol. 411, 92–101. doi: 10.1016/j.jtbi.2016.10.002
Hernandez, A. M., Mañanas, M. A., and Costa-castelló, R. (2008). Learning respiratory system function in BME studies by means of a virtual laboratory: RespiLab. IEEE Trans. Educ. 51, 24–34. doi: 10.1109/TE.2007.893355
Khoo, M. C. (1990). A model-based evaluation of the single-breath CO2 ventilatory response test. J. Appl. Physiol. 68, 393–399. doi: 10.1152/jappl.1990.68.1.393
Krogh, A., and Lindhard, J. (1913). The regulation of respiration and circulation during the initial stages of muscular work. J. Physiol. 47, 112–136. doi: 10.1113/jphysiol.1913.sp001616
Kumar, P., and Prabhakar, N. R. (2012). “Peripheral chemoreceptors: function and plasticity of the carotid body,” in Comprehensive Physiology, ed D. M. Pollock (Hoboken, NJ: John Wiley and Sons, Inc.), 141–219.
Mañanas, M. A., Hernández, A. M., Romero, S., Grinó, R., Rabinovich, R., Benito, S., et al. (2003). “Analysis of respiratory models at different levels of exercise, hypercapnia and hypoxia,” in Engineering in Medicine and Biology Society, 2003; Proceedings of the 25th Annual International Conference of the IEEE (Cancún), 2754–2757.
Magosso, E., and Ursino, M. (2005). “A theoretical study of the transient and steady-state cardiorespiratory response to exercise,” in 6th International Conference on Modelling in Medicine and Biology (Bologna), 17–26.
Mañanas, M. A., Hernández, A. M., Rabinovich, R., Benito, S., and Caminal, P. (2004). “Modeling and evaluation of respiratory and muscle pattern during hypercapnic stimulus,” in Annual International Conference of the IEEE Engineering in Medicine and Biology – Proceedings (San Francisco, CA), 3913–3916.
Mañanas, M. A., Navarro, C., Romero, S., Griñó, R., Rabinovich, R., Benito, S., et al. (2002). “Control system response of different respiratory models under ventilatory stimuli and pathologies,” in Proceedings 15th IFAC World Congress on Automatic Control (Barcelona), 2317–2322.
Marshall, J. M. (1994). Peripheral chemoreceptors and cardiovascular regulation. Physiol. Rev. 74, 543–594, doi: 10.1152/physrev.1994.74.3.543
Mateika, J. H., and Duffin, J. (1995). A review of control of breathing during exercise. Eur. J. Appl. Physiol. Occup. Physiol. 71, 1–27. doi: 10.1007/BF00511228
Nattie, E., and Li, A. (2009). Central chemoreception is a complex system function that involves multiple brain stem sites. J. Appl. Physiol. 106, 1464–1466. doi: 10.1152/japplphysiol.00112.2008
Otis, A. B., Fenn, W. O., and Rahn, H. (1950). Mechanics of breathing in man. J. Appl. Physiol. 2, 592–607. doi: 10.1152/jappl.1950.2.11.592
Parkes, M. J. (2013). Evaluating the importance of the carotid chemoreceptors in controlling breathing during exercise in man. Biomed Res. Int. 2013:893506. doi: 10.1155/2013/893506
Pearce, D. H., and Milhorn, H. T. (1977). Dynamic and steady-state respiratory responses to bicycle exercise. J. Appl. Physiol. 42, 959–967. doi: 10.1152/jappl.1977.42.6.959
Poon, C. S., Lin, S. L., and Knudson, O. B. (1992). Optimization character of inspiratory neural drive. J. Appl. Physiol. 72, 2005–2017. doi: 10.1152/jappl.1992.72.5.2005
Priban, I. P., and Fincham, W. F. (1965). Self-adaptive control and respiratory system. Nature 208, 339–343. doi: 10.1038/208339a0
Read, D. J., and Leigh, J. (1967). Blood-brain tissue PCO2 relationships and ventilation during rebreathing. J. Appl. Physiol. 23, 53–70. doi: 10.1152/jappl.1967.23.1.53
Richter, D. W., and Smith, J. C. (2014). Respiratory rhythm generation in vivo. Physiology 29, 58–71. doi: 10.1152/physiol.00035.2013
Roussos, C., and Koutsoukou, A. (2003). Respiratory failure. Eur. Respir. J. 22, 3s−14s. doi: 10.1183/09031936.03.00038503
Serna, L. Y., Hernandez, A. M., and Mañanas, M. A. (2010). “Computational tool for modeling and simulation of mechanically ventilated patients,” in 2010 Annual International Conference of the IEEE Engineering in Medicine and Biology Society, EMBC' (Buenos Aires), 569–572.
Serna Higuita, L. Y., Mañanas, M. A., Hernández, A. M., Marína Sánchez, J., and Benito, S. (2014). Novel modeling of work of breathing for its optimization during increased respiratory efforts. IEEE Syst. J. 10, 1003–1013. doi: 10.1109/JSYST.2014.2323114
Serna, L. Y., Marín, J., Hernández, A. M., and Mañanas, M. Á. (2016). Optimization techniques applied to parameter estimation in respiratory control system models. Appl. Soft Comput. 48, 431–443. doi: 10.1016/j.asoc.2016.07.033
Spencer, J. L., Firouztale, E., and Mellins, R. B. (1979). Computational expressions for blood oxygen and carbon dioxide concentrations. Ann. Biomed. Eng. 7, 59–66. doi: 10.1007/BF02364439
Tehrani, F. T., and Abbasi, S. (2012). A model-based decision support system for critiquing mechanical ventilation treatments. J. Clin. Monit. Comput. 26, 207–215. doi: 10.1007/s10877-012-9362-0
Tehrani, F., Rogers, M., Lo, T., Malinowski, T., Afuwape, S., Lum, M., et al. (2004). A dual closed-loop control system for mechanical ventilation. J. Clin. Monit. Comput. 18, 111–129. doi: 10.1023/B:JOCM.0000032744.99885.38
Tsai, N. C., and Lee, R. M. (2011). Interaction between cardiovascular system and respiration. Appl. Math. Model. 35, 5460–5469. doi: 10.1016/j.apm.2011.04.033
Turner, D. L. (1991). Cardiovascular and respiratory control mechanisms during exercise: an integrated view. J. Exp. Biol. 160, 309–340. doi: 10.1038/icb.1991.44
Turner, D. L., Bach, K. B., Martin, P. A., Olsen, E. B., Brownfield, M., Foley, K. T., et al. (1997). Modulation of ventilatory control during exercise. Respir. Physiol. 110, 277–285. doi: 10.1016/S0034-5687(97)00093-5
Wasserman, K., Whipp, B. J., and Casaburi, R. (2011). “Respiratory control during exercise,” in Comprehensive Physiology, ed D. M. Pollock (Hoboken, NJ: John Wiley & Sons Inc.), 595–619.
Whipp, B. J., and Ward, S. A. (1998). Determinants and control of breathing during muscular exercise. Br. J. Sports Med. 32, 199–211. doi: 10.1136/bjsm.32.3.199
Whipp, B. J., and Ward, S. A. (1991). “The coupling of ventilation to pulmonary gas exchange during exercise,” in Pulmonary Physiology and Pathophysiology of Exercise, eds B. J. Whipp and K. Wasserman (New York, NY: Marcel Dekker Inc.), 271–307.
Whipp, B. J., Ward, S. A., Lamarra, N., Davis, J. A., and Wasserman, K. (1982). Parameters of ventilatory and gas exchange dynamics during exercise. J. Appl. Physiol. 52, 1506–1513. doi: 10.1152/jappl.1982.52.6.1506
Williamson, J. W. (2010). The relevance of central command for the neural cardiovascular control of exercise. Exp. Physiol. 95, 1043–1048. doi: 10.1113/expphysiol.2009.051870
Keywords: respiratory system, dynamic modeling, exercise simulation, work of breathing, respiratory control, computational modeling
Citation: Serna LY, Mañanas MA, Hernández AM and Rabinovich RA (2018) An Improved Dynamic Model for the Respiratory Response to Exercise. Front. Physiol. 9:69. doi: 10.3389/fphys.2018.00069
Received: 15 September 2017; Accepted: 19 January 2018;
Published: 07 February 2018.
Edited by:
Joseph L. Greenstein, Johns Hopkins University, United StatesReviewed by:
Daniel B. Zoccal, Universidade Estadual Paulista Júlio de Mesquita Filho (UNESP), BrazilCopyright © 2018 Serna, Mañanas, Hernández and Rabinovich. This is an open-access article distributed under the terms of the Creative Commons Attribution License (CC BY). The use, distribution or reproduction in other forums is permitted, provided the original author(s) and the copyright owner are credited and that the original publication in this journal is cited, in accordance with accepted academic practice. No use, distribution or reproduction is permitted which does not comply with these terms.
*Correspondence: Leidy Y. Serna, leidy.yanet.serna@upc.edu
Disclaimer: All claims expressed in this article are solely those of the authors and do not necessarily represent those of their affiliated organizations, or those of the publisher, the editors and the reviewers. Any product that may be evaluated in this article or claim that may be made by its manufacturer is not guaranteed or endorsed by the publisher.
Research integrity at Frontiers
Learn more about the work of our research integrity team to safeguard the quality of each article we publish.