 Yinuo Liu
 Elke Albrecht
 Lisa Schering2
 Steffen Maak
- 1College of Animal Science, Jilin University, Changchun, China
- 2Institute of Muscle Biology and Growth, Leibniz Institute for Farm Animal Biology, Dummerstorf, Germany
- 3Institute for Genome Biology, Leibniz Institute for Farm Animal Biology, Dummerstorf, Germany
Transcriptome analyses of bovine muscle tissue differing in intramuscular fat (IMF) content identified agouti signaling protein (ASIP) as a promising candidate gene for fat deposition. The protein is secreted from adipocytes and may serve as a signaling molecule in cross-talk between adipocytes and muscle fibers or other cells. Known receptors for ASIP are the melanocortin receptors (e.g., MC4R) and attractin (ATRN). The present study was conducted to determine relationships between the expression of ASIP and its receptors in different bovine tissues with fat deposition. Adipose tissues, liver, and longissimus muscle tissue were collected from 246 F2-generation bulls (Charolais × Holstein cross) and gene expression was measured with RT-qPCR. During analysis of subcutaneous fat (SCF) of all bulls, 17 animals were identified with a transposon-derived transcript (Exon2C) inserted in the ASIP gene and dramatically increased ASIP mRNA levels. Significant correlations between normalized mRNA values of SCF and phenotypic traits related to fat deposition were found in bulls without Exon2C. Three retrospectively assigned groups [Exon2C, n = 17; high carcass fat (HCF), n = 20; low carcass fat (LCF), n = 20] were further analyzed to verify expression differences and elucidate molecular reasons. Expression of ASIP could be detected in isolated muscle fibers and adipocytes of Exon2C bulls in contrast to HCF and LCF bulls, indicating ectopic ASIP expression if the transposon is present. Among adipose tissues, highest ASIP mRNA levels were measured in SCF with significantly higher values in HCF compared to LCF bulls (1.6-fold, P < 0.05). However, the protein abundance was below the detection limit in all bulls. Potential ASIP receptors were detected in most investigated tissues. The expression of MC4R was higher and of ATRN was lower in several tissues of LCF compared to HCF bulls, whereas MC1R was not differentially expressed. Bulls of the Exon2C group had lower ATRN mRNA values than HCF and LCF bulls in perirenal fat (PF), but higher (P < 0.05) values in muscle. Receptors were also expressed in tissues where ASIP mRNA was not detected. Consequently, those tissues could be targets for ASIP if it circulates.
Introduction
Understanding molecular mechanisms that control body composition and meat quality is important to improve efficiency and sustainability of beef production. Muscle and fat are competitors for nutrients. Thus, the conversion of feed to muscle and fat determines the efficiency of meat production (Sillence, 2004). Different factors, such as breed, age, gender, and feed composition, but also circulating factors like hormones, are known to influence accretion of nutritional energy in the form of muscle or fat (Hocquette, 2010). Signaling molecules may be involved in the determination whether nutrients are converted to muscle mass or stored as fat and in recruitment of new cells for the adipose lineage. The current study focused on a particular adipokine the agouti signaling protein (ASIP) which has been associated with obesity and insulin resistance in studies in mice and humans (Yen et al., 1994; Smith et al., 2003). Former investigations of ASIP in cattle have mainly focused on coat color (Girardot et al., 2006). Since ASIP mRNA could also be detected in different tissues, including adipose tissue, a role outside melanogenesis was suggested (Sumida et al., 2004). Girardot et al. (2006) described a full-length long interspersed nuclear element (L1-BT, Exon2C) inserted in the ASIP gene which promotes overexpression of ASIP mRNA. This Exon2C was responsible for detection of ASIP as top candidate for intramuscular fat (IMF) deposition in a comparison of muscle transcriptomes of Japanese Black and Holstein steers (Albrecht et al., 2012). It is not clear whether this overexpression has an effect on fat deposition, but both breeds developed clearly different amounts of IMF under the same high energy feeding conditions established in Japan to maximize marbling (Albrecht et al., 2011b). The study of Sadkowski et al. (2014) identified also ASIP as top candidate for differential expressed genes in a three breed comparison with differences in IMF deposition. It can only be speculated that Exon2C was responsible for the large expression difference observed between Hereford and Limousin. Nevertheless, a recent study supports associations between ASIP and nutrient accretion in cattle (Kern et al., 2016). It was one of the highest regulated genes when comparing cattle differing in feed intake and daily gain, important parameters for efficiency of beef production. The expression of ASIP can possibly be influenced by feeding. A study in pigs showed increased ASIP expression in the group receiving a high-fat-diet (Zhao et al., 2015). Modulation of gene expression by nutritional intervention is the most acceptable way to control processes involved in body or muscle composition.
A prerequisite for the function of ASIP as a signaling molecule, with auto-, para- or endocrine effects, is the expression of respective receptors. Ollmann et al. (1998) have demonstrated that ASIP binds to the melanocortin receptor 1 (MC1R) competing with α-melanocyte stimulating hormone (α-MSH) influencing pigment production in melanocytes. Further members of the melanocortin receptor family (MC2R, MC4R) can also be targeted by ASIP (Yang et al., 1997). The MC4R is mainly expressed in hypothalamus but also in adipose tissue and is involved in appetite regulation (Adan et al., 2006). In cattle, a single nucleotide polymorphism was found in the MC4R gene strongly associated with backfat thickness and marbling (Liu et al., 2010). Polymorphisms in different melanocortin receptors were associated with adipose tissue accumulation, feed conversion and daily gain, thus influencing body composition in different species (reviewed by Switonski et al., 2013). Another receptor for ASIP with lower affinity was described by He et al. (2001), namely attractin (Atrn). Their study with transgenic mice suggested that interaction between Atrn and agouti is necessary for signaling through Mc1r and probably also through Mc4r. Furthermore, they demonstrated that the absence of Atrn suppressed agouti induced obesity. Associations between the ATRN gene and body weight and fatness in pigs were demonstrated by Kim et al. (2005).
The aim of the present study was to determine associations between gene expression of ASIP and its receptors in different tissues with fat deposition in bulls with similar genetic background and identical housing and feeding conditions. Bulls in this study originated from a F2-generation of an experimental Charolais × Holstein cross and varied in IMF content and body composition. Furthermore, potential auto- and paracrine effects of ASIP on bovine tissues were considered.
Materials and Methods
Animals and Sampling
Crossbred bulls (n = 246, F2-generation, Charolais × Holstein) were grown under standardized feeding and housing conditions and slaughtered in the abattoir of the Leibniz Institute for Farm Animal Biology at 18 months of age. Details of the experiment were described by Kuehn et al. (2002) and Widmann et al. (2015). Experimental procedures and animal care were carried out according to the guidelines of the German Law of Animal Protection. The protocols were approved by the Animal Protection Board of the Leibniz Institute for Farm Animal Biology as well as by the Animal Care Committee of the State Mecklenburg-Western Pomerania, Germany (State Office for Agriculture, Food Safety and Fishery; LALLF M-V/TSD/7221.3-2.1-010/03).
Carcass composition and meat quality traits were measured as described by Pfuhl et al. (2007) for bulls of the founder breeds of this F2-generation. Marbling traits were recorded as described by Albrecht et al. (2011b). Samples from subcutaneous fat (SCF), perirenal fat (PF), omental fat (OF), intestinal fat (IF), liver and M. longissimus dorsi (MLD) were collected immediately after slaughter, frozen in liquid nitrogen and stored at −80°C until further use. Two groups of animals (n = 20 each) were retrospectively assigned according to the accumulated amount of carcass fat as high (HCF; 94.2 ± 6.4 kg) and low carcass fat (LCF; 36.0 ± 6.4 kg) group for comparisons.
Isolation of DNA and RNA, cDNA Synthesis
Genomic DNA was isolated using standard procedures (phenol chloroform isopropanol precipitation with proteinase K treatment) from 30 mg liver tissues. The methods for RNA isolation from adipose tissues, muscle and liver followed standard protocols and are described in detail by Schering et al. (2017). The amount of total RNA was measured with a NanoDrop ND-1000 spectrophotometer (Peqlab, Erlangen, Germany) and the integrity of RNA was determined with an Experion Automated Electrophoresis System using the RNA StdSens analysis chip (Bio-Rad, Munich, Germany). The quality of RNA samples was considered sufficient if the RQI (RNA quality indicator) value was above 7. The iScript cDNA Synthesis Kit (Bio-Rad) was used to synthesize first strand cDNA from 100 ng total RNA of the respective tissue in 20 μl reaction volume according to manufacturer's instructions.
Qualitative Polymerase Chain Reaction (PCR)
Exon2C transcript of ASIP was detected in genomic DNA by standard PCR with specific primers (Table 1) according to Albrecht et al. (2012). The mRNA expression of ASIP in liver (primers in Table 2) was initially tested with a cDNA-PCR approach. Target sequences were amplified in a 10 μl reaction volume with 10 ng cDNA, 2 μM primer pairs, and PCR master mix (2×) (Fermentas, St. Leon-Rot, Germany) in a pecSTAR 96 universal thermocycler (Peqlab, Erlangen, Germany). The amplification started with an initial denaturation at 94°C for 4 min, followed by 35 cycles with 94°C for 30 s, a template specific annealing temperature for 1 min, 72°C for 1 min, and final step with 72°C for 7 min. The annealing temperatures are provided in Tables 1, 2. The PCR products were subjected to electrophoresis on 3.0% agarose gels containing Roti-GelStain (Carl Roth GmbH, Karlsruhe, Germany) and visualized under UV light (Quantum, Peqlab).
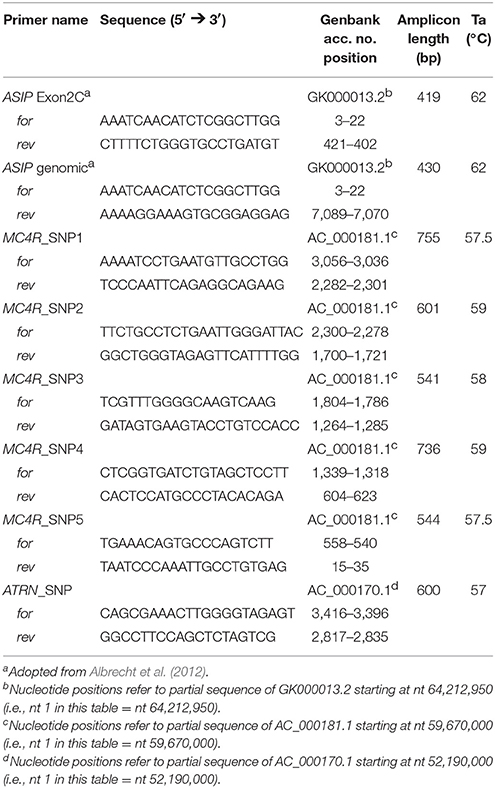
Table 1. Primer sequences for standard PCR.
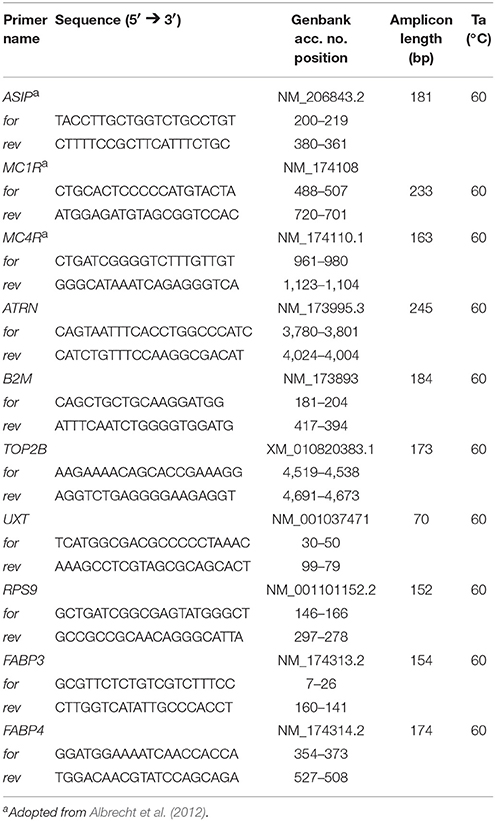
Table 2. Primer sequences used for RT-qPCR.
Quantitative PCR (qPCR)
Expression levels of investigated genes were analyzed by RT-qPCR (iCycler MyiQ 2 with iQ detection system, Bio-Rad) in duplicates as described by Schering et al. (2017). Briefly, 10 ng cDNA template, 2 μM of the respective forward and reverse primers, and 5 μl SYBR Green Supermix (Bio-Rad) were used in 10 μl reaction volumes. Primers (Table 2) were designed with Primer 3web (Version 4.0.0, http://primer3.ut.ee/) and synthesized by Sigma-Aldrich. Products were amplified after initial denaturation (95°C for 3 min) in 45 cycles (95°C for 10 s, 60°C for 30 s, 70°C for 45 s). The expression values for all tissues were normalized to each two reference genes: beta-2-microglobulin (B2M) and ubiquitously-expressed transcript (UXT) for adipose tissues; UXT and ribosomal protein S9 (RPS9) for liver tissue; topoisomerase II beta (TOP2B) and B2M for muscle tissue. Crossing point (CP) values were adapted manually in the iQ5 Software (Version 2.1.97.1001, Bio-Rad) to receive comparable values for the standard curves on each plate. Standard curves were generated to account for the efficiency of amplifications. They were calculated from serial dilutions (for ASIP: 1:1, 1:2, 1:5, 1:10, 1:20, for other genes: 1:1, 1:10, 1:50, 1:100, 1:500). Normalizations were calculated using the efficiency-corrected ΔΔCp method (Pfaffl et al., 2002). The significance of differences in two group comparisons was tested with the REST algorithm (Version 2.0.13, QIAGEN, Hilden, Germany). Normalized relative quantities (NRQ, Hellemans et al., 2007) were used if more than two groups were compared and for calculation of Pearson correlation coefficients to determine relationships between mRNA abundance and phenotypic traits.
Genotypes at the Bovine MC4R Locus and ATRN Locus
Standard PCR for MC4R and ATRN was performed with genomic DNA and specific primers (Table 1) in samples of HCF bulls (n = 20) and LCF bulls (n = 20). For primer pairs of MC4R, the PCR reaction system was as described above. In the PCR reaction system of ATRN, 5% DMSO was added to improve amplification because of the high GC content of the target sequence of ATRN. The amplicons were purified with the High Pure PCR Product Purification Kit (Roche Diagnostics, Mannheim, Germany). The PCR products were analyzed on an ABI PRISM 310 Genetic Analyzer (Applied Biosystems, Darmstadt, Germany). Sequences were analyzed with CLC Main Workbench (v. 7.7, CLCbio, Aarhus, Denmark).
Morphology of Adipocytes Within MLD and SCF
Sections of MLD and SCF were cut (12 and 20 μm thick, respectively) with a cryostat microtome (CM3050S, Leica, Germany) and stained with hematoxylin/eosin (H/E) using standard protocols. Adipocytes size was measured using the interactive measurement module of the Cell∧D image analysis software (OSIS, Münster, Germany) as described by Albrecht et al. (2011b). The image analysis system was equipped with a Jenaval microscope (Carl Zeiss, Jena, Germany) and an Altra20 CCD camera (OSIS, Münster, Germany). At least 200–300 adipocytes per sample were randomly selected and measured.
Collection of Muscle Fibers and Adipocytes by Laser Capture Microdissection (LCM)
The method for sampling muscle fibers and adipocytes from unstained, dehydrated cross-sections of MLD by LCM was described by Albrecht et al. (2011a). Briefly, MLD samples were cut into 12 μm thick serial sections with a cryostat microtome (CM3050S, Leica, Germany). Sections were transferred to a membrane slide (Palm, Bernried, Germany) and were shortly air-dried (10 s). Slides were placed successively in 96% and 2 × in 100% ethanol at room temperature for 30 s each and then in xylene for 5 min to dehydrate the tissue. Slides were finally air-dried under a fume hood for 5 min and were immediately used for sampling of muscle fibers or adipocytes with a Palm MicroBeam LCM device (Palm). About 600 muscle fibers and 300 adipocytes per sample were collected in adhesive caps (Palm) and lysed in buffer RLT (RNeasy Micro Kit, Qiagen). The lysates were stored at −80°C until further extraction of total RNA with the RNeasy Micro Kit (Qiagen). The total volume of RNA (14 μl) was used for cDNA synthesis using iScript cDNA Synthesis Kit (Bio-Rad).
Antibodies Against ASIP, MC1R, MC4R, AND ATRN, and Recombinant Protein
Antibodies against ASIP were produced by Novus Biologicals (NBP2-14323, Bio-Techne, Wiesbaden, Germany) and Cusabio (CSB-PA002212LA01HU, Biotrend, Cologne, Germany). Both antibodies are polyclonal rabbit anti-human ASIP, but were expected to cross-react with the bovine protein due to high sequence homology in the antigen region. The polyclonal antibodies against MC1R (ELA-ENT2673, Elabscience) and ATRN (BYT-ORB155769, Biorbyt) were also generated in rabbit and purchased from Biozol (Eching, Germany). The polyclonal rabbit anti-human MC4R antibody (ABIN2704972, Cohesion Bioscience) and the respective blocking peptide were purchased from antibodies-online (Aachen, Germany). Recombinant bovine ASIP from Cusabio (CSB-EP639982BO, Biotrend) was produced in E. coli with a his-sumo-tag and was used as positive control and for blocking of specific binding of the ASIP antibodies. Before using as a positive control in western blots, the tag was removed by incubation of the protein with sumo-protease (Invitrogen) according to manufacturer's instructions.
Western Blotting
Total protein was extracted from SCF, liver, and muscle tissue with CelLytic MT lyses reagent (Sigma-Aldrich, Munich, Germany) and protease inhibitor following manufacturer's instructions. Protein was mixed with loading buffer and denatured at 95°C for 5 min before loading on Criterion TGX 12% gel (Bio-Rad). Two molecular weight markers (PageRuler, Thermo Scientific; Triple Color Protein Standard III, SERVA) were used to determine the molecular weight of the protein bands. After electrophoresis, proteins were transferred to a polyvinylidene difluoride (PVDF) membrane (Tans-Blot Turbo transfer pack, Bio-Rad) with a semi dry blotter (Trans-Blot, Bio-Rad). Coomassie staining (Brilliant Blue R-250, Carl Roth) was performed to verify proper transfer of the protein to membranes. Membranes were blocked for 1 h with 5% non-fat dry milk or 10% Roti-Block (Carl Roth) in Tris-buffered saline (TBS). Then the membranes were incubated with primary antibodies (ASIP 1:5,000, MC1R and MC4R 1:2,000, ATRN 1:1,000) over night at 4°C. To test the specificity of ASIP antibody, recombinant protein was also prepared as a loading sample. Two parallel blots were incubated with the antibody or with the antibody blocked with the recombinant protein before incubation. Membranes were incubated with HRP conjugated Trueblot rabbit IgG (1:25,000; Biomol, Hamburg, Germany) secondary antibody. The antibody label was detected with highly sensitive chemiluminescence substrate (Super Signal West Femto Substrat, Thermo Scientific). Chemiluminescence was recorded with a Chemocam HR-16 imager (INTAS, Göttingen, Germany) and quantified with Labimage 1D software (Kapelan Bio-Imaging, Leipzig, Germany). Band intensities were normalized to total protein abundance in the respective lane measured in the Coomassie stained blot image (Figure S1).
Immunohistochemical Analysis
Different bovine tissues were cryo-sectioned (thickness liver: 10 μm; MLD: 12 μm; SCF 25 μm) using a Leica CM3050 S (Leica, Bensheim, Germany) cryostat microtome. Sections were air dried, fixed with 4% paraformaldehyde, and washed three times with PBS. Unspecific binding of the secondary antibody was blocked using 10 % goat serum in PBS for 15 min. Sections were incubated for 2 h at room temperature in a humidity chamber with the same primary antibodies as used for western blots, diluted 1:100 in PBS. Specific binding of primary antibody was detected with the respective goat anti rabbit IgG secondary antibody labeled with Alexa Fluor 488 (Molecular Probes, Eugene, USA). Nuclei were counterstained with 1 μg/ml Hoechst 33258 (Sigma-Aldrich, Munich, Germany). Slides were covered using ProLong Diamond Antifade Mountant (Thermo Scientific) and appropriate cover-slips. Negative controls were incubated either omitting the primary antibody or blocking the primary antibody with the respective peptide or recombinant protein. No unspecific binding of the secondary antibody, but some unspecific binding of the primary antibodies was detected. Immunofluorescence was visualized with a Nikon Microphot SA fluorescence microscope (Nikon, Duesseldorf, Germany) and an image analysis system equipped with CELL∧F software and a CC-12 high resolution color camera (OSIS, Muenster, Germany).
Statistical Analyses
Data were analyzed with SAS statistical software (Version 9.2, SAS Inst., Cary, USA). Pearson correlation coefficients using the CORR procedure in SAS were calculated to obtain relationships between gene expression and carcass traits. Phenotypic traits and NRQ values were analyzed with ANOVA with fixed factor group and Fishers test of Least Significant Differences. The mixed model was used to test the influence of sire line within each group. Neither significant influence of this effect nor of the group × sire line interaction effect could be detected. The NRQ values of ASIP in adipose tissues were analyzed with ANOVA using the MIXED procedure with fixed factor group and repeated factor tissue (with unstructured covariance structure) and group × tissue interaction. The Tukey-Kramer-correction was used to control the Family-wise Error Rate (referred to as Padj). Differences were considered as significant if Padj ≤ 0.05.
Results
Relationships Between Carcass Traits and ASIP Expression
Bulls of the F2-generation of a Charolais × Holstein cross were used in this study. They were comprehensively phenotyped and varied widely in body weight and composition. Despite of a similar genetic background and identical feeding and housing conditions, bulls accumulated variable amounts of fat in the carcass, in different fat depots, and within the muscle (Table 3). Thus, the material appears to be useful to investigate associations between the expression of ASIP and its receptors with body composition.
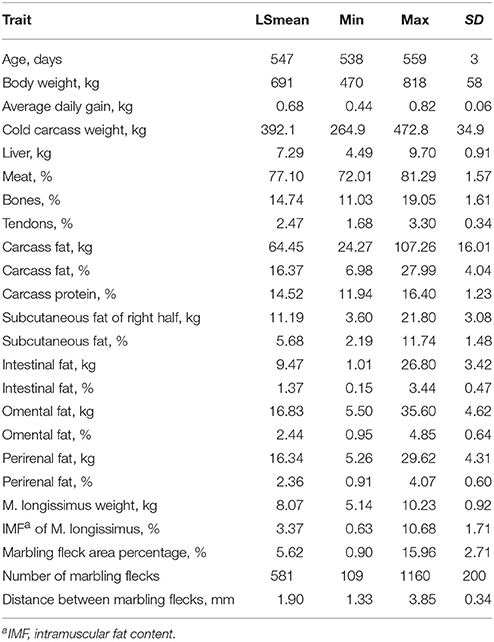
Table 3. Selected phenotypic traits of 246 F2-generation bulls (Charolais × Holstein cross) slaughtered at 18 months of age.
The mRNA abundance of ASIP was determined in SCF of all 246 bulls for correlations with carcass traits. A markedly increased amount of ASIP mRNA was observed in 17 of these bulls (Figure 1). Standard PCR test for existence of a transposon-derived transcript (Exon2C) as cause for ASIP overexpression confirmed that these 17 bulls were heterozygous for Exon2C (Figure S2). It could be verified that this transposon was introduced by one Charolais sire into our experimental population.
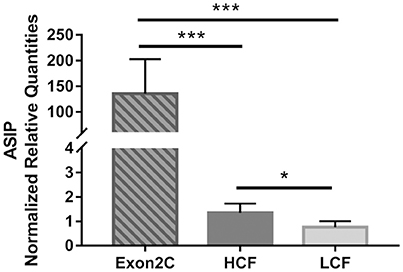
Figure 1. Normalized mRNA abundance of ASIP in subcutaneous fat of bulls from three groups (Exon2C, n = 17; HCF, n = 20; LCF, n = 20). Data are expressed as mean + SEM. *,*** Indicate significant differences with P < 0.05 and P < 0.001, respectively. HCF, high carcass fat; LCF, low carcass fat.
Further analyses were conducted in three retrospectively assigned groups of bulls. Two groups with highest or lowest amount of carcass fat were investigated as high carcass fat group (HCF) and low carcass fat group (LCF), respectively, to compare gene expression in different adipose tissues, liver, and muscle of bulls with maximum difference in body fat deposition. Since there is no report about effects of ASIP Exon2C on fat deposition in cattle, these bulls were separately analyzed as Exon2C group. None of the 17 bulls overexpressing ASIP (Exon2C group) belongs to the HCF or LCF group.
Correlation analysis between NRQ values of ASIP and carcass traits was conducted with 229 bulls without Exon2C to avoid bias caused by extremely high expression of ASIP in this group. Normalized mRNA values of SCF showed low but significant correlations with body weight, daily gain, liver weight, and fat deposition related traits (Table 4). However within the Exon2C group, associations between these traits were not detected.
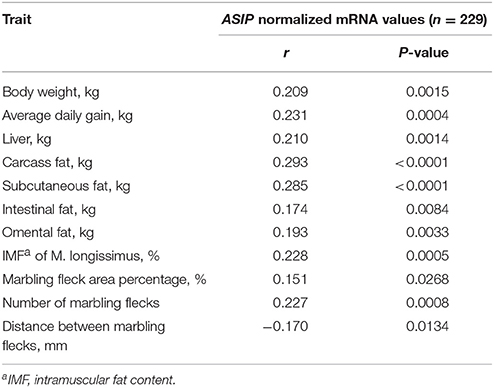
Table 4. Significant Pearson correlation coefficients between ASIP mRNA abundances (NRQ, normalized relative quantities) in subcutaneous fat and traits of F2-generation bulls at 18 months of age.
Next, the phenotypic traits and mRNA abundance of ASIP in different adipose tissues, liver, and muscle were determined for the three assigned groups of bulls (Figures 2, 3 and Table S1). All adipose tissues and the liver were heavier in bulls of the HCF group than in the LCF group (Figure 2A). Furthermore, bulls from the Exon2C group had more SCF, PF, OF, and heavier livers than the LCF group, whereas the weights of SCF, OF, and IF were lower than in the HCF group (Figure 2A). The size of intramuscular and subcutaneous adipocytes differed significantly between groups (Figure 2B). Bulls of the LCF group had smallest intramuscular adipocytes among groups and smaller (P < 0.001) subcutaneous adipocytes than HCF bulls (P = 0.016).
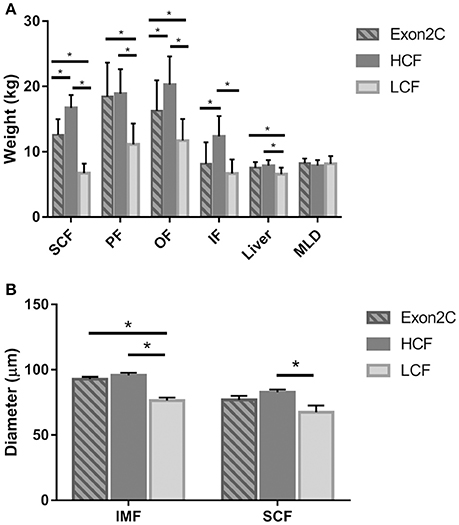
Figure 2. Weights of investigated tissues (A) and size of intramuscular and subcutaneous adipocytes (B) of bulls from three groups (Exon2C, n = 17; HCF, n = 20; LCF, n = 20). Data are expressed as mean + SEM. * Indicates significant differences with P < 0.05. HCF, high carcass fat; LCF, low carcass fat; SCF, subcutaneous fat; PF, perirenal fat; OF, omental fat; IF, intestinal fat; MLD, M. longissimus dorsi; IMF, intramuscular fat.
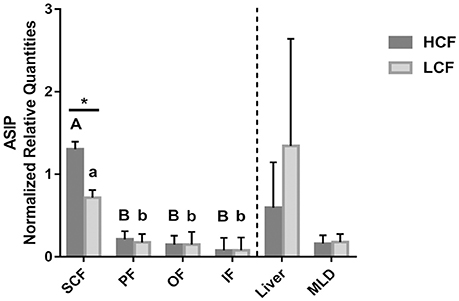
Figure 3. Abundance of ASIP mRNA in different adipose tissues, liver and muscle of HCF and LCF bulls (n = 20 each). Data are expressed as mean + SEM. * Indicates a significant difference between groups in SCF with P < 0.05; A, B indicate significant differences between adipose tissues within HCF bulls (P < 0.01). a, b indicate significant differences between adipose tissues within LCF bulls (P < 0.01). HCF, high carcass fat; LCF, low carcass fat; SCF, subcutaneous fat; PF, perirenal fat; OF, omental fat; IF, intestinal fat; MLD, M. longissimus dorsi.
The mRNA of ASIP was detected in muscle, liver, and adipose tissues of bulls of all three groups. Increased amounts of ASIP mRNA were observed in all investigated tissues in the Exon2C group (data not shown). All Exon2C bulls but only some of HCF and LCF bulls had measurable amounts of ASIP mRNA in liver (Figure S3), OF, and IF (liver: nHCF = 8, nLCF = 10; OF: nHCF = 14, nLCF = 7; IF: nHCF = 7, nLCF = 7). This indicates ectopic expression of ASIP if Exon2C is included.
Apart from the Exon2C group, a significant difference between HCF and LCF bulls for ASIP mRNA abundance was solely detected in SCF, with about 1.6-fold higher (P < 0.05) value in HCF bulls (Figure 3). Higher mRNA levels were measured in SCF compared to other adipose tissues in both groups of bulls (Figure 3). There was no difference in ASIP mRNA abundance between HCF and LCF bulls in liver and MLD tissue.
Expression of ASIP in Isolated Adipocytes and Muscle Fibers
To clarify whether the mRNA of ASIP is expressed in specific cell types of bovine muscle tissue, we collected muscle fibers and intramuscular fat cells separately from muscle tissue by laser capture microdissection (LCM). The expression of FABP3 and FABP4 was used as marker for the purity of the respective cell collections. As expected, FABP3 mRNA was exclusively expressed in muscle fibers and the mRNA of FABP4 could only be detected in adipocytes. The mRNA of ASIP was detected in adipocytes and muscle fibers if Exon2C was present (Table 5). However, ASIP mRNA was not detected in separated cells of a HCF or LCF bull (Table 5), despite expression in whole muscle tissue.
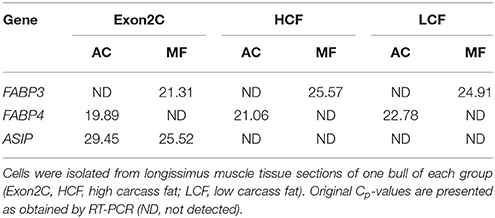
Table 5. Detection of mRNA of ASIP and cell type markers in laser microdissected adipocytes (AC) and muscle fibers (MF).
Receptor Expression
Expression of receptors for ASIP in different adipose tissues, muscle, and liver is a prerequisite for auto-, para-, and endocrine action of ASIP. Therefore, the mRNA of MC1R, MC4R, and ATRN was determined in these tissues. The MC1R mRNA could be detected in SCF, liver, and MLD, but was not differentially expressed among Exon2C, HCF, and LCF bulls (data not shown). In other investigated adipose tissues, MC1R mRNA was detected only in a few samples so that it was not possible to analyze those data statistically.
Differences in expression of the other two receptor genes could be observed between HCF and LCF bulls in several tissues. The expression level of MC4R was lower in PF and MLD of HCF compared to LCF bulls (Figure 4A). There was no difference between Exon2C and HCF or LCF bulls (P > 0.05). In SCF and MLD, the mRNA of MC4R was only detectable in a part of the bulls of three groups (SCF: nHCF = 9, nLCF = 9, nExon2C = 5; MLD: nHCF = 11, nLCF = 13, nExon2C = 10). The amount of ATRN mRNA in SCF and liver was higher (P < 0.05) in HCF compared to LCF bulls (Figure 4B). Bulls of the Exon2C group had lower ATRN mRNA values than HCF and LCF bulls in PF, whereas it was higher (P < 0.05) in muscle (Figure 4B). Moreover, LCF bulls had less (P < 0.05) ATRN mRNA than Exon2C and HCF bulls in liver (Figure 4B).
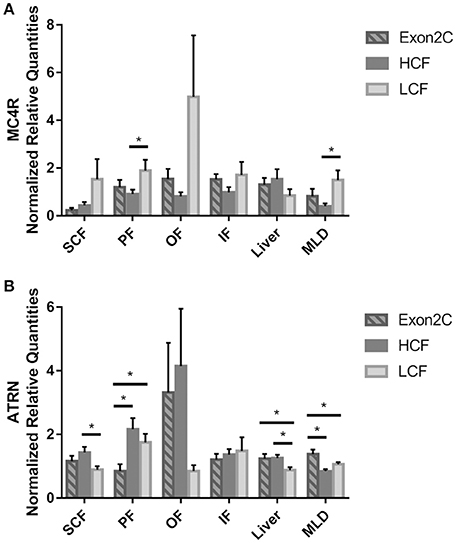
Figure 4. Abundances of MC4R (A) and ATRN (B) mRNA in different tissues of three groups of bulls (Exon2C, n = 17; HCF, n = 20; LCF, n = 20). Data are expressed as mean + SEM. * Indicates significant differences with P < 0.05. HCF, high carcass fat; LCF, low carcass fat; SCF, subcutaneous fat; PF, perirenal fat; OF, omental fat; IF, intestinal fat; MLD, M. longissimus dorsi.
Intramuscular adipocyte size and MC4R mRNA abundance in MLD were negatively correlated (r = −0.46, P < 0.001). However, correlations between adipocyte size in SCF and mRNA expression of ASIP or one of the receptors were not observed (P > 0.1).
SNPs as Possible Reason for Expression Differences
Bovine MC4R locus and ATRN locus were screened for SNPs, especially in regions with potential effects on gene expression. Screening of the bovine MC4R locus comprised 1100 base pairs (bp) 5′ of the transcription start, the complete coding region, and 700 bp 3′ of the stop codon. This gene has no intron. For the ATRN gene, 500 base pairs (bp) 5′ of the transcription start were sequenced. No SNP was detected in either regulatory region thus excluding effects of sequence variation within or close to the genes on expression differences.
The alignment however, revealed two SNPs (c. 1069 C>G and c. 1202 G>A) in the coding region of MC4R and one SNP (g.-236 G>C) upstream of the 5′ UTR of ATRN locus. The SNP c. 1069 C>G of MC4R has been described before, whereas the other SNPs, MC4R c. 1202 G>A and ATRN g.-236 G>C, are novel. Allele frequencies were not different between HCF and LCF groups in all SNPs.
Protein Abundance of ASIP and Its Receptors
Bovine ASIP contains 133 amino acids (UniProtKB entry: Q29414), and has 77% similarity with mouse ASIP and 75% with human ASIP. There are currently no experimentally derived data available on this protein in cattle. Commercial antibodies against human ASIP were tested for cross reactivity with bovine protein. The recombinant protein could be recognized by the antibody of Cusabio, but not by the antibody of Novus Biologicals. Specific bands were observed for recombinant ASIP with sumo tag at ~30 kDa and after removal of the tag at ~15 kDa (Figure 5, lanes 2–4), in accordance with the theoretical size. The band intensity corresponded to the protein amount in the respective lanes (Figure 5). However, a specific band for ASIP could not be detected in bovine plasma and tissue samples. There were only several unspecific bands, as confirmed by blocking of the antibody binding with recombinant protein before incubation. All bands in tissues and plasma were enhanced if specific binding of the primary antibody was inhibited, whereas the specific bands of recombinant protein disappeared (Figure 5). Protein abundance in bovine tissues is probably below the detection limit (< 12.5 ng), since there was no specific ASIP band observed; even in tissue of Exon2C bulls (data not shown). This indicates that overexpression of this specific ASIP transcript has no consequence for the protein abundance.
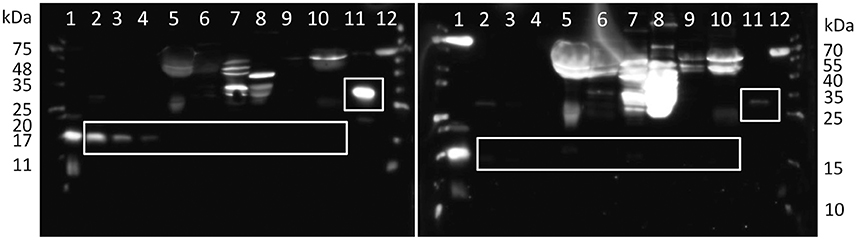
Figure 5. Western blot detection of bovine ASIP. White boxes indicate specific, blockable bands of recombinant ASIP and the respective size in tissues. The right panel was incubated with antibody previously blocked with the antigen peptide to determine unspecific bindings. Lanes 1 and 12: molecular weight markers, lanes 2–4: 50, 25, 12.5 ng recombinant bovine ASIP after tag removal in PBS, respectively, lanes 5–8: 50 μg of total protein from bovine albumin depleted plasma, subcutaneous fat (SCF), liver, M. longissimus dorsi, respectively, lane 9–10: 50 μg of total protein from bovine SCF and albumin depleted plasma, respectively, after deglycosylation, lane 11: 50 ng recombinant bovine ASIP with SUMO-tag.
Western blot analysis of MC4R revealed two bands in liver, one at ~25 kDa and the other at ~35 kDa, which corresponds to the theoretical size of MC4R. Both bands disappeared if the antibody was preincubated with the antigen peptide for blocking of specific bindings. However, only unspecific bands were observed in muscle and SCF of bulls (Figure S4), in contrast to mouse tissue. Quantification of MC4R protein abundance in liver revealed highest values for Exon2C bulls (P < 0.05, Figure 6). No differences between groups were observed, if only the band of ~35 kDa was analyzed.
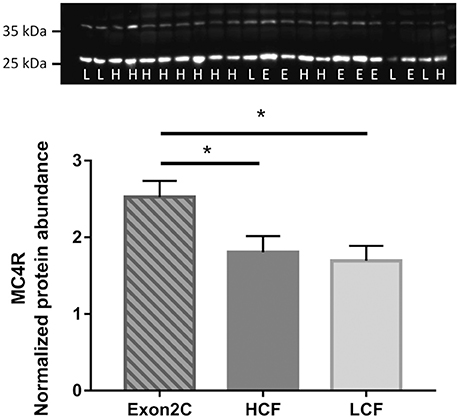
Figure 6. Quantification of MC4R protein abundance in liver of three groups of F2-generation bulls at 18 months of age (Exon2C, n = 17; HCF, n = 20; LCF, n = 20). A representative western blot image is shown above. H = HCF, high carcass fat; L = LCF, low carcass fat; E, Exon2C. * Indicates significant higher value in Exon2C bulls with P < 0.05.
The antibodies against MC1R and ATRN did not recognize specific bands at the theoretical size of the proteins in bovine samples. Therefore, quantification was not possible.
Protein Localization in Bovine Tissues
In muscle and SCF, ASIP was localized in or around adipocytes with immunohistochemistry (Figure 7). Muscle fibers were not stained for ASIP, not even in muscle tissue of Exon2C bulls (data not shown). Positive cells in the liver were probably stellate cells (Figure 7). The staining pattern in liver corresponded to the staining with the MC4R and ATRN antibodies (data not shown). The MC4R and ATRN were not detectable in muscle and SCF (data not shown). No specific signal could be observed in none of the tissues when using the antibody against MC1R (data not shown).
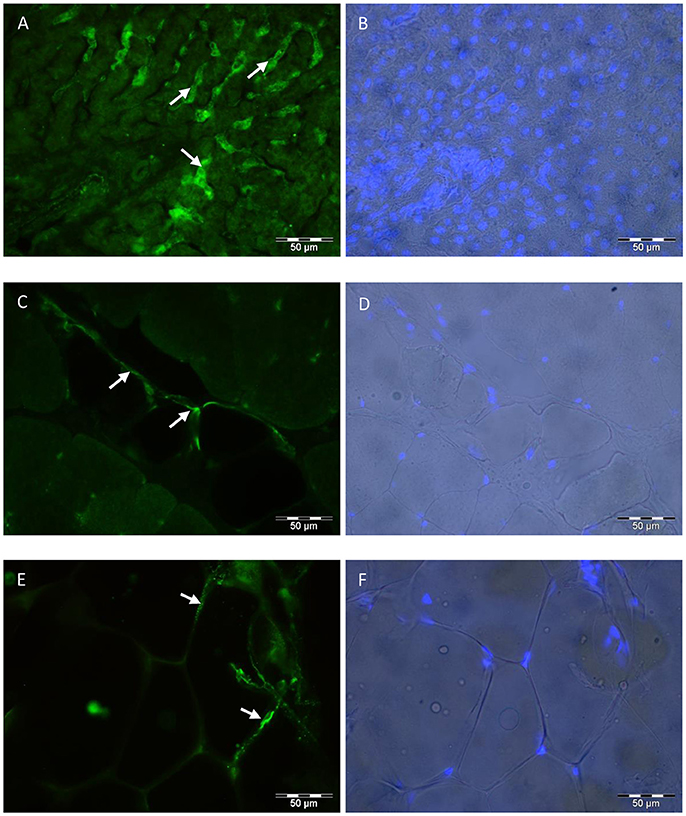
Figure 7. Localization of ASIP in bovine tissues. The polyclonal rabbit anti-ASIP antibody was detected with an Alexa Fluor 488 labeled goat anti rabbit IgG secondary antibody in bovine liver (A), MLD (C), and SCF (E). Nuclei were stained with Hoechst 33248 and overlaid to the brightfield image of liver (B), MLD (D), and SCF (F), respectively. Arrows indicate specific staining in stellate cells (A) or in and around adipocytes (C,E). SCF, subcutaneous fat; MLD, M. longissimus dorsi.
Discussion
The present study investigated whether ASIP and its receptors may be involved in variation of fat deposition within F2-generation bulls of a Charolais × Holstein cross kept under identical feeding and housing conditions. A group of 17 bulls was detected with ectopic expression of ASIP paralleled by the abundance of a full-length long interspersed nuclear element (LINE-1; L1-BT element; Exon2C) inserted in the ASIP gene. Such L1 elements are able to alter expression of affected genes in amount and splicing with possible consequences for the protein translation (Kines and Belancio, 2012). The L1 element in bovine ASIP (Exon2C) was first found in Normande and described by Girardot et al. (2006). We found in our former study with Japanese Black (JB), Holstein, and Charolais steers that this Exon2C was abundant in JB and sporadic in Charolais but not in Holstein (Albrecht et al., 2012). It could be confirmed in the current study that the 17 bulls overexpressing ASIP were heterozygous for Exon2C and all bulls belonged to the same sire line. This transposon caused ASIP mRNA overexpression in all investigated tissues of our F2-generation bulls. Furthermore, the expression of ASIP mRNA was detectable in both muscle and fat cells if Exon2C was present. However, consequences of ASIP overexpression on protein abundance or localization could not be detected by western blot or immunohistochemistry, respectively. The protein abundance was below the detection limit of the western blot even in these bulls. Further studies are necessary to clarify whether overexpression leads to increased translation into protein.
In lethal yellow (Ay) mouse, a mutation in a non-coding exon of agouti gene caused overexpression of Asip mRNA and protein (Bultman et al., 1992). Beside yellow hair, those Ay mice have an obesity phenotype, in contrast to wildtype animals. Human ASIP polymorphisms in a non-coding region, which can cause ASIP overexpression like in mice and bovine, have not been reported yet. Overexpression of ASIP, as observed in bulls of the Exon2C group of our study, did not cause ectopic fat accretion. Bulls of the Exon2C group stored more fat in SCF, PF, and OF than LCF bulls, but not more than bulls of the HCF group. The inconsistency between ASIP mRNA and protein level can give rise to this phenomenon. Moreover, compared to Ay mice, there could be an alternative regulation mechanism on ASIP expression in cattle with Exon2C transcript. Sadkowski et al. (2014) reported 32.6-fold and 2.2-fold higher ASIP expression levels in Hereford bulls and Holstein-Friesian bulls (marbled meat) compared to Limousin bulls (lean meat), respectively. It should be considered that this transposon could also be involved in extremely high expression of ASIP in Hereford bulls.
Agouti is normally expressed in hair follicles and testis during different life periods in wild mouse (Bultman et al., 1992). In humans, ASIP is widely expressed in tissues, including adipose tissue, skin, heart, testis, ovary, and at lower levels in liver and kidney (Wilson et al., 1995). Cattle show the similar expression pattern of ASIP like human. Several studies detected ASIP mRNA in adipose tissue, M. longissimus, skin, heart, testes, ovary, and kidney in bovine (Sumida et al., 2004; Girardot et al., 2006; Graphodatskaya et al., 2006; Albrecht et al., 2012). The current study tested the expression level of ASIP mRNA in SCF, PF, OF, IF, MLD, and liver of F2-generation bulls and found that ASIP was stably expressed in SCF, PF, MLD, whereas it was not ubiquitously expressed in all OF, IF, and liver samples. Furthermore, among investigated adipose tissues, the mRNA level of ASIP was significantly higher in SCF. This may indicate that compared to other adipose tissues, SCF could contribute significantly to secreted and probably circulating amount of ASIP in bovine.
Irrespective of Exon2C bulls, there was a low, positive correlation between ASIP mRNA abundance of SCF and fat related traits in our F2-generation bulls. The expression level of ASIP was significantly higher in HCF bulls compared to LCF bulls. Similar associations were described between ASIP expression and body composition in human. Norman et al. (1998) reported ASIP as one of the candidate genes which show the linkage to obesity and energy metabolism in Pima Indians. Voisey et al. (2002) found that there was a negative correlation in men, whereas a positive relationship in women between ASIP mRNA level and body mass index. Similarly with our western blot result in bovine plasma, ASIP could not be detected in serum derived from obese and lean men and women (Voisey et al., 2002). Voisey et al. (2002) suggested that there is no ASIP circulating in human and ASIP could only act within adipose tissue. However, own RNA-sequencing data in cattle of the same experiment (not shown) and data from human adipose tissue (Xue and Zemel, 2000) suggest that ASIP is a low abundance protein also in bovine. If similar amounts of the protein are present in bovine SCF as measured and described by Xue and Zemel (2000), about 1 ng ASIP can be expected per lane in our western blot. This is below the detection limit, as indicated by the dilution series of recombinant protein (Figure 5). However, it could still circulate in hormone like concentrations and act systemically in bovine and human. Xue and Zemel (2000) demonstrated a positive relationship between ASIP protein abundance and fatty acid synthase activity in human adipose tissue and concluded that ASIP can modulate the lipid metabolism of adipocytes. Protein localization in lipid storing stellate cells in liver, with low or without measurable mRNA expression, and in adipocytes suggests, in concordance with the correlation analysis between ASIP mRNA level and fat related traits, that ASIP may have effects on adipocytes and fat deposition also in cattle.
Similar to our former study (Albrecht et al., 2012), ASIP was localized in adipocytes and liver cells, but in contrast to that study, it was not localized in nuclei of different cell types. Different antibodies were used in these studies and both were able to detect recombinant bovine ASIP, as shown in western blots, but differed obviously in their cross reactivity leading to different staining patterns. Therefore, only those results which agree between both antibodies were seen as reliable, like localization in and around adipocytes, and in stellate cells in the liver.
As prerequisite for peripheral effects of ASIP, the expression of potential ASIP receptors, MC1R, MC4R, and ATRN was investigated in F2-generation bulls. It was reported that ASIP is a potential antagonist of the MC1R and MC4R (Lu et al., 1994; Yang et al., 1997) and binds to ATRN with lower affinity (He et al., 2001). The expression of MC1R and MC4R in bovine SCF corresponds to observations in human (Hoch et al., 2007), but differs from mice, where Mc1r is usually expressed in skin and Mc4r in brain (Mountjoy et al., 1992; Gantz et al., 1993; Wilson et al., 1999). This may suggest a similar function of MC1R and MC4R in bovine and human. Tissue specific effects of secreted ASIP in cattle are supported by the observation that MC1R was only steadily expressed in SCF, liver, and MLD, whereas the mRNA of MC4R could be stably detected in PF, OF, IF, and liver. Furthermore, the ubiquitous expression of ATRN in bovine tissues was firstly reported, in consistence with the expression of ATRN in numerous tissues in mice and human (Nagle et al., 1999; Tang et al., 2000).
Liver is an important organ with function in energy metabolism, but also in regulation of adiposity and body weight (Fam et al., 2012). Graphodatskaya et al. (2006) found that ASIP was not expressed in bovine liver, whereas Girardot et al. (2005) detected a weak band of ASIP mRNA by northern blot. Our results show that ASIP mRNA cannot always be detected in liver of HCF or LCF bulls, but was highly expressed in Exon2C bulls due to the L1-BT element. However, the potential receptors were expressed in liver of all three groups of bulls. This indicates that liver may be one of the target organs for ASIP if the protein circulates in low concentrations like some hormones. Further research is necessary to elucidate whether ASIP circulates, with more sensitive methods, and whether it can affect the fat metabolism in bovine liver. Expression differences of ASIP receptors, as shown for MC4R and ATRN in several tissues, may also be involved. Observed expression differences were not caused by SNPs in the promotor regions of the receptor genes. Sequence analysis of the potential promotor region of MC4R demonstrated no difference between HCF and LCF bulls. One coding SNP (c. 1069 C>G) in MC4R with known association to back fat thickness, marbling, and carcass weight in cattle (Huang et al., 2010; Liu et al., 2010; Seong et al., 2012) and a novel SNP (c. 1202 G>A) were identified, but allele frequencies were not different between HCF and LCF bulls. Moreover, a new SNP (g. −236 G>C) for ATRN located in the potential promotor region was verified. But it still cannot explain the expression difference between HCF and LCF bulls, as there was no obvious relationship between the SNP and carcass fat traits in our population.
The expression level of ASIP and ATRN showed a positive correlation, whereas MC4R exhibited a negative correlation with fat deposition in F2-generation bulls of our study. This is in concordance with studies in mice and human. You et al. (2016) reported increased body weight and white adipose tissue mass for the Mc4r KO mice. Furthermore, Møller et al. (2015) demonstrated that the agonist of MC4R can lead to a significant stimulation of lipolysis in white adipose tissue of human. Agouti signaling protein has been identified as an antagonist to melanocortin receptors (Willard et al., 1995). When the C-terminus of ASIP binds to MC1R or MC4R, it can lead to an inhibition of cAMP accumulation in the cells (Chai et al., 2003). Furthermore, ATRN can interact with the N-terminus of ASIP, which initiates receptor trafficking to the lysosome and results in the degradation of melanocortin receptors (Overton and Leibel, 2011). Overton and Leibel (2011) demonstrated that knockdown of Atrn caused an increased level of MC4R at the cell surface. This suggests that with a certain extracellular concentration of ASIP, a higher cell surface level of ATRN can promote the degradation of melanocortin receptors, which indirectly influences the intracellular cAMP level. It is well known that cAMP plays an important role in lipolysis in adipose tissue and energy metabolism in liver and muscle (Madsen and Kristiansen, 2010; Ravnskjaer et al., 2016). Studies demonstrated elevated cAMP levels in several genetically modified animal models, which led to an increase of lipolysis (Choi et al., 2006; Pagnon et al., 2012). In liver and muscle, the increase of the cAMP level promotes energy metabolism, such as glycogenolysis (Studer and Borle, 1982; Ezrailson et al., 1983). However, it still needs to be further investigated whether the interaction between ASIP and its receptors can exert influence on fat deposition and distribution in cattle through a cAMP dependent or independent mechanism.
Conclusion
The study confirmed associations between ASIP expression and fat deposition in cattle. Overexpression of ASIP in 17 out of 246 F2-generation bulls was paralleled by the abundance of a transposon-derived transcript, named Exon2C. This insertion in the ASIP locus led to an ectopic expression of ASIP in tissues and cells where it is usually not detectable. However, consequences of the overexpression for protein abundance or fat deposition could not be detected with the applied methods.
In contrast to Exon2C bulls, ASIP cannot always be detected in liver, OF, and IF of other bulls, whereas potential receptors like MC4R and ATRN are expressed in these tissues. This suggests that liver and adipose tissues could be important target organs for ASIP in bovine if the protein is secreted and circulates in low concentrations like some hormones. Receptors for ASIP could have a major function, because the expression levels were significantly different in several tissues between HCF and LCF bulls. In summary, the results indicate that ASIP and ATRN may have a positive effect and MC4R a negative effect on fat deposition in bovine.
Author Contributions
YL performed most experiments and analyses, and drafted the manuscript. EA designed and performed parts of the experiments and analyses, helped to draft the manuscript and revised it. LS performed experiments and revised the manuscript. CK provided and analyzed data, and revised the manuscript. RY and ZZ supervised parts of the work and revised the manuscript. SM designed and supervised the work, revised the manuscript. All authors approved the final version of the manuscript.
Conflict of Interest Statement
The authors declare that the research was conducted in the absence of any commercial or financial relationships that could be construed as a potential conflict of interest.
Acknowledgments
YL was funded by a China Scholarship Council (CSC) grant (No. 201406170161) and by a grant of the H. Wilhelm Schaumann Foundation. The publication of this article was funded by the Open Access Fund of the Leibniz Institute for Farm Animal Biology (FBN). We thank E. Schwitulla, F. Feldt, S. Foss, and M. Fuchs for excellent technical assistance and Dr. R. Pfuhl and his team of the experimental slaughterhouse for dissection and chemical analysis of the animals.
Supplementary Material
The Supplementary Material for this article can be found online at: https://www.frontiersin.org/articles/10.3389/fphys.2018.00172/full#supplementary-material
Abbreviations
α-MSH, α-melanocyte stimulating hormone; ASIP, agouti signaling protein; ATRN, attractin; HCF, high carcass fat; IF, intestinal fat; IMF, intramuscular fat; LCF, low carcass fat; MC1R, melanocortin receptor 1; MC4R, melanocortin receptor 4; MLD, musculus longissimus dorsi; OF, omental fat; PCR, polymerase chain reaction; PF, perirenal fat; qPCR, quantitative polymerase chain reaction; SCF, subcutaneous fat.
References
Adan, R. A., Tiesjema, B., Hillebrand, J. J., la Fleur, S. E., Kas, M. J., and Krom, M. (2006). The MC4 receptor and control of appetite. Brit. J. Pharmacol. 149, 815–827. doi: 10.1038/sj.bjp.0706929
Albrecht, E., Gotoh, T., Ebara, F., Wegner, J., and Maak, S. (2011a). Technical note: determination of cell-specific gene expression in bovine skeletal muscle tissue using laser microdissection and reverse-transcription quantitative polymerase chain reaction. J. Anim. Sci. 89, 4339–4343. doi: 10.2527/jas.2011-4039
Albrecht, E., Gotoh, T., Ebara, F., Xu, J. X., Viergutz, T., Nürnberg, G., et al. (2011b). Cellular conditions for intramuscular fat deposition in Japanese Black and Holstein steers. Meat Sci. 89, 13–20. doi: 10.1016/j.meatsci.2011.03.012
Albrecht, E., Komolka, K., Kuzinski, J., and Maak, S. (2012). Agouti revisited: transcript quantification of the ASIP gene in bovine tissues related to protein expression and localization. PLoS ONE 7:e35282. doi: 10.1371/journal.pone.0035282
Bultman, S. J., Michaud, E. J., and Woychik, R. P. (1992). Molecular characterization of the mouse agouti locus. Cell 71, 1195–1204. doi: 10.1016/S0092-8674(05)80067-4
Chai, B. X., Neubig, R. R., Millhauser, G. L., Thompson, D. A., Jackson, P. J., Barsh, G. S., et al. (2003). Inverse agonist activity of agouti and agouti-related protein. Peptides 24, 603–609. doi: 10.1016/S0196-9781(03)00104-9
Choi, Y. H., Park, S., Hockman, S., Zmuda-Trzebiatowska, E., Svennelid, F., Haluzik, M., et al. (2006). Alterations in regulation of energy homeostasis in cyclic nucleotide phosphodiesterase 3B-null mice. J. Clin. Inv. 116, 3240–3251. doi: 10.1172/JCI24867
Ezrailson, E. G., Entman, M. L., and Garber, A. J. (1983). Adrenergic and serotonergic regulation of skeletal muscle metabolism in rat. I. The effects of adrenergic and serotonergic antagonists on the regulation of muscle amino acid release, glycogenolysis, and cyclic nucleotide levels. J. Biol. Chem. 258, 12494–12498.
Fam, B. C., Joannides, C. N., and Andrikopoulos, S. (2012). The liver: key in regulating appetite and body weight. Adipocyte 1, 259–264. doi: 10.4161/adip.21448
Gantz, I., Miwa, H., Konda, Y., Shimoto, Y., Tashiro, T., Watson, S. J., et al. (1993). Molecular cloning, expression, and gene localization of a fourth melanocortin receptor. J. Biol. Chem. 268, 15174–15179.
Girardot, M., Guibert, S., Laforet, M. P., Gallard, Y., Larroque, H., and Oulmouden, A. (2006). The insertion of a full-length Bos taurus LINE element is responsible for a transcriptional deregulation of the Normande Agouti gene. Pigment Cell Res. 19, 346–355. doi: 10.1111/j.1600-0749.2006.00312.x
Girardot, M., Martin, J., Guibert, S., Leveziel, H., Julien, R., and Oulmouden, A. (2005). Widespread expression of the bovine Agouti gene results from at least three alternative promoters. Pigment Cell Res. 18, 34–41. doi: 10.1111/j.1600-0749.2004.00195.x
Graphodatskaya, D., Joerg, H., Asai-Coakwell, M., Janett, F., and Stranzinger, G. (2006). Expression and function of agouti signaling protein in cattle. Anim. Sci. J. 77, 33–41. doi: 10.1111/j.1740-0929.2006.00317.x
He, L., Gunn, T. M., Bouley, D. M., Lu, X. Y., Watson, S. J., Schlossman, S. F., et al. (2001). A biochemical function for attractin in agouti-induced pigmentation and obesity. Nat. Gen. 27, 40–47. doi: 10.1038/83741
Hellemans, J., Mortier, G., De Paepe, A., Speleman, F., and Vandesompele, J. (2007). qBase relative quantification framework and software for management and automated analysis of real-time quantitative PCR data. Genome Biol. 8:R19. doi: 10.1186/gb-2007-8-2-r19
Hoch, M., Eberle, A. N., Wagner, U., Bussmann, C., Peters, T., and Peterli, R. (2007). Expression and localization of melanocortin-1 receptor in human adipose tissues of severely obese patients. Obesity 15, 40–49. doi: 10.1038/oby.2007.525
Hocquette, J. F. (2010). Endocrine and metabolic regulation of muscle growth and body composition in cattle. Animal 4, 1797–1809. doi: 10.1017/S1751731110001448
Huang, M., Gao, X., Li, J. Y., Ren, H. Y., Chen, J. B., and Xu, S. Z. (2010). Polymorphisms in MC4R gene and correlations with economic traits in cattle. Mol. Biol. Rep. 37, 3941–3944. doi: 10.1007/s11033-010-0051-0
Kern, R. J., Lindholm-Perry, A. K., Freetly, H. C., Snelling, W. M., Kern, J. W., Keele, J. W., et al. (2016). Transcriptome differences in the rumen of beef steers with variation in feed intake and gain. Gene 586, 12–26. doi: 10.1016/j.gene.2016.03.034
Kim, J. B., Zeng, Z. X., Nam, Y. J., Kim, Y., Yang, S. L., Wu, X., et al. (2005). Association of mahogany/attractin gene (ATRN) with porcine growth and fat. Asian-Aust. J. Anim. Sci. 18, 1383–1386. doi: 10.5713/ajas.2005.1383
Kines, K. J., and Belancio, V. P. (2012). Expressing genes do not forget their LINEs: transposable elements and gene expression. Front. Biosci. 17, 1329–1344. doi: 10.2741/3990
Kuehn, C., Bellmann, O., Voigt, J., Wegner, J., Guiard, V., and Ender, K. (2002). An experimental approach for studying the genetic and physiological background of nutrient transformation in cattle with respect to nutrient secretion and accretion type. Arch. Tierz. 45, 317–330. doi: 10.5194/aab-45-317-2002
Liu, H., Tian, W., Zan, L., Wang, H., and Cui, H. (2010). Mutations of MC4R gene and its association with economic traits in Qinchuan cattle. Mol. Biol. Rep. 37, 535–540. doi: 10.1007/s11033-009-9706-0
Lu, D., Willard, D., Patel, I. R., Kadwell, S., Overton, L., Kost, T., et al. (1994). Agouti protein is an antagonist of the melanocyte-stimulating-hormone receptor. Nature 371, 799–802. doi: 10.1038/371799a0
Madsen, L., and Kristiansen, K. (2010). The importance of dietary modulation of cAMP and insulin signaling in adipose tissue and the development of obesity. Ann. N.Y. Acad. Sci. 1190, 1–14. doi: 10.1111/j.1749-6632.2009.05262.x
Møller, C. L., Pedersen, S. B., Richelsen, B., Conde-Frieboes, K. W., Raun, K., Grove, K. L., et al. (2015). Melanocortin agonists stimulate lipolysis in human adipose tissue explants but not in adipocytes. BMC Res. Notes 8:559. doi: 10.1186/s13104-015-1539-4
Mountjoy, K. G., Robbins, L. S., Mortrud, M. T., and Cone, R. D. (1992). The cloning of a family of genes that encode the melanocortin receptors. Science 257, 1248–1251. doi: 10.1126/science.1325670
Nagle, D. L., McGrail, S. H., Vitale, J., Woolf, E. A., Dussault, B. J., DiRocco, L., et al. (1999). The mahogany protein is a receptor involved in suppression of obesity. Nature 398, 148–152. doi: 10.1038/18210
Norman, R. A., Tataranni, P. A., Pratley, R., Thompson, D. B., Hanson, R. L., Prochazka, M., et al. (1998). Autosomal genomic scan for loci linked to obesity and energy metabolism in Pima Indians. Am. J. Hum. Gen. 62, 659–668. doi: 10.1086/301758
Ollmann, M. M., Lamoreux, M. L., Wilson, B. D., and Barsh, G. S. (1998). Interaction of Agouti protein with the melanocortin 1 receptor in vitro and in vivo. Genes Dev. 12, 316–330. doi: 10.1101/gad.12.3.316
Overton, J. D., and Leibel, R. L. (2011). Mahoganoid and mahogany mutations rectify the obesity of the yellow mouse by effects on endosomal traffic of MC4R protein. J. Biol. Chem. 286, 18914–18929. doi: 10.1074/jbc.M111.224592
Pagnon, J., Matzaris, M., Stark, R., Meex, R. C., Macaulay, S. L., Brown, W., et al. (2012). Identification and functional characterization of protein kinase A phosphorylation sites in the major lipolytic protein, adipose triglyceride lipase. Endocrinol. 153, 4278–4289. doi: 10.1210/en.2012-1127
Pfaffl, M. W., Horgan, G. W., and Dempfle, L. (2002). Relative expression software tool (REST) for group-wise comparison and statistical analysis of relative expression results in real-time PCR. Nucleic Acids Res. 30:e36. doi: 10.1093/nar/30.9.e36
Pfuhl, R., Bellmann, O., Kuehn, C., Teuscher, F., Ender, K., and Wegner, J. (2007). Beef versus dairy cattle: a comparison of feed conversion, carcass composition, and meat quality. Arch. Tierz. 50, 59–70. doi: 10.5194/aab-50-59-2007
Ravnskjaer, K., Madiraju, A., and Montminy, M. (2016). “Role of the cAMP pathway in glucose and lipid metabolism,” in Metabolic Control. Handbook of Experimental Pharmacology, Vol. 233, ed S. Herzig (Cham: Springer), 233, 29–49. doi: 10.1007/164_2015_32
Sadkowski, T., Ciecierska, A., Majewska, A., Oprzadek, J., Dasiewicz, K., Ollik, M., et al. (2014). Transcriptional background of beef marbling - novel genes implicated in intramuscular fat deposition. Meat Sci. 97, 32–41. doi: 10.1016/j.meatsci.2013.12.017
Schering, L., Albrecht, E., Komolka, K., Kuehn, C., and Maak, S. (2017). Increased expression of thyroid hormone responsive protein (THRSP) is the result but not the cause of higher intramuscular fat content in cattle. Int. J. Biol. Sci. 13, 532–544. doi: 10.7150/ijbs.18775
Seong, J., Suh, D. S., Park, K. D., Lee, H. K., and Kong, H. S. (2012). Identification and analysis of MC4R polymorphisms and their association with economic traits of Korean cattle (Hanwoo). Mol. Biol. Rep. 39, 3597–3601. doi: 10.1007/s11033-011-1133-3
Sillence, M. N. (2004). Technologies for the control of fat and lean deposition in livestock. Vet. J. 167, 242–257. doi: 10.1016/j.tvjl.2003.10.020
Smith, S. R., Gawronska-Kozak, B., Janderová, L., Nguyen, T., Murrell, A., Stephens, J. M., et al. (2003). Agouti expression in human adipose tissue. Diabetes 52, 2914–2922. doi: 10.2337/diabetes.52.12.2914
Studer, R. K., and Borle, A. B. (1982). Differences between male and female rats in the regulation of hepatic glycogenolysis. The relative role of calcium and cAMP in phosphorylase activation by catecholamines. J. Biol. Chem. 257, 7987–7993.
Sumida, T., Hino, N., Kawachi, H., Matsui, T., and Yano, H. (2004). Expression of agouti gene in bovine adipocytes. Anim. Sci. J. 75, 49–51. doi: 10.1111/j.1740-0929.2004.00154.x
Switonski, M., Mankowska, M., and Salamon, S. (2013). Family of melanocortin receptor (MCR) genes in mammals: mutations, polymorphisms and phenotypic effects. J. Appl. Genetics 54, 461–472. doi: 10.1007/s13353-013-0163-z
Tang, W., Gunn, T. M., McLaughlin, D. F., Barsh, G. S., Schlossman, S. F., and Duke-Cohan, J. S. (2000). Secreted and membrane attractin result from alternative splicing of the human ATRN gene. Proc. Nat. Acad. Sci. U.S.A. 97, 6025–6030. doi: 10.1073/pnas.110139897
Voisey, J., Imbeault, P., Hutley, L., Prins, J. B., and Daal, A. (2002). Body mass index-related human adipocyte agouti expression is sex-specific but not depot-specific. Obesity 10, 447–452. doi: 10.1038/oby.2002.62
Widmann, P., Reverter, A., Weikard, R., Suhre, K., Hammon, H. M., Albrecht, E., et al. (2015). Systems biology analysis merging phenotype, metabolomic and genomic data identifies Non-SMC Condensin I Complex, Subunit G (NCAPG) and cellular maintenance processes as major contributors to genetic variability in bovine feed efficiency. PLoS ONE 10:e0124574. doi: 10.1371/journal.pone.0124574
Willard, D. H., Bodnar, W., Harris, C., Kiefer, L., Nichols, J. S., Blanchard, S., et al. (1995). Agouti structure and function: characterization of a potent alpha.-melanocyte stimulating hormone receptor antagonist. Biochemistry 34, 12341–12346. doi: 10.1021/bi00038a030
Wilson, B. D., Ollmann, M. M., and Barsh, G. S. (1999). The role of agouti-related protein in regulating body weight. Mol. Med. Today 5, 250–256. doi: 10.1016/S1357-4310(99)01471-9
Wilson, B. D., Ollmann, M. M., Kang, L., Stoffel, M., Bell, G. I., and Barsh, G. S. (1995). Structure and function of ASP, the human homolog of the mouse agouti gene. Hum. Mol. Genet. 4, 223–230. doi: 10.1093/hmg/4.2.223
Xue, B., and Zemel, M. B. (2000). Relationship between human adipose tissue agouti and fatty acid synthase (FAS). J. Nutr. 130, 2478–2481. doi: 10.1093/jn/130.10.2478
Yang, Y. K., Ollmann, M. M., Wilson, B. D., Dickinson, C., Yamada, T., Barsh, G. S., et al. (1997). Effects of recombinant agouti-signaling protein on melanocortin action. Mol. Endocrinol. 11, 274–280. doi: 10.1210/mend.11.3.9898
Yen, T. T., Gill, A. M., Frigeri, L. G., Barsh, G. S., and Wolff, G. L. (1994). Obesity, diabetes, and neoplasia in yellow A (vy)/-mice: ectopic expression of the agouti gene. FASEB J. 8, 479–488. doi: 10.1096/fasebj.8.8.8181666
You, P., Hu, H., Chen, Y., Zhao, Y., Yang, Y., Wang, T., et al. (2016). Effects of melanocortin 3 and 4 receptor deficiency on energy homeostasis in rats. Sci. Rep. 6:34938. doi: 10.1038/srep34938
Keywords: adipokine, agouti signaling protein, melanocortin receptor, attractin, bovine, body composition, fat deposition
Citation: Liu Y, Albrecht E, Schering L, Kuehn C, Yang R, Zhao Z and Maak S (2018) Agouti Signaling Protein and Its Receptors as Potential Molecular Markers for Intramuscular and Body Fat Deposition in Cattle. Front. Physiol. 9:172. doi: 10.3389/fphys.2018.00172
Received: 18 December 2017; Accepted: 20 February 2018;
Published: 06 March 2018.
Edited by:
Pushpendra Singh, School of Medicine, Johns Hopkins University, United StatesReviewed by:
J. Kalervo Hiltunen, University of Oulu, FinlandDaniele Vergara, University of Salento, Italy
Copyright © 2018 Liu, Albrecht, Schering, Kuehn, Yang, Zhao and Maak. This is an open-access article distributed under the terms of the Creative Commons Attribution License (CC BY). The use, distribution or reproduction in other forums is permitted, provided the original author(s) and the copyright owner are credited and that the original publication in this journal is cited, in accordance with accepted academic practice. No use, distribution or reproduction is permitted which does not comply with these terms.
*Correspondence: Elke Albrecht, elke.albrecht@fbn-dummerstorf.de