 Crystal L. Coolbaugh
 Emily C. Bush1
 Theodore F. Towse
- 1Vanderbilt University Institute of Imaging Science, Vanderbilt University Medical Center, Nashville, TN, United States
- 2Department of Radiology and Radiological Sciences, Vanderbilt University Medical Center, Nashville, TN, United States
- 3Department of Biomedical Engineering, Vanderbilt University, Nashville, TN, United States
- 4Department of Biomedical Sciences, Grand Valley State University, Allendale, MI, United States
Cold exposure, a known stimulant of the thermogenic effects of brown adipose tissue (BAT), is the most widely used method to study BAT physiology in adult humans. Recently, individualized cooling has been recommended to standardize the physiological cold stress applied across participants, but critical experimental details remain unclear. The purpose of this work was to develop a detailed methodology for an individualized, perception-based protocol to investigate human physiological responses to cooling. Participants were wrapped in two water-circulating blankets and fitted with skin temperature probes to estimate BAT activity and peripheral vasoconstriction. We created a thermoesthesia graphical user interface (tGUI) to continuously record the subject's perception of cooling and shivering status during the cooling protocol. The protocol began with a 15 min thermoneutral phase followed by a series of 10 min cooling phases and concluded when sustained shivering (>1 min duration) occurred. Researchers used perception of cooling feedback (tGUI ratings) to manually adjust and personalize the water temperature at each cooling phase. Blanket water temperatures were recorded continuously during the protocol. Twelve volunteers (ages: 26.2 ± 1.4 years; 25% female) completed a feasibility study to evaluate the proposed protocol. Water temperature, perception of cooling, and shivering varied considerably across participants in response to cooling. Mean clavicle skin temperature, a surrogate measure of BAT activity, decreased (−0.99°C, 95% CI: −1.7 to −0.25°C, P = 0.16) after the cooling protocol, but an increase in supraclavicular skin temperature was observed in 4 participants. A strong positive correlation was also found between thermoesthesia and peripheral vasoconstriction (ρ = 0.84, P < 0.001). The proposed individualized, perception-based protocol therefore has potential to investigate the physiological responses to cold stress applied across populations with varying age, sex, body composition, and cold sensitivity characteristics.
Introduction
In the decade since its rediscovery in adult humans (Nedergaard et al., 2007), brown adipose tissue (BAT) has emerged as a target of intense physiological and therapeutic interest. Cold exposure, an established stimulant of the thermogenic effects of BAT, is the most widely used method for understanding BAT physiology (Cypess et al., 2009; van Marken Lichtenbelt et al., 2009; Virtanen et al., 2009; Ouellet et al., 2012). Limited consensus, however, exists on how to apply the cold stimulus to ensure comparable results across research participants with varying physiological characteristics or pathological conditions (Chen et al., 2016). Recently, individualized, water-cooling protocols have been recommended to standardize physiological cold stress and increase the likelihood of activating BAT equally across participants [see review of BAT cooling protocols (van der Lans et al., 2014)]. Experimental details, however, remain unresolved: how should cooling start and progress? what is an appropriate physiological marker of cold stress?
Recent studies reveal a variety of experimental practices and analytical approaches to address these questions. Water temperatures may start near skin temperature (between 31 and 35 °C) or at distinct temperatures (as cold as 8°C) (Lee et al., 2014; Salem et al., 2016; Martinez-Tellez et al., 2017a,b). Coolant temperatures may then change in an undefined manner (Vijgen et al., 2011; Vosselman et al., 2012), move in a single step and remain fixed (Ouellet et al., 2012; Muzik et al., 2013; Matsuda-Nakamura et al., 2015; Gifford et al., 2016), or shift along a gradient with small (1°C) or large steps (5°C) over varied time periods (e.g., 5–30 min) (van der Lans et al., 2013; Bakker et al., 2014; Chondronikola et al., 2016; Martinez-Tellez et al., 2017a,b). Cooling then typically terminates at the onset of shivering—a common physiological event used to indicate equal cold stress across participants. Approaches to define and measure the onset of shivering, however, often differ between research groups (van der Lans et al., 2014). Collectively, these subtle inconsistencies in cooling protocols may fail to induce cold exposure equally and complicate efforts to compare results among research groups. Standardized protocols are needed to ensure that differences in the prevalence and thermogenic properties—including but not limited to the timing and magnitude of heat production - of BAT among participants are a true physiological response of the tissue to cold exposure and not a result of methodological variability (van der Lans et al., 2014; Chen et al., 2016).
Here, we propose an individualized, perception-based protocol to investigate human physiological responses to cooling, with a special interest in BAT. In accordance with recent efforts to standardize and validate methods to study BAT physiology (Chen et al., 2016), we provide experimental details and analytical tools to guide researchers from subject preparation through data analysis. A feasibility study was conducted to assess the efficacy of the protocol and to explore the use of thermoesthesia (the ability to detect changes in temperature) to guide the progression of cooling. We hypothesize that changes in thermoesthesia relate to cold-induced responses in peripheral vasoconstriction. If so, thermal sensation feedback may allow researchers to adapt the cooling protocol according to the participant's cold sensitivity - an important consideration to replicate cold stress during longitudinal or cold acclimatization intervention studies of BAT physiology (Chen et al., 2016).
Materials and Methods
Design Criteria for an Individualized, Perception-Based Cooling Protocol
In designing this protocol, we considered the following criteria:
• Achieves a similar cold-induced physiological response across participants.
• Adapts cooling according to the participant's cold sensitivity.
• Quantifies the physiological response to cold exposure (e.g., perception of cooling, skin temperature gradients, and shivering).
Delivering the Cooling Stimulus
We used a Blanketrol® III hyper-hypothermia system (Cincinnati Sub-Zero, Cincinnati, OH, USA) to cool the participant (Figure 1A). Prior to the start of a session, two water-circulating blankets (Maxi-Therm® Lite Model, Cincinnati Sub-Zero, Cincinnati, OH, USA) were taped together to prevent overlap of the cooling area and to secure their position on top of a patient bed. The blanket water temperature was then warmed to 32°C (a preliminary estimate of thermoneutral). The participant laid in a supine position on top of the blankets such that the blanket's top edge was aligned with the base of the chin. Straps secured the blankets around the participant's body with care taken to keep the participant's arms and legs slightly abducted to limit skin contact between body parts and to cover as much of the participant's body as possible. Water temperature was adjusted with the Blanketrol® III interface according to the protocol guidelines. Set and achieved water temperatures were recorded via a laptop computer (Blanketrol® III Data Export Software) every 30 s.
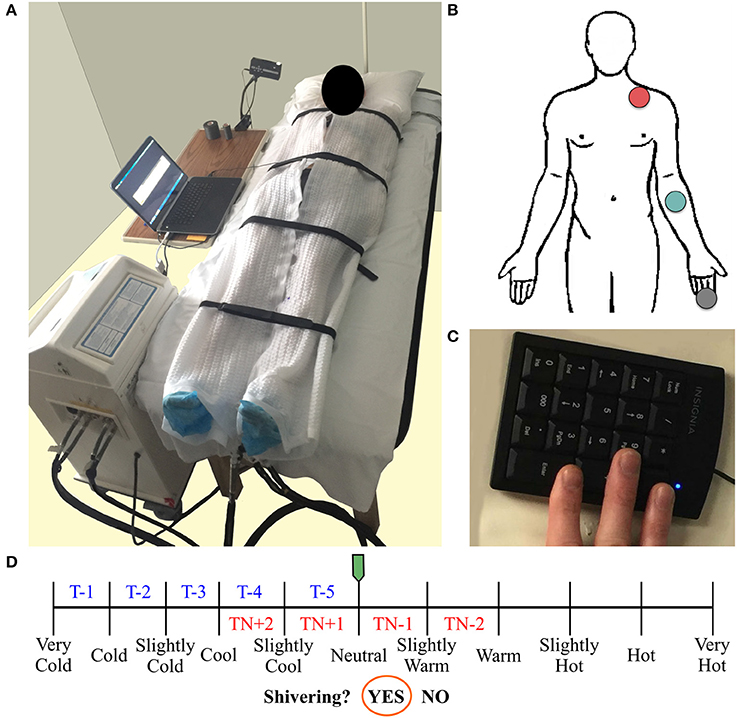
Figure 1. Participant's setup used for an individualized, perception-based cooling protocol (A). Two water-circulating blankets connected to a Blanketrol® III hyper-hypothermia system are secured around the participant. Diagram of the skin temperature probe locations (human body outline adapted from a free graphics library: http://clipart-library.com) (B). Skin temperature was measured in the supraclavicular region (red circle), on the anterior portion of the forearm (green circle), and on the distal end of the middle finger (gray circle). A laptop computer logs water temperature and runs a thermoesthesia graphical user interface (tGUI) program. The tGUI records feedback from an external keypad (C) attached to the participant's right hand (positioned underneath the blankets during cooling) and updates a visual display projected above the patient bed in real-time. Schematic of the perception-based cooling protocol water temperature adjustment guide (blue and red text) overlay on the tGUI visual interface (D). During the protocol, the participant uses two buttons to move the green slider along the continuum of temperature ratings. The slider's position determines how to alter the current water temperature set point (TN during thermoneutral (red text) or T during cooling (blue text) phases; see section Individualized, Perception-Based Cooling Protocol for details). A third button can be pressed to move the orange circle and indicate if shivering is active (“Yes”) or inactive (“No”).
Monitoring Acute Physiological Responses to Cold Exposure
Skin Temperature
Changes in supraclavicular skin temperature have been shown to relate positively with BAT volume and activity in response to cold exposure (Boon et al., 2014; Chondronikola et al., 2016; van der Lans et al., 2016). Additional skin temperature measurements and calculated gradients can also be implemented to monitor physiological responses to cooling (Martinez-Tellez et al., 2017a). Here, we describe a minimal set of skin temperature measurements needed to estimate BAT activity (Boon et al., 2014; Chondronikola et al., 2016; van der Lans et al., 2016) and peripheral vasoconstriction (Rubinstein and Sessler, 1990). Three temperature probes (Model MLT422/A; ADInstruments, Colorado Springs, CO, USA) were placed above the clavicle (superficial to a potential BAT depot), on the anterior portion of the forearm, and on the distal end of the middle finger (Figure 1B). The arm-to-finger skin temperature gradient was calculated to reflect peripheral vasoconstriction (Rubinstein and Sessler, 1990). Probes were secured to the skin with adhesive tape and covered with a thin cotton pad to avoid direct contact with the cooling blanket. Temperature signals were sampled every 30 s, and analyzed with LabChart software (Thermistor Pod Model ML309, PowerLab 16/35 Data Acquisition System, LabChart version 8; ADInstruments, Colorado Springs, CO, USA).
Perception of Cooling (Thermoesthesia)
We developed a thermoesthesia Graphical User Interface (tGUI) (Welch et al., 2017) to allow participants to evaluate differences in temperature and shivering in real-time. The tGUI tool is freely available for download (https://github.com/welcheb/Thermoesthesia_GUI) and can be executed in MATLAB (Mathworks, Natick, MA, USA). The tGUI visual interface consists of a series of qualitative descriptors marked on a temperature continuum and a binary shivering event capture (Figure 1D). Each position on the temperature scale registers a numeric value ranging from 0 (“Very Cold”) to 100 (“Very Hot”) in single integer increments. During a cooling session, a small projector displayed the tGUI visual analog scale interface above the patient bed. The participant's right hand was attached to a small, numeric keypad (Figure 1C), which rested next to the participant's right leg underneath the cooling blankets. The participant used two buttons on the keypad to position a slider along the continuum of temperature ratings and a third button to indicate if shivering was active (“Yes”) or inactive (“No”). The tGUI tool recorded the current date and time, the numeric slider value, and the current status of the shiver indicator (No = 0; Yes = 1) every 30 s and each time a key was pressed.
Shivering
Surface electromyography (EMG), self-report (tGUI tool), and observation were combined to record shivering events during the cooling protocol. Bipolar surface electrodes (Octal Bio Amp Model FE238, Powerlab 16/35 Data Acquisition System; ADInstruments, Colorado Springs, CO, USA) were placed on the belly of the trapezius (TRAP) and sternocleidomastoid (SCM)—superficial muscles known to contribute to shivering upon cold exposure (Tikuisis et al., 1991; Bell et al., 1992). The reference electrode was placed on the distal end of the humerus on the same side of the body as the other electrodes, and participants performed a series of isometric contractions to confirm recording of muscle activity. Throughout the cooling session, participants self-reported shiver events with the tGUI tool (section Perception of Cooling (Thermoesthesia)), and members of the research team noted the start and end time of any body movements (e.g., shiver, yawn, speaking, fidget, etc.) as a reference standard for any EMG muscle activity.
EMG shiver event detection analysis
Raw EMG signals were sampled at 1,000 Hz, band-pass analog filtered 20–400 Hz, and notch filtered at 60 Hz to remove motion artifacts and electrical noise, respectively, using LabChart software. Custom MATLAB scripts were then used to detect shivering events in the processed EMG data. In brief, a Teager-Kaiser energy operator transformed the EMG signal to improve the signal to noise ratio (Li et al., 2007; Solnik et al., 2010). The Teager-Kaiser signal was rectified and low-pass filtered at 50 Hz, and a portion of the signal was selected when the muscle was at rest (approximately 5 s of data) to calculate a baseline reference value. The threshold crossing detection (Li et al., 2007; Solnik et al., 2010) used to identify the onset of muscle activity was defined by
where μ and σ equal the mean and standard deviation of the baseline reference and J is 15, a preset value validated by Solnik et al. (2010) for low magnitude muscle activity baselines. Shiver onset was recorded as the first time point to exceed and stay above the threshold for at least 10% of a 250 ms sliding window. Shiver events were combined if less than a 50 ms gap existed between the off and on times of neighboring events.
General Participant Preparation Guidelines
Numerous factors, including age, sex, body composition, diet, cold acclimatization, and exertional fatigue, contribute to individual variability in the physiological response to cold (Castellani and Young, 2016); therefore, participant characteristics were documented and pretest conditions were controlled for the perception-based cooling protocol (Chen et al., 2016). Exclusion criteria included: habitual tobacco or alcohol use, significant changes in body weight (>5% in the past 3 months), use of prescribed and over-the-counter medications known to affect thermoregulation (Cuddy, 2004; Mukherjee et al., 2016), breast feeding, and pregnancy (Chen et al., 2016). Prior to the test session, participants consumed no food or beverage other than water for a minimum of 6 h to limit the effect of diet and caffeine on BAT activity (Vosselman et al., 2013; Mukherjee et al., 2016). Participants also avoided vigorous (relative intensity > 7 using a scale of 0 (none) to 10 (maximal effort)) and moderate (relative intensity between 5 and 7) physical activity for 72 and 24 h before the session, respectively (US Department of Health and Human Services, 2008). To limit the effects of sex hormones on thermoregulation (Charkoudian et al., 1999; Charkoudian and Stachenfeld, 2016), female participants completed testing during the early follicular phase (days 1–4) of the menstrual cycle. Repeat cooling protocols were also scheduled at the same time of day, preferably in the morning, to limit diurnal differences in skin blood flow (Aoki et al., 2003). Finally, male and female participants wore lightweight clothing with minimal skin coverage to enhance heat transfer with the water-circulating blankets (e.g., male: briefs 0.04 clo, shorts 0.06 clo, socks 0.02 clo; female: underwear 0.03 clo, bra 0.01 clo, shorts 0.06 clo, socks 0.02 clo). Clo units refer to clothing insulation values (Bligh and Johnson, 1973; American Society of Heating Refrigerating and Air-Conditioning Engineers, 2005).
Familiarization Session
We required participants to complete a familiarization session at least 2 days and no longer than 30 days prior to a perception-based cooling protocol. The purpose of this session was to introduce the participant to the cooling environment, the sensation of cold exposure and shivering, and use of the tGUI tool. Although it was not necessary to adhere to pretest restrictions for the familiarization session, participants wore appropriate clothing (section General Participant Preparation Guidelines), and skin temperature sensors were used to confirm cooling. Water temperature adjustments for the familiarization session (Table 1) exposed the participant to a wide range (32°-7°C) and large decrements (−10°C) in cooling in a short period of time to allow for ample training with the tGUI tool. Careful instruction regarding the use of the tGUI tool was provided to the participant throughout the session to encourage careful evaluation of thermoesthesia and to express the occurrence of shivering events in a standard format (Table 2). The familiarization session ended either when the participant reported sustained shivering for longer than 1 min or at the end of the seventh stage (8 min at 7°C) of the cooling paradigm.
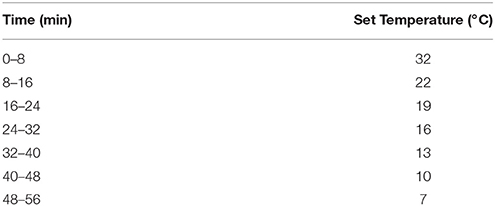
Table 1. Familiarization session water temperature adjustment guide.
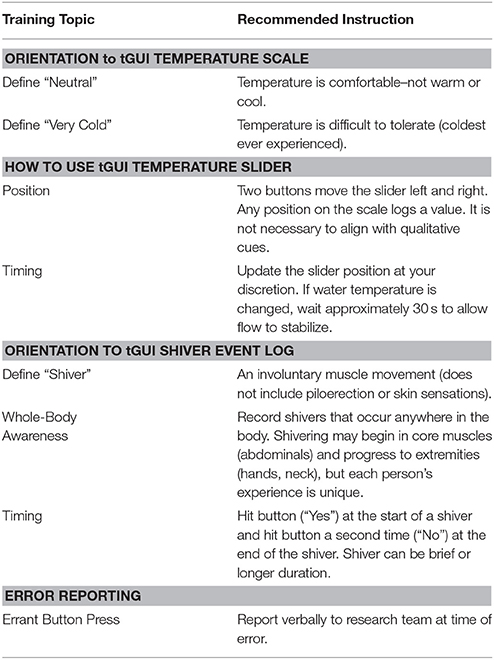
Table 2. Recommended instructions for thermoesthesia graphical user interface (tGUI) Training.
Individualized, Perception-Based Cooling Protocol
The primary goal of the individualized, perception-based cooling protocol session was to identify the water temperature that elicited sustained shivering in a participant. This reference water temperature can then be adjusted (e.g., + 3°C) to minimize shivering if the experimental design requires continued cold exposure on the same experimental day (Chen et al., 2016) or as part of a separate session (Martinez-Tellez et al., 2017b). Prior to the start of the protocol, the water-cooling system, participant, and physiological sensors were prepared (sections Delivering the Cooling Stimulus–General Participant Preparation Guidelines) and indoor and outdoor temperature and humidity were recorded. The protocol began with a thermoneutral phase (15 min) followed by a series of cooling phases (10 min) and concluded when the participant reported sustained shivering (the tGUI shiver event indicator in the “Yes” position for longer than 1 min). For each perception-based cooling protocol, we recorded: time at start of a phase (when water flow begins), time at end of a phase (when water flow stops), thermoneutral water temperature, and shivering water temperature.
The participant's thermal perception feedback—the position of the tGUI slider on the temperature continuum—was used to guide water temperature adjustments during the protocol (Figure 1D). The protocol started at a water temperature of 32°C with the tGUI slider aligned with “Neutral.” If the participant moved the tGUI slider to a warmer or cooler position, researchers adjusted the water temperature (3 min between adjustment) until the participant returned to a “Neutral” perception, which initiated the 15-min thermoneutral phase (Figure 1D: red text = thermoneutral phase water temperature guide). At the end of the thermoneutral phase and each subsequent cooling phase, researchers evaluated the position of the tGUI slider to determine how much to decrease the water temperature set point for the next protocol phase (Figure 1D: blue text = cooling phase water temperature guide). For example, a tGUI slider position between “Very Cold” and “Cold” at the end of a phase resulted in a 1°C decrease in water temperature from the previous set point. If the slider was aligned with a qualitative landmark, the smaller decrease in temperature was used (e.g., alignment with “Cool” would result in a 3°C drop in water temperature).
Summarizing Cooling Protocol Data
We created an open-source MATLAB program (https://github.com/ccoolbaugh/Individualized_Cooling_Data_Analysis) to summarize raw data acquired during a perception-based cooling protocol (Coolbaugh and Bush, 2017). The program imports log files from the Blanketrol® III, tGUI tool, and skin temperature probes; synchronizes the file time stamps (start of cooling equals time zero); and generates plots of the data.
Feasibility Assessment of the Individualized, Perception-Based Cooling Protocol
Participant Characteristics
Fifteen volunteers (four females) were recruited from Vanderbilt University and the greater Nashville area using word-of-mouth and email advertisements. Volunteers were between 18 and 35 years of age, non-smokers, and apparently healthy: with no history or symptoms of cardiovascular, pulmonary, metabolic, or neurological disease and no current use of prescribed or over-the-counter medications known to affect thermoregulation (Cuddy, 2004; Mukherjee et al., 2016) as self-reported on a medical history questionnaire. Female participants were not pregnant or breast-feeding and were studied during the early follicular phase (day 1–4) of the menstrual cycle.
Volunteers reported to the laboratory on two separate occasions to complete a familiarization session and an individualized, perception-based cooling protocol (sections Familiarization Session–Individualized, Perception-Based Cooling Protocol). Prior to the perception-based cooling protocol, compliance with pre-test restrictions (section General Participant Preparation Guidelines) was assessed by a questionnaire. Participants changed into standard clothing, and body mass and height without shoes were measured using a calibrated scale and stadiometer, respectively. These values were used to calculate body mass index (BMI) (mass (kg) divided by height squared (m)). In addition, waist circumference was measured just above the ilium of the pelvis with a Gulick spring-loaded handle (Centers for Disease Control and Prevention, 2007). The Vanderbilt University Medical Center Institutional Review Board approved the experimental protocol, and all participants provided written, informed consent.
Statistical Analysis
Three analyses were completed to evaluate the efficacy of the proposed cooling protocol to: (1) individualize cooling, (2) titrate changes in water temperature according to thermoesthesia, and (3) quantify physiological responses (i.e., perception, skin temperature, and shivering) to cold exposure. First, water temperature and the participant's perception of cooling were extracted at three physiological markers: vasoconstriction index (arm-to-finger skin temperature difference equal to 4°C, Rubinstein and Sessler, 1990), onset of shivering (first recorded tGUI shiver event), and the end of the protocol (sustained shivering longer than 1 min) to explore temporal changes in an individual's response to cooling. Linear mixed-effects repeated measures analysis was performed (R package nlme, Pinheiro et al., 2017) to test differences in water temperature and perception at each physiological marker. Tukey's post hoc pairwise comparison was applied when indicated (R package multcomp Hothorn et al., 2008). Second, Spearman rank correlation coefficients (ρ) were calculated to test the relationship between skin temperature and thermoesthesia ratings. Changes in clavicle, arm, and finger temperatures were expressed relative to the skin temperature of the respective anatomical location at the end of the thermoneutral phase, and the arm-to-finger temperature gradient was calculated as a measure of peripheral vasoconstriction (Rubinstein and Sessler, 1990). Paired samples Wilcoxon signed rank tests were performed to compare pre- (end of thermoneutral phase) and post- (end of protocol) alterations in relative skin temperatures. To prepare data for these analyses, perception ratings and temperatures were linearly interpolated to a time vector common to both data series and averaged across subjects. Third, the utility of EMG (combined TRAP and SCM muscle activity) and the tGUI tool to measure shivering was evaluated. EMG and tGUI shiver event times were compared, and similarity fractions (Equations 2 and 3, respectively) were calculated
where EMGshiver and tGUIshiver represent the number of EMG and tGUI shiver events, respectively. Normality assumptions were evaluated using visual inspection of histogram and quantile-quantile plots of the data. The level of significance for all statistical tests was set at P < 0.05, and statistical analyses were performed in R Studio (version 1.0.153; R Studio, Boston, MA, USA). Data are presented as means ± 95% confidence intervals, unless otherwise noted.
Results
Subject Characteristics and Environmental Conditions
Of the 15 participants enrolled, 12 completed the feasibility study (Table 3). One male withdrew due to discomfort with cold exposure, and one female did not complete the perception-based cooling protocol during the early follicular phase of the menstrual cycle. In addition, testing for one male was canceled following an operator malfunction of the Blanketrol® III system. Participants completed both sessions in 30 days, and all testing was done at the Vanderbilt University Medical Center in Nashville, TN between December 2016 and June 2017.
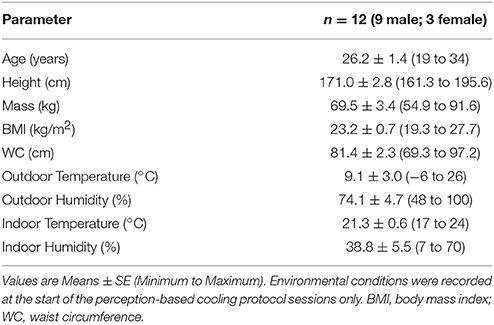
Table 3. Participant characteristics and environmental conditions.
Individual Variability of Cold-Induced Physiological Responses
Water temperature and thermoesthesia demonstrated considerable individual variability during the cooling protocol (Figure 2). Water temperatures at vasoconstriction index, onset of shivering, and sustained shivering ranged from 31 to 16°C, 31 to 15°C, and 20 to 9°C, respectively. Vasoconstriction index (21.6°C, 95% confidence interval (CI): 18.5–24.7°C) and onset of shivering (20.5°C, 95% CI: 17.7–23.3°C) water temperatures did not differ significantly (P = 0.80); however, both values were significantly warmer than the water temperature at sustained shivering (14.6°C, 95% CI: 12.4–16.8°C; vasoconstriction index, P < 0.001; onset of shivering, P = 0.001). Similar differences were also present in the perception of cooling ratings (vasoconstriction index vs. onset of shivering, P = 0.43; vasoconstriction index vs. sustained shivering, P < 0.001; onset of shivering vs. sustained shivering, P = 0.002). Subjects reported the first incidence of shivering across the complete spectrum of perceived temperatures (“Neutral” to “Very Cold”) while sustained shivering occurred for all subjects between “Cold” and “Very Cold” temperature levels. Shiver onset and intensity also exhibited a range of temporal patterns across subjects in response to cold exposure (Figure 3).
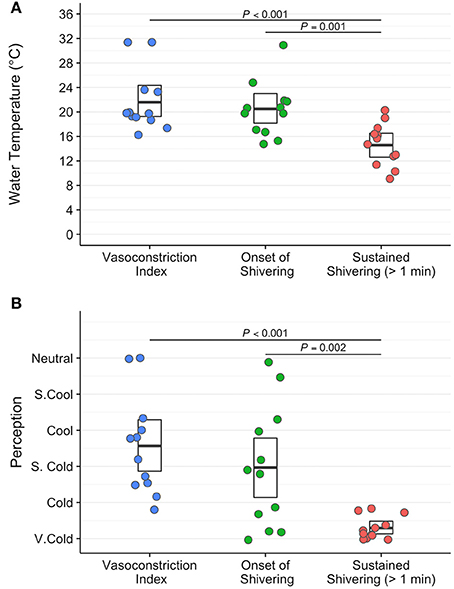
Figure 2. Water temperature (°C; A) and subjective perception of cooling ratings (arbitrary units; B) exhibit a wide range of variability between subjects at three physiological and temporally distinct markers: vasoconstriction index (>4°C gradient between forearm and finger skin temperature; blue circles), onset of shivering (first self-reported shiver event; green circles), and sustained shivering (self-reported shiver event with a duration >1 min; red circles) in the perception-based cooling protocol. The centerline in each box indicates the mean value, and the top and bottom of the box mark the 95% confidence intervals. Tukey's post-hoc pairwise tests were performed following a linear mixed-effects analysis with repeated measures to assess statistical comparisons.
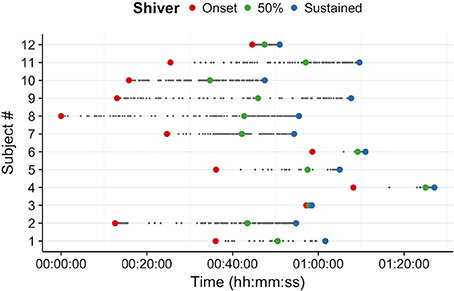
Figure 3. Self-reported shiver patterns (onset (red), 50% of total shiver events (green), and sustained shivering (>1 min duration; blue)) differed across participants during the individualized, perception-based cooling protocol.
Relationship Between Skin Temperature and Thermoesthesia
Skin temperature data for 2 participants were excluded from analyses due to indications of pronounced peripheral vasoconstriction (>4°C arm to finger temperature gradient) at the end of the 15 min thermoneutral phase (Figure 2). Clavicle skin temperature demonstrated a weak relationship with thermoesthesia (ρ = −0.18, P < 0.001; Figure 4A). In addition, mean clavicle skin temperature decreased (−0.99°C, 95% CI: −1.7 to −0.25°C, P = 0.16) during the cooling protocol, but individual measures exhibited a wide range (−3.74° to 0.5°C) with warming of the region noted in 4 of the 10 subjects. As expected, arm (−2.4°C, 95% CI: −2.9 to −1.9°C, P = 0.002) and finger temperatures (−9.5 °C, 95% CI: −10.5 to −8.5°C, P = 0.002) decreased resulting in greater peripheral vasoconstriction (7.0°C, 95% CI: 6.2 to 7.8°C, P = 0.002) in response to cold exposure. Cold induced changes in skin temperature were also strongly related with perception of cooling ratings (forearm: ρ = −0.70, P < 0.001; finger: ρ = −0.80, P < 0.001; vasoconstriction: ρ = 0.84, P < 0.001; Figures 4B–D). Small upward fluctuations in arm, finger, and peripheral vasoconstriction temperature gradients (Figures 4B–D) were the result of two subjects indicating a warmer tGUI rating when the protocol water temperature adjustment caused a brief decrease in the circulation of cold water.
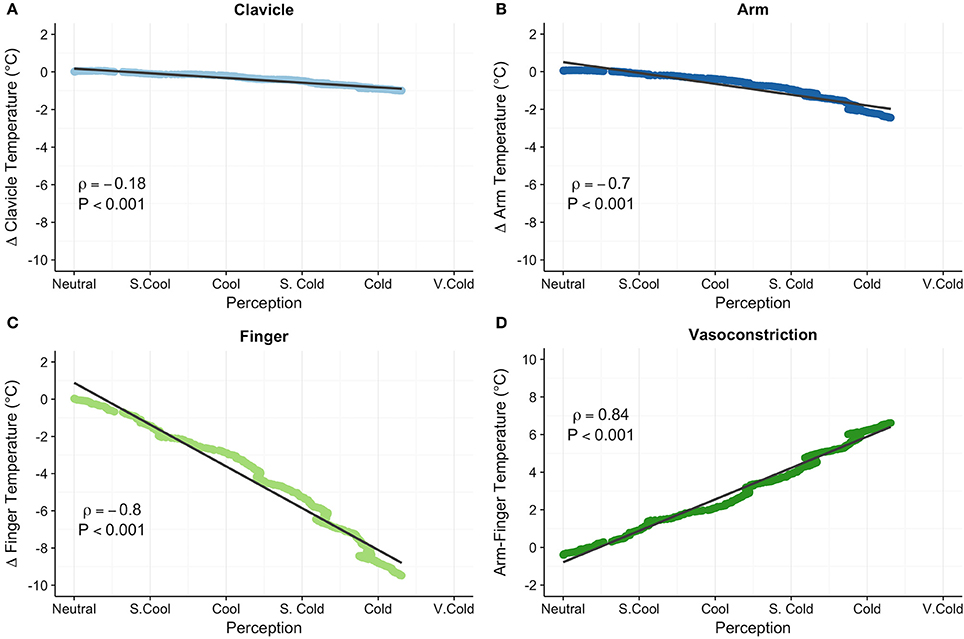
Figure 4. Clavicle (°C; A), forearm (°C; B), finger (°C; C), and peripheral vasoconstriction (forearm–finger, °C; D) skin temperatures correlated with subjective perception of cooling ratings. Relative clavicle, forearm, and finger skin temperatures are expressed as the change (Δ) in temperature from the end of the thermoneutral phase. Least squares best-fit lines are overlaid on the temperature data, which were linearly interpolated and averaged among participants. Small upward fluctuations in the temperature gradient (most notable in the finger skin temperature) were the result of two volunteers indicating a warmer perception rating when water temperature was adjusted (i.e., a brief stop of circulating cold water). Correlation (ρ) between temperature and perception was evaluated with the Spearman rank test.
Monitoring Acute Physiological Responses to Cold Exposure
Figure 5 displays the water temperature/perception of cooling profile (A) and absolute clavicle, forearm, and finger skin temperatures (B) recorded from a healthy, young male (age: 31 years, BMI: 24.0 kg/m2) during a perception-based cooling protocol. In this example, the participant indicated a gradual cooling sensation with sporadic shivering starting in the fourth cooling phase and progressing to a sustained shiver at the end of the sixth and final cooling phase (Figure 5A). In addition, the participant's clavicle skin temperature increased slightly, and arm and finger skin temperatures decreased in response to cooling (Figure 5B).
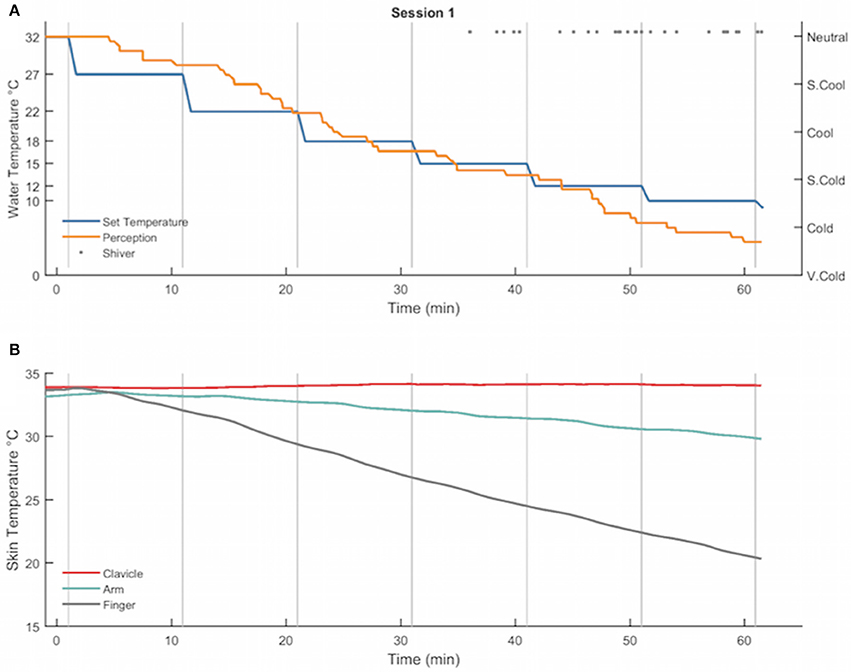
Figure 5. Example of the water temperature set points (°C, blue), subjective perception of cooling ratings (arbitrary units, orange), and self-reported shiver events (gray dots) (A) and clavicle (°C, red), forearm (°C, green line), and finger (°C, gray line) skin temperature gradients (B) recorded from a healthy, young male during a perception-based cooling protocol. During the protocol, the set point of the water temperature (blue line) was adjusted at the end of each 10-min cooling phase (vertical gray lines) according to the subject's thermal perception rating (orange line; see section Individualized, Perception-Based Cooling Protocol for details). The protocol terminated when the subject reported sustained shivering (>1 min in duration; gray dots).
For the total sample, EMG muscle activity and tGUI shiver events quantified shivering during the protocol; however, the number of events (EMG: 1–363; tGUI: 3–105) and similarity of shiver timing (i.e., similarity fraction; EMG: 0–0.63; tGUI: 0–0.75; Figure 6A) ranged between participants. Representative plots illustrate examples of strong (Figure 6B), moderate (Figure 6C), and poor (Figure 6D) similarity between EMG and tGUI shiver events. Notably, EMG activity in the moderate case often corresponded with movements not specific to shivering (researcher observations of deep breaths, speaking, or fidgeting) whereas TRAP and SCM muscles were not sensitive to shivering in the poor case example.
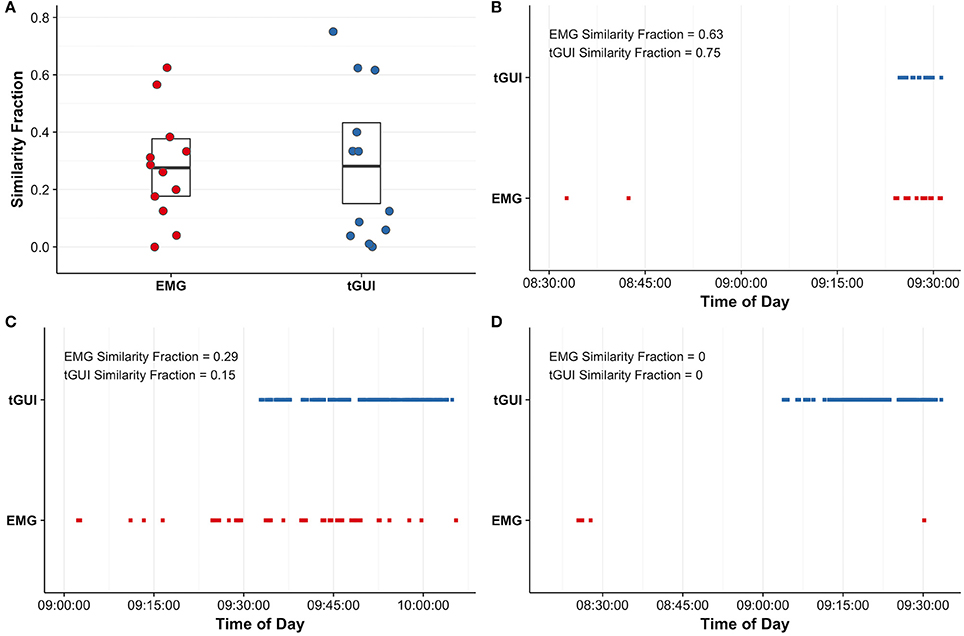
Figure 6. Similarity fractions (arbitrary units; see equations 2 and 3 for details) were calculated to evaluate the utility of surface electromyography (EMG; red) recordings of trapezius and sternocleidomastoid muscle activity and subjective events captured with the thermoesthesia graphical user interface (tGUI; blue) to quantify shivering (A). The centerline in each box indicates the mean value, and the top and bottom of the box mark the 95% confidence intervals. Individual examples highlight good agreement between EMG and tGUI shiver events number and timing (B) and illustrate instances of poor specificity (C) and sensitivity (D) of EMG to measure whole body shivering. Brief shiver events may be difficult to visualize on plots (B–D) due to the resolution of the time scale.
Discussion
We describe a detailed methodology for an individualized, perception-based protocol to investigate human physiological responses to cooling. A small study was conducted to demonstrate the efficacy of our proposed method to individualize cooling, adapt cooling to the participant's cold sensitivity, and quantify physiological responses to cold exposure. Water temperature, perception of cooling, and shivering varied across participants, thus supporting the importance of personalized cooling protocols, such as the proposed method, for the study of cold-activated BAT (van der Lans et al., 2014). We also found a strong correlation between cold-induced changes in perception of cooling and peripheral vasoconstriction. Use of thermoesthesia ratings to guide adjustments in water temperature, therefore, may adapt cooling to the participant's cold sensitivity—an important consideration to replicate cold stress during longitudinal or cold acclimatization intervention studies of BAT physiology (Chen et al., 2016).
Standardizing BAT Activation: Individualized, Water-Cooling Paradigm
Individualized, water-cooling is necessary to apply a similar physiological cold stress and stimulate BAT consistently across participants (van der Lans et al., 2014). We examined water temperature and thermoesthesia with three distinct physiological markers associated with acute thermoregulatory responses to cold: vasoconstriction index, onset of shivering, and sustained shivering. When exposed to cold, decreases in skin temperature initiate vasoconstriction and shivering to offset heat loss and maintain body temperature (Castellani and Young, 2016). Vasoconstriction index, a 4°C arm-to-finger skin temperature differential, reflects a significant reduction in peripheral blood flow (Rubinstein and Sessler, 1990). Specific shivering benchmarks, however, are less clearly defined because the onset, extent, and intensity of shivering differ between individuals (Tikuisis et al., 1991; Castellani and Young, 2016). Using individualized cooling, we found no significant difference in vasoconstriction index and onset of shivering mean water temperature and thermoesthesia. While this finding may suggest that both physiological markers represent a similar cold stimulus, we noted considerable individual variability in the pattern of shivering, which may reflect differing contributions of skeletal muscle contractions and BAT to cold-induced thermogenesis (Blondin et al., 2017). Because heat production increases as a function of cold exposure (Blondin et al., 2015), continuing to apply a cold stimulus until the participant reports sustained shivering may increase the likelihood of maximizing BAT activity across subjects. Quantifying the extent of BAT activity and its relationship with cold exposure, however, remains a critical area of future research.
Advantages of Perception-Based Cooling Gradients
Previous cooling methods employ fixed temperatures or predetermined temperature gradients across participants regardless of differences in sex, age, body composition, and cold tolerance (Ouellet et al., 2012; Muzik et al., 2013; van der Lans et al., 2013; Bakker et al., 2014; Chondronikola et al., 2016; Gifford et al., 2016; Martinez-Tellez et al., 2017b). However, individual characteristics and external factors, such as prior cold exposure or exertional fatigue, contribute to variability in the thermoeffector responses to cold and BAT activity (van der Lans et al., 2014; Castellani and Young, 2016) and therefore the rate at which individuals lose heat and defend against heat loss. For example, overweight and obese participants have been shown to preserve body temperature (Gifford et al., 2016) and delay the onset of shivering (Vijgen et al., 2011) during cold exposure. Perception-based cooling may offer an approach to account for this variability. Thermoesthesia correlated strongly with peripheral vasoconstriction, an independent physiological measure of cold sensitivity (Castellani and Young, 2016). This association suggests the perception-based cooling protocol may improve the sensitivity of detecting personalized, physiological cold stress thresholds in a heterogeneous group of research participants. Further, adapting cooling gradients to cold sensitivity may be advantageous to explore the effects of cold acclimatization on BAT. Thermoregulatory physiology (blunted cutaneous vasoconstriction, Castellani and Young, 2016) and BAT activity (van der Lans et al., 2013; Blondin et al., 2014; Hanssen et al., 2015) adapt to cold habituation. Perception-based cooling, therefore, may enable the level of cold stress to be replicated within an individual before and after an intervention. A comparable cold stress will improve our understanding of any differences in the timing and magnitude of BAT heat production, and its potential role in whole-body energy metabolism and weight maintenance.
Quantifying Acute Physiological Responses to Cold Exposure
Skin Temperature Estimates of Peripheral Vasoconstriction and BAT Activity
Changes in supraclavicular skin temperature have been proposed as a surrogate measure of BAT activity (Boon et al., 2014; Chondronikola et al., 2016; van der Lans et al., 2016). Although biopsy or medical imaging (see review of BAT imaging techniques, Sampath et al., 2016) are required to confirm the presence of BAT, increased clavicle skin temperature suggests the presence and activation of BAT in a small subset of volunteers in this study. Maintenance or slight decreases in supraclavicular skin temperature may also indicate active BAT (Chondronikola et al., 2016; van der Lans et al., 2016), but a predictive relation between the magnitude of the skin temperature change and BAT volume remains unclear. Nevertheless, supraclavicular skin temperature adds value to the cooling protocol as an indirect approach to screen participants for potential BAT depots prior to conducting more invasive or expensive medical imaging studies.
Peripheral skin temperatures provide a method to monitor the efficacy of the cooling protocol. Upon cooling, skin temperature decreases as vasoconstriction reduces skin blood flow (Castellani and Young, 2016). Therefore, we advise monitoring finger skin temperature to ensure the participant experiences cooling. We further propose using the arm-to-finger temperature gradient to confirm the thermoneutral temperature (Chen et al., 2016). In this study, skin temperature gradients indicated significant vasoconstriction (>4°C, Rubinstein and Sessler, 1990) in 2 of the 12 volunteers following 15 min at a nominally thermoneutral temperature (self-reported “Neutral” on the tGUI tool). Future work should consider warming the blanket water temperature during the thermoneutral phase until the arm-to-finger gradient is zero to reduce the effect of inadvertent cold exposure on experimental outcomes. Although pronounced changes in core body temperature are unlikely with mild cold exposure (Castellani and Young, 2016), measurement of core body temperature and additional skin temperature sites can be included to assess thermoeffector responses to the cooling protocol more broadly if desired (Martinez-Tellez et al., 2017a).
Utility of the Thermoesthesia Graphical User Interface (tGUI)
The tGUI tool creates a simple interface for participants to translate perception of cooling and shivering into a formal rating system. Subjective ratings integrate the complex and often imperceptible physiological and mental responses to an event into a relatable format that encourages standardized evaluation (Hart and Staveland, 1988). Although thermal sensation ratings have been incorporated into previous studies (Muzik et al., 2013; van der Lans et al., 2013; Matsuda-Nakamura et al., 2015; Chondronikola et al., 2016), fixed evaluation time intervals or use of verbal questioning limit event recall and may result in qualitative differences between participants (Hart and Staveland, 1988). With the tGUI tool, participants can interact with a keypad to adjust the thermoesthesia scale instantaneously with minimal muscle movements or need for verbal cues. Instruction and training (e.g., familiarization session), however, are necessary to help participants learn to deliberately categorize temperature sensations or shiver events in a consistent manner within the context of the cooling protocol environment.
Comparison of Self-Reported and EMG Shiver Events
Self-report of shiver events with the tGUI tool also provides an alternative to surface EMG to monitor shivering during the cooling protocol. While surface EMG is widely used to measure muscle activity, electrical signals result from both shivering and voluntary muscle movements. Equipment constraints further limit the utility of EMG to record shivering in only a select number of superficial muscles. Shivering, however, often originates in the deep muscles of the torso (Bell et al., 1992) and exhibits unique onset, intensity, and muscle recruitment patterns in each individual (Tikuisis et al., 1991; Castellani and Young, 2016). In this study, participants reported the start and end of any involuntary muscle movement in real-time with the tGUI tool resulting in a more specific and sensitive measure of whole-body shiver onset and duration compared with surface EMG in some individuals. Moreover, the tGUI keypad and visual display operate within the constraints of medical imaging environments that complicate use of most EMG systems (e.g., challenges viewing participant movements, ferromagnetic cables, and electrical noise). The tGUI shiver events, however, are susceptible to self-report errors (e.g., incorrect button press or failure to identify a muscle movement) and lack resolution and intensity information required to assess skeletal muscle metabolism. Careful selection and increased sampling of EMG muscle activity or use of more quantitative methods should be considered if whole-body muscle metabolism is a desired study outcome (Blondin et al., 2015).
Limitations
Performing the perception-based cooling protocol in the context of a medical imaging environment (Sampath et al., 2016) is a logical next step to determine how the presence and activation of BAT contributes to the physiological responses to cold exposure measured in this study. In addition, testing the protocol in populations with greater diversity in age and body composition than tested here would increase its applicability in future studies. Older participants experience a lower threshold for peripheral vasoconstriction and onset of shivering (Frank et al., 2000), but it is unknown if these physiological adaptations would adversely affect the ability to use thermal perception to personalize cooling. Additional cooling blankets may also be needed to ensure the protocol applies a similar cold stress to individuals with increased body surface area or subcutaneous adipose tissue. It should also be appreciated that the perception-based cooling protocol may not be appropriate for all individuals. Future studies are needed to determine if medications known to affect thermoregulation and BAT activity (Cuddy, 2004; Mukherjee et al., 2016) or chronic conditions, such as diabetic neuropathy (Gilmore et al., 1990), affect the ability to individualize, adapt, and quantify cooling in populations with varying therapeutic treatments or pathological conditions. Finally, a repeatability study should be conducted to evaluate the consistency of an individual's shiver threshold for experiments requiring cold exposure on multiple days (Martinez-Tellez et al., 2017b). Strict enforcement of pretest restrictions (section General Participant Preparation Guidelines) may control for some variability within the individual, but it is unknown how fluctuations in acute cold exposure or exertional fatigue (Castellani and Young, 2016)—factors difficult to control and measure during an experiment—alter cold sensitivity and/or the threshold for shivering.
Summary
Building upon current best practices, we developed an individualized, perception-based protocol to investigate human physiological responses to cooling. A small feasibility study demonstrated the ability of the protocol to individualize, adapt, and quantify cooling in a cohort of healthy adults. Future implementations of the protocol should assess its efficacy in diverse populations, in combination with cold acclimatization or pharmacological intervention, and in medical imaging environments. As some of the underlying assumptions regarding BAT physiology are better understood, we hope the methods described here provide a foundation to create consistent cooling protocols to improve inter-study comparisons of experimental outcomes.
Reproducible Research
Data and code are available for public download from a version-controlled repository (https://github.com/ccoolbaugh/FrontPhysiol_Coolbaugh_Cooling_Protocol) to reproduce the figures and statistical analyses in this article (Coolbaugh, 2018). Example data recorded during a perception-based cooling protocol are accessible and can be analyzed with the individualized cooling data analysis summary code (Coolbaugh and Bush, 2017).
Ethics Statement
This study was carried out in accordance with the recommendations of the Vanderbilt University Medical Center Institutional Review Board with written informed consent from all subjects. All subjects gave written informed consent in accordance with the Declaration of Helsinki. The protocol was approved by the Vanderbilt University Medical Center Institutional Review Board.
Author Contributions
CC, EB, EW, and TT conception and design of research; CC, EB, and EG performed experiments; CC and EB analyzed data; CC, EB, EW, and TT interpreted results of experiments; CC drafted the manuscript; and CC, EB, EG, EW, and TT edited and revised the manuscript. All authors approved the final version of the manuscript and agree to be accountable for the content of the work.
Funding
Funding support for this research was provided by the following grants from the National Institutes of Health (NIH): National Center for Advancing Translational Sciences (NCATS)/NIH UL1-TR000445 and National Institute of Diabetes and Digestive and Kidney Diseases (NIDDK)/NIH R01-DK-105371.
Conflict of Interest Statement
The authors declare that the research was conducted in the absence of any commercial or financial relationships that could be construed as a potential conflict of interest.
Acknowledgments
The authors would like to thank the volunteers for their participation and Dr. Aliya Gifford and Dr. Henry Ong for their contributions to early pilot tests of the cooling protocol. We also thank Dr. Bruce Damon and Dr. Maciej Buchowski for their insightful review of this manuscript.
References
American Society of Heating Refrigerating and Air-Conditioning Engineers (2005). Ashrae Handbook Fundamentals I-P Edition. Atlanta, GA: ASHRAE Research.
Aoki, K., Stephens, D. P., Saad, A. R., and Johnson, J. M. (2003). Cutaneous vasoconstrictor response to whole body skin cooling is altered by time of day. J. Appl. Physiol. 94, 930–934. doi: 10.1152/japplphysiol.00792.2002
Bakker, L. E., Boon, M. R., van der Linden, R. A., Arias-Bouda, L. P., van Klinken, J. B., Smit, F., et al. (2014). Brown adipose tissue volume in healthy lean south Asian adults compared with white Caucasians: a prospective, case-controlled observational study. Lancet Diab. Endocrinol. 2, 210–217. doi: 10.1016/S2213-8587(13)70156-6
Bell, D. G., Tikuisis, P., and Jacobs, I. (1992). Relative intensity of muscular contraction during shivering. J. Appl. Physiol. 72, 2336–2342.
Bligh, J. and Johnson K. G. (1973). Glossary of terms for thermal physiology. J. Appl. Physiol. 35, 941–961. doi: 10.1152/jappl.1973.35.6.941
Blondin, D. P., Frisch, F., Phoenix, S., Guérin, B., Turcotte, É. E., Haman, F., et al. (2017). Inhibition of Intracellular Triglyceride Lipolysis Suppresses Cold-Induced Brown Adipose Tissue Metabolism and Increases Shivering in Humans. Cell Metab. 25, 438–447. doi: 10.1016/j.cmet.2016.12.005
Blondin, D. P., Labb,é, S. M., Phoenix, S., Guérin, B., Turcotte, É. E., Richard, D., et al. (2015). Contributions of white and brown adipose tissues and skeletal muscles to acute cold-induced metabolic responses in healthy men. J. Physiol. 593, 701–714. doi: 10.1113/jphysiol.2014.283598
Blondin, D. P., Labbé, S. M., Tingelstad, H. C., Noll, C., Kunach, M., Phoenix, S., et al. (2014). Increased brown adipose tissue oxidative capacity in cold-acclimated humans. J. Clin. Endocrinol. Metab. 99, 438–446. doi: 10.1210/jc.2013-3901
Boon, M. R., Bakker, L. E., van der Linden, R. A., Pereira Arias-Bouda, L., Smit, F., Verberne, H. J., et al. (2014). Supraclavicular skin temperature as a measure of 18F-FDG uptake by BAT in human subjects. PLoS ONE 9:e98822. doi: 10.1371/journal.pone.0098822
Castellani, J. W., and Young, A. J. (2016). Human physiological responses to cold exposure: acute responses and acclimatization to prolonged exposure. Auton. Neurosci. Basic Clin. 196, 63–74. doi: 10.1016/j.autneu.2016.02.009
Charkoudian, N., and Stachenfeld, N. (2016). Sex hormone effects on autonomic mechanisms of thermoregulation in humans. Auton. Neurosci. Basic Clin. 196, 75–80. doi: 10.1016/j.autneu.2015.11.004
Charkoudian, N., Stephens, D. P., Pirkle, K. C., Kosiba, W. A., and Johnson, J. M. (1999). Influence of female reproductive hormones on local thermal control of skin blood flow. J. Appl. Physiol. 87, 1719–1723.
Chen, K. Y., Cypess, A. M., Laughlin, M. R., Haft, C. R., Hu, H. H., Bredella, M. A., et al. (2016). Brown Adipose Reporting Criteria in Imaging STudies (BARCIST 1.0): Recommendations for Standardized FDG-PET/CT Experiments in Humans. Cell Metab. 24, 210–222. doi: 10.1016/j.cmet.2016.07.014
Chondronikola, M., Volpi, E., Børsheim, E., Chao, T., Porter, C., Annamalai, P., et al. (2016). Brown adipose tissue is linked to a distinct thermoregulatory response to mild cold in people. Front. Physiol. 7:129. doi: 10.3389/fphys.2016.00129
Coolbaugh, C. L. (2018). Ccoolbaugh/FrontPhysiol_Coolbaugh_Cooling_Protocol: Initial Release (Version v1.0). Nashville, TN: Zenodo. doi: 10.5281/zenodo.1185321
Coolbaugh, C. L., and Bush, E. C. (2017). Ccoolbaugh/Individualized_Cooling_Data_Analysis: Initial Release (Version v0.0.0). Nashville, TN: Zenodo. doi: 10.5281/zenodo.1037467
Cuddy, M. L. (2004). The effects of drugs on thermoregulation. AACN Adv. Crit. Care 15, 238–253. doi: 10.1177/0022002784028001005
Cypess, A. M., Lehman, S., Williams, G., Tal, I., Rodman, D., Goldfine, A. B., et al. (2009). Identification and importance of brown adipose tissue in adult humans. N. Engl. J. Med. 360, 1509–1517. doi: 10.1056/NEJMoa0810780
Centers for Disease Control and Prevention (2007). Anthropometry Procedures Manual. Available online at: https://www.cdc.gov/nchs/data/nhanes/nhanes_07_08/manual_an.pdf (Accessed Oct. 30, 2017).
Frank, S. M., Raja, S. N., Bulcao, C., and Goldstein, D. S. (2000). Age-related thermoregulatory differences during core cooling in humans. Am. J. Physiol. Integr. Comp. Physiol. 279, R349–R354. doi: 10.1152/ajpregu.2000.279.1.R349
Gifford, A., Towse, T. F., Walker, R. C., Avison, M. J., and Welch, E. B. (2016). Characterizing active and inactive brown adipose tissue in adult humans using PET-CT and MR imaging. Am. J. Physiol. Endocrinol. Metab. 311, E95–E104. doi: 10.1152/ajpendo.00482.2015
Gilmore, J. E., Alien, J. A., and Hayes, J. R. (1990). A comparison of peripheral vasoconstrictor responses and cardiovascular autonomic function tests in diabetic patients. Diabetologia 33, 350–356.
Hanssen, M. J., Hoeks, J., Brans, B., van der Lans, A. A., Schaart, G., van den Driessche, J. J., et al. (2015). Short-term cold acclimation improves insulin sensitivity in patients with type 2 diabetes mellitus. Nat. Med. 21, 863–865. doi: 10.1038/nm.3891
Hart, S. G., and Staveland, L. E. (1988). Development of NASA-TLX (Task Load Index): results of empirical and theoretical research. Adv. Psychol. 52, 139–183. doi: 10.1016/S0166-4115(08)62386-9
Hothorn, T., Bretz, F., and Westfall, P. (2008). Simultaneous inference in general parametric models. Biometr. J. 50, 346–363. doi: 10.1002/bimj.200810425
Lee, P., Linderman, J. D., Smith, S., Brychta, R. J., Wang, J., Idelson, C., et al. (2014). Irisin and FGF21 are cold-induced endocrine activators of brown fat function in humans. Cell Metab. 19, 302–309. doi: 10.1016/j.cmet.2013.12.017
Li, X., Zhou, P., and Aruin, A. S. (2007). Teager-kaiser energy operation of surface EMG improves muscle activity onset detection. Ann. Biomed. Eng. 35, 1532–1538. doi: 10.1007/s10439-007-9320-z
Martinez-Tellez, B., Sanchez-Delgado, G., Acosta, F. M., Alcantara, J. M. A., Boon, M. R., Rensen, P. C. N., et al. (2017a). Differences between the most used equations in BAT-human studies to estimate parameters of skin temperature in young lean men. Sci. Rep. 7:10530. doi: 10.1038/s41598-017-10444-5
Martinez-Tellez, B., Sanchez-Delgado, G., Garcia-Rivero, Y., Alcantara, J. M. A., Martinez-Avila, W. D., Muñoz-Hernandez, M. V., et al. (2017b). A new personalized cooling protocol to activate brown adipose tissue in young adults. Front. Physiol. 8:863. doi: 10.3389/fphys.2017.00863
Matsuda-Nakamura, M., Yasuhara, S., and Nagashima, K. (2015). Effect of menstrual cycle on thermal perception and autonomic thermoregulatory responses during mild cold exposure. J. Physiol. Sci. 65, 339–347. doi: 10.1007/s12576-015-0371-x
Mukherjee, J., Baranwal, A., and Schade, K. N. (2016). Classification of therapeutic and experimental drugs for brown adipose tissue activation: potential treatment strategies for diabetes and obesity. Curr. Diab. Rev. 12, 414–428. doi: 10.2174/1573399812666160517115450
Muzik, O., Mangner, T. J., Leonard, W. R., Kumar, A., Janisse, J., and Granneman, J. G. (2013). 15O PET measurement of blood flow and oxygen consumption in cold-activated human brown fat. J. Nucl. Med. 54, 523–531. doi: 10.2967/jnumed.112.111336
Nedergaard, J., Bengtsson, T., and Cannon, B. (2007). Unexpected evidence for active brown adipose tissue in adult humans. AJP Endocrinol. Metab. 293, E444–E452. doi: 10.1152/ajpendo.00691.2006
Ouellet, V., Labbé, S. M., Blondin, D. P., Phoenix, S., Guérin, B., Haman, F., et al. (2012). Brown adipose tissue oxidative metabolism contributes to energy expenditure during acute cold exposure in humans. J. Clin. Invest. 122, 545–552. doi: 10.1172/JCI60433
Pinheiro, J., Bates, D., DebRoy, S., and Sarkar, D., and R Core Team (2017). nlme: Linear and Nonlinear Mixed Effects Models. Available online at: https://cran.r-project.org/package=nlme
Rubinstein, E. H., and Sessler, D. I. (1990). Skin-surface temperature gradients correlate with fingertip blood flow in humans. Anesthesiology 73, 541–545. doi: 10.1017/CBO9781107415324.004
Salem, V., Izzi-Engbeaya, C., Coello, C., Thomas, D. B., Chambers, E. S., Comninos, A. N., et al. (2016). Glucagon increases energy expenditure independently of brown adipose tissue activation in humans. Diab. Obes. Metab. 18, 72–81. doi: 10.1111/dom.12585
Sampath, S. C., Sampath, S. C., Bredella, M. A., Cypess, A. M., and Torriani, M. (2016). Imaging of brown adipose tissue: state of the art. Radiology 280, 4–19. doi: 10.1148/radiol.2016150390
Solnik, S., Rider, P., Steinweg, K., Devita, P., and Hortobágyi, T. (2010). Teager-Kaiser energy operator signal conditioning improves EMG onset detection. Eur. J. Appl. Physiol. 110, 489–498. doi: 10.1007/s00421-010-1521-8
Tikuisis, P., Bell, D. G., and Jacobs, I. (1991). Shivering onset, metabolic response, and convective heat transfer during cold air exposure. J. Appl. Physiol. 70, 1996–2002.
US Department of Health, and Human Services. (2008). 2008 Physical Activity Guidelines for Americans. Available online at: www.health.gov/paguidelines (Accessed Oct. 30, 2017)
van der Lans, A. A., Hoeks, J., Brans, B., Vijgen, G. H., Visser, M. G., Vosselman, M. J., et al. (2013). Cold acclimation recruits human brown fat and increases nonshivering thermogenesis. J. Clin. Invest. 123, 3395–3403. doi: 10.1172/JCI68993
van der Lans, A. A., Vosselman, M. J., Hanssen, M. J. W., Brans, B., and van Marken Lichtenbelt, W. D. (2016). Supraclavicular skin temperature and BAT activity in lean healthy adults. J. Physiol. Sci. 66, 77–83. doi: 10.1007/s12576-015-0398-z
van der Lans, A. A., Wierts, R., Vosselman, M. J., Schrauwen, P., Brans, B., and van Marken Lichtenbelt, W. D. (2014). Cold-activated brown adipose tissue in human adults: methodological issues. AJP Regul. Integr. Comp. Physiol. 307, R103–R113. doi: 10.1152/ajpregu.00021.2014
van Marken Lichtenbelt, W. D., Vanhommerig, J. W., Smulders, N. M., Drossaerts, J. M., Kemerink, G. J., Bouvy, N. D., et al. (2009). Cold-activated brown adipose tissue in healthy men. N. Engl. J. Med. 360, 1500–1508. doi: 10.1056/NEJMoa0808718
Vijgen, G. H., Bouvy, N. D., Teule, G. J. J., Brans, B., Schrauwen, P., and van Marken Lichtenbelt, W. D. (2011). Brown adipose tissue in morbidly obese subjects. PLoS ONE 6:e17247. doi: 10.1371/journal.pone.0017247
Virtanen, K. A., Lidell, M. E., Orava, J., Heglind, M., Westergren, R., Niemi, T., et al. (2009). Functional brown adipose tissue in healthy adults. N. Engl. J. Med. 360, 1518–1525. doi: 10.1056/NEJMoa0808949
Vosselman, M. J., Brans, B., Van Der Lans, A. A., Wierts, R., Van Baak, M. A., Mottaghy, F. M., et al. (2013). Brown adipose tissue activity after a high-calorie meal in humans. Am. J. Clin. Nutr. 98, 57–64. doi: 10.3945/ajcn.113.059022
Vosselman, M. J., Van Der Lans, A. A. J. J., Brans, B., Wierts, R., Van Baak, M. A., Schrauwen, P., et al. (2012). Systemic Beta-adrenergic stimulation of thermogenesis is not accompanied by brown adipose tissue activity in humans. Diabetes 61, 3106–3113. doi: 10.2337/db12-0288
Welch, E. B., Coolbaugh, C. L., Gifford, A., Bush, E. C., and Towse, T. F. (2017). Thermoesthesia GUI v0.2.1. Zenodo. Available online at: http://doi.org/10.5281/zenodo.375922
Keywords: thermoregulation, cold exposure, brown adipose tissue, supraclavicular skin temperature, vasoconstriction, shivering, humans
Citation: Coolbaugh CL, Bush EC, Galenti ES, Welch EB and Towse TF (2018) An Individualized, Perception-Based Protocol to Investigate Human Physiological Responses to Cooling. Front. Physiol. 9:195. doi: 10.3389/fphys.2018.00195
Received: 01 November 2017; Accepted: 23 February 2018;
Published: 13 March 2018.
Edited by:
Leonardo Alexandre Peyré-Tartaruga, Federal University of Rio Grande do Sul (UFRGS), BrazilReviewed by:
Christopher J. Madden, Oregon Health & Science University, United StatesBeth J. Allison, Hudson Institute of Medical Research, Australia
Copyright © 2018 Coolbaugh, Bush, Galenti, Welch and Towse. This is an open-access article distributed under the terms of the Creative Commons Attribution License (CC BY). The use, distribution or reproduction in other forums is permitted, provided the original author(s) and the copyright owner are credited and that the original publication in this journal is cited, in accordance with accepted academic practice. No use, distribution or reproduction is permitted which does not comply with these terms.
*Correspondence: Crystal L. Coolbaugh, crystal.coolbaugh@vanderbilt.edu