 Robert A. Olek
 Sylwester Kujach
 Ewa Ziemann
 Wieslaw Ziolkowski1
 Radoslaw Laskowski
- 1Department of Bioenergetics and Nutrition, Faculty of Rehabilitation and Kinesiology, Gdansk University of Physical Education and Sport, Gdańsk, Poland
- 2Department of Physiology, Faculty of Physical Education, Gdansk University of Physical Education and Sport, Gdańsk, Poland
- 3Department of Physiology and Pharmacology, Faculty of Rehabilitation and Kinesiology, Gdansk University of Physical Education and Sport, Gdańsk, Poland
- 4Department of Nuclear Medicine, Medical University of Gdańsk, Gdańsk, Poland
Purpose: The aim of this study was to compare the effect of applying two different rest recovery times in a 10-s sprint interval training session on aerobic and anaerobic capacities as well as skeletal muscle enzyme activities.
Methods: Fourteen physically active but not highly trained male subjects (mean maximal oxygen uptake 50.5 ± 1.0 mlO2·kg−1·min−1) participated in the study. The training protocol involved a series of 10-s sprints separated by either 1-min (SIT10:1) or 4-min (SIT10:4) of recovery. The number of sprints progressed from four to six over six sessions separated by 1–2 days rest. Pre and post intervention anthropometric measurements, assessment of aerobic, anaerobic capacity and muscle biopsy were performed. In the muscle samples maximal activities of citrate synthase (CS), 3-hydroxyacylCoA dehydrogenase (HADH), carnitine palmitoyl-transferase (CPT), malate dehydrogenase (MDH), and its mitochondrial form (mMDH), as well as lactate dehydrogenase (LDH) were determined. Analysis of variance was performed to determine changes between conditions.
Results: Maximal oxygen uptake improved significantly in both training groups, by 13.6% in SIT10:1 and 11.9% in SIT10:4, with no difference between groups. Wingate anaerobic test results indicated main effect of time for total work, peak power output and mean power output, which increased significantly and similarly in both groups. Significant differences between training groups were observed for end power output, which increased by 10.8% in SIT10:1, but remained unchanged in SIT10:4. Both training protocols induced similar increase in CS activity (main effect of time p < 0.05), but no other enzymes.
Conclusion: Sprint interval training protocols induce metabolic adaptation over a short period of time, and the reduced recovery between bouts may attenuate fatigue during maximal exercise.
Introduction
The study by Parolin et al. (1999) described metabolic modifications in skeletal muscle during three 30-s bouts of maximal isokinetic cycling separated by 4-min recovery periods. This exercise protocol has become a basis for sprint interval training (SIT). The studies investigating the effect of SIT have been conducted using three to seven 30-s supramaximal exercise sprint bouts with 4-min rest periods between (Vollaard et al., 2017). Since the aerobic contribution in ATP resynthesis increases in consecutive exercise bouts (Bogdanis et al., 1996; Parolin et al., 1999), SIT is associated with the elevation of muscular oxidative potential as well as central adaptations such as increased cardiac output and stroke volume (Sloth et al., 2013). Consequently, SIT is postulated as a time-efficient exercise strategy for improving maximal oxygen uptake (VO2max) (Sloth et al., 2013; Vollaard et al., 2017) with biochemical and morphological adaptations arising in as little as six sessions performed over 2 weeks (Burgomaster et al., 2005, 2006, 2008; Hazell et al., 2010; Lloyd Jones et al., 2017).
It has been suggested that some of the adaptations to SIT are associated with the power generated during the first few seconds of each sprint. Therefore, shorter exercise bouts have been investigated to determine whether resulting adaptations are similar to those observed following 30-s SIT (Hazell et al., 2010; Lloyd Jones et al., 2017). Two various SIT protocols consisting of repeated 30-s or 10-s “all-out” cycle sprints with 4-min rest intervals, performed over 2 weeks indicate comparable enhancement in aerobic and anaerobic exercise capacities (Hazell et al., 2010). Moreover, similar improvements in performance are observed after applying SIT protocols matched for total sprint time −4 × 30-s or 20 × 6-s (Lloyd Jones et al., 2017). Another key factor affecting the metabolic modulations may be the work to rest ratio. Reduction in recovery time seems to be less effective in evoking adaptive changes (Hazell et al., 2010). The increase in aerobic and anaerobic capacities following 10-s SIT with 4-min rest are double changes in 10-s SIT with 2-min rest (Hazell et al., 2010).
Therefore, the aim of the present study was to compare the effect of applying two different rest intervals in 10-s SIT. We hypothesized that reducing the recovery time to 1-min in the SIT protocol consisting of repeated 10-s “all-out” cycle sprints, performed over 2 weeks would be less effective in evoking aerobic adaptations than 10-s SIT with 4-min rest, however it would still improve anaerobic performance measures.
Materials and Methods
Fourteen physically active but not highly trained male subjects at mean VO2max 50.5 ± 1.0 mlO2·kg−1·min−1 volunteered to participate in the study. The subjects were asked to refrain from any additional exercise practice during the study. The study was approved and then completed in accordance with the recommendations of Local Bioethics Committee (http://www.komisjabioetyczna.pl). Written informed consent was obtained from all subjects. The study was conducted in accordance with the Declaration of Helsinki. The overall study protocol is shown in Figure 1. The subjects were assigned to either 1-min interval recovery (SIT10:1) or 4-min interval recovery (SIT10:4) based on the pre-training results.
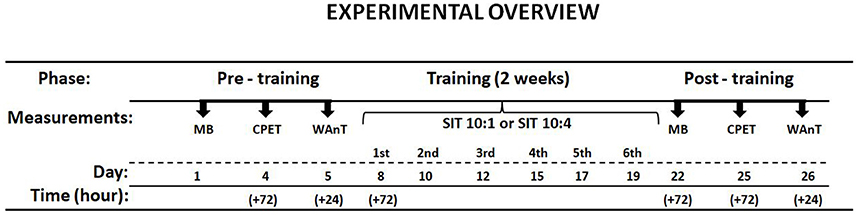
Figure 1. Scheme of the study protocol. Muscle biopsy (MB), cardiopulmonary exercise test (CPET), Wingate anaerobic test (WAnT).
Anthropometric Measurements
Body mass and composition were estimated using InBody720 (InBody Co., Ltd., Seoul, Korea). Participants were asked to arrive at the laboratory fasted, with voided bladders and bowels. The bioelectrical impedance analyses were performed in the position recommended by the manufacturer guidelines and the subjects clad only in briefs (Ziemann et al., 2013). The impedance measured five segments of the body (arms, trunk, legs) at frequencies of 1, 5, 50, 250, 500, and 1,000 kHz through the eight electrodes. Based on these impedance values fat free mass (FFM) and skeletal muscle mass (SMM) were calculated.
Cardiopulmonary Exercise Test
To determine VO2max participants performed a graded cycle ergometry test on an electromagnetically-braked, cycle ergometer (ER 900 Jaeger, Viasys Healthcare GmbH, Germany). After a 5-min warm-up at the intensity of 1.5 W·kg−1 with a pedaling cadence of 60 rpm, work rate was increased by 25 W·min−1 until volitional exhaustion. Breath by breath pulmonary gas exchange was measured by Oxycon-Pro analyzer (Viasys Healthcare GmbH, Germany; Olek et al., 2012). Heart rates were monitored continuously by telemetry (S-625, Polar Electro-Oy, Finland). Maximal heart rate (HRmax), maximal ventilation (VEmax), maximal aerobic power (MAP) were calculated at the VO2max level (Ziemann et al., 2011). The anaerobic threshold (AT) has been determined by three independent members of the research group using nonlinear increase in ventilation.
Anaerobic Power Measurement
After the standard warm-up, all subjects performed a 30-s “all-out” supramaximal test on a mechanically braked cycle ergometer (884E Sprint Bike, Monark, Sweden). The test was initiated from a dead stop with the resistance equal to 75 g·kg body mass−1 (corresponding to 7.5% of an individual's body mass) preset on the ergometer's friction belt (Laskowski et al., 2011). The obtained results were analyzed for total work (TW), peak power output (PPO), mean power output (MPO), end power output (EPO), time to PPO (Bar-Or, 1987). Fatigue index (FI) was determined by taking the percentage difference between PPO and EPO (Richardson et al., 2016).
Muscle Sampling and Analyses
Muscle biopsy was made under local anesthesia (2% lidocaine), in the supine position. The sample was obtained by the sterile single-use micro biopsy needle (M.D.L. srl, Delebio, Italy). The section of the Vastus Lateralis muscle (~10 mg) was immediately frozen in liquid nitrogen and stored in −80°C until analysis. All biopsies were collected by the same person to ensure a standard localization and muscle depth.
Muscles were homogenized in an ice-cold buffer contained 50 mM potassium phosphate, 1 mM ethylenediaminetetraacetic acid (EDTA), 1 mM threo-1,4-dimercapto-2,3-butanediol at pH 7.4. The homogenates were then centrifuged at 600 g at 4 °C for 10 min. The obtained supernatant was used to determine enzyme activities as previously (Antosiewicz et al., 1995; Kaczor et al., 2005; Olek et al., 2013) with a Super Aquarius CE9200 spectrophotometer (Cecil Instruments Ltd., Cambridge, UK) at 30°C. Citrate synthase (CS) activity was measured by the rate of SH production as CoASH using the thiol reagent 5,5′-dithiobis (2-nitrobenzoic acid) (DTNB). The reagent cocktail contained 50 mM potassium phosphate, 0.1 mM DTNB, and 0.1 mM acetylCoA. The reaction was started by 0.1 mM oxaloacetic acid (OAA). Carnitine palmitoyl-transferase (CPT) activity was measured in the reaction mixture composed by 60 mM of Tris HCl at pH 8.0, 1.5 mM of EDTA with 0.05% Triton X-100 and 0.25 mM DTNB and 1.67 mM of carnitine. The reaction was started by the addition of 0.025 mM palmitoyl-CoA. The kinetics of change in absorbance were followed at 412 nm, and the molar absorption coefficient 14,150 M−1cm−1 was used for calculation of CS and CPT activities. 3-hydroxyacylCoA dehydrogenase (HADH) activity was determined in a buffer containing 100 mM potassium phosphate and 0.05% Triton at pH 7.4. After addition of supernatant and 0.1 mM NADH the cuvette was preincubated for 3 min. The reaction was started by 0.1 mM acetoacetyl-CoA. Malate dehydrogenase (MDH) activity was determined in the 50 mM Tris-HCl buffer pH 7.6 containing 5 mM EDTA, 0.1 mM NADH, and 0.2 mM OAA. For the mitochondrial MDH (mMDH) assay, the cytoplasmic form of the enzyme (cMDH) was inactivated by 3 min preincubation of homogenate with equal volume of ethanol 99.5% (v/v) at room temperature. Then mMDH activity was followed by the same procedure as for total MDH measurements. Lactate dehydrogenase (LDH) activity was measured in the assay medium contained 50 mM potassium phosphate, 1 mM EDTA, 0.1 mM NADH, 2.1 mM pyruvate, at pH 7.2. The substrates NADH and pyruvate were added immediately before the measurement was started. The change in absorbance was followed in time at 340 nm. HADH, MDH, and LDH activities were calculated using molar absorption coefficient of NADH 6,220 M−1 cm−1. Protein content was determined by using Bradford protein assay. All reagents were obtained from Sigma-Aldrich.
Training Intervention
Subjects participated in training sessions on Monday, Wednesday, and Friday for 2 weeks. The same research assistant supervised all sessions, controlled the flywheel resistance, as well as the time of exercise and recovery periods. Each training session began with a 5-min warm-up at the intensity approximating 30% MAP. All training was completed using a load of 75 g·kg body mass−1.
1. SIT10:1; performed repeated, 10-s “all-out” efforts separated by 1-min recovery.
2. SIT10:4; performed repeated, 10-s “all-out” efforts separated by 4-min recovery.
The number of repeats increased from four repetitions during the first two training sessions, by five repetitions during the middle two training sessions, to six repetitions for the final two training sessions as has been done previously (Hazell et al., 2010). Both training groups performed a similar training protocol consisting of: 30-min low intensity warm-up and 5-min high intensity exercise throughout the training intervention (Stöggl and Sperlich, 2015). The difference between the groups was the time of recovery between the 10-s exercises. Therefore, overall time of training sessions was equal 59-min for SIT10:1 and 131-min for SIT10:4 (Table 1).
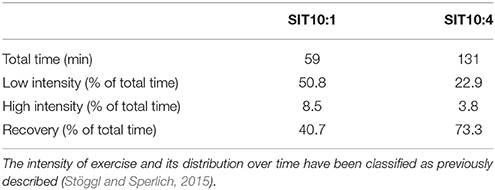
Table 1. Training distribution over the 2-weeks intervention.
Statistical Analyses
Two-way analysis of variance ANOVA was performed to examine the main effects of group and/or time. In case the ANOVA yielded a significant effect, a Tukey's HSD test was used for post hoc comparisons. A probability level p < 0.05 was considered statistically significant. Due to the small number of subjects, the effect size (η2) has been calculated. The values of η2 has been interpreted as follows: 0.1 a small effect, 0.3 a medium effect and 0.5 a large effect, as previously (Olek et al., 2014). All data are expressed as mean ± SEM (standard error of mean).
Results
The mean body mass of SIT10:4 subjects was higher than SIT10:1 subjects (Table 2), therefore physiological parameters have been presented as relative values. There were no significant differences between groups in aerobic and anaerobic capacities as well as skeletal muscle enzymatic activities at baseline.
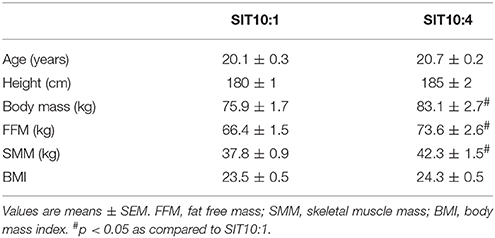
Table 2. Anthropometric characteristics of participants.
The training elevated VO2max in both groups (Table 3), by 13.6% in SIT10:1 and 11.9% in SIT10:4 (p < 0.001, η2 = 0.63), with no difference between the groups. Moreover, there was a significant VEmax increase (p < 0.05, η2 = 0.29) after the training. No significant differences in either HRmax or MAP were observed.
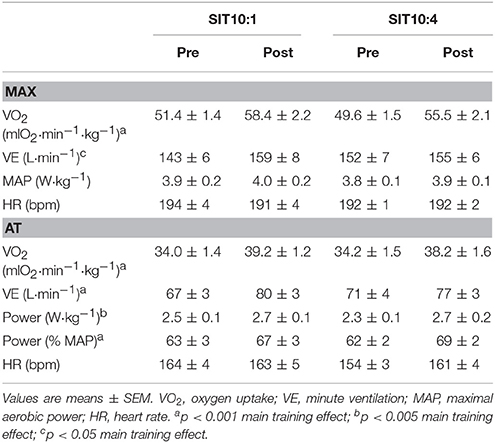
Table 3. Aerobic capacities before (pre) and after (post) 2 weeks of SIT.
Significant changes in oxygen uptake (p < 0.001, η2 = 0.78), VE (p < 0.001, η2 = 0.74) and workloads (%MAP) (p < 0.001, η2 = 0.72) at the exercise intensity corresponding to AT intensity following 2 weeks of SIT were observed (Table 3). No significant main effects for group and group × time interaction in these parameters were noted.
Wingate anaerobic test results indicated main effect of time for TW (p < 0.001, η2 = 0.79; Figure 2A), MPO (p < 0.001, η2 = 0.79; Figure 2B) and PPO (p < 0.001, η2 = 0.67; Figure 2D) which increased significantly in both groups. However, these changes did not differ between the groups. Significant differences between training groups (p < 0.05, η2 = 0.32), time (p < 0.01, η2 = 0.48) and a group x time interaction (p < 0.02, η2 = 0.39) were recorded for EPO (Figure 2C). EPO in SIT10:1 increased significantly by 10.8% (p < 0.005), whereas in SIT10:4 group remained unchanged (p = 0.9). Changes in EPO affected FI, which approached statistical significance after the training (p = 0.07, η2 = 0.25; Figure 2E). No differences in time to PPO was noted (Figure 2F).
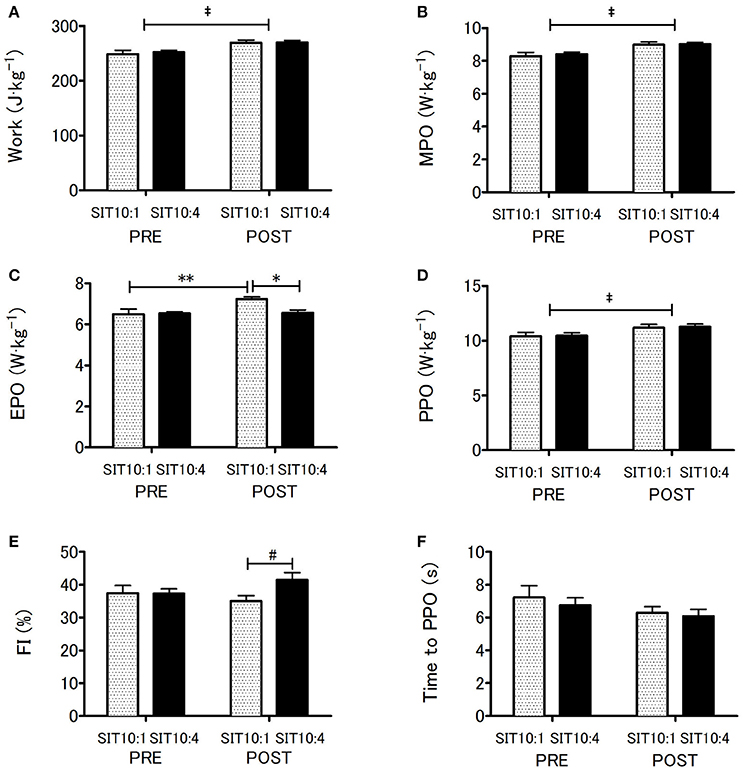
Figure 2. Anaerobic capacity before and after 2 weeks of SIT. Total work (A), mean power output (B), end power output (C), peak power output (D), fatigue index (E) and time to peak power output (F). ‡p < 0.001 main training effect; *p < 0.01 as compared to post-training between the groups; **p < 0.005 as compared to pre-training within the group; #p = 0.07 main effect of group.
There was a main effect of time for CS activity, which elevated significantly in both training groups (p < 0.05, η2 = 0.33), but no for HADH (p = 0.18, η2 = 0.14), mMDH (p = 0.17, η2 = 0.15) and CPT (p = 0.9, η2 = 0.0). There were no differences in LDH activity and LDH/CS ratio (Table 4).
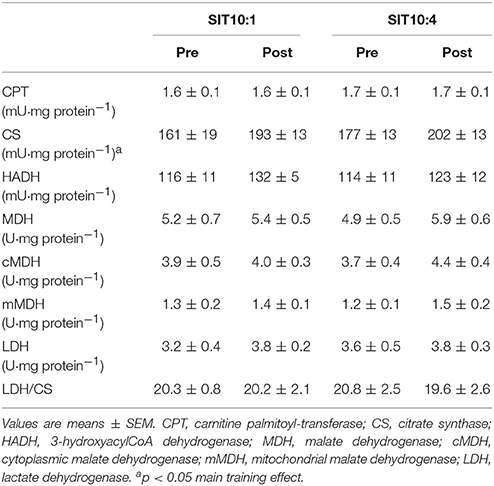
Table 4. Maximal activities of skeletal muscle enzymes before (pre) and after (post) 2 weeks of SIT.
Discussion
The main finding of this study is that both 1-min and 4-min recovery intervals in repeated 10-s sprint intervention for 2 weeks, resulted in a similar improvements in aerobic (VO2max, AT) and anaerobic (TW, PPO, MPO) capacities, and skeletal muscle enzyme activities. Moreover, the shorter recovery time induced higher EPO and lower FI during Wingate anaerobic test.
The increase in VO2max is similar to data obtained by McGarr et al. (2014) and Richardson and Gibson (2015), who used 30-s sprints with 4-min recoveries in training protocols performed over 2 weeks, reporting 14.2 and 11.2% improvement, respectively. Hazell et al. (2010), by applying six SIT sessions consisting of 10-s sprints with 4-min recovery intervals, indicated an 8.5% enhancement in aerobic capacity, similar to 30-s “all-out” cycles interspersed with 4-min recoveries (8.3%) reported in the same study. However, the workload used during SIT was slightly higher (10% of individual's body mass) (Hazell et al., 2010) than in the current protocol (7.5% of individual's body mass). On the contrary, two other studies applying 10-s maximal cycling SIT reported no change in VO2max: 2.4% (Hellsten-Westing et al., 1993) and −1.3% (Skleryk et al., 2013). These discrepancies may be caused by the number of repetitions applied during SIT (Vollaard et al., 2017). SIT performed by Hellsten-Westing et al. (1993) consisted of 15 10-s maximal sprints, three times per week for a total of 6 weeks. Skleryk et al. (2013) implemented six SIT sessions of 10-s “all-out” cycling, repeated 8–12 times. In the recent meta-analysis, Vollaard et al. (2017) indicated that training protocols consisting of fewer repetitions during session induced greater VO2max increase. Authors negated the role of total energy use, energy turnover or oxygen transfer in improvement of VO2max with SIT, because for each of these factors the stimulus should be greater with more sprint repetitions (Vollaard et al., 2017).
Our results revealed that 1-min or 4-min rest periods did not impact the increase in relative values of VO2max. Both training protocols were characterized by supramaximal intensity. Despite being short-lasting, both had a positive effect on maximal ventilation values, allowing subjects to perform the high volume workload. Moreover, maximal oxygen uptake also strongly correlates with skeletal muscle mitochondrial capacities (Rasmussen et al., 2001). SIT-induced VO2max improvement is associated with changes in mitochondrial bioenergetics (Larsen et al., 2013). Six SIT sessions of 30-s sprints, performed over 2 weeks caused maximal CS activity elevation (Burgomaster et al., 2005, 2006). On the other hand, HADH, the rate-limiting fat oxidation mitochondrial enzyme, does not change after 2 weeks (Burgomaster et al., 2006), however, it significantly increases after 6 weeks of 30-s SIT (Burgomaster et al., 2008). Higher HADH has also been observed in legs, but not in arms, following 72 “all-out sprints” (36 with arm cycling and 36 with leg cycling separated by 1-h of recovery) during the seven training sessions (Zinner et al., 2016). We have shown that a SIT protocol consisting the same number of repetitions as previously reported (Burgomaster et al., 2005, 2006), although with lower total work done, induced a significant rise in CS activity (but not in other mitochondrial enzymes). Since training induced changes in muscle CS activity are matched by changes in whole body oxidative capacity (Vigelsø et al., 2014; Meinild Lundby et al., 2018), our results confirm the effectiveness of both SIT protocols in training-induced adaptations.
Elevated oxidative ATP synthesis, attenuates the contribution of anaerobic ATP production (Larsen et al., 2014) and delays the blood lactate accumulation (Jakeman et al., 2012) following SIT. We have not determined lactate production, but we have observed changes in maximal oxygen uptake and CS activity, which were associated with higher workload at the intensity corresponding to AT. In addition, aerobic/anaerobic energy supply depends on the rate of pyruvate production and its mitochondrial oxidative decarboxylation catalyzed by pyruvate dehydrogenase competing to cytosolic reduction to lactate via LDH (Spriet et al., 2000). Moreover, malate-aspartate shuttle appears to be quantitatively important in lactate production during exercise (Schantz et al., 1986). Although the training protocol applied in our study did not modify LDH activity, and the increase in MDH activity was not statistically significant, we have observed higher workout at the intensity corresponding to AT, suggesting reduced lactate production following SIT.
SIT performed daily for 2 weeks increases skeletal muscle phosphocreatine (PCr) content and creatine kinase (CK) activity, but not PPO nor MPO during the Wingate test (Parra et al., 2000; Rodas et al., 2000). On the contrary, the same 14 sessions applied for 6 weeks (resting for 2 days between each session) causes improvement in PPO and MPO with no change in PCr and CK (Parra et al., 2000). PPO increases with no modification in PCr also after completing only 6 SIT sessions over 2 weeks (Burgomaster et al., 2005). Similarly, higher PPO has been reported in a study utilizing 6 sessions of 10-s supramaximal bouts, with 2-min or 4-min recoveries between sprints (Hazell et al., 2010). Consistently, we observed a significant PPO increase in both SITs. Despite no differences between the two protocols in other measured parameters, we observed an improvement in EPO during Wingate test in the group with a shorter recovery time.
Aerobic energy provision contributes almost half of the ATP turnover during the repeated 30-s sprint (after 4-min recovery; Bogdanis et al., 1996). Hence, the adaptive changes in oxidative metabolism seem to be reasonable following such a training protocol. During the 10-s sprint, the PCr availability is important for high power output (Bogdanis et al., 1998). Since PCr resynthesis 2-min after cessation of exercise reaches about ~90% of the resting value (Hultman et al., 1967; Bogdanis et al., 1998), subjects are able to reproduce PPO after 2-min recovery (Bogdanis et al., 1998). It seems that the reported adaptations following such training protocols may be caused by increased flux in the creatine-PCr energy shuttle (Bessman and Carpenter, 1985). Bessman and Savabi (1988) suggested that creatine plays important role in high energy phosphate transport, necessary for protein synthesis, ion transport and muscle contraction. The PCr resynthesis 1-min and 4-min after the exercise is ~80 and 90% (Hultman et al., 1967), consequently the small difference seems to be insufficient to induce various adaptive response for two SIT protocols. On the other hand, accumulation of incomplete recoveries in 1-min recovery SIT may contribute to some adaptations in ionic regulation resulting in EPO improvement. However, an increasing number of sprints may accumulate fatigue (Vollaard et al., 2017) and thus the effectiveness of training protocol in aerobic adaptations may be reduced (Hellsten-Westing et al., 1993; Skleryk et al., 2013).
Conclusion
This study found that 2 weeks of SIT comprising either of 1- or 4-min recovery time between exercises, which were matched for total sprint time, elicited similar performance changes in fit, healthy men. Moreover, reduced time of recovery between bouts may be more effective in attenuating fatigue during maximal exercise. Overall, obtained data complement presently available knowledge about interactions between intensity as well as duration of interval protocols and recovery. This is particularly significant in the context of the latest recommendations of American College of Sports Medicine; which cites high/sprint intensity interval training as the most effective form of exercise (Thompson, 2017).
Ethics Statement
This study was carried out in accordance with the recommendations of Local Bioethics Committee with written informed consent from all subjects. All subjects gave written informed consent in accordance with the Declaration of Helsinki. The protocol (Figure 1) was approved by the Local Bioethics Committee (http://www.komisjabioetyczna.pl/).
Author Contributions
RO, SK, and RL: Conceived and design the experiment; RO, SK, EZ, WZ, and RL: Performed the data collection; RO and PW: Performed the statistical analysis and interpretation of data; RO, SK, EZ, WZ, PW, and RL: Participated in drafting the article or revising it critically for important intellectual content; RO, SK, EZ,WZ, PW, and RL: Approved the final manuscript.
Funding
This study was supported by the Ministry of Science and Higher Education DSWF/I/6/2017 and DSRiK/10/2016.
Conflict of Interest Statement
The authors declare that the research was conducted in the absence of any commercial or financial relationships that could be construed as a potential conflict of interest.
Acknowledgments
The authors would like to thank a group of subjects participating in the study. The excellent technical assistance of Dr. Rafal Camilleri is acknowledged.
Abbreviations
SIT, sprint interval training; VO2max, maximal oxygen uptake; VE, minute ventilation; HR, heart rate; MAP, maximal aerobic power; AT, anaerobic threshold; TW, total work; PPO, peak power output; MPO, mean power output; EPO, end power output; FI, fatigue index; FFM, fat free mass; SMM, skeletal muscle mass; BMI, body mass index; CS, citrate synthase; HADH, 3-hydroxyacylCoA dehydrogenase; CPT, carnitine palmitoyl-transferase; MDH, malate dehydrogenase; mMDH, mitochondrial malate dehydrogenase; cMDH, cytoplasmic malate dehydrogenase; LDH, lactate dehydrogenase; EDTA, ethylenediaminetetraacetic acid; DTNB, 5,5′-dithiobis (2-nitrobenzoic acid); OAA, oxaloacetic acid; NADH, nicotinamide adenine dinucleotide reduced form.
References
Antosiewicz, J., Popinigis, J., Ishiguro, H., Hayakawa, T., and Wakabayashi, T. (1995). Cerulein-induced acute pancreatitis diminished vitamin E concentration in plasma and increased in the pancreas. Int. J. Pancreatol. 17, 231–236.
Bar-Or, O. (1987). The Wingate anaerobic test. An update on methodology, reliability and validity. Sports Med. 4, 381–394. doi: 10.2165/00007256-198704060-00001
Bessman, S. P., and Carpenter, C. L. (1985). The creatine-creatine phosphate energy shuttle. Annu. Rev. Biochem. 54, 831–862. doi: 10.1146/annurev.bi.54.070185.004151
Bessman, S., and Savabi, F. (1988). “The role of the phosphocreatine energy shuttle in exercise and muscle hypertrophy,” in International Series on Sport Sciences: Biochemistry of Exercise, VII, eds A. Taylor, P. Gollnick, and H. Green (Champaign, IL: Human Kinetics), 167–178.
Bogdanis, G. C., Nevill, M. E., Boobis, L. H., and Lakomy, H. K. (1996). Contribution of phosphocreatine and aerobic metabolism to energy supply during repeated sprint exercise. J. Appl. Physiol. 80, 876–884. doi: 10.1152/jappl.1996.80.3.876
Bogdanis, G. C., Nevill, M. E., Lakomy, H. K., and Boobis, L. H. (1998). Power output and muscle metabolism during and following recovery from 10 and 20 s of maximal sprint exercise in humans. Acta Physiol. Scand. 163, 261–272. doi: 10.1046/j.1365-201x.1998.00378.x
Burgomaster, K. A., Heigenhauser, G. J., and Gibala, M. J. (2006). Effect of short-term sprint interval training on human skeletal muscle carbohydrate metabolism during exercise and time-trial performance. J. Appl. Physiol. 100, 2041–2047. doi: 10.1152/japplphysiol.01220.2005
Burgomaster, K. A., Howarth, K. R., Phillips, S. M., Rakobowchuk, M., Macdonald, M. J., McGee, S. L., et al. (2008). Similar metabolic adaptations during exercise after low volume sprint interval and traditional endurance training in humans. J. Physiol. 586, 151–160. doi: 10.1113/jphysiol.2007.142109
Burgomaster, K. A., Hughes, S. C., Heigenhauser, G. J., Bradwell, S. N., and Gibala, M. J. (2005). Six sessions of sprint interval training increases muscle oxidative potential and cycle endurance capacity in humans. J. Appl. Physiol. 98, 1985–1990. doi: 10.1152/japplphysiol.01095.2004
Hazell, T. J., Macpherson, R. E., Gravelle, B. M., and Lemon, P. W. (2010). 10 or 30-s sprint interval training bouts enhance both aerobic and anaerobic performance. Eur. J. Appl. Physiol. 110, 153–160. doi: 10.1007/s00421-010-1474-y
Hellsten-Westing, Y., Balsom, P. D., Norman, B., and Sjödin, B. (1993). The effect of high-intensity training on purine metabolism in man. Acta Physiol. Scand. 149, 405–412. doi: 10.1111/j.1748-1716.1993.tb09636.x
Hultman, E., Bergström, J., and Anderson, N. M. (1967). Breakdown and resynthesis of phosphorylcreatine and adenosine triphosphate in connection with muscular work in man. Scand. J. Clin. Lab. Invest. 19, 56–66. doi: 10.3109/00365516709093481
Jakeman, J., Adamson, S., and Babraj, J. (2012). Extremely short duration high-intensity training substantially improves endurance performance in triathletes. Appl. Physiol. Nutr. Metab. 37, 976–981. doi: 10.1139/h2012-083
Kaczor, J. J., Ziolkowski, W., Popinigis, J., and Tarnopolsky, M. A. (2005). Anaerobic and aerobic enzyme activities in human skeletal muscle from children and adults. Pediatr. Res. 57, 331–335. doi: 10.1203/01.PDR.0000150799.77094.DE
Larsen, R. G., Befroy, D. E., and Kent-Braun, J. A. (2013). High-intensity interval training increases in vivo oxidative capacity with no effect on P(i)–>ATP rate in resting human muscle. Am. J. Physiol. Regul. Integr. Comp. Physiol. 304, R333–R342. doi: 10.1152/ajpregu.00409.2012
Larsen, R. G., Maynard, L., and Kent, J. A. (2014). High-intensity interval training alters ATP pathway flux during maximal muscle contractions in humans. Acta Physiol. 211, 147–160. doi: 10.1111/apha.12275
Laskowski, R., Ziemann, E., Olek, R. A., and Zembron-Lacny, A. (2011). The effect of three days of judo training sessions on the inflammatory response and oxidative stress markers. J. Hum. Kinet. 30, 65–73. doi: 10.2478/v10078-011-0074-1
Lloyd Jones, M. C., Morris, M. G., and Jakeman, J. R. (2017). Impact of time and work:rest ratio matched sprint interval training programmes on performance: a randomised controlled trial. J. Sci. Med. Sport 20, 1034–1038. doi: 10.1016/j.jsams.2017.03.020
McGarr, G. W., Hartley, G. L., and Cheung, S. S. (2014). Neither short-term sprint nor endurance training enhances thermal response to exercise in a hot environment. J. Occup. Environ. Hyg. 11, 47–53. doi: 10.1080/15459624.2013.816429
Meinild Lundby, A. K., Jacobs, R. A., Gehrig, S., De Leur, J., Hauser, M., Bonne, T. C., et al. (2018). Exercise training increases skeletal muscle mitochondrial volume density by enlargement of existing mitochondria and not de novo biogenesis. Acta Physiol. 222:e12905. doi: 10.1111/apha.12905
Olek, R. A., Kujach, S., Wnuk, D., and Laskowski, R. (2014). Single sodium pyruvate ingestion modifies blood acid-base status and post-exercise lactate concentration in humans. Nutrients 6, 1981–1992. doi: 10.3390/nu6051981
Olek, R. A., Safranow, K., Jakubowska, K., Olszewska, M., Chlubek, D., and Laskowski, R. (2012). Allopurinol intake does not modify the slow component of V(.)O(2) kinetics and oxidative stress induced by severe intensity exercise. Physiol. Res. 61, 89–96.
Olek, R. A., Ziolkowski, W., Wierzba, T. H., and Kaczor, J. J. (2013). Effect of ethyl pyruvate on skeletal muscle metabolism in rats fed on a high fat diet. Nutrients 5, 2372–2383. doi: 10.3390/nu5072372
Parolin, M. L., Chesley, A., Matsos, M. P., Spriet, L. L., Jones, N. L., and Heigenhauser, G. J. (1999). Regulation of skeletal muscle glycogen phosphorylase and PDH during maximal intermittent exercise. Am. J. Physiol. 277, E890–E900. doi: 10.1152/ajpendo.1999.277.5.E890
Parra, J., Cadefau, J. A., Rodas, G., Amigó, N., and Cussó, R. (2000). The distribution of rest periods affects performance and adaptations of energy metabolism induced by high-intensity training in human muscle. Acta Physiol. Scand. 169, 157–165. doi: 10.1046/j.1365-201x.2000.00730.x
Rasmussen, U. F., Rasmussen, H. N., Krustrup, P., Quistorff, B., Saltin, B., and Bangsbo, J. (2001). Aerobic metabolism of human quadriceps muscle: in vivo data parallel measurements on isolated mitochondria. Am. J. Physiol. Endocrinol. Metab. 280, E301–E307. doi: 10.1152/ajpendo.2001.280.2.E301
Richardson, A. J., and Gibson, O. R. (2015). Simulated hypoxia does not further improve aerobic capacity during sprint interval training. J. Sports Med. Phys. Fitness 55, 1099–1106.
Richardson, A. J., Relf, R. L., Saunders, A., and Gibson, O. R. (2016). Similar inflammatory responses following sprint interval training performed in hypoxia and normoxia. Front. Physiol. 7:332. doi: 10.3389/fphys.2016.00332
Rodas, G., Ventura, J. L., Cadefau, J. A., Cussó, R., and Parra, J. (2000). A short training programme for the rapid improvement of both aerobic and anaerobic metabolism. Eur. J. Appl. Physiol. 82, 480–486. doi: 10.1007/s004210000223
Schantz, P. G., Sjöberg, B., and Svedenhag, J. (1986). Malate-aspartate and alpha-glycerophosphate shuttle enzyme levels in human skeletal muscle: methodological considerations and effect of endurance training. Acta Physiol. Scand. 128, 397–407. doi: 10.1111/j.1748-1716.1986.tb07993.x
Skleryk, J. R., Karagounis, L. G., Hawley, J. A., Sharman, M. J., Laursen, P. B., and Watson, G. (2013). Two weeks of reduced-volume sprint interval or traditional exercise training does not improve metabolic functioning in sedentary obese men. Diabetes Obes. Metab. 15, 1146–1153. doi: 10.1111/dom.12150
Sloth, M., Sloth, D., Overgaard, K., and Dalgas, U. (2013). Effects of sprint interval training on VO2max and aerobic exercise performance: a systematic review and meta-analysis. Scand. J. Med. Sci. Sports 23, e341–e352. doi: 10.1111/sms.12092
Spriet, L. L., Howlett, R. A., and Heigenhauser, G. J. (2000). An enzymatic approach to lactate production in human skeletal muscle during exercise. Med. Sci. Sports Exerc. 32, 756–763. doi: 10.1097/00005768-200004000-00007
Stöggl, T. L., and Sperlich, B. (2015). The training intensity distribution among well-trained and elite endurance athletes. Front. Physiol. 6:295. doi: 10.3389/fphys.2015.00295
Thompson, W. R. (2017). Worldwide survey of fitness trends for 2018: the CREP edition. ACSM's Health Fitness J. 21, 10–19. doi: 10.1249/FIT.0000000000000341
Vigelsø, A., Andersen, N. B., and Dela, F. (2014). The relationship between skeletal muscle mitochondrial citrate synthase activity and whole body oxygen uptake adaptations in response to exercise training. Int. J. Physiol. Pathophysiol. Pharmacol. 6, 84–101.
Vollaard, N. B. J., Metcalfe, R. S., and Williams, S. (2017). Effect of number of sprints in an SIT session on change in VO2max: a meta-analysis. Med. Sci. Sports Exerc. 49, 1147–1156. doi: 10.1249/MSS.0000000000001204
Ziemann, E., Grzywacz, T., Łuszczyk, M., Laskowski, R., Olek, R. A., and Gibson, A. L. (2011). Aerobic and anaerobic changes with high-intensity interval training in active college-aged men. J. Strength Cond. Res. 25, 1104–1112. doi: 10.1519/JSC.0b013e3181d09ec9
Ziemann, E., Olek, R. A., Grzywacz, T., Antosiewicz, J., Kujach, S., Łuszczyk, M., et al. (2013). Whole-body cryostimulation as an effective method of reducing low-grade inflammation in obese men. J. Physiol. Sci. 63, 333–343. doi: 10.1007/s12576-013-0269-4
Zinner, C., Morales-Alamo, D., Ørtenblad, N., Larsen, F. J., Schiffer, T. A., Willis, S. J., et al. (2016). The physiological mechanisms of performance enhancement with sprint interval training differ between the upper and lower extremities in humans. Front. Physiol. 7:426. doi: 10.3389/fphys.2016.00426
Keywords: Wingate anaerobic test, all-out exercise, skeletal muscle, enzyme activity, recovery
Citation: Olek RA, Kujach S, Ziemann E, Ziolkowski W, Waz P and Laskowski R (2018) Adaptive Changes After 2 Weeks of 10-s Sprint Interval Training With Various Recovery Times. Front. Physiol. 9:392. doi: 10.3389/fphys.2018.00392
Received: 13 November 2017; Accepted: 29 March 2018;
Published: 17 April 2018.
Edited by:
Thomas Leonhard Stöggl, University of Salzburg, AustriaReviewed by:
Antonio Paoli, Università degli Studi di Padova, ItalyAnthony John Blazevich, Edith Cowan University, Australia
Copyright © 2018 Olek, Kujach, Ziemann, Ziolkowski, Waz and Laskowski. This is an open-access article distributed under the terms of the Creative Commons Attribution License (CC BY). The use, distribution or reproduction in other forums is permitted, provided the original author(s) and the copyright owner are credited and that the original publication in this journal is cited, in accordance with accepted academic practice. No use, distribution or reproduction is permitted which does not comply with these terms.
*Correspondence: Robert A. Olek, robol@awf.gda.pl