 Hua-Juan Shi
 Wen-Bin Liu
- Key Laboratory of Aquatic Nutrition and Feed Science of Jiangsu Province, College of Animal Science and Technology, Nanjing Agricultural University, Nanjing, China
The RNA-binding protein quaking-a (Qkia) was cloned from the liver of blunt snout bream Megalobrama amblycephala through the rapid amplification of cDNA ends method, with its potential role in glucose metabolism investigated. The full-length cDNA of qkia covered 1,718 bp, with an open reading frame of 1,572 bp, which encodes 383 AA. Sequence alignment and phylogenetic analysis revealed a high degree of conservation (97–99%) among most fish and other higher vertebrates. The mRNA of qkia was detected in all examined organs/tissues. Then, the plasma glucose levels and tissue qkia expressions were determined in fish intraperitoneally injected with glucose [1.67 g per kg body weight (BW)], insulin (0.052 mg/kg BW), and glucagon (0.075 mg/kg BW) respectively, as well as in fish fed two dietary carbohydrate levels (31 and 41%) for 12 weeks. Glucose administration induced a remarkable increase of plasma glucose with the highest value being recorded at 1 h. Thereafter, it reduced to the basal value. After glucose administration, qkia expressions significantly decreased with the lowest value being recorded at 1 h in liver and muscle and 8 h in brain, respectively. Then they gradually returned to the basal value. The insulin injection induced a significant decrease of plasma glucose with the lowest value being recorded at 1 h, whereas the opposite was true after glucagon load (the highest value was gained at 4 h). Subsequently, glucose levels gradually returned to the basal value. After insulin administration, the qkia expressions significantly decreased with the lowest value being attained at 2 h in brain and muscle and 1 h in liver, respectively. However, glucagon significantly stimulated the expressions of qkia in tissues with the highest value being gained at 6 h. Moreover, high dietary carbohydrate levels remarkably increased plasma glucose levels, but down-regulated the transcriptions of qkia in tissues. These results indicated that the gene of blunt snout bream shared a high similarity with that of the other vertebrates. Glucose and insulin administration, as well as high-carbohydrate feeding, remarkably down-regulated its transcriptions in brain, muscle and liver, whereas the opposite was true after the glucagon load.
Introduction
Carbohydrates are regarded as the cheapest energy source for aquatic animals due to their rich availability and relatively low cost. The incorporation of this nutrient in diets could improve the physical quality of feed, promote the growth performance of aquatic species and spare proteins from being used as energy (Hemre et al., 2002). Of greater physiological importance is its potential to provide metabolic intermediates for the synthesis of various biologically compounds (Wilson, 1994). However, it is generally acknowledged that fish have a poor capability to utilize glucose for energy purposes compared with mammals (Polakof et al., 2012). Generally, most fish species (especially carnivorous ones) have an impaired glucose tolerance and often display a prolonged postprandial hyperglycemia after a glucose load or the intake of high-carbohydrate diets (Moon, 2001). To date, the underlying mechanisms for the sluggish glucose intolerance and poor carbohydrate utilization in fish are still barely understood, although several hypotheses have been proposed, such as the higher potential of amino acids compared with glucose as insulinotropins, few insulin receptors, a poor inhibition of postprandial gluconeogenesis, a low capacity of de novo lipogenesis to store excess glucose, etc. (Enes et al., 2009). Recently, researchers have extended this notion to post-transcriptional gene regulation in fish in order to get some enlightenment (Craig et al., 2014). Accordingly, certain progress has been made in understanding the potential roles of post-transcriptional regulators in metabolically active and insulin-sensitive tissues (Miao et al., 2017). This suggested that the post-transcriptional regulation might be closely implicated in the intermediary metabolism and cellular homeostasis in fish. Considering this, investigations regarding the molecular characterization and nutritional regulation of these post-transcriptional regulators will undoubtedly facilitate our understanding of the carbohydrate utilization by fish.
To date, various molecules have been demonstrated to be involved in the post-transcriptional regulation of gene expression, mainly including microRNAs (miRNAs) and RNA-binding proteins (RBPs) (Lobbardi et al., 2011). Within this latter category, quaking (QKI) proteins are evolutionarily conserved RBPs, belonging to the STAR (signal transduction and activation of RNA metabolism) family (Vernet and Artzt, 1997). QKI contains a single K-Homology (KH) motif, a prevalent RNA-binding domain that generally recognizes and binds a specific sequence in the 3′-UTR (untranslated region) of the target mRNAs (Lobbardi et al., 2011). Through this, QKI participates in the post-transcriptional mRNA processing, including spliceosomal complex formation, pre-RNA splicing, and mRNA export, stability, localization, and translation (Galarneau and Richard, 2005). Until now, three isoforms of QKI (namely QKI5, QKI6, and QKI7) have been characterized in mammals (Ebersole et al., 1996). These isoforms are distinguished by both the size of the molecules and the C-terminal amino acid sequence. In the past few decades, QKI has been identified to regulate diverse biological processes, such as organogenesis, cell differentiation, embryonic development and major depressive disorder (Klempan et al., 2009; Artzt and Wu, 2010; Radomska et al., 2016). However, its implications in the intermediary metabolism still remain unclear. Recently, QKI has been linked to the pathogenesis and pathophysiology of some metabolic diseases (especially the type 2 diabetes and obesity) in mammals, highlighting its important roles in normal physiology and metabolic disorders. For example, the knockdown of QKI resulted in compromised gluconeogenesis and fatty acid oxidation, which is related to the steatosis and glucose intolerance in obese mice (Lu, 2014). In addition, QKI has been demonstrated to control the adaptive hepatic energy metabolism under fasting conditions through deacetylation (Lu, 2014). However, the aforementioned information are generally derived from mammals, literature concerning the molecular and functional analysis of qki in aquatic animals is still quite limited. To date, to our best knowledge, the piscine paralogs of qki have been characterized only in zebrafish (Danio rerio), which comprises three homologs of qki (namely qkia, qki2 and qkib) corresponding to those of mammals (Radomska et al., 2016). In addition, their potential roles in both embryo and muscle development have also been confirmed, suggesting that qki might be a key regulator of biological processes in fish (Tanaka et al., 1997; Lobbardi et al., 2011; Radomska et al., 2016). However, their implications in metabolic processes are still barely understood, as warrants further studies.
Blunt snout bream Megalobrama amblycephala is one of the most important economic freshwater fish in China with a worldwide distribution. In recent years, the need to maximize the profit inevitably leads to a high incorporation of carbohydrates in its feed. However, high dietary carbohydrate levels might induce metabolic disorders of this species, as consequently results in the increasing outbreaks of fatty liver disease (Prathomya et al., 2017; Prisingkorn et al., 2017). This emphasizes the urgent need to investigate the intermediary carbohydrate metabolism of this species, which unfortunately is still barely understood. Recently, a study has identified the miRNAs involved in the glucose metabolism of this species, highlighting the pivotal roles of post-transcriptional regulation in the intermediary carbohydrate metabolism of this species (Miao et al., 2017). However, such information for RBPs (a key post-transcriptional regulator) is still unavailable. Therefore, the present study was conducted to (1) clone the full-length cDNA of the RNA-binding protein qkia from the liver of M. amblycephala; (2) to determine its tissue distribution; (3) to illuminate the tissue responsiveness to glucose, insulin and glucagon load, respectively, in the metabolically active and insulin-sensitive tissues; (4) to investigate its transcriptional response to the long-term feeding of high-carbohydrate diets.
Materials and Methods
Ethics Statement
The use of experimental animals in the present study has been approved by the Animal Care and Use Committee of Nanjing Agricultural University (Nanjing, China). All experimental procedures involving animals were conducted following the Guidelines for the Care and Use of Laboratory Animals in China.
Fish Culture
Blunt snout bream (average weight: 42.6 ± 0.4 g) were obtained from the National Fish Hatchery Station in Yangzhou (Jiangsu, China). Before the experiment, fish were kept in 10 indoor tanks (200 L each) at a stocking density of 25 fish per tank for 1 month to acclimate to the experimental conditions by feeding a commercial diet, which contains 32% protein and 31% nitrogen-free extract (Shuaifeng Feed Co., Ltd., Nanjing, Jiangsu province, China). Fish meal, soybean meal, rapeseed meal and cottonseed meal served as protein sources in this feed, whereas wheat bran and middlings were both adopted as the main carbohydrate sources. During this period, water temperature ranged from 26 to 28°C, pH varied from 7.1 to 7.4, and total ammonia-nitrogen was maintained below 0.2 mg/L. Then, fish were starved for 24 h, and were later divided into three parts: one for cDNA cloning and the determination of qkia transcriptions in various tissues, one for the glucose tolerance test (GTT) and the other for the insulin tolerance test (ITT).
Total RNA Extraction
Four fish were randomly selected and rapidly anesthetized in diluted MS-222 (tricaine methanesulfonate, Sigma, United States) at the concentration of 100 mg/L. Then, they were sampled for 10 organs/tissues, including white muscle, liver, intestine, mesenteric adipose tissue, heart, kidney, brain, spleen, gill, and eye. The samples were kept at -80°C until analysis.
Total RNA was extracted from the samples aforementioned using Trizol reagent (Invitrogen, Carlsbad, CA, United States). RNA samples were treated by RQ1 RNase-free DNase (Takara Co. Ltd., Japan) to eliminate genomic DNA contamination. Its quantity and purity was determined by spectrophotometric analysis (the 260/280 nm ratio) and electrophoresis (1.0% formaldehyde denaturing agarose gels).
cDNA Synthesis and 3′ and 5′ RACE
Reverse transcription was conducted using the total RNA from the liver of blunt snout bream as template and oligo(dT)18 as primer using an AMV First Strand cDNA Synthesis Kit (GeneCopoeia, Rockville, MD, United States), following the manufacturer’s instructions. Degenerated primers (namely qkiaF and qkibR) (Table 1) were designed based on highly conserved regions from the available sequence of zebrafish in GenBank. PCR amplification was made with 2 μL of RT reactions in a total volume of 50 μL and 2.5 U of Platinum Taq DNA Polymerase (Invitrogen). The PCR cycling conditions were set as follows: one cycle of 94°C for 4 min, 30 cycles of 94°C for 40 s, 52°C for 40 s, and 72°C for 60 s followed by one cycle of 72°C for 7 min. The PCR products were separated by agarose gel electrophoresis, and delivered to Shanghai Sangon Biotech Service Co., Ltd. (Shanghai, China) for sequencing. Sequencing was performed in both forward and reverse directions by an ABI PRISM® 377 DNA automated sequencer (Applied Biosystems). The forward and reverse sequences were assembled using the SeqMan II software in DNASTAR package version 5.01, and the core fragment of qkia was obtained. Then, specific primers were designed for the 3′ and 5′ RACE according to this sequence.
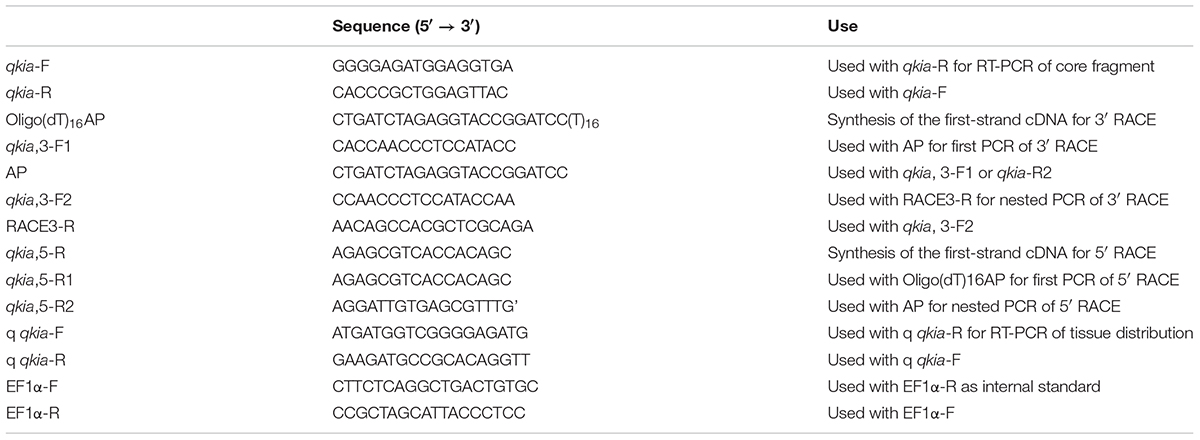
TABLE 1. Primers used for the cDNA cloning of qkia and RT-PCR.
The 3′ end was amplified with a 3′-full RACE (rapid amplification of cDNA end) Core Set (Takara, Dalian, China) following the instructions. Firstly, 2 μg of total RNA was reverse-transcribed using Oligo(dT)16AP as the primer to obtain the first strand cDNA. Then, it was diluted to 1:10 with dH2O, and was used as a template for PCR. The cDNA was amplified by a specific forward primer qkia3-F1 and a reverse primer AP containing the anchor sequence. After this, a dilution (0.1%) of the original PCR was re-amplified using a reverse primer RACE3-R and a specific forward primer qkia3-F2. The nested PCR product was sequenced by the electrophoresis analysis aforementioned. The primers used were shown in Table 1.
The 5′ RACE was performed using the SMARTerTM RACE cDNA Amplification Kit (Clontech). Reverse transcription of 2 μg total RNA was made with a specific reverse primer qkia-R to obtain the first strand cDNA. Then, the purified cDNA was used in the TdT-tailing reaction. Tailed cDNA was amplified by prime pairs qkia5-R1/Oligo (dT)16 AP. The first PCR product was diluted to 1:10 with dH2O, and was used as a template for the nested PCR, which was performed with AP and qkia5-R2. The nested PCR product was sequenced following the methods detailed above. The primers used were shown in Table 1.
Sequence Alignment, Structure Prediction, and Phylogenetic Analysis of qkia
The full-length cDNA of qkia was assembled by the SeqMan II software in DNA Star Package (version 5.01). Then, the amino acids (AA) sequences were obtained by an online Open Reading Frame (ORF) Finder program1. The molecular weight (MW) and isoelectric point (PI) of the Qkia protein was both predicted using the Compute pI/Mw software at http://cn.expasy.org/tools/pi_tool.html. The NCBI Conserved Domain Search2 was used to predict the conserved functional sites. The secondary and three-dimensional (3D) structures of Qkia protein were predicted by the SABLE program3 and the SWISS-MODEL program4, respectively. Multiple alignments were generated by the Clustal program in DNA Star package (version 5.01). The phylogenetic analyses were carried out based on the AA sequences using the Neighbor-Joining algorithm method within the MEGA 4.0 program and the reliability of this estimated tree was evaluated by the bootstrap method with 1000 pseudo-replications.
GTT and ITT
For GTT, four fish were randomly collected and slightly anesthetized in neutralized MS-222 (Sigma, St. Louis, MO, United States) at the concentration of 100 mg/L. Then they were sacrificed. Blood, brain, muscle and liver was quickly collected, which were used for time 0 h. The remaining 48 fish (the fish number was 56 in total) were equally divided into two groups, and individually weighed and intraperitoneally injected with either glucose [1.67 g glucose per kg body weight (BW)] or saline solution (16.7 ml/kg BW, the sham treatment) within 10 min (Li et al., 2016). A saline solution (0.9%) containing 100 mg glucose per ml was used for that purpose. After administration, fish were immediately transferred to 12 small tanks (100 L each) at a density of four fish per tank. The fish in each treatment were anesthetized and sampled at 1, 2, 4, 8, 12, and 24 h, respectively, after injection. One aquarium was used for each sampling time in order to minimize the stress due to sampling. Blood, brain, muscle, and liver was quickly collected. The blood was centrifuged at 2500 rpm at 4°C for 10 min. Then, both the supernatant and tissues were stored at -80°C for further analysis.
For ITT, the samples for time 0 h were obtained following the procedures detailed in GTT. Then, the remaining 84 fish were equally divided into three groups, and individually weighted and injected intraperitoneally with bovine insulin (0.052 mg/kg BW, Sigma, United States) (Jin et al., 2014), bovine glucagon (0.075 mg/kg BW, Shanghai Rongbai Biological Technology Co., Ltd., China) (Albalat et al., 2005) or saline solution (1.0 ml/kg BW, the sham treatment), respectively. A saline solution (0.9%) containing either 0.052 mg insulin per ml or 0.075 mg glucagon per ml was used for that purpose. Then, fish of each treatment were immediately transferred to seven small tanks at a density of four fish per tank with their blood, brain, muscle, and liver sampled at 1, 2, 4, 6, 8, 12, and 24 h, respectively, after injection following the procedures detailed in GTT. It should be mentioned here that glucagon was adopted in ITT as a supplement to investigate the transcriptional responses of qkia to different hormones in order to better understand the potential roles of qkia in glucose metabolism.
Feeding Trial
After the GTT and ITT, another group of fish (average weight: 24.24 ± 0.05 g) were subjected to a feeding trial. Briefly, after acclimation, 160 fish were randomly and equally distributed into eight tanks (300 L each) at a stocking density of 20 juveniles per tank in a recirculating aquaculture system. Then, fish were “hand-fed to apparent” satiation three times daily (07:00, 12:00, and 17:00 h) for 12 weeks with one of two isonitrogenous (30% crude protein) diets (Table 2) containing either 31% (control diet) or 41% (high carbohydrate diet) nitrogen-free extract (Li et al., 2013, 2014). Each diet was tested in four tanks. During this period, a 12:12 h light: dark regime (07:00 to 19:00 h light period) was maintained by timed fluorescent lighting. Aeration was provided during the 24 h. Water temperature ranged from 26 to 28°C, pH from 7.1 to 7.4, and total ammonia-nitrogen was maintained below 0.2 mg/L. At the termination of the feeding trial, fish were starved for 24 h for gut clearance. Then, fish were slightly anesthetized. Four fish per tank were quickly collected for blood, brain, liver, and muscle, which were treated and stored following the procedures aforementioned.
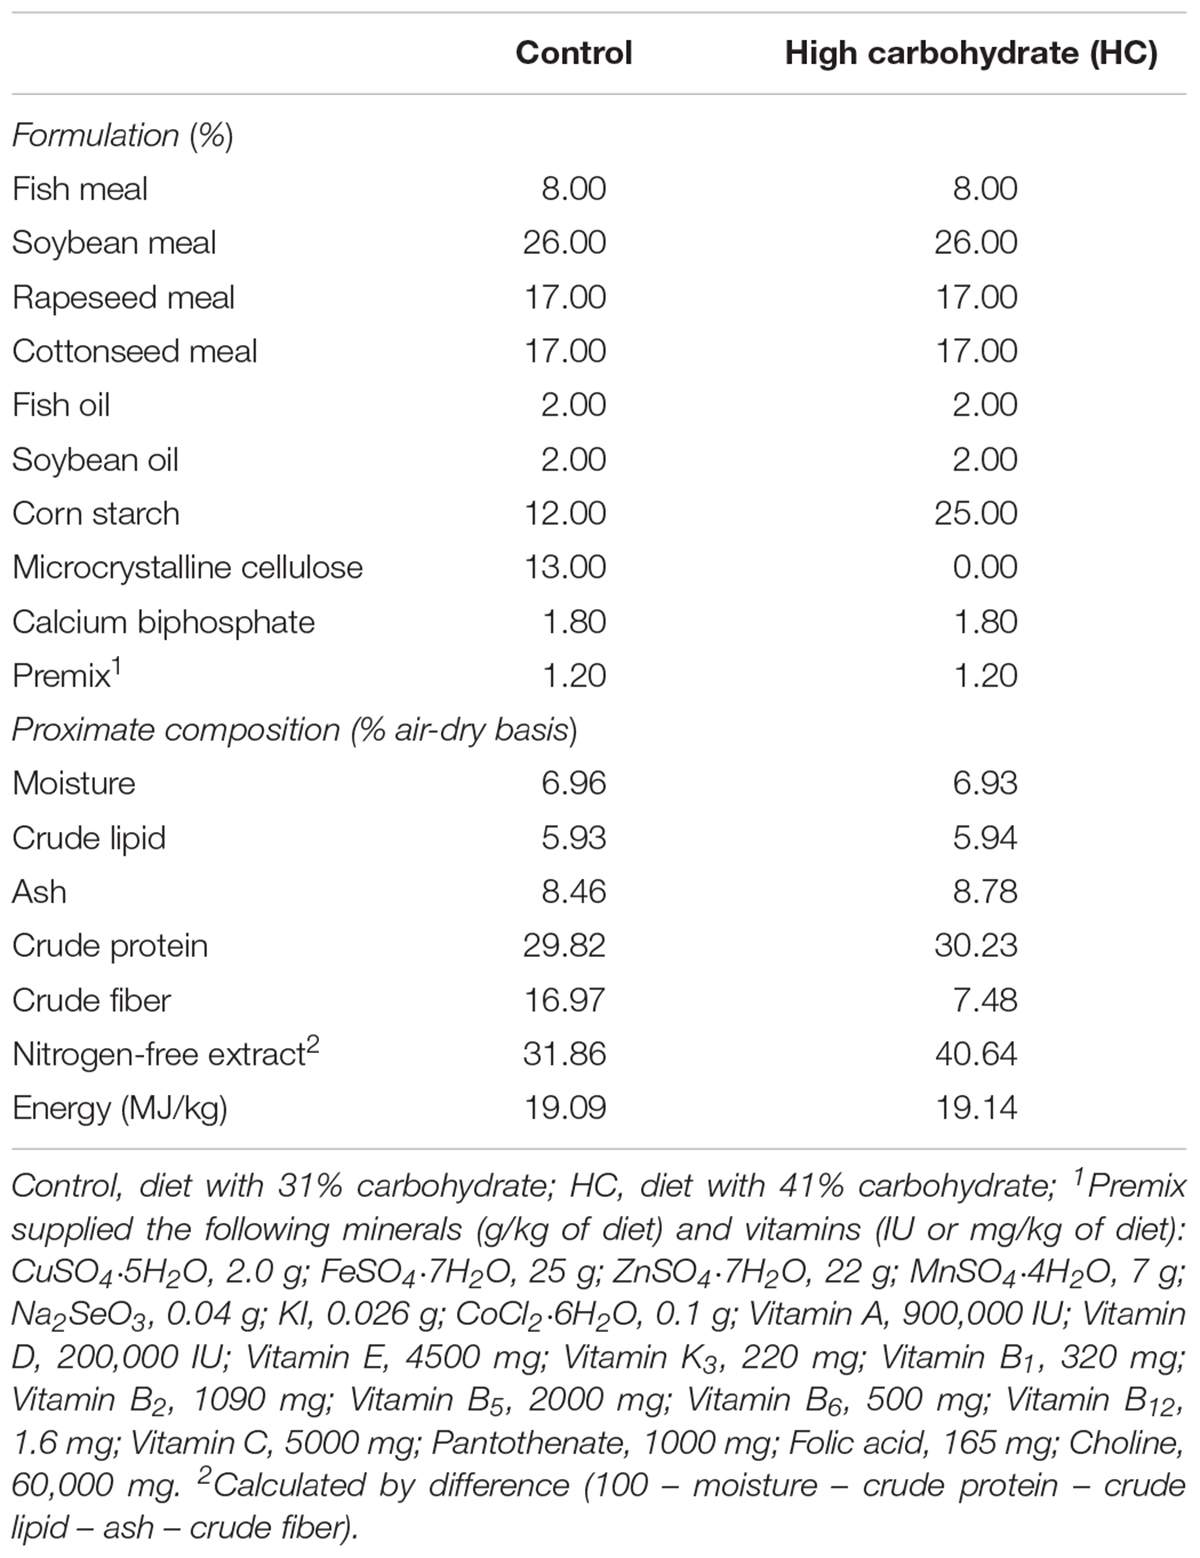
TABLE 2. Formulation and proximate composition of the different experimental diets.
Analysis of Proximate Composition and Plasma Glucose Levels
The proximate composition of diets and fish was ensured based on the standard AOAC method. Moisture was determined by oven drying at 105°C until constant weight. Crude protein content (nitrogen × 6.25) was measured by the micro-Kjeldahl method using an Auto Kjeldahl System (FOSS KT260, Switzerland). Crude lipid was determined by solvent extraction using the Soxtec System HT (Soxtec System HT6, Tecator, Sweden) and ash by combustion at 550°C for 4 h. Gross energy was determined using a Bomb Calorimeter (PARR 1281, Parr Instrument Company, Moline, IL, United States). Crude fiber was determined by the fritted glass crucible method using an automatic analyzer (ANKOM A2000i, Macedon, New York, NY, United States). Plasma glucose was measured using the glucose oxidase method (Asadi et al., 2009).
Real-Time PCR
The mRNA expression of qkia was quantified by semi-quantitative RT-PCR. For tissue distribution, total RNA was extracted from 10 tissues and/or organs as aforementioned with the quantity, purity and integrity tested. Equal quantities of each total RNA (2 μg) (as template) and Oligo(dT)18 (as primer) were used to reverse-transcribe the respective RNA. The resulting first strand cDNA was diluted and used as template for PCRs. PCR reactions were conducted using the CFX96 TouchTM Deep Well Real-Time PCR Detection System (Bio-Rad). Amplifications were performed in a reaction volume of 20 μL, containing 2 μL DNA sample, 10 μL 2 × SYBR green Real time PCR Master Mix (Takara, Dalian, China), 0.2 μL of each primer (qkiaF2 and qkiaR2 in Table 1) and 7.6 μL H2O. The PCR conditions were set as follows: 3 min at 95°C, followed by 45 cycles of 40 s at 95°C, and 40 s at 62°C. Each sample was run in triplicate. PCR reactions without the addition of the template were used as negative controls. At the end of the reaction, the fluorescent data were converted into Ct values. Each transcript level was normalized to EF1α (Zhang et al., 2013) using the 2-ΔΔCT method (Livak and Schmittgen, 2001). It should be mentioned that all the PCRs were highly specific and reproducible (0.998 > R2 > 0.983), and all primer pairs had equivalent PCR efficiencies (from 0.89 to 1.14).
Tissue qkia expressions of fish in the GTT, ITT and after the feeding trial were also measured following the procedures detailed above.
Statistical Analysis
The data concerning the tissue distribution of qkia and its transcription as well as plasma glucose levels after high-carbohydrate feeding were analyzed by one-way ANOVA using the SPSS 16.0 for Windows software package, after testing the homogeneity of variances with the Levene test. Unlikely, data regarding plasma glucose levels and tissue qkia expressions after the intraperitoneal load of glucose, insulin, and glucagon were analyzed by two-way ANOVA for significant differences among treatment means based on sampling time, injection type and their interaction. If significant differences were observed (P < 0.05) in the interaction, each factor was further analyzed separately by one-way ANOVA. Specifically, data among different sampling time within each treatment was analyzed by one-way ANOVA. Data among the different treatments at each sampling time was also analyzed by one-way ANOVA. Significant differences among groups were determined by Tukey’s multiple range test. All data were presented as means ± SEM (standard error of the mean).
Results
Molecular Characterization of the qkia Gene
In this study, the full-length cDNA encoding qkia (GenBank accession number: KY444733) was characterized from the liver of M. amblycephala. As was presented in Figure 1, the full-length cDNA covered 1,718 bp, with an ORF of 1,152 bp encoding 383 AA. The 5′-UTR covered 149 nt. An ATG initiation codon was observed 150 nt downstream of the 5′-start, and a TAA stop codon was present 418 nt upstream of the 3′-end. The 3′-UTR covered 417 nt including one AATAAA motifs, which represents putative polyadenylation signals (nt 1,479–1,484). The Qkia protein has a calculated MW of 42203.74 Da and PI of 8.34. This AA sequence contains several conserved functional sites, including one G-X-X-G motif (Gly105-Gly108), 10 RNA-binding sites (Tyr97-Asn98, Val100-Arg102, Leu104-Gly108, Ala111, Ile122-Gly126, Ser129-Arg131, Lys192, Leu195-Met196, Leu198-Ala199, and Gly203-Arg206), one STAR (signal transducer and activator of RNA)_dimer (Arg11-His69), one SF1_like-KH [Splicing factor 1 (SF1) K homology RNA-binding domain (KH)] (Gln84-Arg206) and one Quaking_NLS (Putative nuclear localization signal of quaking) (Met356-Asn383). Based on the results predicted by the online SABLE program, the secondary structure of this Qkia protein consists of 5 α-helices, 5 β-strands and 11 C-coils (Supplementary Figure S1). The 3D model constructed was shown in Supplementary Figure S2.
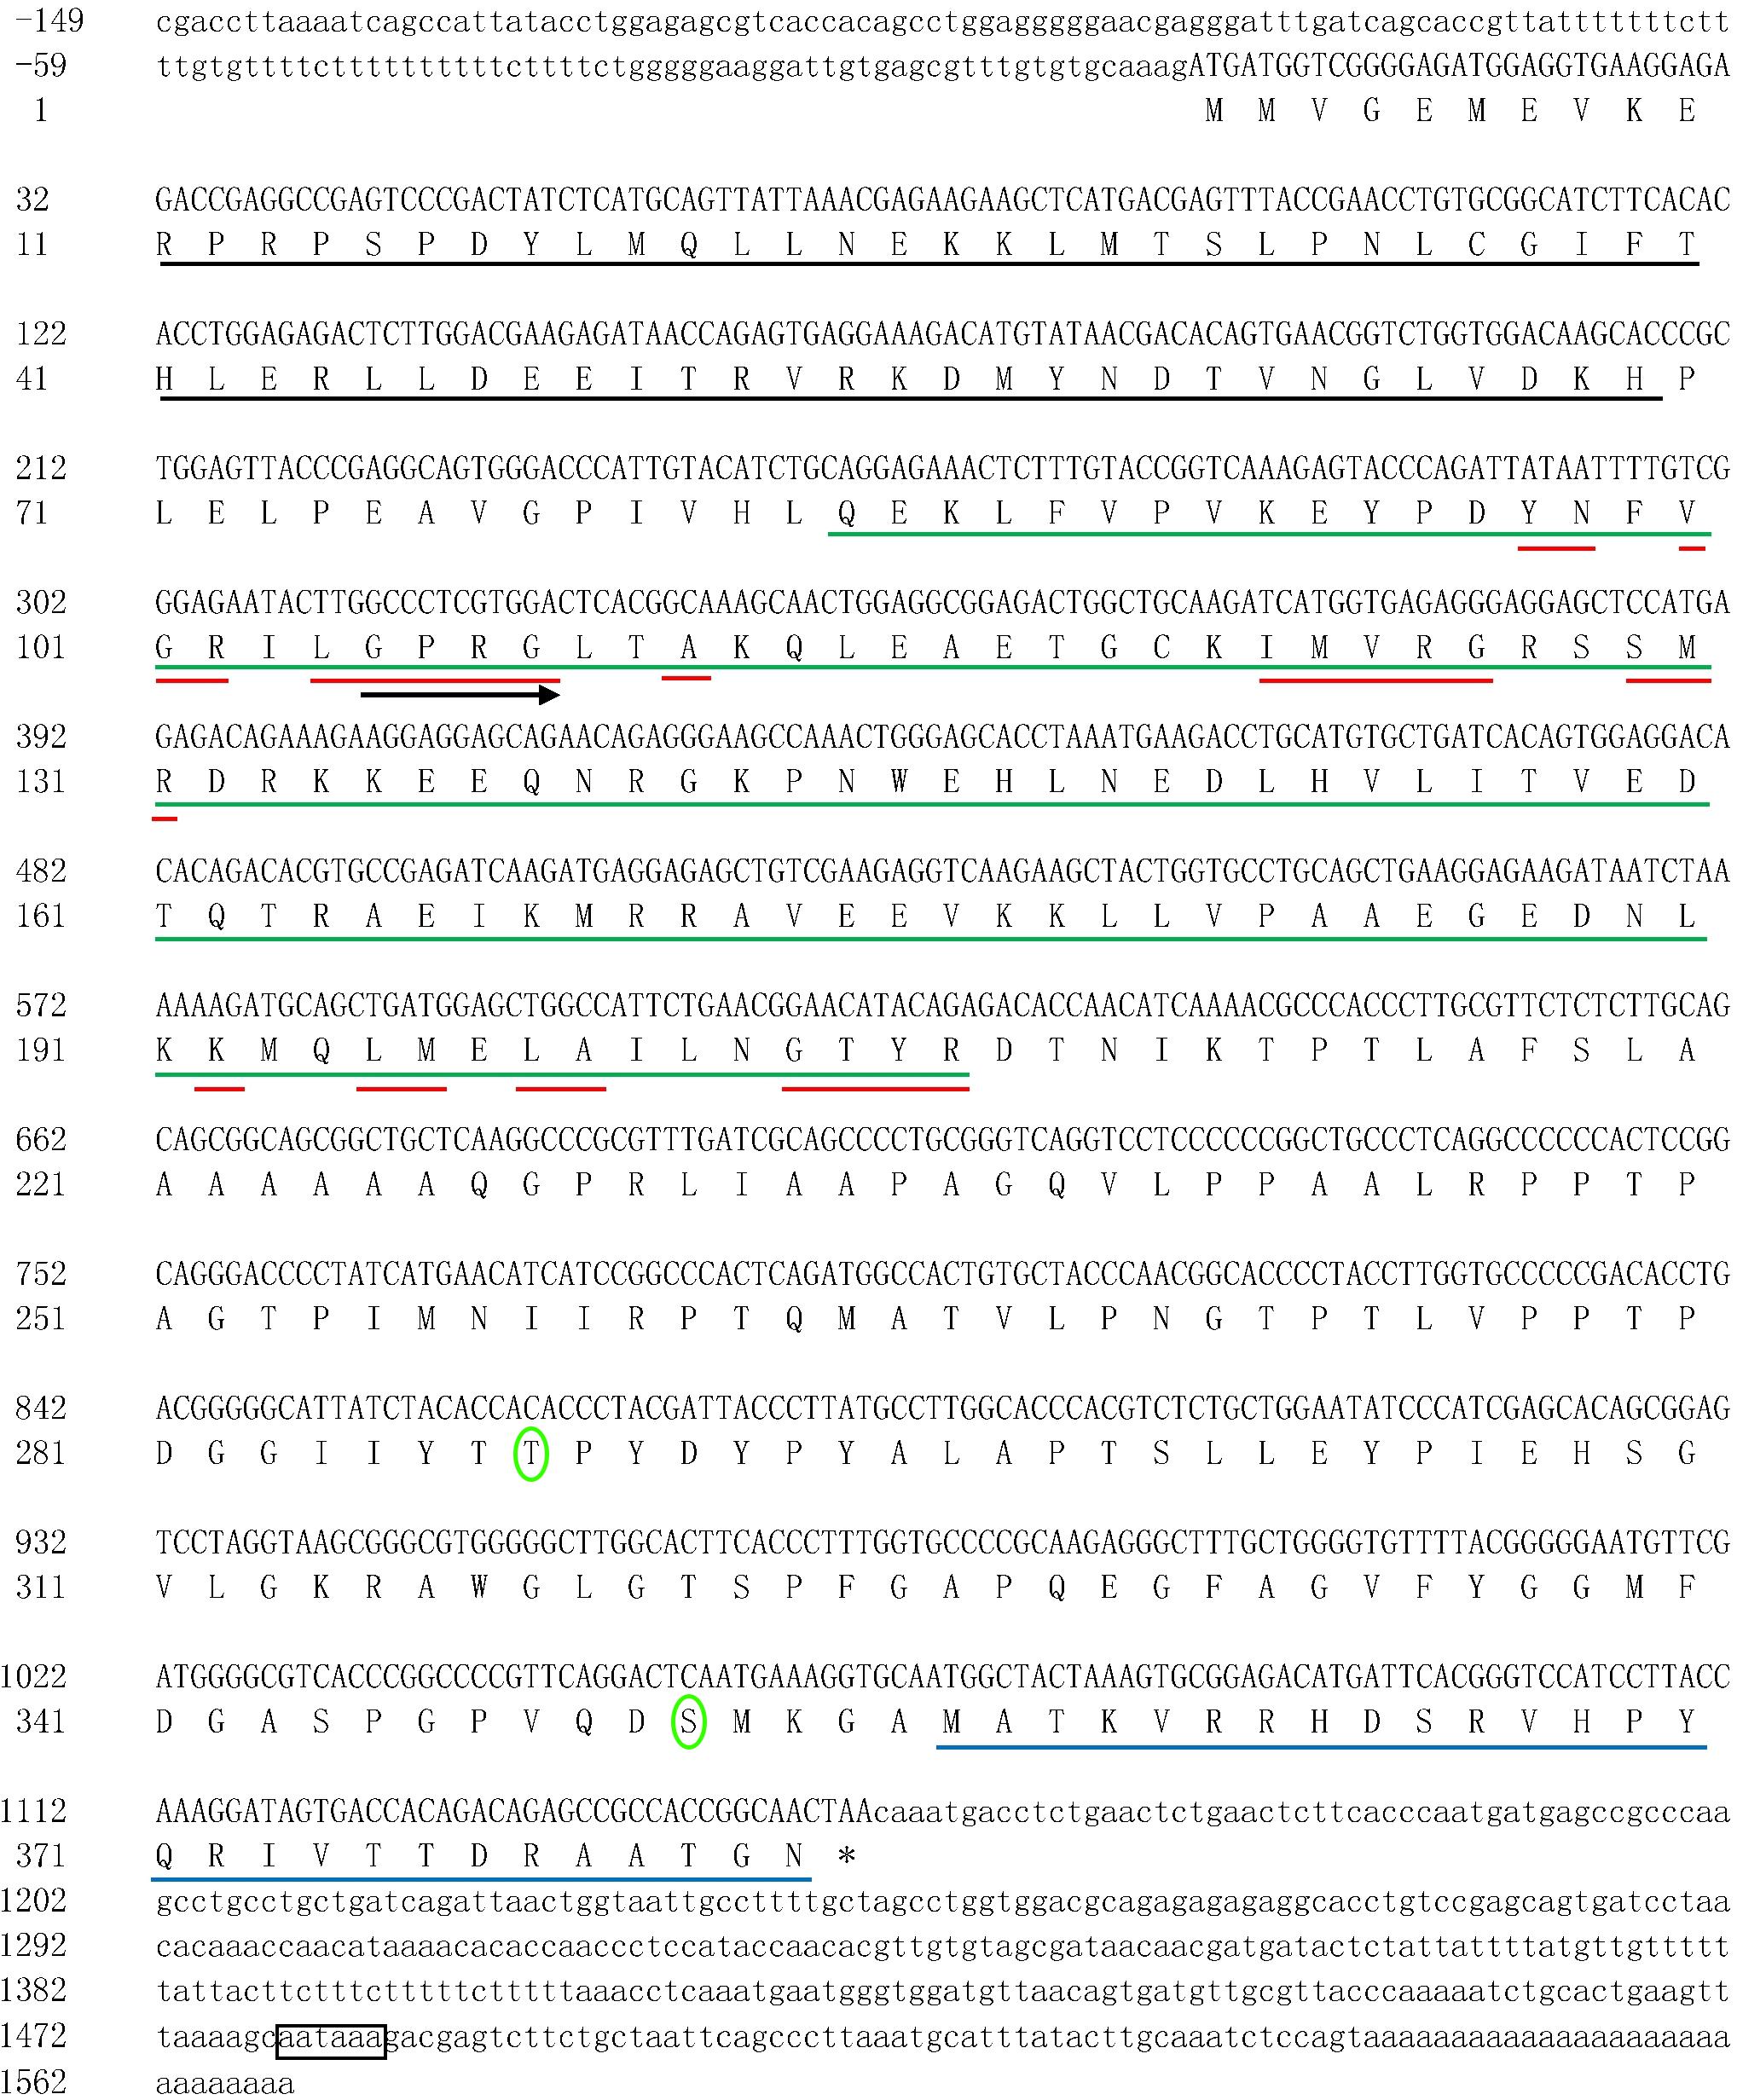
FIGURE 1. The nucleotide sequence of the qkia cDNA in blunt snout bream, and the deduced amino acid sequence. Uppercase letters indicate the translated region, whereas lowercase letters represent the untranslated region. Blank line indicates the STAR_dimer, green line reveals the SF1_like-KH, red line suggests the potential RNA-binding sites, and blue line represents the Quaking_NLS. Right arrow indicates the G-X-X-G motif. An asterisk suggests the termination codon. The phosphorylated sites are circled and the polyadenylation signal is boxed. The nucleotide sequence was submitted to NCBI GenBank, accession number: KY_444733.
In addition, the Qkia protein of blunt snout bream has a high similarity, and shows similar structural features to that of the other piscine species (Figure 2). Complete AA sequence alignment showed the best identity with common carp (the homology is 97%), and less identity with rainbow trout (Oncorhynchus mykiss) (the homology is 84%).
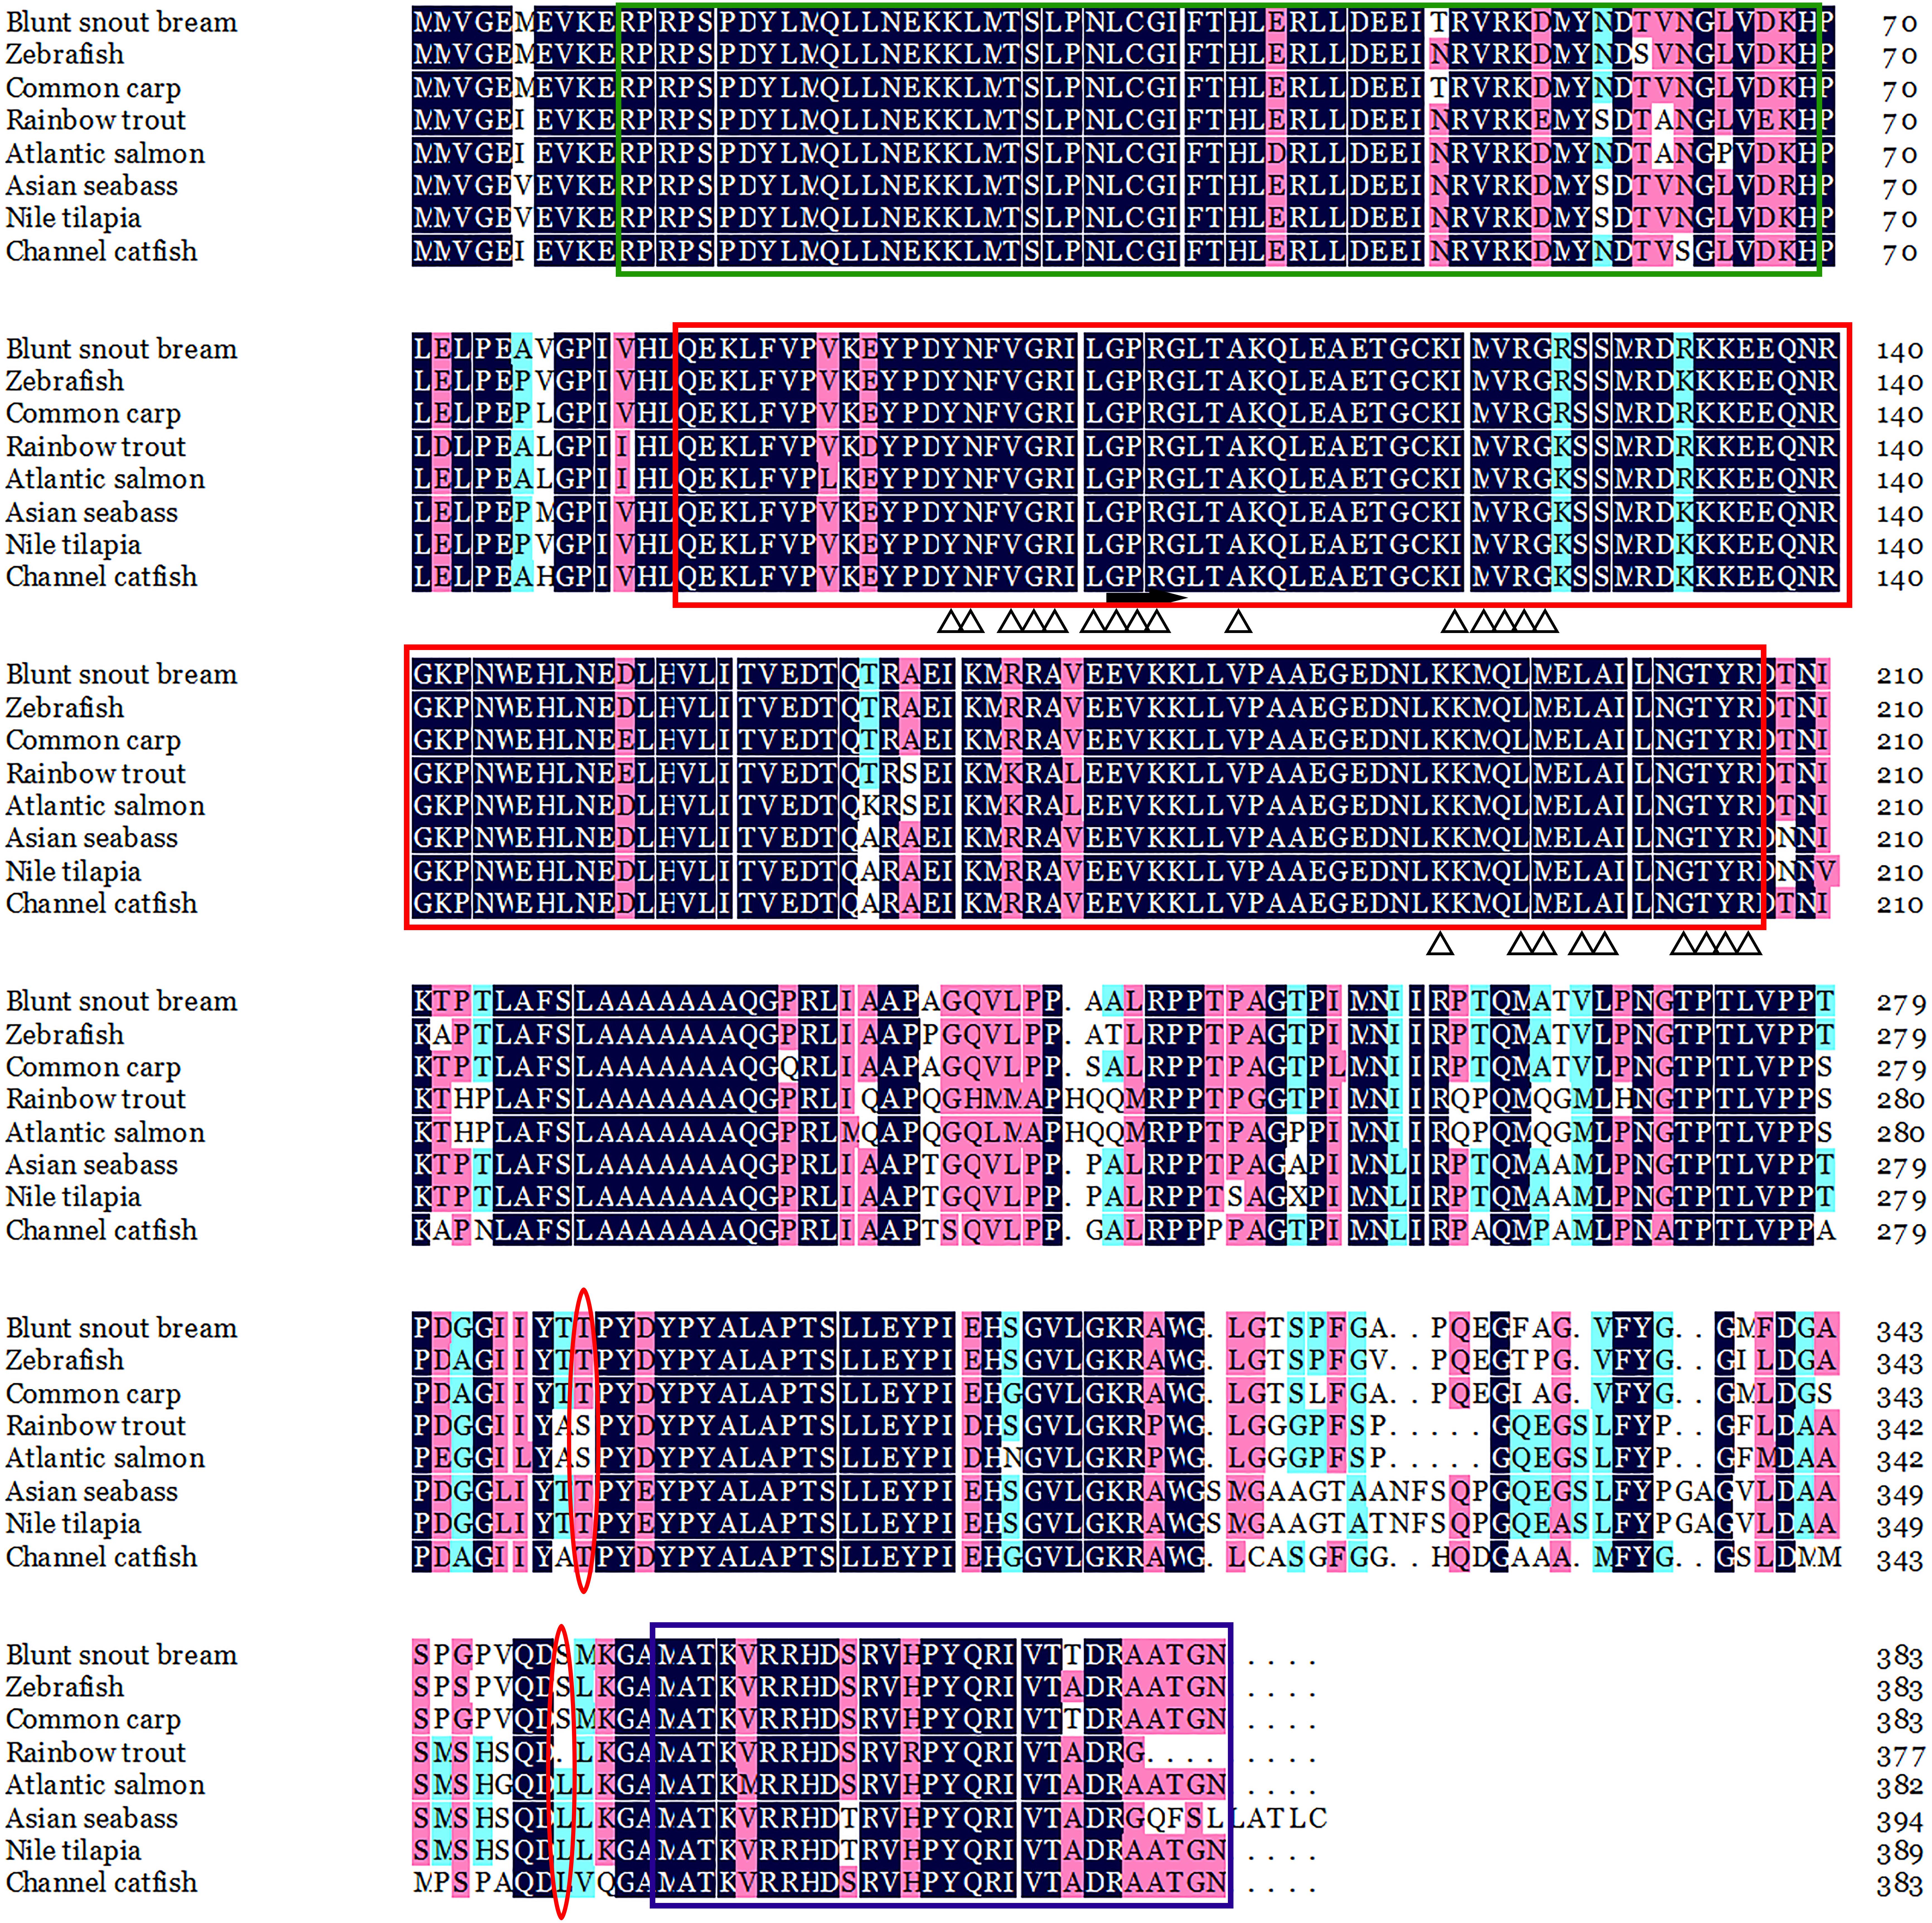
FIGURE 2. ClustalW alignment of the deduced AA sequence of the qkia protein from Megalobrama amblycephala and other organisms. Identical amino acids are marked in black and homologous amino acids in pink. The green, red and purple box indicate the STAR_dimer, SF1_like-KH and Quaking_NLS, respectively. Arrow and triangle indicates the G-X-X-G motif and potential RNA-binding sites, respectively. The phosphorylation sites are marked in red circle. The accession numbers for the sequences are as follows: blunt snout bream M. amblycephala (KY_444733), zebrafish (Danio rerio) (NP_571299.1), common carp (Cyprinus carpio) (XP_018921881.1), rainbow trout (Oncorhynchus mykiss) (CDQ_57984.1), Atlantic salmon (Salmo salar) (XP_013981550.1), Asian seabass Lates calcarifer (XP_018518983.1), Nile tilapia (Oreochromis niloticus) (XP_005464024.3), channel catfish (Ictalurus punctatus) (X _017331508.1).
Phylogenetic Analysis of the Qkia Protein
The phylogenetic tree among twelve piscine species based on the AA sequences of the Qkia protein was presented in Figure 3. Qkia of blunt snout bream (M. amblycephala) showed a close phylogenetic relationship with that of several Cyprinomorpha species, like common carp (Cyprinus carpio), zebrafish (Danio rerio) and the Mexican blind cavefish (Astyanax mexicanus) sharing high bootstrap values (97–99%). Conservation of Qkia was also evident from the high bootstrap values observed between Qkia of blunt snout bream and that of other fish, like the Siluriformes species: channel catfish (Ictalurus punctatus), the Percomorpha fish: Nile tilapia (Oreochromis niloticus), and the Salmoniformes species: Atlantic salmon (Salmo salar) and rainbow trout (Oncorhynchus mykiss). The phylogenetic relationship based on the AA sequences of Qkia agreed with the traditional classification.
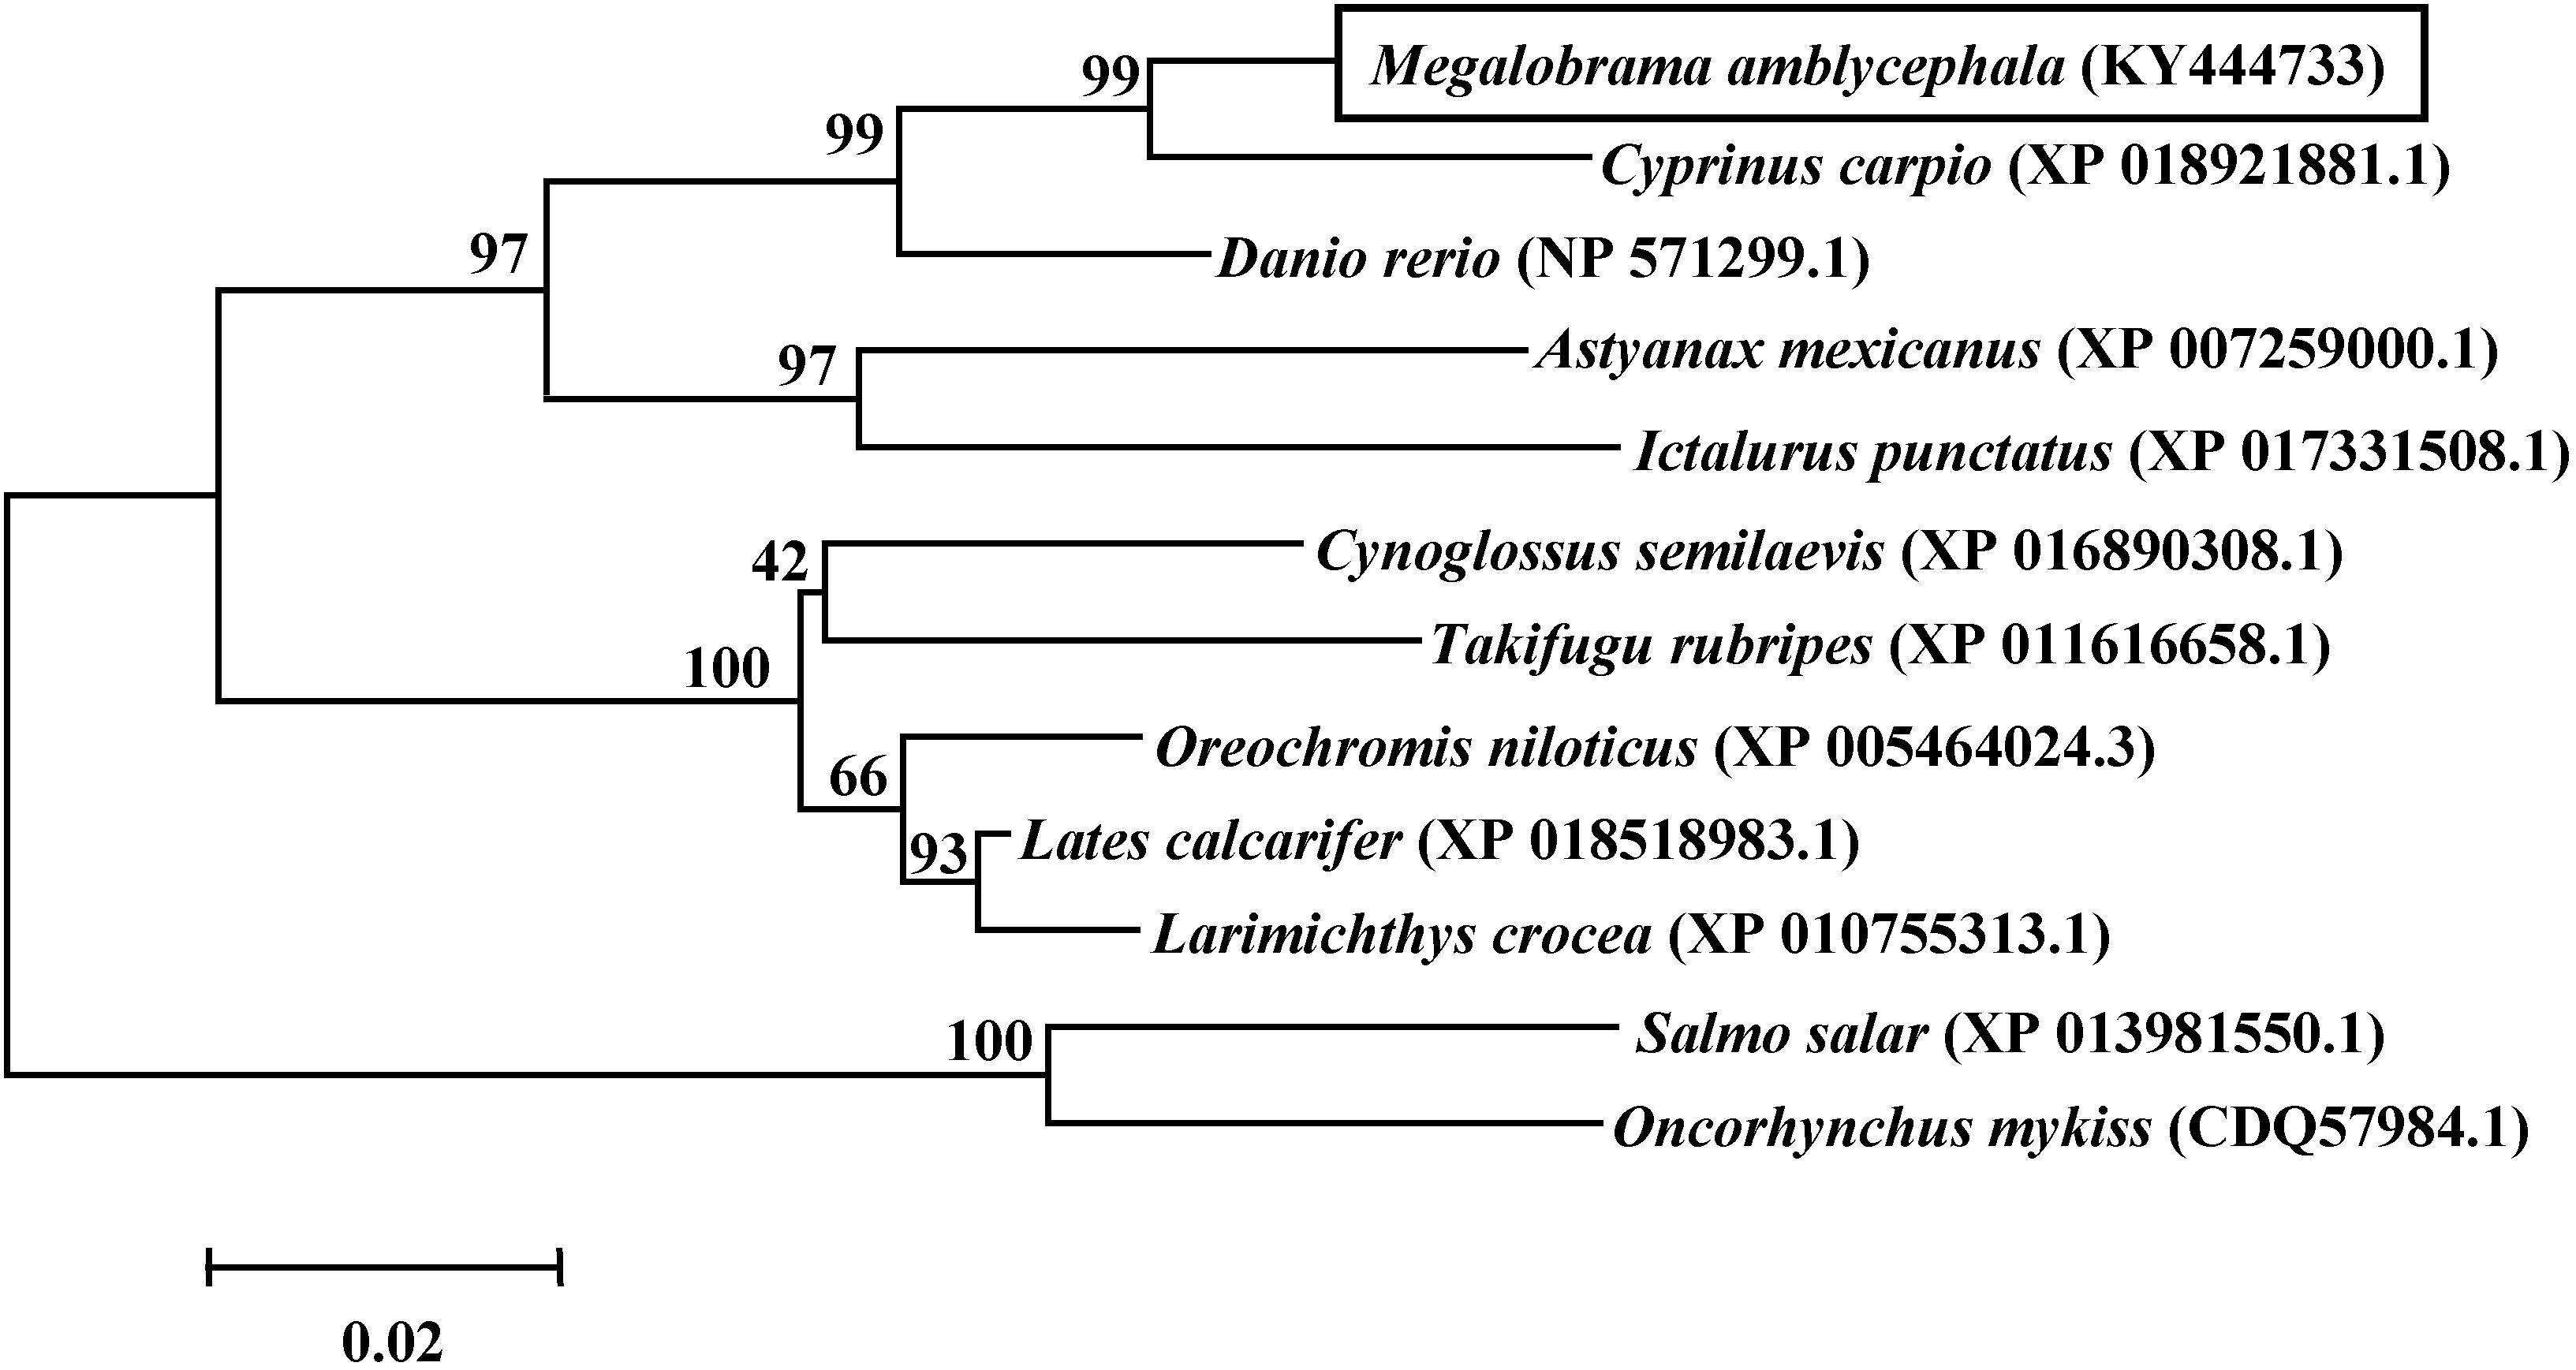
FIGURE 3. Phylogenetic tree based on the AA sequences of qkia made with the MEGA 3.1 software using the neighbor-joining method. The distance matrix was calculated using Kimara’s two-parameter model. The numbers represent bootstrap percentages. The topology was tested using bootstrap analyses (1,000 replicates). GenBank Accession numbers of the sequences are indicated on figure.
Tissue Distribution of qkia mRNA
As was shown in Figure 4, the qkia mRNA was detected in all examined tissues. The highest transcription was found in brain followed by muscle and heart. The transcriptional levels in liver, spleen, and kidney were all moderate, whereas relatively low values were detected in the mesenteric adipose tissue, gill and eye.
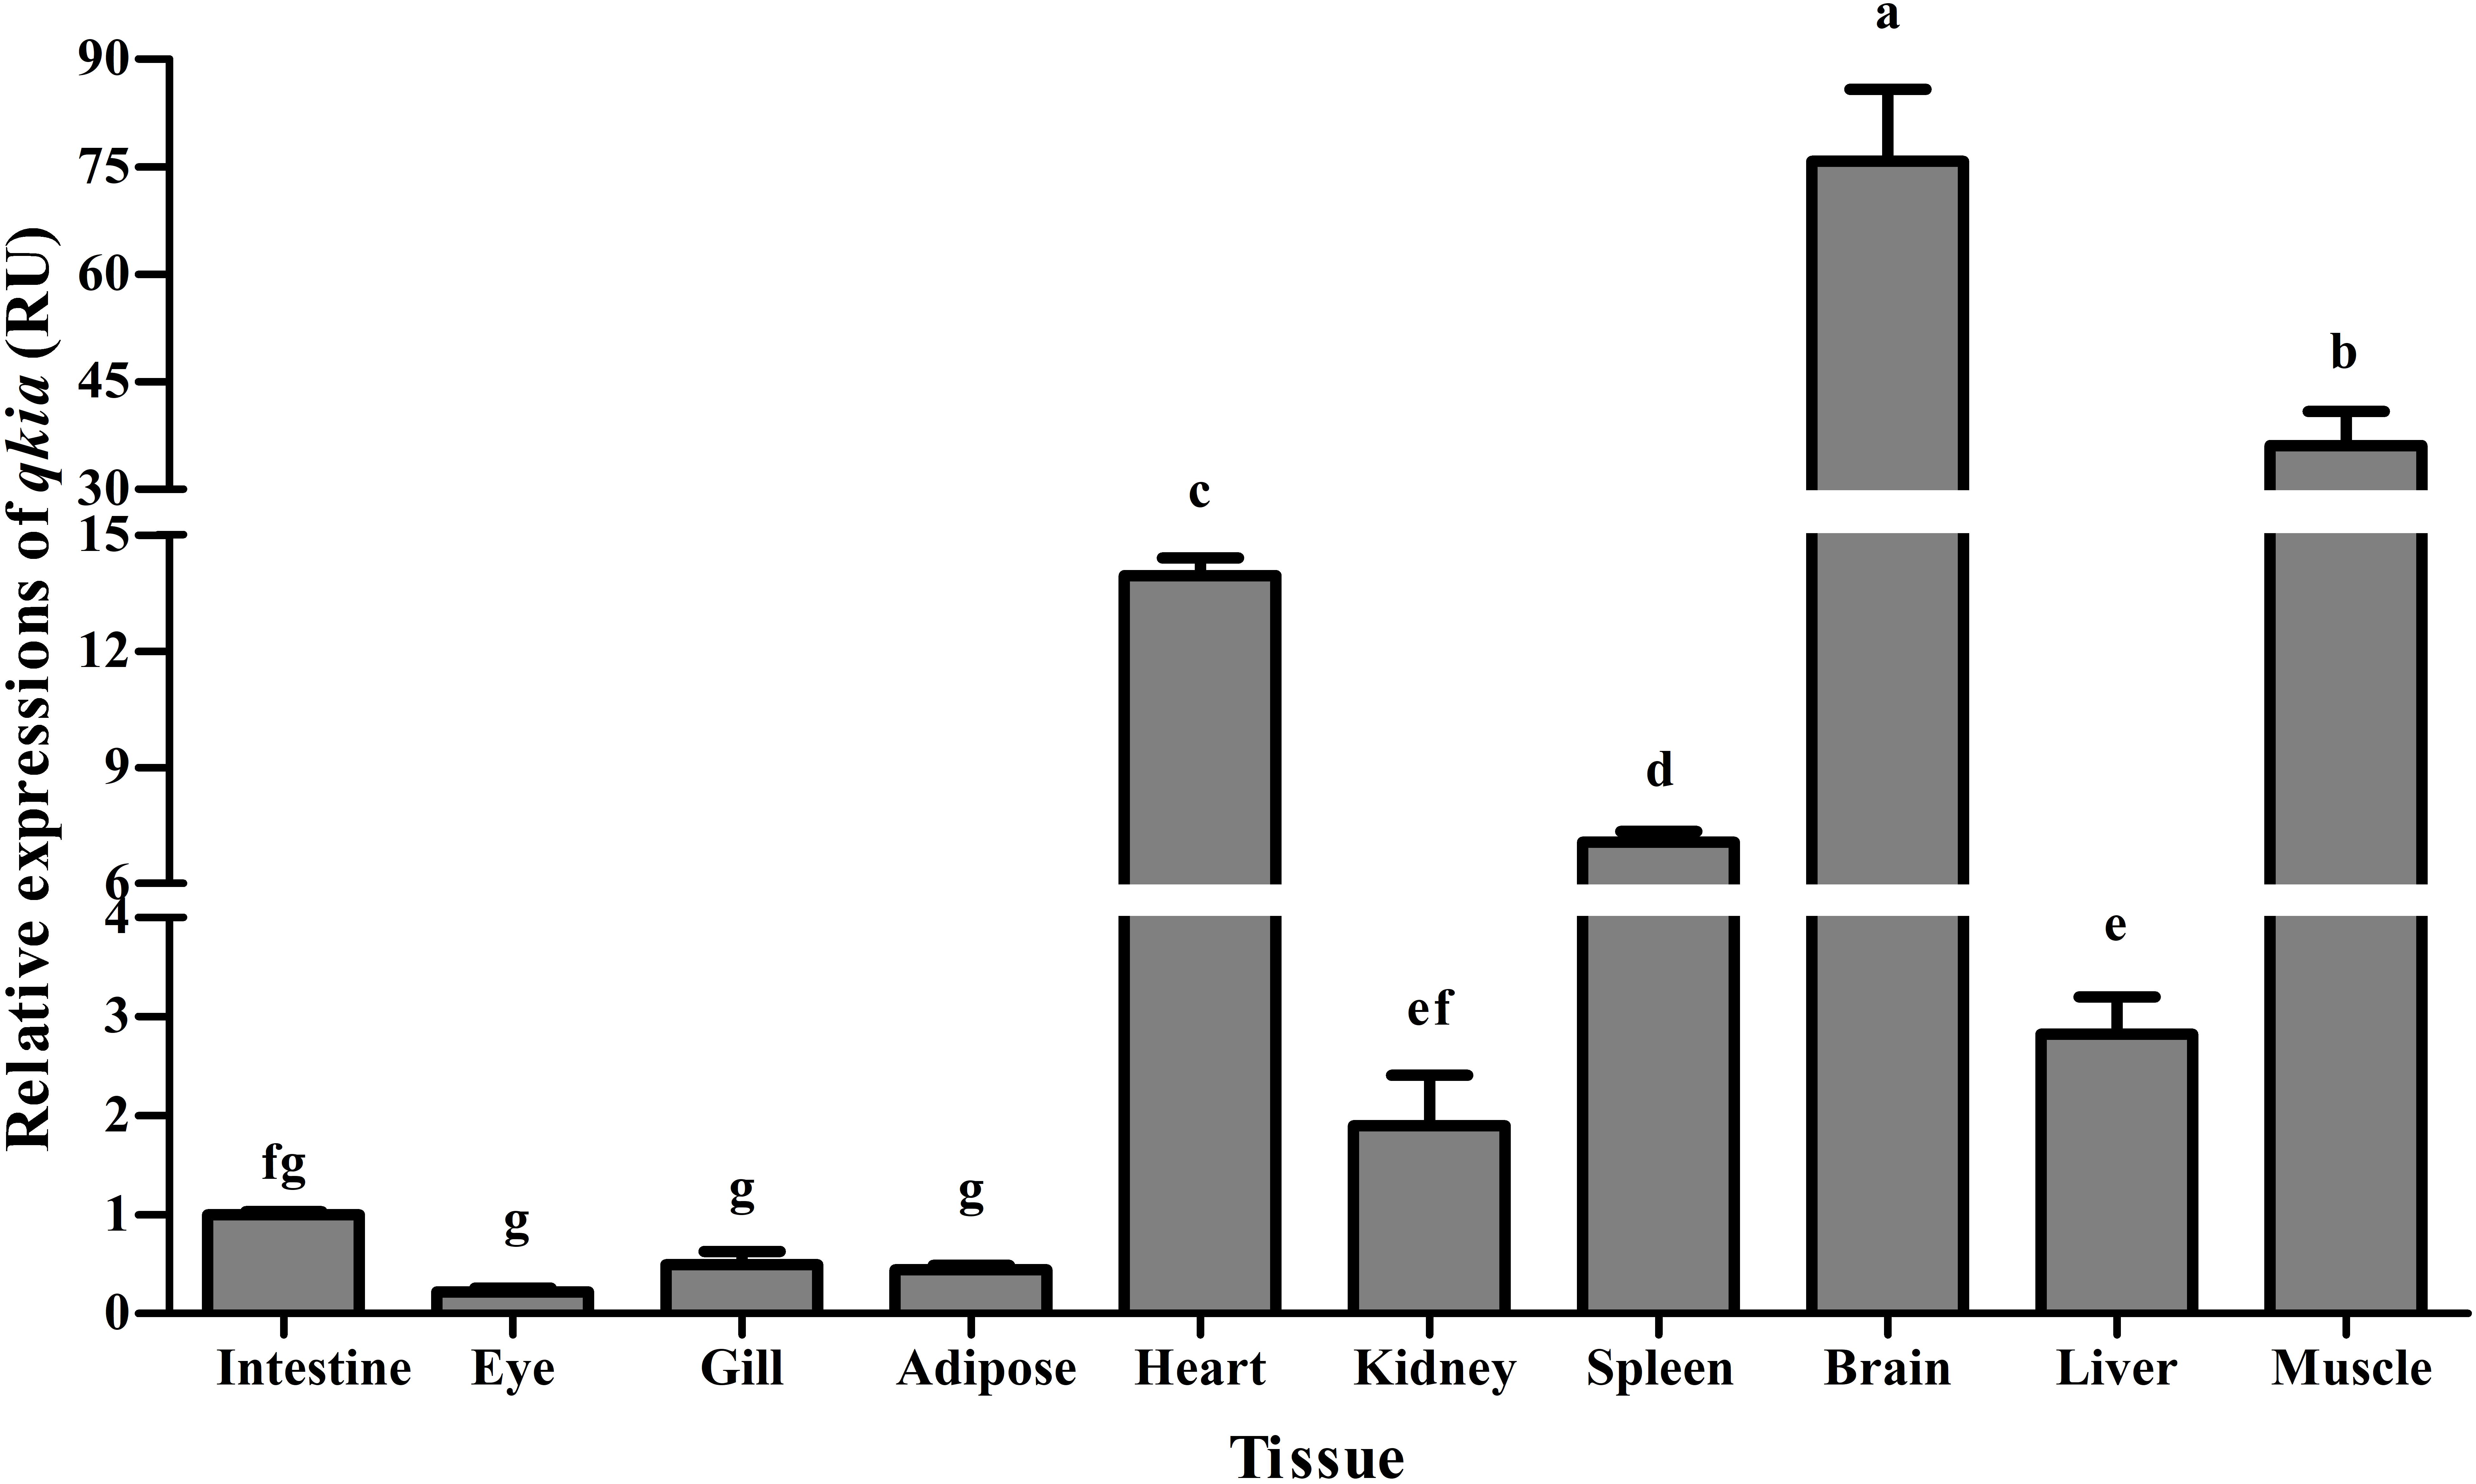
FIGURE 4. Relative expressions of qkia in various tissues of M. amblycephala. For tissue expression, data are referred to the values (Relative units, RU) found in the intestine. Each data represents the mean of eight replicates. Bars assigned with different superscripts are significantly different (P < 0.05).
Plasma Glucose Levels and Tissue qkia Expressions in the GTT
Plasma glucose levels in blunt snout bream after a glucose load were shown in Figure 5. Plasma glucose concentration were significantly (P < 0.001) affected by sampling time, injection type and their interaction. The glucose loading resulted in a significantly (P < 0.05) increased plasma glucose level with the highest value being recorded at 1 h after injection. Thereafter, it decreased significantly (P < 0.05) to the basal value at 12 h and then remained constant until the end of the trial. Plasma glucose levels of the sham treatment showed no statistical difference (P > 0.05) during the first 2 h. Then it increased significantly (P < 0.05) from 2 to 4 h, and remained constant thereafter. In terms of injection type, plasma glucose levels of fish receiving glucose were significantly (P < 0.001) higher than that of fish offered saline solution. In addition, plasma glucose levels were significantly (P < 0.001) affected by the interaction between sampling time and injection type with significant (P < 0.05) differences observed at times 1, 2, 8, 12, and 24 h between the two groups.
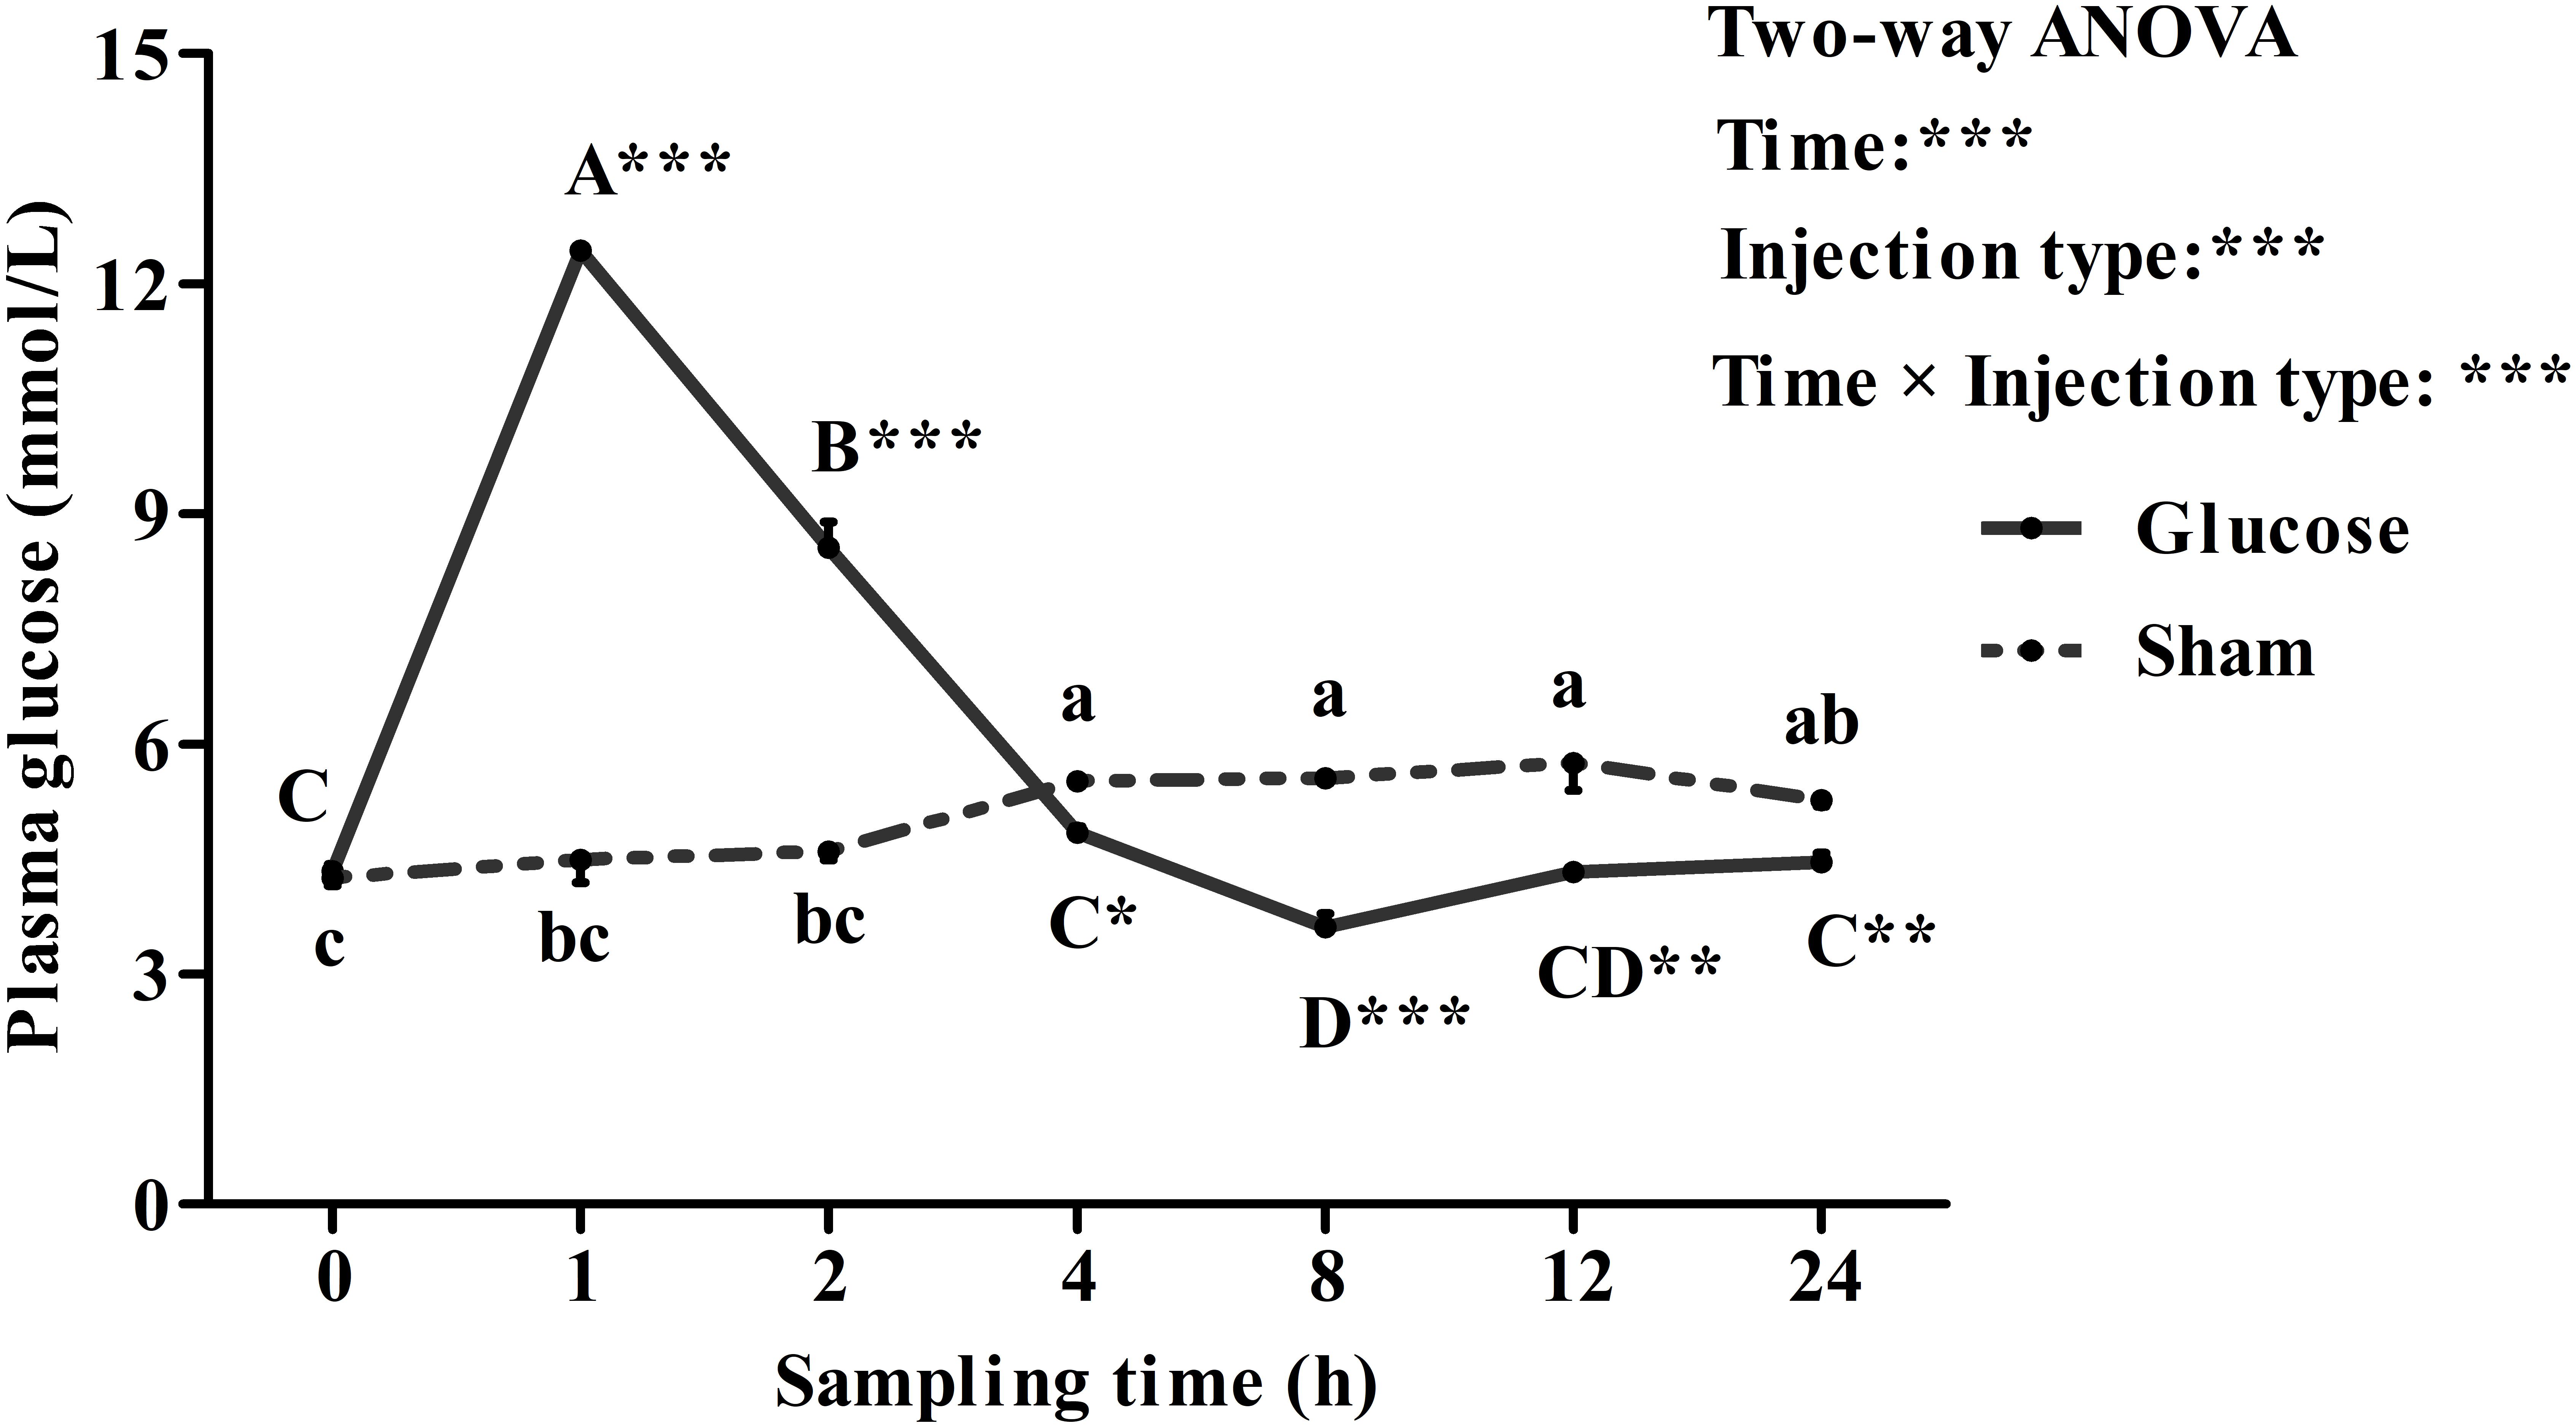
FIGURE 5. Plasma glucose levels of blunt snout bream subjected to a glucose load. Each data represents the mean of four replicates. Significant differences (P < 0.05) among sampling times within each treatment are indicated by different letters (lower case for sham, upper case for glucose). ∗Indicates a significant difference (P < 0.05) between the two treatments at each sampling time. ∗P < 0.05, ∗∗P < 0.01, ∗∗∗P < 0.001; ns, not significant.
As was shown in Figure 6, after the glucose load, the qkia transcriptions in brain (Figure 6A), muscle (Figure 6B), and liver (Figure 6C) were all significantly (P < 0.001) affected by sampling time, injection type and their interaction. The glucose administration resulted in a significant (P < 0.05) decrease of qkia expression in both liver and muscle with the lowest value being recorded at 1 h after injection. Then, they both increased significantly (P < 0.05) to the highest value at 12 h. However, brain qkia expressions decreased significantly (P < 0.05) with the lowest value being recorded at 8 h after the glucose administration. Then it gradually increased to the basal value at 24 h. As for the sham treatment, qkia expressions gradually increased in these tissues during the whole sampling period. In terms of injection type, qkia expression of fish injected glucose was significantly (P < 0.001) lower than that of the sham treatment. In addition, tissue qkia expressions were significantly (P < 0.001) affected by the interaction between sampling time and injection type with significant (P < 0.05) differences observed at times 1–24 h in these tissues (except for the time point of 12 h in liver) between the two groups.
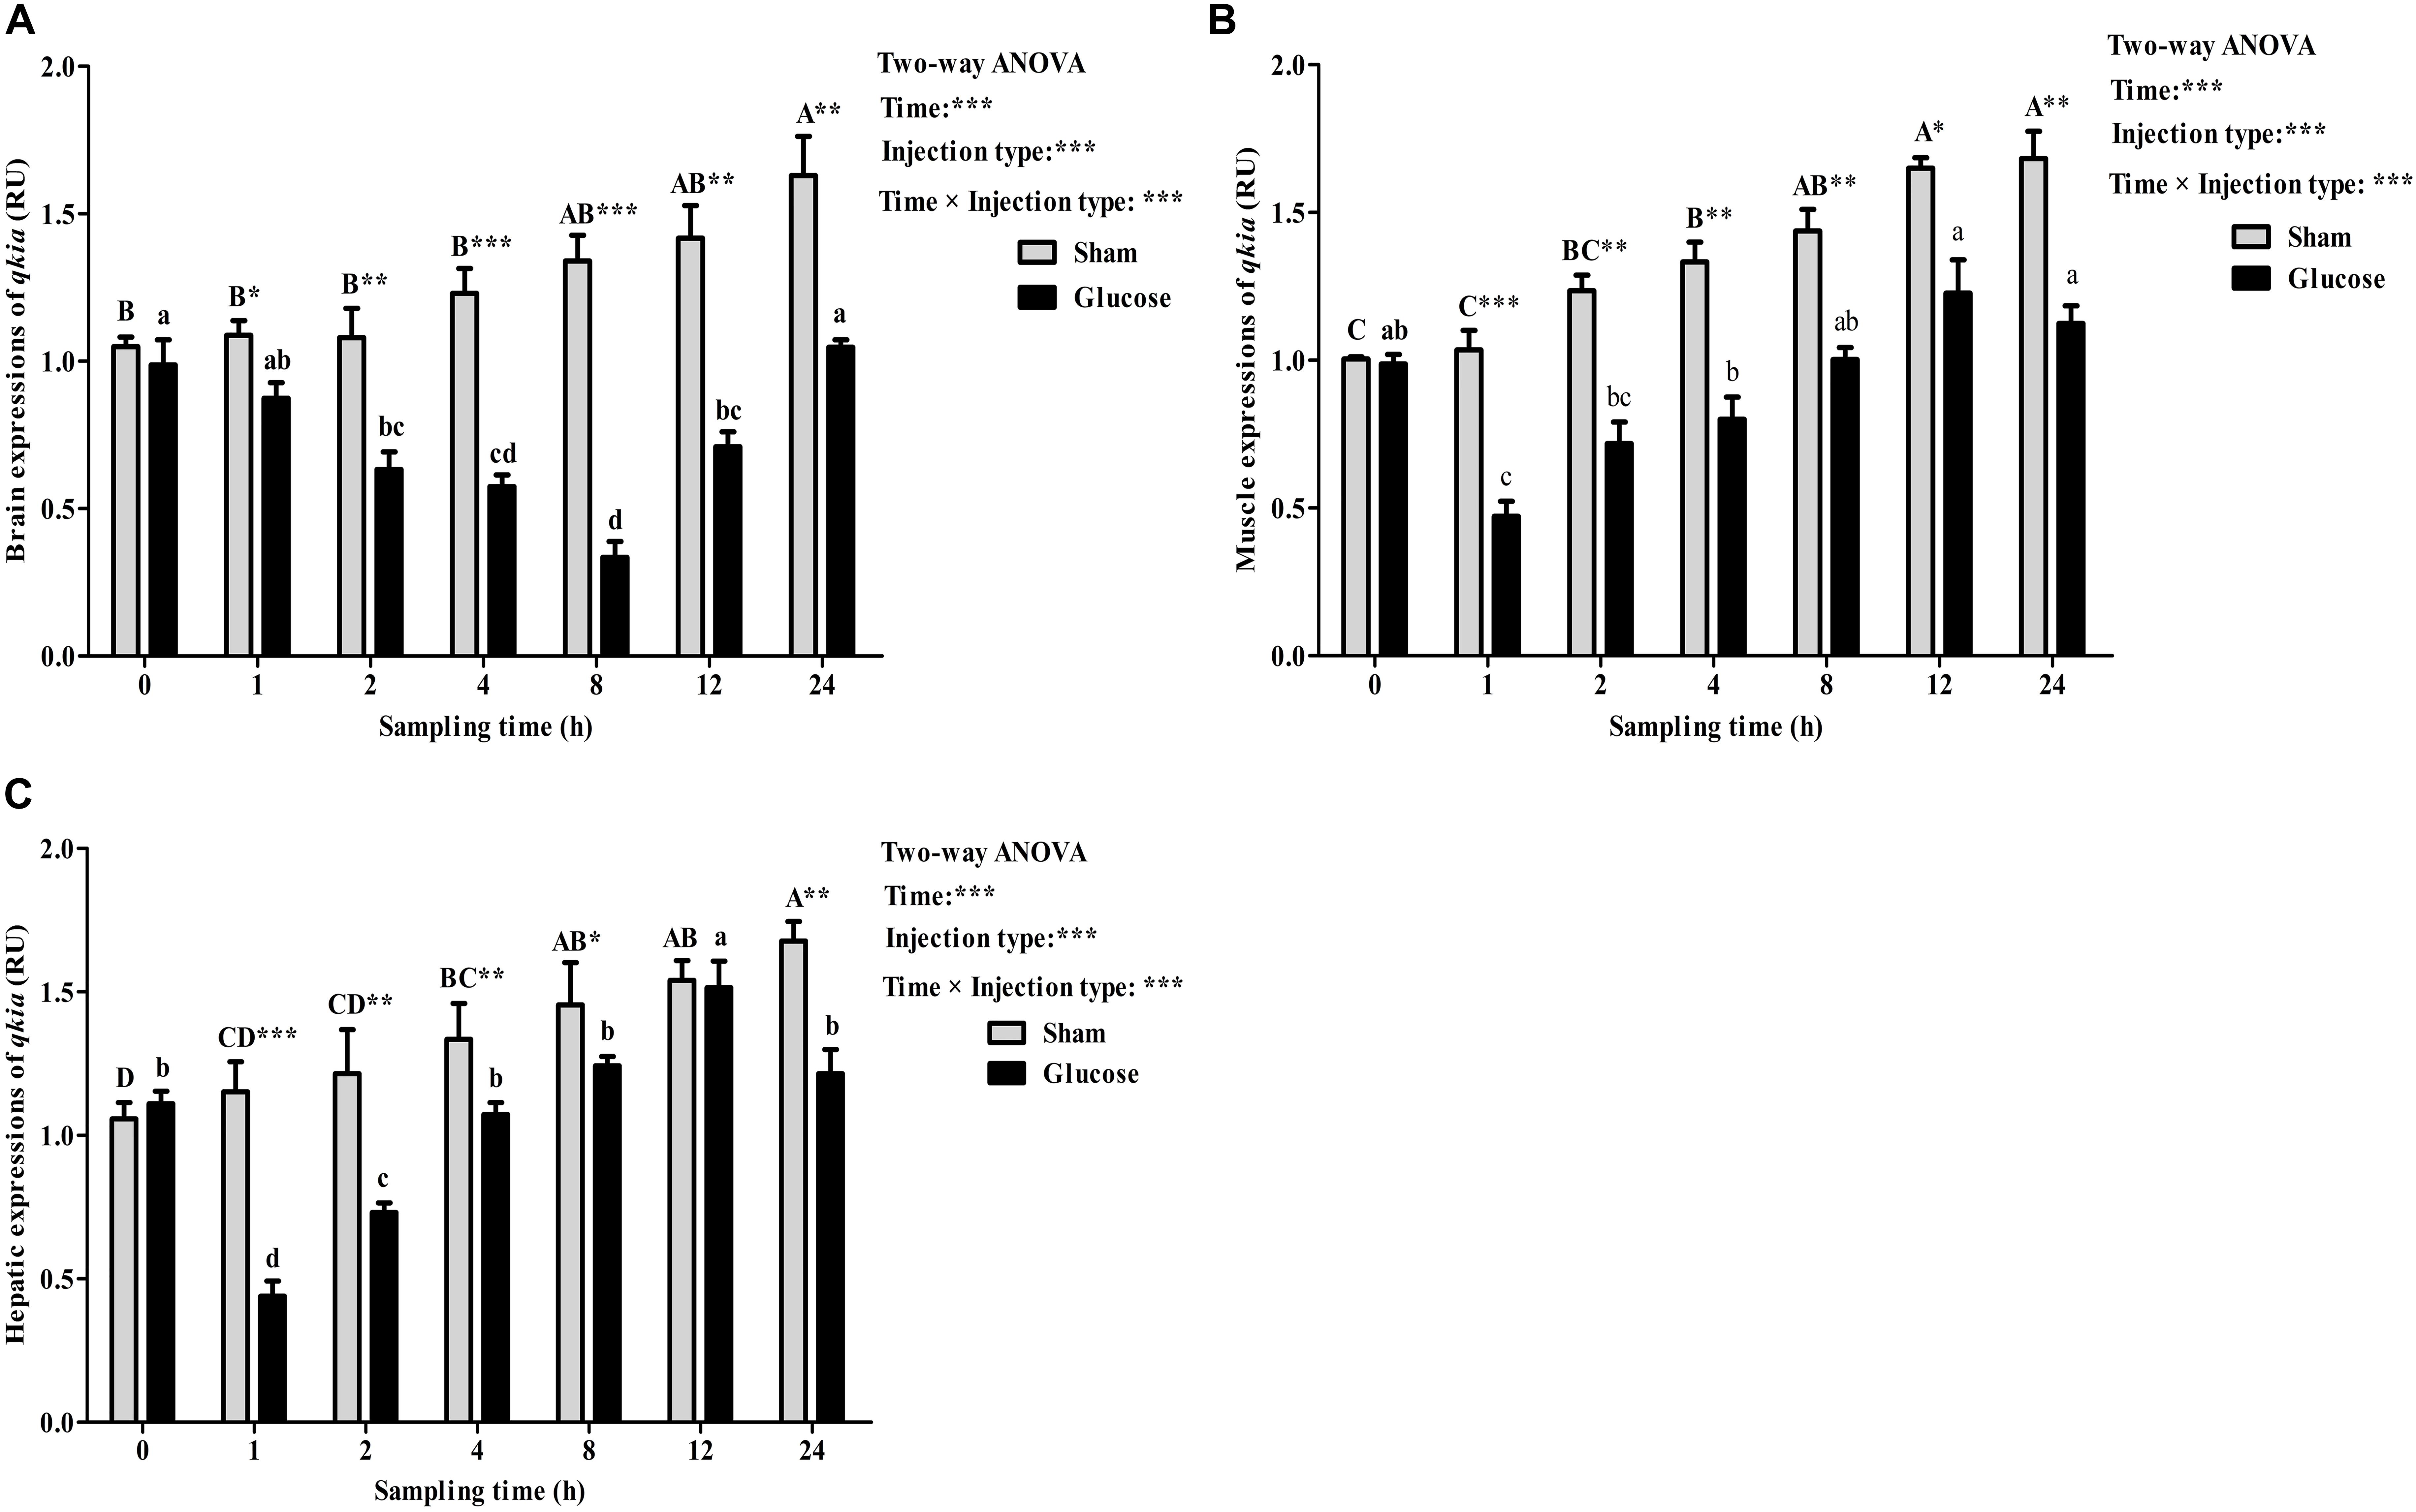
FIGURE 6. Relative expressions of qkia in the brain (A), muscle (B), and liver (C) of M. amblycephala after the glucose loading. Data are referred to the value (Relative units, RU) obtained in the corresponding tissue of the sham treatment solution at 0 h. Each data represents the mean of four replicates. Significant differences (P < 0.05) among sampling times within each treatment are indicated by different letters (lower case for glucose, upper case for sham). ∗Indicates a significant difference (P < 0.05) between the two treatments at each sampling time. ∗P < 0.05, ∗∗P < 0.01, ∗∗∗P < 0.001; ns, not significant.
Plasma Glucose Levels and Tissue qkia Expressions in the ITT
Plasma glucose levels in blunt snout bream after ITT were shown in Figure 7. Plasma glucose levels were significantly (P < 0.001) affected by sampling time, injection type and their interaction. The insulin load resulted in a significant (P < 0.05) decrease of plasma glucose levels with the lowest value being recorded at 1 h, then it showed no statistical difference (P > 0.05) thereafter. The glucagon load resulted in a sharp increase of glycemic levels with the highest value being recorded at 4 h, then it decreased significantly (P < 0.05) to the basal level at 12 h. Saline injection led to a slight (P > 0.05) decrease of plasma glucose levels during the first 1 h. Then it increased significantly (P < 0.05) from 1 to 4 h with the maximum value being attained at 4 h. Thereafter, it gradually returned to the basal value with further increasing time. In terms of injection type, the glycemic values of fish receiving insulin were significantly lower (P < 0.001) than those of fish injected glucagon and saline solution during the whole sampling period. Furthermore, plasma glucose levels were significantly (P < 0.001) affected by the interaction between sampling time and injection type with significant (P < 0.05) differences observed at times 1–24 h among the three groups.
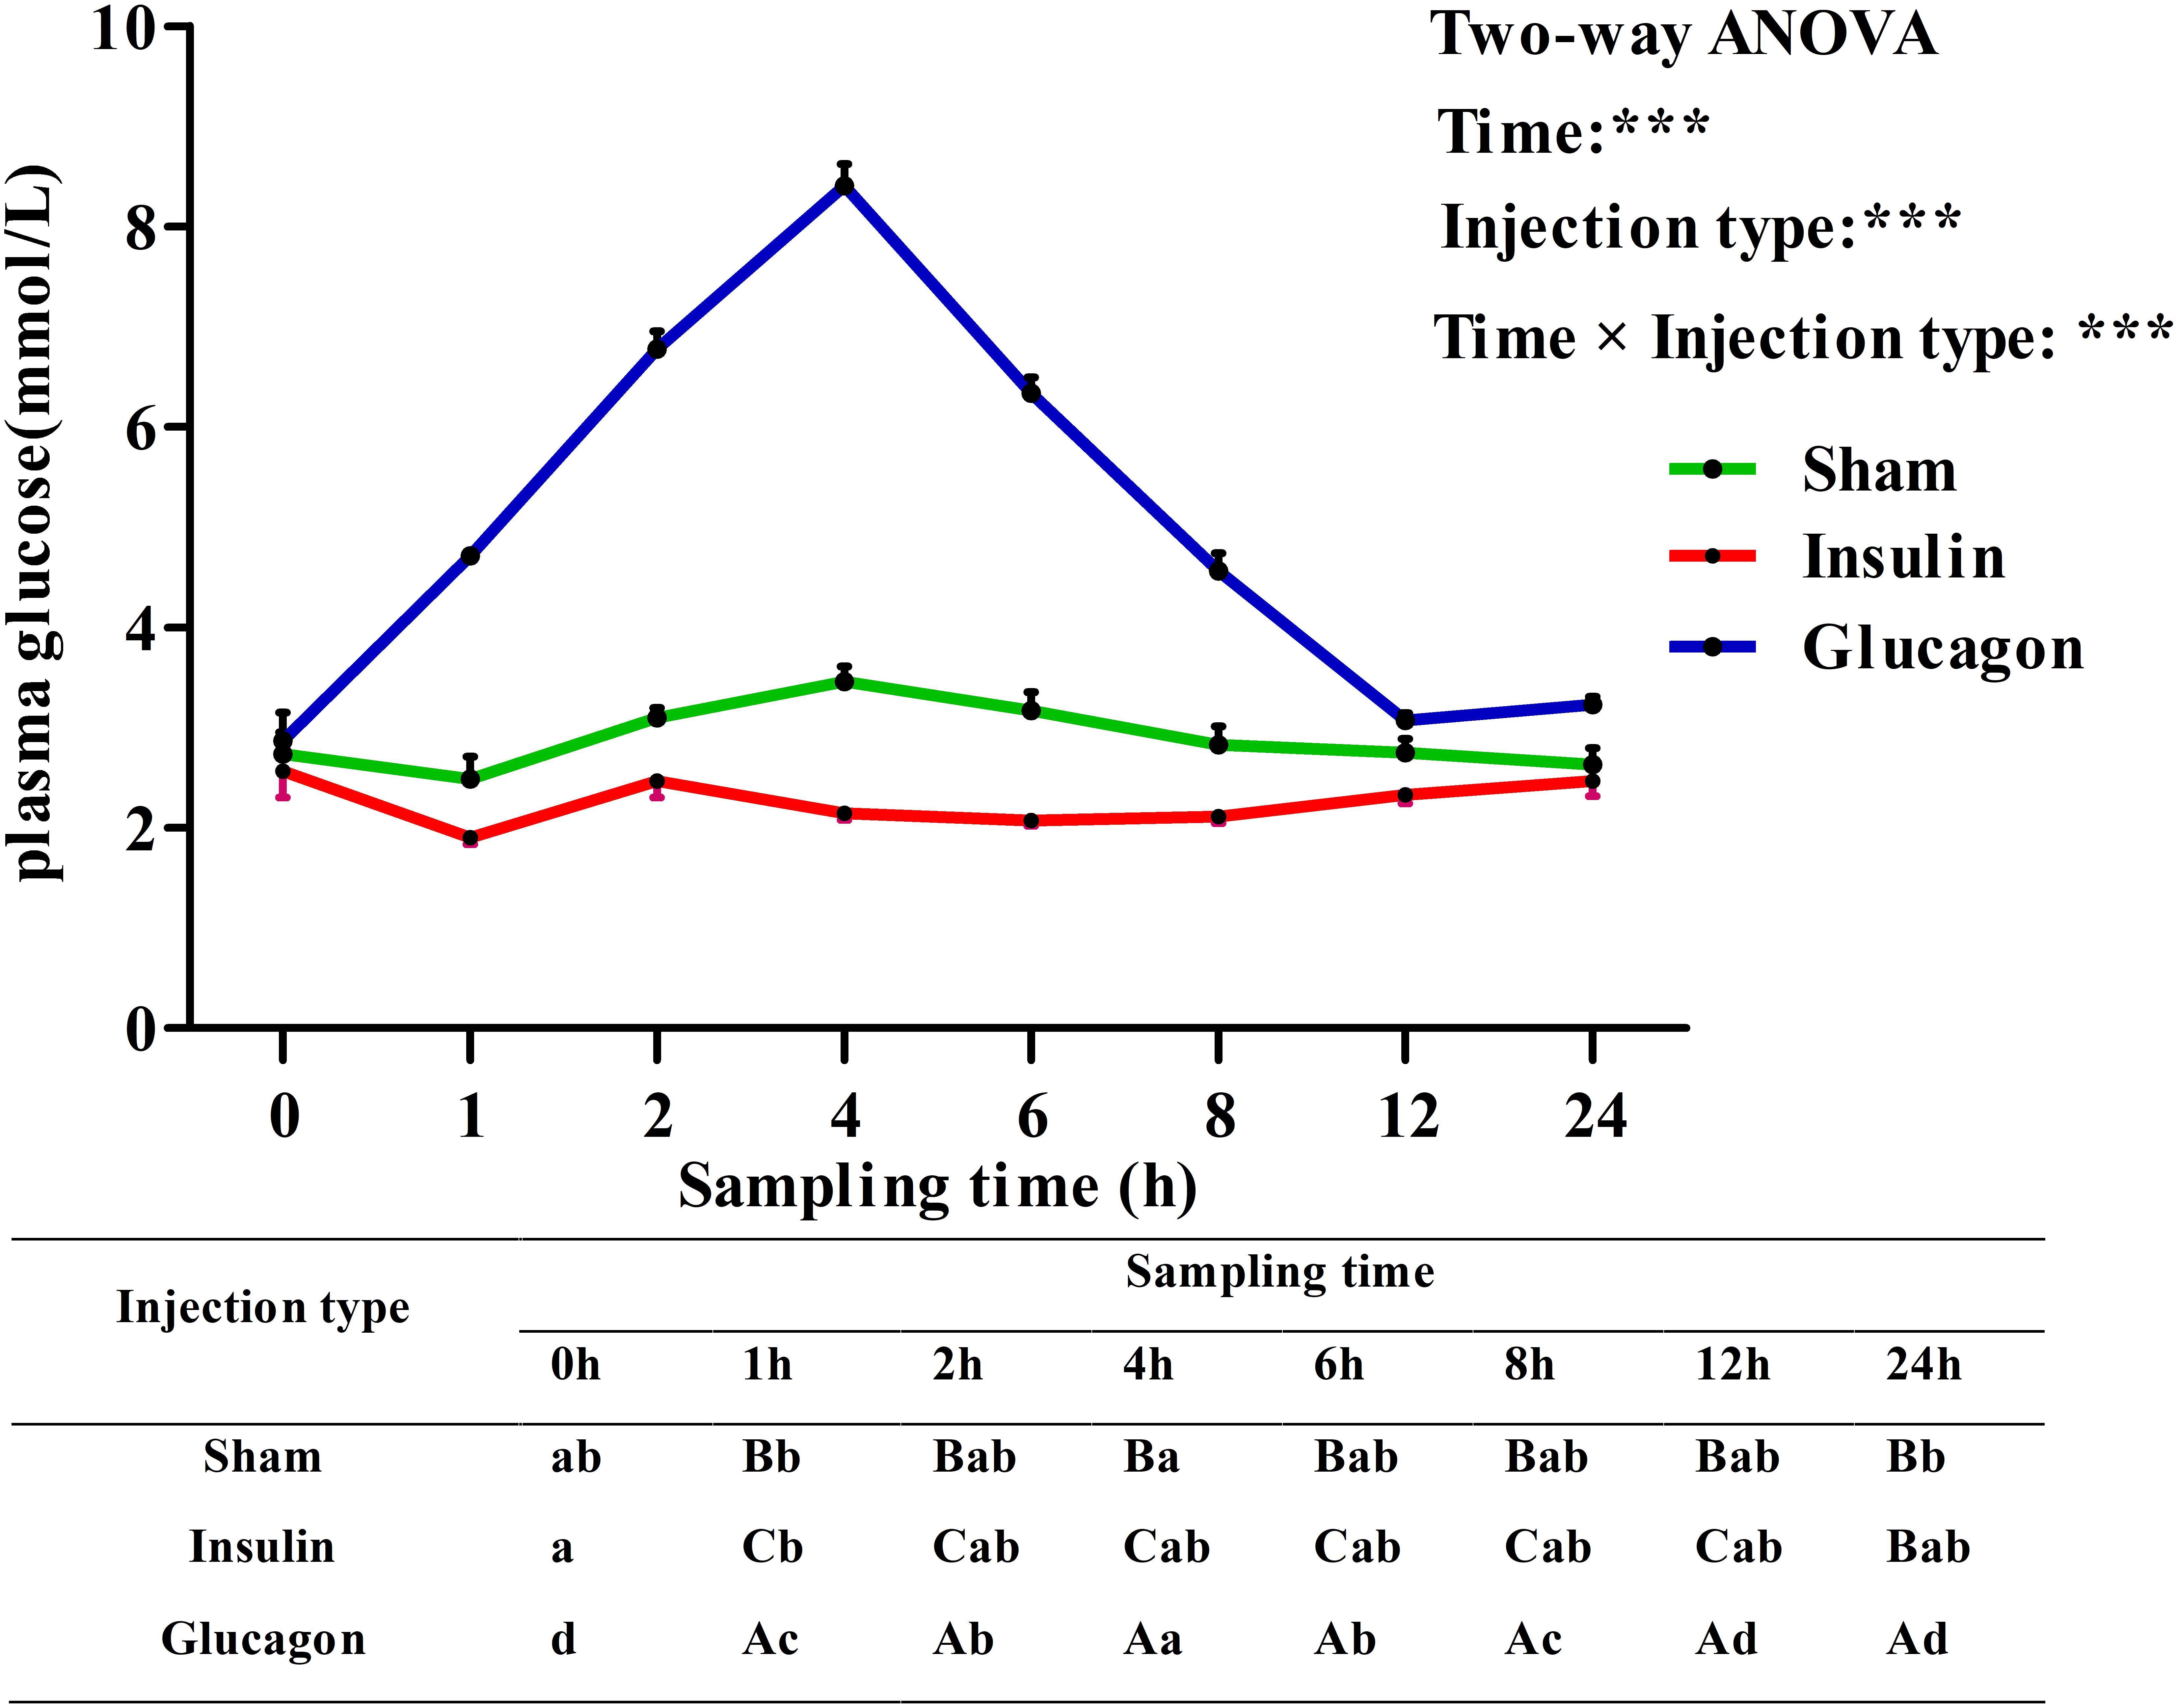
FIGURE 7. Plasma glucose levels of blunt snout bream subjected to the insulin and glucagon load. Each data represents the mean of four replicates. Different lower-case letters indicate significant differences (P < 0.05) at different time points within each treatment, whereas different capital letters indicate significant differences (P < 0.05) at each sampling point among different treatments. ∗P < 0.05, ∗∗P < 0.01, ∗∗∗P < 0.001; ns, not significant.
As was shown in Figure 8, after the insulin and glucagon administration, the qkia expressions in brain (Figure 8A), muscle (Figure 8B), and liver (Figure 8C) were all significantly (P < 0.001) affected by sampling time, injection type and their interaction. The insulin administration resulted in a significant (P < 0.05) decrease of qkia expression in brain, muscle and liver with the lowest value being recorded at 2 h in brain and muscle and 1 h in liver, respectively. Subsequently, the expressions in these tissues all increased significantly (P < 0.05) to the basal value. The glucagon load induced a significant (P < 0.05) increase of qkia expression in liver during the first 6 h. Then it gradually decreased to the basal value. However, brain and muscle qkia expressions decreased significantly (P < 0.05) at 2–4 h after glucagon administration. Then they both increased significantly (P < 0.05) with the highest value being recorded at 6 h, and gradually reduced to the basal value thereafter. As for the sham treatment, the qkia expressions increased significantly (P < 0.05) in both brain and liver during the first 6 h, thereafter it showed no statistical difference (P > 0.05). Muscle qkia expression also showed a similar trend from 0 to 6 h, whereas no statistical difference (P > 0.05) thereafter. In terms of injection type, qkia expression of fish receiving insulin were significantly lower (P < 0.001) than those of fish injected glucagon and saline solution (except for the liver). In addition, tissue qkia expressions were significantly (P < 0.001) affected by the interaction between sampling time and injection type with significant (P < 0.05) differences observed at times 1–12 h (except for the time point of 12 h in brain and muscle) among the three groups.
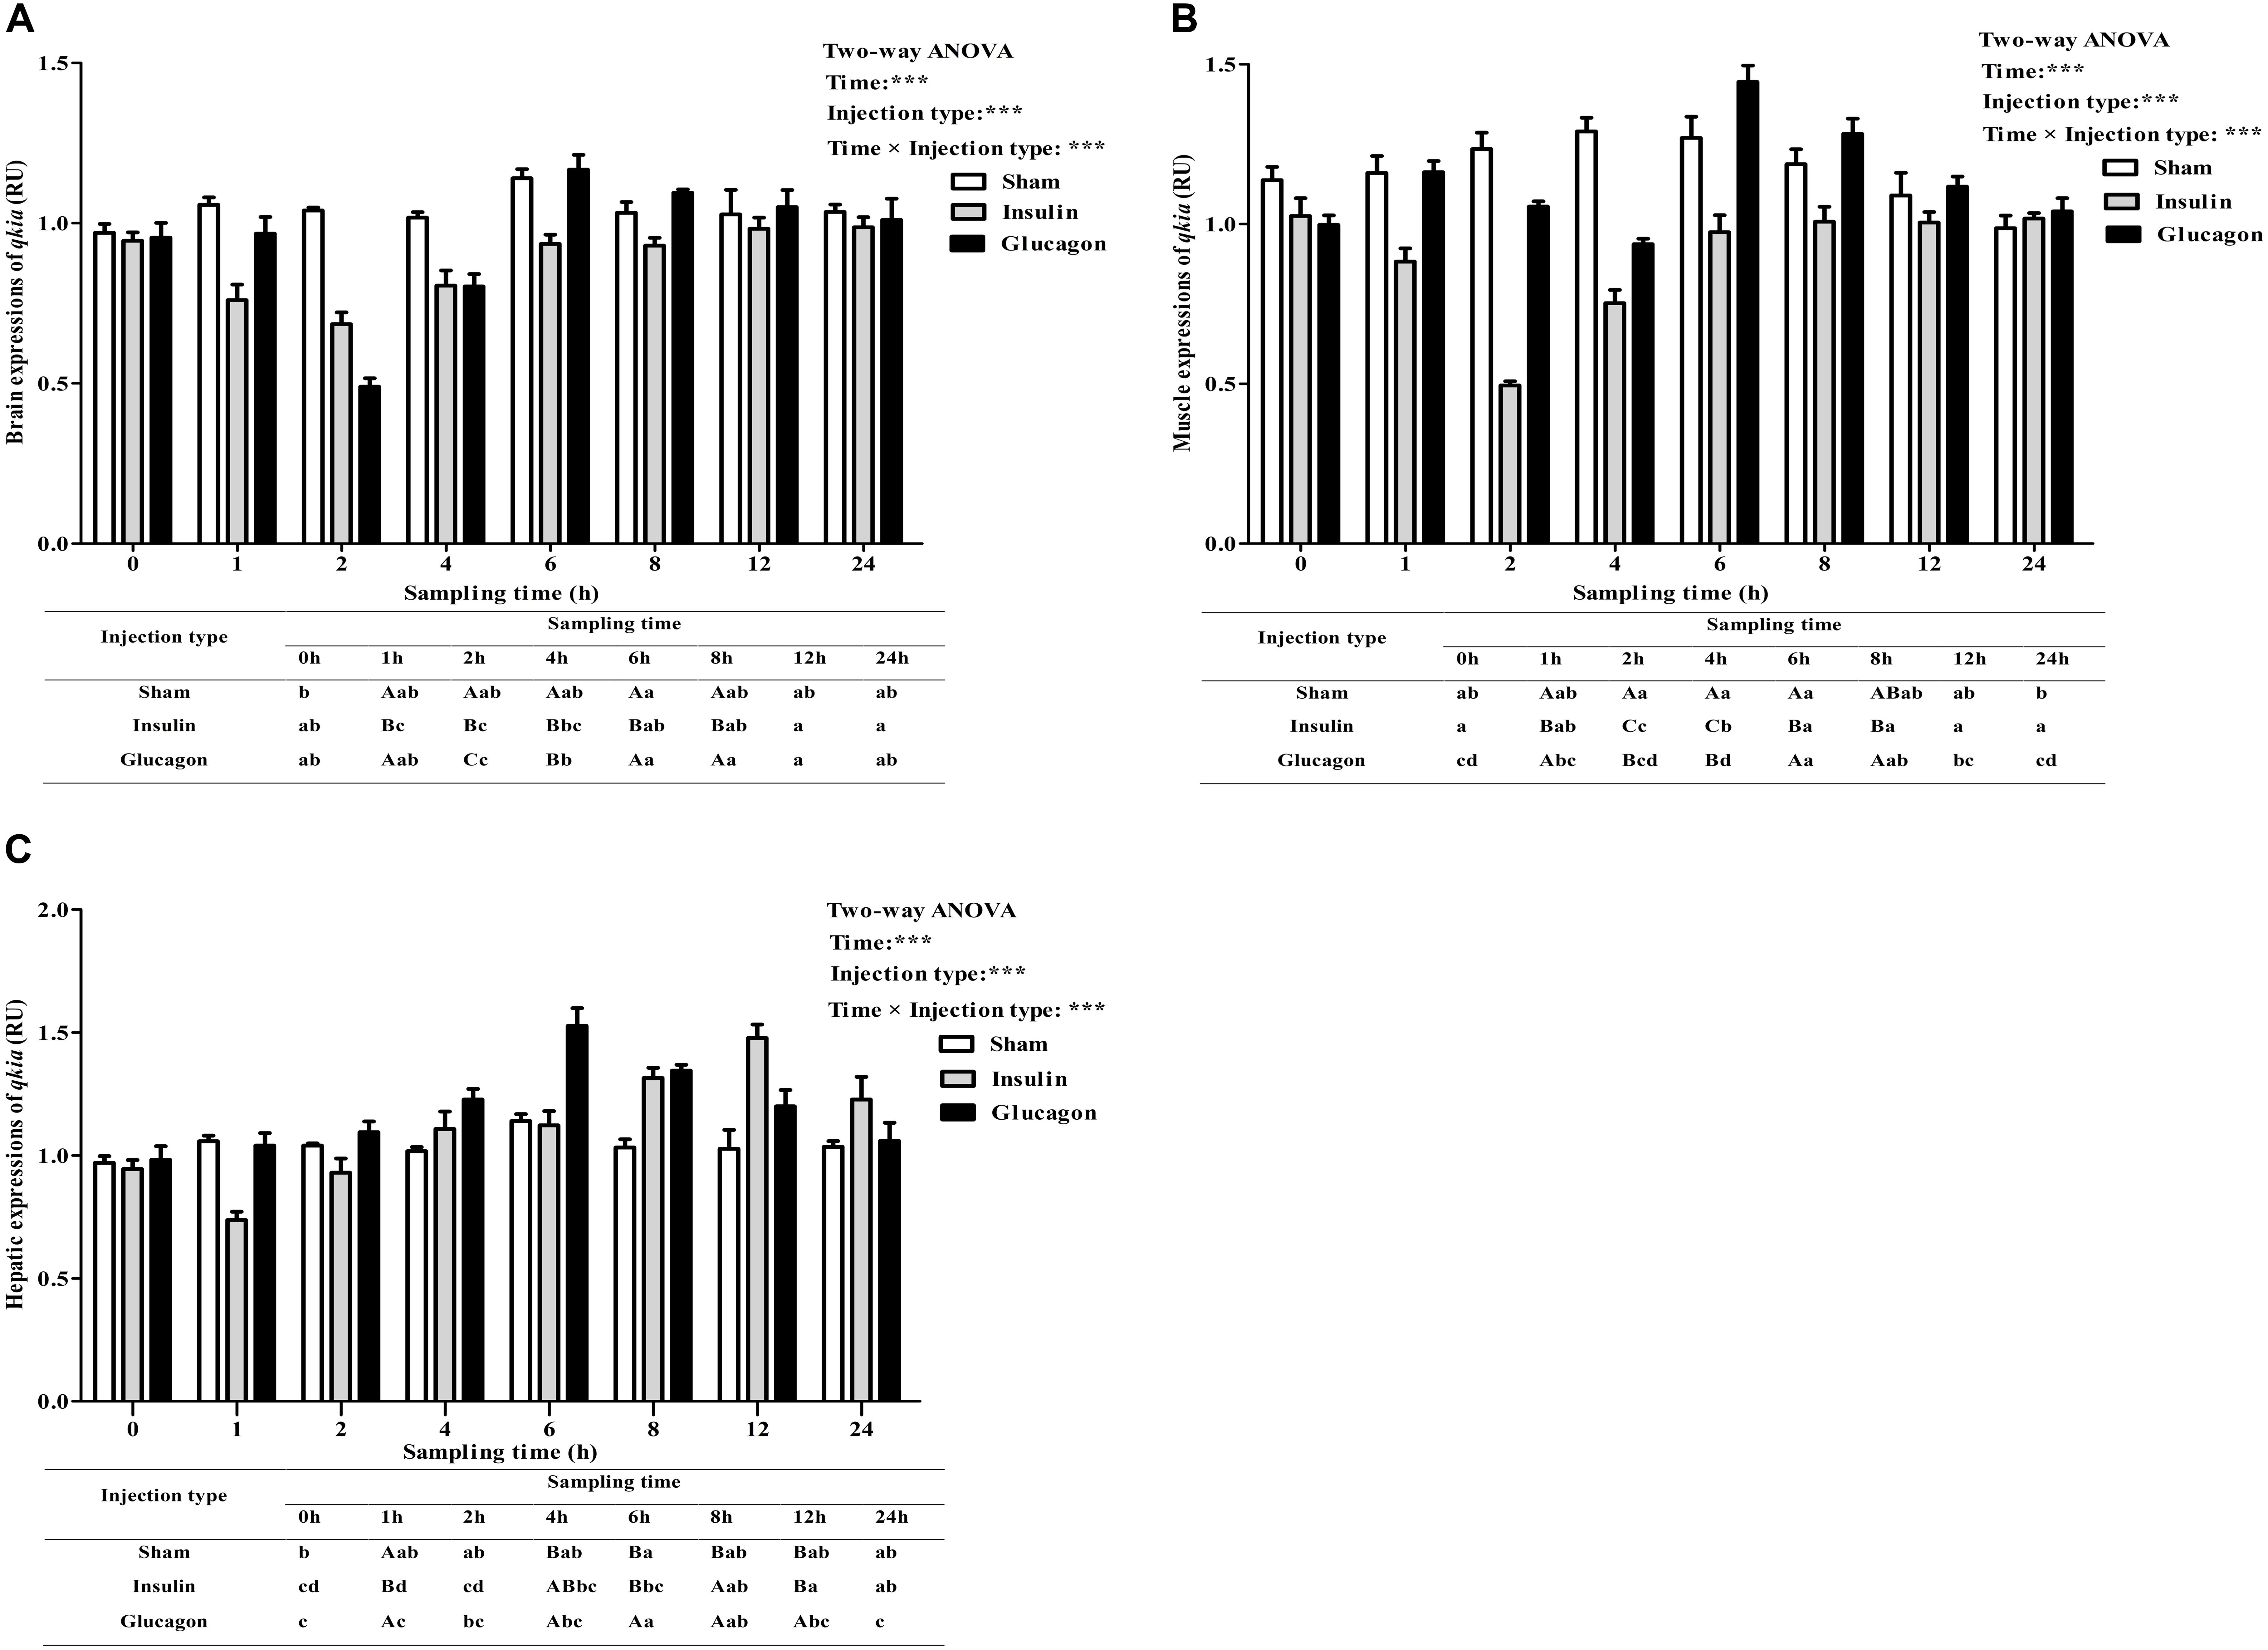
FIGURE 8. Relative expressions of qkia in the brain (A), muscle (B), and liver (C) of M. amblycephala after the insulin and glucagon loading. Data are referred to the value (Relative units, RU) obtained in the corresponding tissue of the sham treatment at 0 h. Each data represents the mean of four replicates. Different lower-case letters indicate significant differences (P < 0.05) at different time points within each treatment, whereas different capital letters indicate significant differences (P < 0.05) at each sampling point among different treatments. ∗P < 0.05, ∗∗P < 0.01, ∗∗∗P < 0.001; ns, not significant.
Plasma Glucose Levels and Tissue qkia Expressions After the Feeding Trial
As can been from Figure 9, high-carbohydrate feeding induced a significant (P < 0.05) increase of plasma glucose levels (Figure 9A). However, the transcriptional levels of qkia significantly (P < 0.05) decreased in the brain (Figure 9B), muscle (Figure 9C), and liver (Figure 9D) after high-carbohydrate intake.
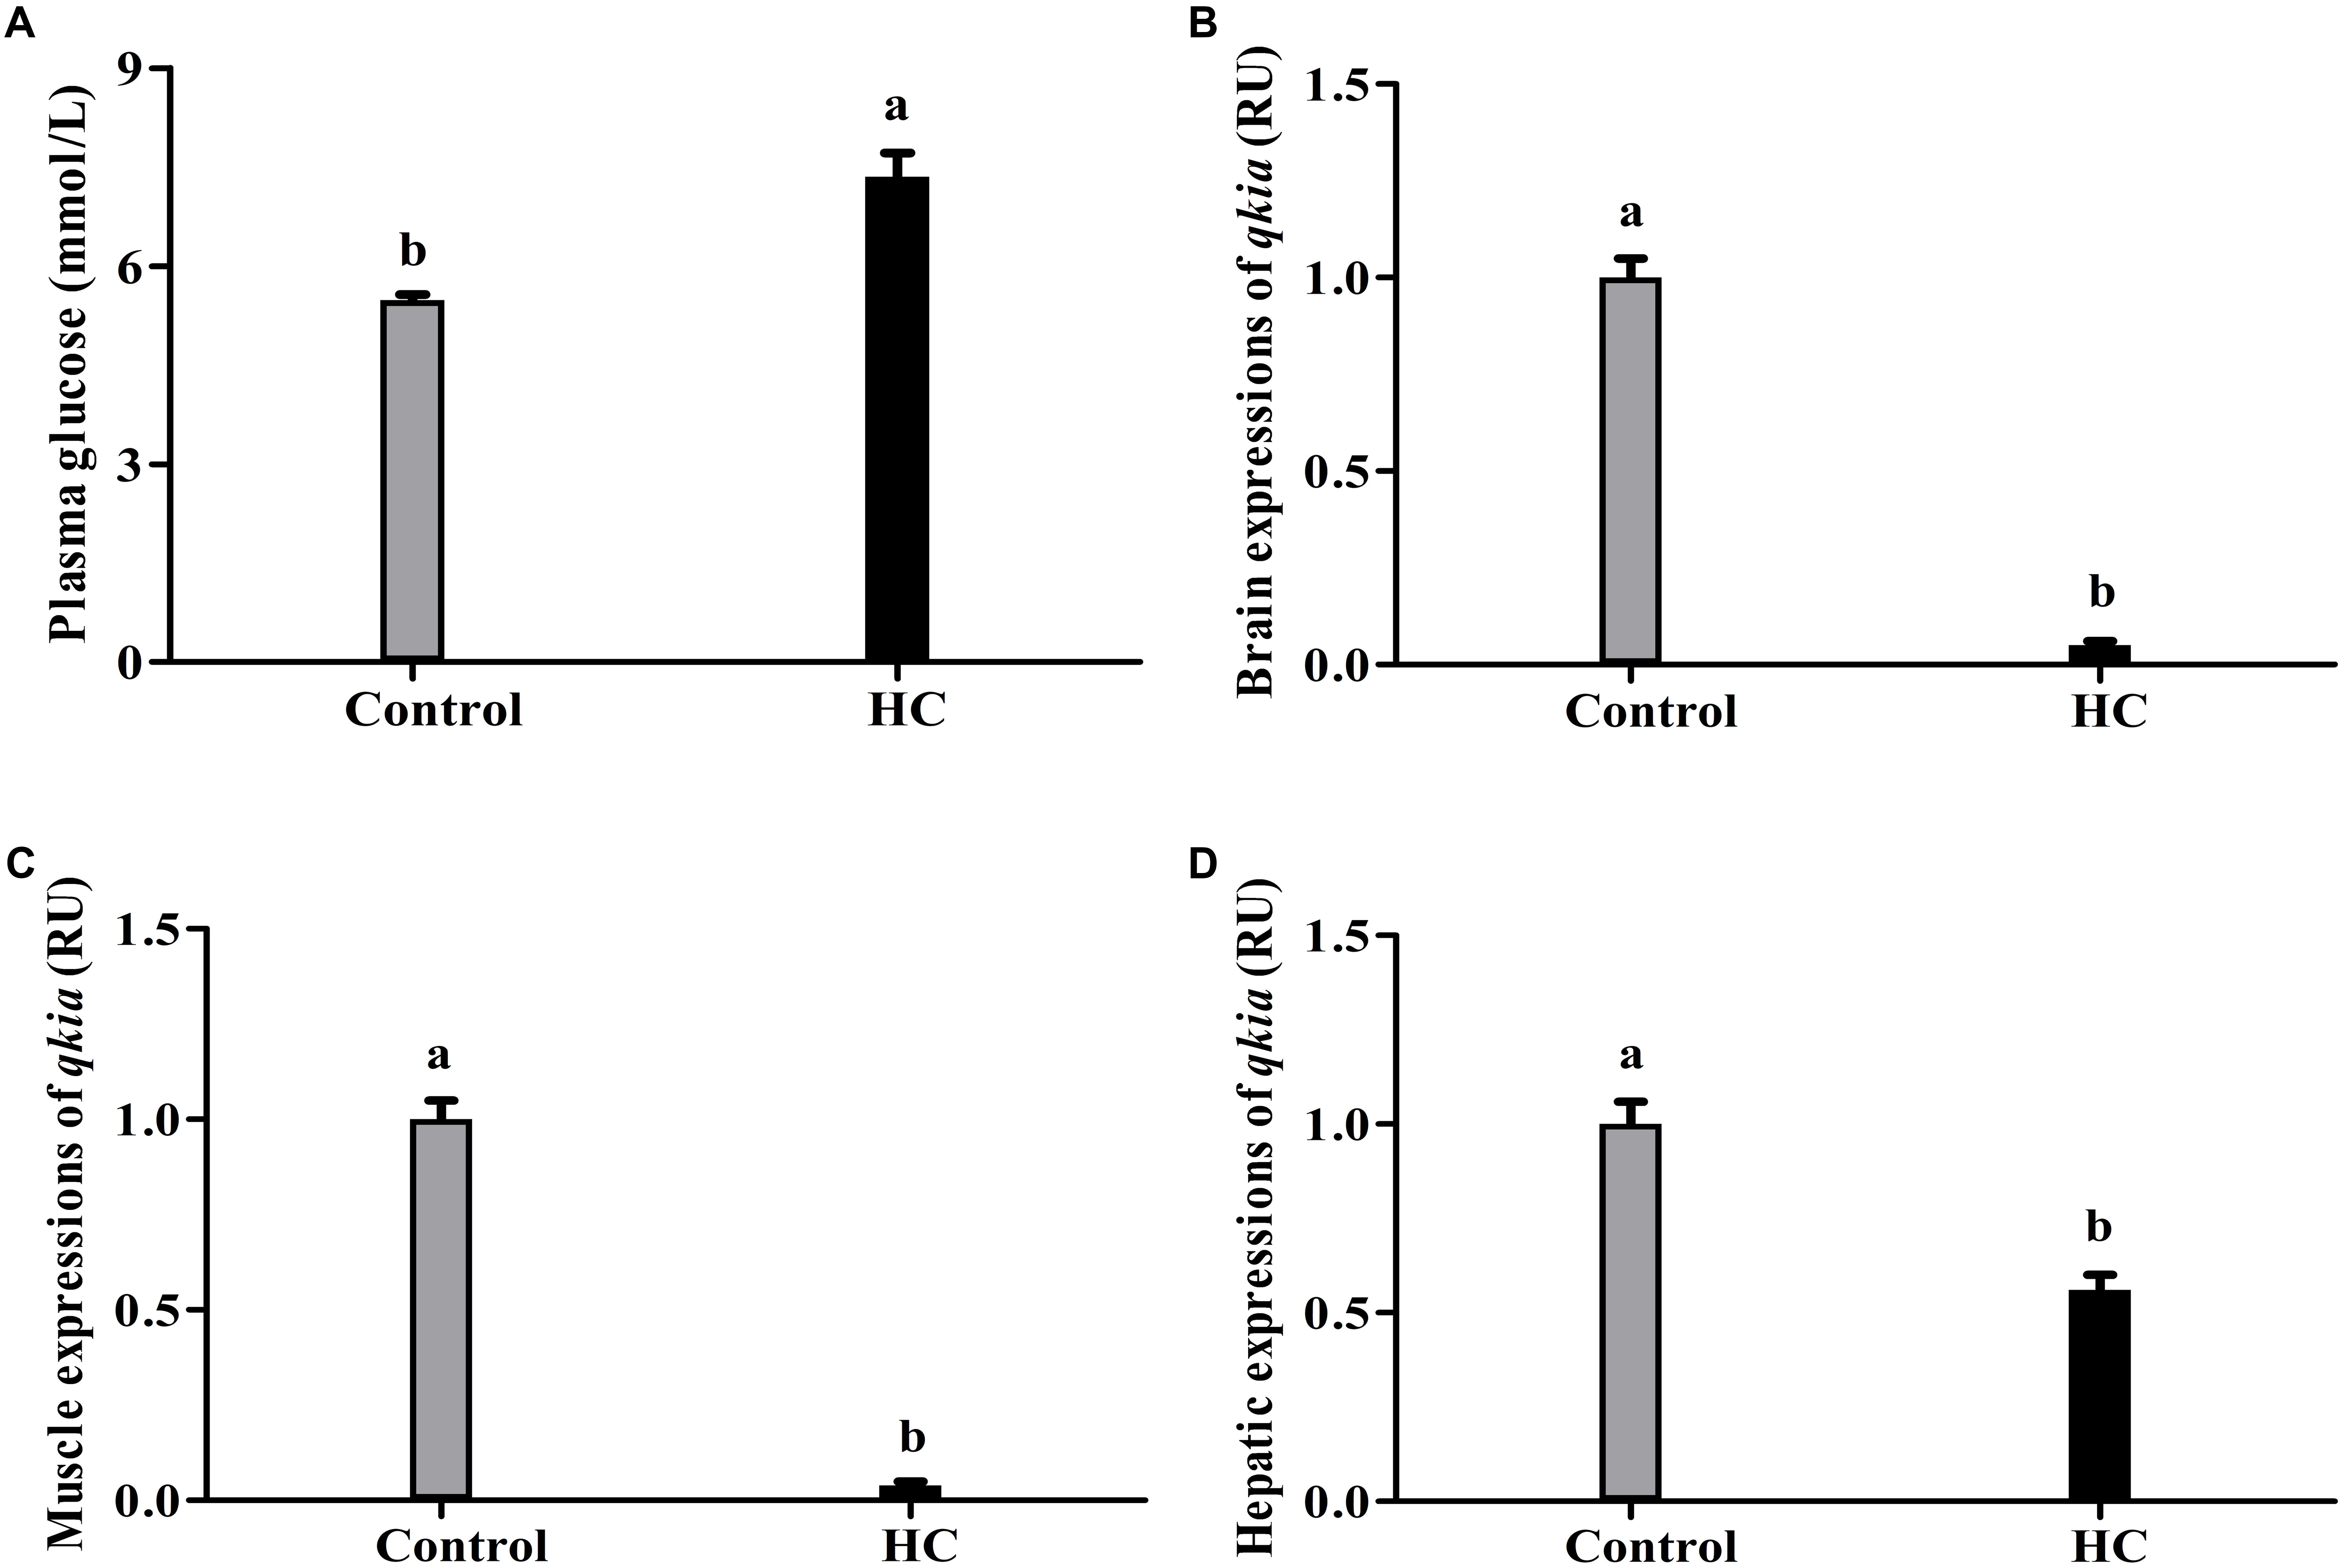
FIGURE 9. Plasma glucose levels (A) and relative expressions of qkia in the brain (B), muscle (C), and liver (D) of M. amblycephala subjected to different dietary carbohydrate levels. For mRNA expressions, data are referred to the value (Relative units, RU) obtained in the corresponding tissue of fish fed the control diet. Each data represents the mean of four replicates. Values with the different lower-case letters are significantly different among groups (P < 0.05).
Discussion
In this study, a full-length cDNA coding qkia was cloned from the liver of a herbivorous freshwater carp blunt snout bream. Based on the results of sequence alignments, the functional sites are all highly conserved in the species detected except for some minor AA changes. This high similarity strongly suggested that this sequence corresponded to the functional qkia. As for the STAR_dimer, the Thr51 and 61 (blunt snout bream numbering) is replaced by Asn51 and Ser61, respectively, in zebrafish. This difference might partly lead to the variations of the functions of qkia among different species, since the STAR_dimer participates in the binding of STAR proteins to bipartite RNA (Beuck et al., 2012), thus maintaining the normal function of qkia (Chen and Richard, 1998). For phosphorylation sites, the Ser 351 and Thr288 (blunt snout bream numbering) are replaced by Leu357 and Ser 289 (tilapia numbering) respectively, in other piscine species. These replacements might result in the large changes of the transcriptional activity of QKI among different species, since phosphorylation is an important post-translational modification of proteins, which can greatly affect their functions (Besant and Attwood, 2009). In addition, some minor AA differences were also observed in the SF1_like-KH between mammals and fish, as might also lead to the variations of the functions of qkia among different species. This was supported by the fact that, as a prevalent RNA binding domain, the SF1_like-KH could specifically recognize the intron branch point sequence in the pre-mRNA transcripts (Liu et al., 2001), as is closely involved in the regulation of the activity of RBPs (Zorn et al., 1997). Furthermore, a large difference was observed in the AA sequence of the Quaking_NLS. A total of 28 AA was characterized in the Quaking_NLS of fish (blunt snout bream for example), whereas only 7 were found in mouse and Drosophila (Wu et al., 1999). This might also result in the large variations of the transcriptional activity of qkia among different species, since the Quaking_NLS is the very C-terminal region of quaking proteins that is purported to be the nuclear localization signal (Lobbardi et al., 2011).
In M. amblycephala, the qkia mRNA was detected in all the organs/tissues examined. According to previous studies, QKI could participate in the post-transcriptional regulation of forkhead transcription factor 1 (Foxo1) (transcription factor of energy metabolism), thus playing an important role in the energy metabolism in various tissues and/or organs in mammals (Guo et al., 2014; Lu, 2014; Yu et al., 2014). In addition, a tissue-specific expression pattern of qkia was also detected. The predominant expression was found in brain followed by muscle and heart, as was similar to the results found in mammals and other piscine species (Ebersole et al., 1996; Tanaka et al., 1997; Kondo et al., 1999). This result was not surprising due to the fact that fish brain has high glucose utilization rates per unit mass (Washburn et al., 1992). In addition, previous studies showed that muscle is the main site of glucose uptake by glucose transporters (GLUTs), and heart also plays an important role in glucose uptake (Blasco et al., 1996; Deck et al., 2017). Hence, these findings probably suggested that qkia may also play an important role in the energy metabolism of fish. The remarkable expressions found in liver, spleen, and kidney were also justifiable, since (1) a previous study has showed that qki is closely involved in the regulation of hepatic energy metabolism in mice (Lu, 2014); (2) both spleen and kidney play an important role in the glucose metabolism of fish (Hall et al., 2009). In addition, the transcription of qkia was also detected in the eye, intestine and the mesenteric adipose tissue of M. amblycephala. This was quite different from that of mammals, who exhibited a relatively low mRNA level of qki in these tissues (Kondo et al., 1999). This difference might partly suggest the distinct mechanisms by which different animal species use glucose for energy purposes. Furthermore, the presence of qkia in gill was also reasonable, since gill plays a key role in maintaining the oxygen demand, which can regulate adenosine triphosphate (ATP) turnover, thus enhancing the oxygen-carrying capacity of blood (Wells et al., 1989). Together, these findings probably suggested that qkia may play a crucial role in the energy metabolism (especially the glucose metabolism) of fish. However, further studies are warranted to elucidate this.
In this study, the glucose load resulted in a drastically increased plasma glucose level with the highest value being gained at 1 h. Time to reach the highest glucose value in blunt snout bream was similar to that of several herbivorous and omnivorous species, such as tilapia Oreochromis niloticus × O. aureus (Lin et al., 1995) and common carp (Furuichi and Yone, 1981) receiving the same glucose dose, but was faster than that of most carnivorous fish like red sea bream Chrysophrys major, yellowtail Seriola quinqueradiata (Furuichi and Yone, 1981), European sea bass Dicentrarchus labrax (Enes et al., 2011), turbot Scophthalmus maximus, and snapper Pagrus auratus (Garcia-Riera and Hemre, 1996; Booth et al., 2006), which needed 2–3 h to reach the glucose peak. According to previous study, differences in timing required to obtain glucose peak was mainly ascribed to species differences although that of fish size and experimental conditions cannot be discarded (Legate et al., 2001; Moon, 2001; Polakof et al., 2012). In addition, time to clear the glucose load in blunt snout bream (4–6 h) was similar to that of omnivorous fish like tilapia (6 h) and common carp (5 h) (Furuichi and Yone, 1981; Chen et al., 2017), but was much faster than that of the carnivorous species (12–24 h) (Hemre et al., 1995; Booth et al., 2006; Enes et al., 2011). The results indicated that, being a herbivorous freshwater fish, blunt snout bream has a higher capacity to clear blood glucose compared with most carnivorous species. This may be ascribed to the fact that herbivorous fish have a higher glucose phosphorylation capacity in peripheral tissues (muscle and fat tissues) and a stronger suppression of hepatic gluconeogenesis (Kirchner et al., 2005; Polakof et al., 2012). Furthermore, plasma glucose levels of fish receiving saline solution slightly increased, as might be attributed to the handling stress caused by injection or the sampling procedures (Enes et al., 2012; Chen et al., 2017). It is also worth noting that significant difference was observed in plasma glucose levels at 4–24 h between the saline treatment and fish injected glucose. This might be ascribed to an enhancement of gluconeogenesis in fish in an attempt to maintain glucose homeostasis. Similar result was also found in white sea bream Diplodus sargus after a glucose load (Enes et al., 2012).
In the present study, the glucose load resulted in a remarkable down-regulation of qkia in the brain, liver, and muscle of fish. This probably suggested that qkia might play an important role in the glucose metabolism (especially the gluconeogenesis) of fish. This was supported by the fact that glucose administration generally induces an increase of plasma insulin levels, which significantly stimulates GLUTs expressions, and also increases the insulin-like growth factor-I (IGF-I) levels (Planas et al., 2000; Diaz et al., 2007, 2009; Enes et al., 2011). This consequently promotes glucose uptake, glycogen synthesis and lipogenesis, while depressing gluconeogenesis (Bouraoui et al., 2010; Enes et al., 2012). In addition, in this study, the glucose injection resulted in a prompt decrease of qkia expression in the liver and muscle during the first 1 h, which was much shorter than that (8 h) in the brain. This may be due to the fact that glucose injection usually leads to a prompt increase of liver glycogen by stimulating glycogen synthetase (GS) expressions (Hemre et al., 1991; Peres et al., 1999; Kamalam et al., 2017). Furthermore, the glucose administration also promptly enhanced the glucose phosphorylation capacity in muscle by increasing hexokinase (HK) activities (Kirchner et al., 2005). Unlikely, the brain of fish might perceive the glucose deriving from intraperitoneal injection slowly compared with the intraperitoneal tissues, leading to a delayed glucose-stimulated response. In addition, the brain of fish could meet its glucose demand through the breakdown of local glycogen independently of changes in circulating glucose levels, as might also lead to a delayed glucose response (Polakof et al., 2012). Furthermore, in this study, qkia expressions increased with the increasing sampling time after the initial decrease, as was in line with the results of plasma glucose levels observed in the GTT. This might be a metabolic adjustment of fish to keep normoglycemia through the enhancement of gluconeogenesis (Polakof et al., 2012). This was supported by the fact that qkia plays an important role in gluconeogenesis through the mediation of Foxo1 via post-transcriptional regulation (Yu et al., 2014). However, this was obtained in mammals. Whether this also holds true in aquatic species is still unknown, as warrants further studies. Furthermore, in terms of injection type, the qkia expression of fish receiving glucose was remarkably lower than that of the sham treatment. Generally, high exogenous glucose could enhance the glycolysis of fish, but inhibits the gluconeogenesis (Caseras et al., 2002; Kamalam et al., 2012). This again suggested that qkia might participate in the gluconeogenesis of fish.
In the present study, plasma glucose levels drastically decreased at 1 h after insulin administration. This may be due to the fact that insulin could promote glucose uptake by stimulating GLUT in peripheral tissues, and activates glycogen synthesis, but inhibits gluconeogenesis in fish (Sundby et al., 1991; Caruso and Sheridan, 2011). This inevitably led to the decrease of plasma glucose. In addition, time to reach the glucose minimum in blunt snout bream was faster than that of most carnivorous species (Jin et al., 2014, 2017; Deck et al., 2017), which required 3–9 h to attain the minimum value. This result might be ascribed to the facts that herbivorous fish has: (1) a higher capability of glycogen synthesis in muscle (Polakof et al., 2010); and (2) a stronger inhibition of hepatic gluconeogenesis than most carnivorous species (Navarro et al., 2006). In addition, plasma glucose returned to the baseline at 12 h after insulin administration. This was similar to the results obtained in gibel carp Carassis auratus gibelio (within 12 h) injected the same insulin dose (Jin et al., 2017), but was different with that of some carnivorous species like rainbow trout (Capilla et al., 2002), which required more than 24 h. After glucagon administration, the peak value of plasma glucose was obtained at 4 h. This was similar to that of common carp (Sugita et al., 2001), rainbow trout (Magnoni et al., 2001) and Japanese eel Anguilla japonica (Inui and Yokote, 1977), which required 2–3 h to reach the glucose peak after glucagon injection. This result may be explained by the fact that glucagon could stimulate glucose production of liver by binding glucagon receptor and activating its intracellular signal pathways (Chow et al., 2004; Yan et al., 2016), thus inevitably resulted in an increase of plasma glucose. Then, the glucose levels gradually returned to the normal value at 12 h, as was similar to the results obtained in Japanese eel (Inui and Yokote, 1977). In addition, in terms of injection type, plasma glucose level of fish injected with glucagon was significantly higher than that of fish received insulin. This might be due to the fact that glucagon is quite effective in elevating the concentration of glucose in the blood by promoting gluconeogenesis and glycogenolysis (Magnoni et al., 2001). Unlikely, insulin exerts opposite effects on circulating glucose levels through the stimulation of glycogenolysis as well as lipogenesis and concomitantly an inhibition of gluconeogenesis (Cheng et al., 2010).
In this study, both insulin and glucagon administration resulted in a prompt change of qkia at the transcriptional level in brain, muscle, and liver, indicating that qkia is quite sensitive to exogenous insulin and glucagon. The insulin injection resulted in a prompt decrease of qkia expression in the brain, muscle and liver, whereas the opposite was true after glucagon load. This suggested that qkia might participate in the gluconeogenesis and/or lipogenesis of fish, since insulin could depress the gluconeogenesis, glycogenolysis and lipolysis of fish, while glucagon is the major counterpart to insulin (Plisetskaya and Mommsen, 1996). In addition, insulin injection led to an immediate decrease of qkia expression in liver during the first 1 h, which was much shorter than that in the brain and muscle. This may be due to the fact that the muscle and brain of fish might be is less sensitive to exogenous insulin than liver, thus leading to a delayed insulin-stimulated response in both tissues (Caruso and Sheridan, 2011). After the initial decrease, qkia expressions gradually increased with increasing sampling time after insulin load. However, the opposite was true after glucagon administration. This again suggested that qkia might be closely involved in the gluconeogenesis of fish. Furthermore, in terms of injection type, the qkia expression of fish receiving insulin was lower than that of fish subjected to the glucagon load. This again reinforced the assumption that qkia might participate in the gluconeogenesis and/or lipogenesis of fish. This was supported by the following facts that (1) insulin could trigger a rapid and large glucose uptake by peripheral tissues, activating glycogen synthesis and lipogenesis, while suppressing gluconeogenesis (Polakof et al., 2010); and (2) glucagon could stimulate glycogenolysis, gluconeogenesis, and lipolysis (Magnoni et al., 2001).
In the present study, fish fed high-carbohydrate diets obtained relatively high plasma glucose levels. This indicated that high-carbohydrate intake induced a hyperglycemia state of blunt snout bream. In addition, the qkia expressions in brain, muscle, and liver were all significantly down-regulated in fed high carbohydrate diets. This was in line with the fact that high-carbohydrate feeding usually depresses the gluconeogenic capability of fish, as again suggested that qkia might play an important role in the glucose metabolism (especially the gluconeogenesis) of fish. According previous studies, the hyperglycemia state in fish induced by high-carbohydrate intake could stimulate insulin synthesis and release (Kamalam et al., 2017; Xu et al., 2018). This might inevitably result in the increased glucose disposal in peripheral tissue and the enhanced glycolysis and glycogenesis coupled with the suppression of gluconeogenesis (Polakof et al., 2012). In addition, excessive carbohydrate may be converted into lipids by enhancing the lipogenesis of blunt snout bream but depress the gluconeogenesis and glycogenolysis (Prisingkorn et al., 2017; Xu et al., 2018). However, further studies concerning the potential mechanisms by which qkia regulate the glucose metabolism of fish are needed to elucidate this.
Conclusion
The present data suggested that the qkia gene of blunt snout bream shared a high similarity with that of the other vertebrates with the functions sites highly conserved. A graded tissue-specific expression pattern of qkia was also observed with high abundance observed in brain, muscle, and heart. Glucose and insulin administration, as well as high-carbohydrate feeding, remarkably down-regulated the transcriptions of qkia in brain, muscle, and liver, whereas the opposite was true after the glucagon load. These findings suggested that qkia might play an important role in the glucose metabolism of fish. However, further studies exploring the potential mechanisms are warranted to elucidate this.
Author Contributions
X-FL and W-BL conceived and designed the experiment. CX and D-DZ analyzed the data. X-FL, H-JS, CX, B-KW, and LZ performed the experiments and contributed reagents/materials/analysis tools. X-FL and H-JS wrote the paper. All authors read and approved the final version of the manuscript.
Funding
This research was funded by the National Natural Science Foundation of China (31602173) and the Fundamental Research Funds for the Central Universities in China (KYZ201645).
Conflict of Interest Statement
The authors declare that the research was conducted in the absence of any commercial or financial relationships that could be construed as a potential conflict of interest.
Supplementary Material
The Supplementary Material for this article can be found online at: https://www.frontiersin.org/articles/10.3389/fphys.2018.00434/full#supplementary-material
Footnotes
- ^ http://www.ncbi.nlm.nih.gov/gorf/gorf.html
- ^ https://www.ncbi.nlm.nih.gov/Structure/cdd/wrpsb.cgi
- ^ http://sable.cchmc.org/
- ^ http://swissmodel.expasy.org/
References
Albalat, A., Gutiérrez, J., and Navarro, I. (2005). Regulation of lipolysis in isolated adipocytes of rainbow trout (Oncorhynchus mykiss): the role of insulin and glucagon. Comp. Biochem. Physiol. A 142, 347–354. doi: 10.1016/j.cbpa.2005.08.006
Artzt, K., and Wu, J. I. (2010). “STAR trek: an introduction to STAR family proteins and review of quaking (QKI),” in Post-Transcriptional Regulation by STAR Proteins: Control of RNA Metabolism in Development and Disease, eds T. Volk and K. Artzt (Texas, TX: Landes Bioscience), 1–24. doi: 10.1007/978-1-4419-7005-3_1
Asadi, F., Hallajian, A., Asadian, P., Shahriari, A., and Pourkabir, M. (2009). Serum lipid, free fatty acid, and proteins in juvenile sturgeons: Acipenser persicus and Acipenser stellatus. Comp. Clin. Pathol. 18, 287–289. doi: 10.1007/s00580-008-0797-0
Besant, P. G., and Attwood, P. V. (2009). Detection and analysis of protein histidine phosphorylation. Mol. Cell. Biochem. 329, 93–106. doi: 10.1007/s11010-009-0117-2
Beuck, C., Qu, S., Fagg, W. S., Manuel Ares, J., and Williamson, J. R. (2012). Structural analysis of the quaking homodimerization interface. J. Mol. Biol. 423, 766–781. doi: 10.1016/j.jmb.2012.08.027
Blasco, J., Fernàndez-Borràs, J., Marimon, I., and Requena, A. (1996). Plasma glucose kinetics and tissue uptake in brown trout in vivo: effect of an intravascular glucose load. J. Comp. Physiol. B 165, 534–541. doi: 10.1007/BF00387514
Booth, M. A., Anderson, A. J., and Allan, G. L. (2006). Investigation of the nutritional requirements of Australian snapper Pagrus auratus (Bloch & Schneider 1801): digestibility of gelatinized wheat starch and clearance of an intra-peritoneal injection of D-glucose. Aquac. Res. 37, 975–985. doi: 10.1111/j.1365-2109.2006.01516.x
Bouraoui, L., Capilla, E., Gutiérrez, J., and Navarro, I. (2010). Insulin and insulin-like growth factor I signaling pathways in rainbow trout (Oncorhynchus mykiss) during adipogenesis and their implication in glucose uptake. Am. J. Physiol. Regul. Integr. Comp. Physiol. 299, R33–R41. doi: 10.1152/ajpregu.00457.2009
Capilla, E., Dìaz, M., Gutiérrez, J., and Planas, J. V. (2002). Physiological regulation of the expression of a GLUT4 homolog in fish skeletal muscle. Am. J. Physiol. Endocrinol. Metab. 283, E44–E49. doi: 10.1152/ajpendo.00065.2002
Caruso, M. A., and Sheridan, M. A. (2011). New insights into the signaling system and function of insulin in fish. Gen. Comp. Endocr. 173, 227–247. doi: 10.1016/j.ygcen.2011.06.014
Caseras, A., Metón, I., Vives, C., Egea, M., Fernández, F., and Baanante, I. V. (2002). Nutritional regulation of glucose-6-phosphatase gene expression in liver of the gilthead sea bream (Sparus aurata). Br. J. Nutr. 88, 607–614. doi: 10.1079/BJN2002701
Chen, T., and Richard, S. (1998). Structure-function analysis of Qk1: a lethal point mutation in mouse quaking prevents homodimerization. Mol. Cell. Biol. 18, 4863–4871. doi: 10.1128/MCB.18.8.4863
Chen, Y. J., Wang, X. Y., Pi, R. R., Feng, J. Y., Luo, L., and Lin, S. M. (2017). Preproinsulin expression, insulin release, and hepatic glucose metabolism after a glucose load in the omnivorous GIFT tilapia Oreochromis niloticus. Aquaculture 482, 183–192. doi: 10.1016/j.aquaculture.2017.10.001
Cheng, Z., Tseng, Y., and White, M. F. (2010). Insulin signaling meets mitochondria in metabolism. Trends Endocrinol. Metab. 21, 589–598. doi: 10.1016/j.tem.2010.06.005
Chow, B. K., Moon, T. W., Hoo, R. L., Yeung, C. M., Müller, M., and Christos, P. J. (2004). Identification and characterization of a glucagon receptor from the goldfish Carassius auratus: implications for the evolution of the ligand specificity of glucagon receptors in vertebrates. Endocrinology 145, 3273–3288. doi: 10.1210/en.2003-0597
Craig, P. M., Trudeau, V. L., and Moon, T. W. (2014). Profiling hepatic microRNAs in zebrafish: fluoxetine exposure mimics a fasting response that targets AMP-activated protein kinase (AMPK). PLoS One 9:e95351. doi: 10.1371/journal.pone.0095351
Deck, C. A., Gary, A. W., and Walsh, P. J. (2017). Effects of glucose and insulin administration on glucose transporter expression in the North Pacific spiny dogfish (Squalus suckleyi). Gen. Comp. Endocr. 247, 46–52. doi: 10.1016/j.ygcen.2017.01.016
Diaz, M., Capilla, E., and Planas, J. V. (2007). Physiological regulation of glucose transporter (GLUT4) protein content in brown trout (Salmo trutta) skeletal muscle. J. Exp. Biol. 210, 2346–2351. doi: 10.1242/jeb.002857
Diaz, M., Vraskou, Y., Gutierrez, J., and Planas, J. V. (2009). Expression of rainbow trout glucose transporters GLUT1 and GLUT4 during in vitro muscle cell differentiation and regulation by insulin and IGF-I. Am. J. Physiol. Regul. Integr. Comp. Physiol. 296, R794–R800. doi: 10.1152/ajpregu.90673.2008
Ebersole, T. A., Chen, Q., Justice, M. J., and Artzt, K. (1996). The quaking gene product necessary in embryogenesis and myelination combines features of RNA binding and signal transduction proteins. Nat. Genet. 12, 260–265. doi: 10.1038/ng0396-260
Enes, P., Panserat, S., Kaushik, S., and Oliva-Teles, A. (2009). Nutritional regulation of hepatic glucose metabolism in fish. Fish Physiol. Biochem. 35, 519–539. doi: 10.1007/s10695-008-9259-5
Enes, P., Peres, H., Pousao-Ferreira, P., Sanchez-Gurmaches, J., Navarro, I., Gutiérrez, J., et al. (2012). Glycemic and insulin responses in white sea bream Diplodus sargus, after intraperitoneal administration of glucose. Fish Physiol. Biochem. 38, 645–652. doi: 10.1007/s10695-011-9546-4
Enes, P., Peres, H., Sanchez-Gurmaches, J., Navarro, I., Gutiérrez, J., and Oliva-Teles, A. (2011). Insulin and IGF-I response to a glucose load in European sea bass (Dicentrarchus labrax) juveniles. Aquaculture 315, 321–326. doi: 10.1016/j.aquaculture.2011.02.042
Furuichi, M., and Yone, Y. (1981). Change of blood sugar and plasma insulin levels of fishes in glucose tolerance test. Bull. Jpn. Soc. Sci. Fish. 47, 761–764. doi: 10.2331/suisan.47.761
Galarneau, A., and Richard, S. (2005). Target RNA motif and target mRNA of the Quaking STAR protein. Nat. Struct. Mol. Biol. 12, 691–698. doi: 10.1038/nsmb963
Garcia-Riera, M. P., and Hemre, G. I. (1996). Glucose tolerance in turbot, Scophthalmus maximus (L.). Aquac. Nutr. 2, 117–120. doi: 10.1111/j.1365-2095.1996.tb00018.x
Guo, W., Jiang, T., Lian, C., Wang, H., Zheng, Q., and Ma, H. (2014). QKI deficiency promotes FoxO1 mediated nitrosative stress and endoplasmic reticulum stress contributing to increased vulnerability to ischemic injury in diabetic heart. J. Mol. Cell. Cardiol. 75, 131–140. doi: 10.1016/j.yjmcc.2014.07.010
Hall, J. R., Short, C. E., Petersen, L. H., Stacey, J., Gamperl, A. K., and Driedzic, W. R. (2009). Expression levels of genes associated with oxygen utilization, glucose transport and glucose phosphorylation in hypoxia exposed Atlantic cod (Gadus morhua). Comp. Biochem. Physiol. D 4, 128–138. doi: 10.1016/j.cbd.2008.12.007
Hemre, G. I., Lambertsen, G., and Lie, Ø. (1991). The effect of dietary carbohydrate on the stress response in cod (Gadus morhua). Aquaculture 95, 319–328. doi: 10.1016/0044-8486(91)90097-Q
Hemre, G. I., Mommsen, T. P., and Krogdahl, A. (2002). Carbohydrates in fish nutrition: effects on growth, glucose metabolism and hepatic enzymes. Aquac. Nutr. 8, 175–194. doi: 10.1046/j.1365-2095.2002.00200.x
Hemre, G. I., Sandnes, K., Lie,Ø., and Waagbø, R. (1995). Blood chemistry and organ nutrient composition in Atlantic salmon, Salmo salar L., fed graded amounts of wheat starch. Aquac. Nutr. 1, 37–42. doi: 10.1111/j.1365-2095.1995.tb00033.x
Inui, Y., and Yokote, M. (1977). Effects of glucagon on amino acid metabolism in Japanese eels, Anguilla japonica. Gen. Comp. Endocrinol. 33, 167–173. doi: 10.1016/0016-6480(77)90240-4
Jin, J., Médale, F., Kamalam, B. S., Aguirre, P., Véron, V., and Panserat, S. (2014). Comparison of glucose and lipid metabolic gene expressions between fat and lean lines of rainbow trout after a glucose load. PLoS One 9:e105548. doi: 10.1371/journal.pone.0105548
Jin, J., Zhu, X., Han, D., Yang, Y., Liu, H., and Xie, S. (2017). Different regulation of insulin on glucose and lipid metabolism in 2 strains of Gibel carp. Gen. Comp. Endocr. 246, 363–371. doi: 10.1016/j.ygcen.2017.01.012
Kamalam, B. S., Medale, F., Kaushik, S., Polakof, S., Skiba-Cassy, S., and Panserat, S. (2012). Regulation of metabolism by dietary carbohydrates in two lines of rainbow trout divergently selected for muscle fat content. J. Exp. Biol. 215, 2567–2578. doi: 10.1242/jeb.070581
Kamalam, B. S., Medale, F., and Panserat, S. (2017). Utilisation of dietary carbohydrates in farmed fishes: new insights on influencing factors, biological limitations and future strategies. Aquaculture 467, 3–27. doi: 10.1016/j.aquaculture.2016.02.007
Kirchner, S., Seixas, P., Kaushik, S., and Panserat, S. (2005). Effects of low protein intake on extra-hepatic gluconeogenic enzyme expression and peripheral glucose phosphorylation in rainbow trout (Oncorhynchus mykiss). Comp. Biochem. Physiol. B 140, 333–340. doi: 10.1016/j.cbpc.2004.10.019
Klempan, T. A., Ernst, C., Deleva, V., Labonte, B., and Turecki, G. (2009). Characterization of qki gene expression, genetics, and epigenetics in suicide victims with major depressive disorder. Biol. Psychiat. 66, 824–831. doi: 10.1016/j.biopsych.2009.05.010
Kondo, T., Furuta, T., Mitsunaga, K., Ebersole, T. A., Shichiri, M., and Wu, J. (1999). Genomic organization and expression analysis of the mouse qki locus. Mamm. Genome 10, 662–669. doi: 10.1007/s0033599010
Legate, N. J., Bonen, A., and Moon, T. W. (2001). Glucose tolerance and peripheral glucose utilization in rainbow trout (Oncorhynchus mykiss), American eel (Anguilla rostrata), and black bullhead catfish (Ameiurus melas). Gen. Comp. Endocr. 122, 48–59. doi: 10.1006/gcen.2001.7620
Li, X. F., Lu, K. L., Liu, W. B., Jiang, G. Z., and Xu, W. N. (2014). Effects of dietary lipid and carbohydrate and their interaction on growth performance and body composition of juvenile blunt snout bream, Megalobrama amblycephala. Isr. J. Aquac. 66, 931–937.
Li, X. F., Wang, Y., Liu, W. B., Jiang, G. Z., and Zhu, J. (2013). Effects of dietary carbohydrate/lipid ratios on growth performance, body composition and glucose metabolism of fingerling blunt snout bream Megalobrama amblycephala. Aquac. Nutr. 19, 701–708. doi: 10.1111/anu.12017
Li, X. F., Xu, C., Zhang, D. D., Jiang, G. Z., and Liu, W. B. (2016). Molecular characterization and expression analysis of glucokinase from herbivorous fish Megalobrama amblycephala, subjected to a glucose load after the adaption to dietary carbohydrate levels. Aquaculture 459, 89–98. doi: 10.1016/j.aquaculture.2016.03.035
Lin, J. H., Ho, L. T., and Shiau, S. Y. (1995). Plasma glucose and insulin concentration in tilapia after oral administration of glucose and starch. Fish. Sci. 61, 986–988. doi: 10.2331/fishsci.61.986
Liu, Z., Luyten, I., Bottomley, M. J., Messias, A. C., Houngninou-Molango, S., Sprangers, R., et al. (2001). Structural basis for recognition of the intron branch site RNA by splicing factor 1. Science 294, 1098–1102. doi: 10.1126/science.1064719
Livak, K. J., and Schmittgen, T. D. (2001). Analysis of relative gene expression data using real-time quantitative PCR and the 2ΔΔCT method. Methods 25, 402–408. doi: 10.1006/meth.2001.1262
Lobbardi, R., Lambert, G., Zhao, J., Geisler, R., Kim, H. R., and Rosa, F. M. (2011). Fine-tuning of Hh signaling by the RNA-binding protein Quaking to control muscle development. Development 138, 1783–1794. doi: 10.1242/dev.059121
Lu, X. Z. (2014). Deacetylation of RNA Binding Protein QKI by SIRT1 Under Fasting Conditions Controls the Adaptive Hepatic Energy Metabolism. Ph.D. thesis, The Fourth Military Medical University, Xi’an.
Magnoni, L. J., Míguez, J. M., and Soengas, J. L. (2001). Glucagon effects on brain carbohydrate and ketone body metabolism of rainbow trout. J. Exp. Zool. Part. A 290, 662–671. doi: 10.1002/jez.1117
Miao, L. H., Lin, Y., Pan, W. J., Huang, X., Ge, X. P., and Ren, M. C. (2017). Identification of differentially expressed micrornas Associate with glucose metabolism in different organs of blunt snout bream (Megalobrama amblycephala). Int. J. Mol. Sci. 18, 1161–1176. doi: 10.3390/ijms18061161
Moon, T. W. (2001). Glucose intolerance in teleost fish: fact or fiction? Comp. Biochem. Physiol. B 129, 243–249. doi: 10.1016/S1096-4959(01)00316-5
Navarro, I., Capilla, E., Castillo, J., Albalat, A., Diaz, M., and Gallardo, M. A. (2006). Insulin metabolic effects in fish tissues. Endocrinology 1, 15–45. doi: 10.1201/b10745-4
Peres, M. H., Goncalves, P., and Oliva-Teles, A. (1999). Glucose tolerance in gilthead seabream (Sparus aurata) and European sea bass (Dicentrarchus labrax). Aquaculture 179, 415–423. doi: 10.1016/S0044-8486(99)00175-1
Planas, J. V., Méndez, E., Baños, N., Capilla, E., Navarro, I., and Gutiérrez, J. (2000). Insulin and IGF-I receptors in trout adipose tissue are physiologically regulated by circulating hormone levels. J. Exp. Biol. 203, 1153–1159.
Plisetskaya, E. M., and Mommsen, T. P. (1996). Glucagon and glucagon-like peptides in fishes. Int. Rev. Cytol. 168, 187–257. doi: 10.1016/S0074-7696(08)60885-2
Polakof, S., Panserat, S., Soengas, J. L., and Moon, T. W. (2012). Glucose metabolism in fish: a review. J. Comp. Physiol. B 182, 1015–1045. doi: 10.1007/s00360-012-0658-7
Polakof, S., Skibacassy, S., Choubert, G., and Panserat, S. (2010). Insulin-induced hypoglycaemia is co-ordinately regulated by liver and muscle during acute and chronic insulin stimulation in rainbow trout (Oncorhynchus mykiss). J. Exp. Biol. 213, 1443–1452. doi: 10.1242/jeb.037689
Prathomya, P., Prisingkorn, W., Jakovliæ, I., Deng, F. Y., Zhao, Y. H., and Wang, W. M. (2017). 1H NMR-based metabolomics approach reveals metabolic alterations in response to dietary imbalances in Megalobrama amblycephala. Metabolomics 13:17. doi: 10.1007/s11306-016-1158-7
Prisingkorn, W., Prathomya, P., Jakovliæ, I., Liu, H., Zhao, Y. H., and Wang, W. M. (2017). Transcriptomics, metabolomics and histology indicate that high-carbohydrate diet negatively affects the liver health of blunt snout bream (Megalobrama amblycephala). BMC Genomics 18:856. doi: 10.1186/s12864-017-4246-9
Radomska, K. J., Sager, J., Farnsworth, B., TellgrenRoth,Å., Tuveri, G., and Peuckert, C. (2016). Characterization and expression of the zebrafish qki paralogs. PLoS One 11:e146155. doi: 10.1371/journal.pone.0146155
Sugita, T., Shimeno, S., Ohkubo, Y., Hosokawa, H., and Masumoto, T. (2001). Response of enzyme activities and metabolic intermediate concentrations to glucagon administration in hepatopancreas and muscle of carp. Fish. Sci. 67, 157–162. doi: 10.1046/j.1444-2906.2001.00212.x
Sundby, D. A., Eliassen, K., Refstie, T., and Plisetskaya, E. M. (1991). Plasma levels of insulin, glucagon and glucagon-like peptide in salmonids of different weights. Fish Physiol. Biochem. 9, 223–230. doi: 10.1007/BF02265143
Tanaka, H., Abe, K., and Kim, C. H. (1997). Cloning and expression of the quaking gene in the zebrafish embryo. Mech. Dev. 69, 209–213. doi: 10.1016/S0168-9525(97)01269-9
Vernet, C., and Artzt, K. (1997). STAR, a gene family involved in signal transduction and activation of RNA. Trends Genet. 13, 479–484. doi: 10.1016/S0168-9525(97)01269-9
Washburn, B. S., Bruss, M. L., Avery, E. H., and Freedland, R. A. (1992). Effects of estrogen on whole animal and tissue glucose use in female and male rainbow trout. Am. J. Physiol. Regul. Integr. Comp. Physiol. 263, 1241–1247. doi: 10.1152/ajpregu.1992.263.6.R1241
Wells, R. M. G., Grigg, G. C., Beard, L. A., and Summers, G. (1989). Hypoxic responses in a fish from a stable environment: blood oxygen transport in the Antarctic fish Pagothenia borchgrevinki. J. Exp. Biol. 141, 97–111.
Wilson, R. P. (1994). Utilization of dietary carbohydrate by fish. Aquaculture 124, 67–80. doi: 10.1016/0044-8486(94)90363-8
Wu, J., Zhou, L., Tonissen, K., Tee, R., and Artzt, K. (1999). The QuakingI-5 protein (QKI-5) has a novel nuclear localization signal and shuttles between the nucleus and the cytoplasm. J. Biol. Chem. 274, 29202–29210. doi: 10.1074/jbc.274.41.29202
Xu, C., Liu, W. B., Zhang, D. D., Cao, X. F., Shi, H. J., and Li, X. F. (2018). Interactions between dietary carbohydrate and metformin: implications on energy sensing, insulin signaling pathway, glycolipid metabolism and glucose tolerance in blunt snout bream Megalobrama amblycephala. Aquaculture 483, 183–195. doi: 10.1016/j.aquaculture.2017.10.022
Yan, A., Chen, T., Chen, S., Tang, D., Liu, F., and Jiang, X. (2016). Signal transduction mechanism for glucagon-induced leptin gene expression in goldfish liver. Int. J. Biol. Sci. 12, 1544–1554. doi: 10.7150/ijbs.16612
Yu, F., Jin, L., Yang, G., Ji, L., Wang, F., and Lu, Z. (2014). Post-transcriptional repression of FOXO1 by QKI results in low levels of FOXO1 expression in breast cancer cells. Oncol. Rep. 31, 1459–1465. doi: 10.3892/or.2013.2957
Zhang, J., Wei, X. L., Chen, L. P., Chen, N., Li, Y. H., Wang, W. M., et al. (2013). Sequence analysis and expression differentiation of chemokine receptor CXCR4b, among three populations of Megalobrama amblycephala. Dev. Comp. Immunol. 40, 195–201. doi: 10.1016/j.dci.2013.01.011
Keywords: RNA-binding protein, quaking-a, gene cloning, transcriptional analysis, glucose metabolism, Megalobrama amblycephala
Citation: Shi H-J, Liu W-B, Xu C, Zhang D-D, Wang B-K, Zhang L and Li X-F (2018) Molecular Characterization of the RNA-Binding Protein Quaking-a in Megalobrama amblycephala: Response to High-Carbohydrate Feeding and Glucose/Insulin/Glucagon Treatment. Front. Physiol. 9:434. doi: 10.3389/fphys.2018.00434
Received: 21 January 2018; Accepted: 06 April 2018;
Published: 24 April 2018.
Edited by:
Nour Eissa, University of Manitoba, CanadaReviewed by:
Ivan Viegas, University of Coimbra, PortugalTiziano Verri, University of Salento, Italy
Alexssandro Geferson Becker, Universidade Federal do Paraná, Brazil
Copyright © 2018 Shi, Liu, Xu, Zhang, Wang, Zhang and Li. This is an open-access article distributed under the terms of the Creative Commons Attribution License (CC BY). The use, distribution or reproduction in other forums is permitted, provided the original author(s) and the copyright owner are credited and that the original publication in this journal is cited, in accordance with accepted academic practice. No use, distribution or reproduction is permitted which does not comply with these terms.
*Correspondence: Xiang-Fei Li, xfli@njau.edu.cn